uniaxial compressive response and constitutive modeling of … · 2017-08-27 · uniaxial...
TRANSCRIPT

Uniaxial Compressive Response and Constitutive Modelingof Selected Polymers Over a Wide Range of Strain Rates
Kenji Nakai • Takashi Yokoyama
Received: 16 October 2014 / Accepted: 2 January 2015 / Published online: 21 January 2015
� Society for Experimental Mechanics, Inc 2015
Abstract The present work deals with constitutive
modeling of the compressive stress–strain response of
selected polymers at strain rates from 10-3 to nearly
103 s-1. Six different commercially available extruded
polymers—ABS, HDPE, PC, POM, PP and PVC—are
tested at room temperature. Cylindrical specimens with a
slenderness ratio (=length/diameter) of 0.5 are used in high
strain-rate tests, and those with the slenderness ratios of 1.0
and 2.0 are used in low and intermediate strain-rate tests.
High strain-rate compressive stress–strain loops up to a
strain of nearly 0.08 are obtained on a standard split
Hopkinson pressure bar. Low and intermediate strain-rate
compressive ones are measured on an Instron testing
machine. By fitting experimental loading stress–strain data
to a modified Ramberg–Osgood equation, material
parameters are uniquely determined using a linear least-
squares procedure. Experimental results indicate that all
polymers tested exhibit intrinsic dynamic viscoelastic–
plastic characteristics and a higher elastic after-effect fol-
lowing complete unloading. It is shown that the modified
Ramberg–Osgood constitutive model is appropriate for
describing the monotonic loading compressive stress–strain
relations of the three semi-crystalline polymers over a wide
range of strain rates. The advantages and limitations of the
constitutive model are also discussed.
Keywords Compressive stress–strain � Hopkinson bar �Low mechanical impedance � Modified Ramberg–Osgood
model � Polymers � Strain rate � Viscoelastic–plastic
behavior
Introduction
Polymeric materials with low mechanical impedance have
been extensively used as structural materials for aircraft,
automotive, mechanical and electronic components, mainly
because of higher specific strength as well as higher corro-
sion resistance. These components are often subjected to
dynamic loading in service environments. It is, therefore,
essential to obtain the high strain-rate response of polymers.
To date, many attempts have been made to characterize the
impact behavior of thermoplastic (amorphous and semi-
crystalline) and thermoset polymers using various tech-
niques. Many workers [1–4] evaluated the impact strength
and fracture toughness of several polymers by a Charpy or
Izod test. Nevertheless, impact stress–strain curves cannot be
achieved with these test methods. The impact compressive
[5–29], tensile [8, 14, 16, 30–35] and torsional [32, 36]
stress–strain properties of various polymers were accurately
determined using a classic [37] or modified split Hopkinson
pressure bar (SHPB). The effects of strain rate and temper-
ature on stress–strain characteristics of various polymers
were examined using a drop-weight apparatus [10, 18, 38–
41] and a SHPB [18–20, 31]. Briscoe and Hutchings [39],
and Rae et al. [42] evaluated flow stresses of HDPE and
PEEK at very high strain rates of nearly 104 s-1 under
temperatures of 20 and 100 �C in Taylor tests. Temperature
rise in thermoplastic polymers (PA–66, PC, PMMA, PP and
PVC) and thermoset polymer (Epon 862/W epoxy) during
high-rate deformation was measured using either an infrared
detector system [14, 15, 22] or a thermocouple [7, 29]. More
recently, Furmanski et al. [43] have developed a modified
Taylor test method for studying higher strain-rate and larger
strain response of four different polymers (HDPE, PCTFE,
Polyurea and PTFE) in tension. Millett and Bourne [44, 45]
applied a plate-impact technique for measuring the Hugoniot
K. Nakai (&) � T. Yokoyama
Department of Mechanical Engineering, Okayama University of
Science, 1-1 Ridai-cho, Kitaku, Okayama 700-0005, Japan
e-mail: [email protected]
123
J. dynamic behavior mater. (2015) 1:15–27
DOI 10.1007/s40870-015-0003-9
of PMMA and three other polymers (PE, PP and PS) under
shock loading. To accurately represent the high strain-rate
stress–strain curves for polymers, we need to develop their
rate-dependent constitutive equations. So far, many consti-
tutive equations have been proposed to express stress–strain
curves for thermoplastic and thermoset polymers over a wide
range of strain rates and temperatures. Several mathematical
models, such as a nonlinear exponential model [13], non-
linear power laws [24, 34] and nonlinear exponential and
hyperbolic models [46] based on a Johnson–Cook formula-
tion were used to simulate compressive and tensile stress–
strain response of epoxy and acrylic resins up to a strain of
nearly 0.10 at different strain rates. Rate-dependent com-
pressive and tensile stress–strain curves at larger strains for
semi-crystalline polymers (polyester resins and PTFE) were
represented by nonlinear viscoelastic–plastic models [8, 47,
48] and a Zerilli–Armstrong model [21]. An initial linear
elastic, strain softening followed by hardening behavior after
yielding at strain rates from 10-4 to 104 s-1 for amorphous
and thermoset polymers in compression was described using
molecularly-based viscoelastic–plastic models [20, 49–51].
Richeton et al. [52–54] and Khan et al. [55] discussed strain-
rate and temperature dependence of compressive stress–
strain response for amorphous polymers (PAI, PC and
PMMA) and a thermoset polymer (PU) using one-dimen-
sional and three-dimensional thermo-mechanical models.
Nevertheless, it is very difficult to perform numerical sim-
ulations of dynamic response of polymers using these con-
stitutive models with a large number of parameters.
The objective of the present work is to model the
compressive stress–strain response of selected polymers at
strain rates from 10-3 to nearly 103 s-1 using a simple
strain-rate dependent constitutive equation. Six different
commercial extruded polymers were tested at room tem-
perature. Cylindrical specimens with a slenderness ratio
(=length l/diameter d) of 0.5 were used in the high strain-
rate tests, and those with l/d of 1.0 and 2.0 were used in the
low and intermediate strain-rate tests. Compressive stress–
strain loops at strain rates up to nearly 103 s-1 were
accurately determined on the conventional SHPB. The
corresponding low and intermediate strain-rate stress–
strain loops were measured on an Instron testing machine
(Model 5500R). A rate-dependent Ramberg–Osgood con-
stitutive equation was applied to model experimental
stress–strain data over a wide range of strain rates.
Experimental Details
Test Polymers and Specimen Preparation
Three amorphous polymers (ABS, PC and PVC) and
three semi-crystalline polymers (HDPE, POM and PP)
were chosen for this work. Their full chemical names
and suppliers of polymer rods are listed in Table 1. The
six different extruded polymers tested are shown in
Fig. 1. Cylindrical specimens were machined from the
extruded rods into short cylinders with a diameter of
9 mm. The specimen end surfaces were carefully pol-
ished to a surface roughness of approximately
0.4–0.6 lm Ra with emery papers. The shape and
dimensions of the static and impact compression speci-
mens are given in Tables 2 and 3. The slenderness ratios
of the static specimens were taken as l/d = 1.0 and 2.0.
The slenderness ratio of 1.5 or 2.0 is recommended in
the ASTM Designation E9-89a [56], while that of the
impact specimen was taken as l/d = 0.5. This is because
the slenderness ratios of 0.5 or less can be effective in
the SHPB testing of low-impedance materials to mini-
mize wave attenuation in the specimen [57]. All speci-
mens were tested in the as-received state (i.e., not
subjected to heat treatment).
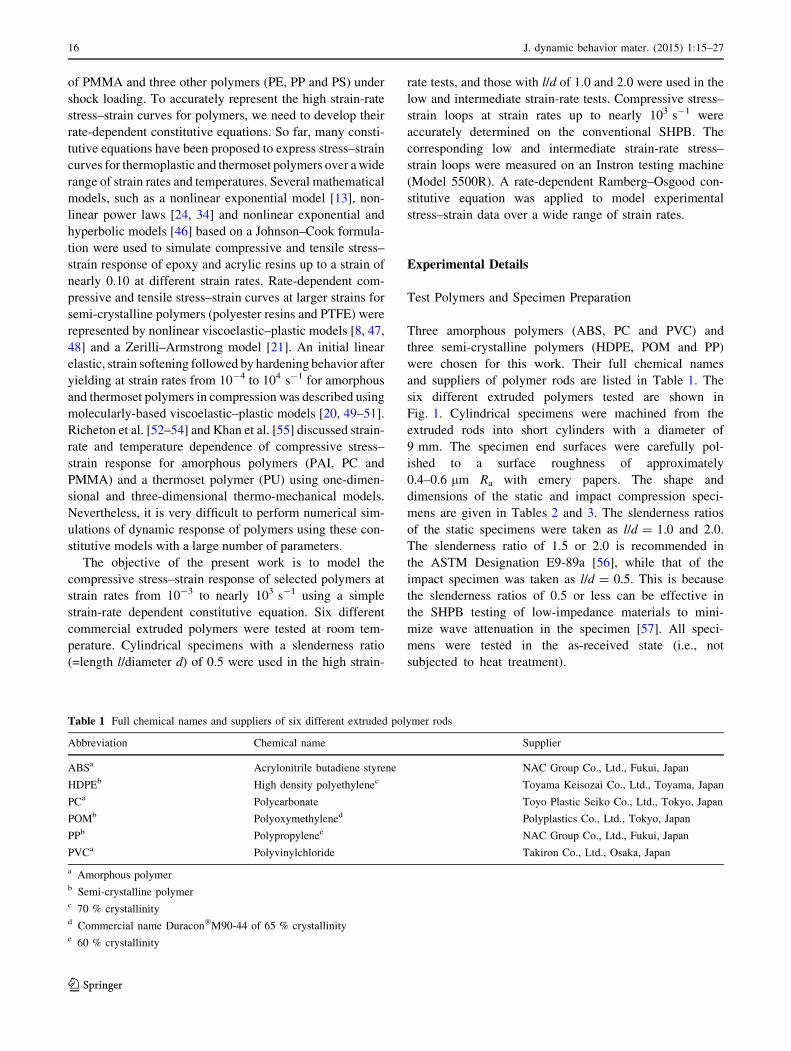
Table 1 Full chemical names and suppliers of six different extruded polymer rods
Abbreviation Chemical name Supplier
ABSa Acrylonitrile butadiene styrene NAC Group Co., Ltd., Fukui, Japan
HDPEb High density polyethylenec Toyama Keisozai Co., Ltd., Toyama, Japan
PCa Polycarbonate Toyo Plastic Seiko Co., Ltd., Tokyo, Japan
POMb Polyoxymethylened Polyplastics Co., Ltd., Tokyo, Japan
PPb Polypropylenee NAC Group Co., Ltd., Fukui, Japan
PVCa Polyvinylchloride Takiron Co., Ltd., Osaka, Japan
a Amorphous polymerb Semi-crystalline polymerc 70 % crystallinityd Commercial name Duracon�M90-44 of 65 % crystallinitye 60 % crystallinity
16 J. dynamic behavior mater. (2015) 1:15–27
123

Low and Intermediate Strain-Rate Compression Testing
Preliminary compression tests were made using PC speci-
mens with l/d = 1.0 and 2.0 to examine the effect of
slenderness ratio. All specimens were lubricated with a thin
layer of petroleum jelly on both end surfaces. This is
because Briscoe and Nosker [9], Walley et al. [10],
Trautmann et al. [18] and Okereke et al. [25] reported that
petroleum jelly provides a lowest sliding friction coeffi-
cient between the polymer specimen ends and the Hop-
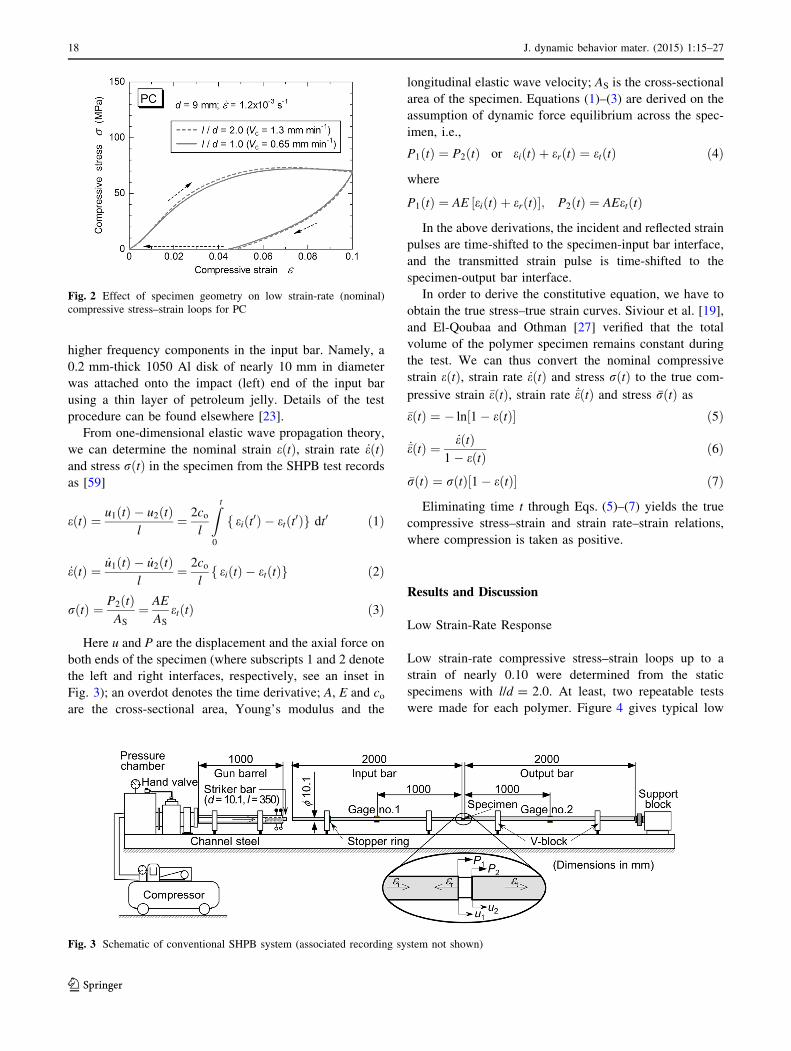
kinson bars. Two low strain-rate (nominal) compressive
stress–strain loops for PC are compared in Fig. 2, where
very little difference is observed between the loops. Low
and intermediate strain-rate compression tests were
thus conducted using the specimens with l/d = 2.0 with the
Instron testing machine at two different crosshead
speeds Vc of 1.3 mm min-1 ( _e = 1.2 9 10-3 s-1) and
130 mm min-1 ( _e = 1.2 9 10-1 s-1). Higher intermedi-
ate strain-rate compression tests were further per-
formed using the specimens with l/d = 1.0 at
Vc = 650 mm min-1 to achieve the stress–strain loops at
_e = 1.2 s-1. The specimens were loaded up to a given
strain and unloaded at the same crosshead speed. Com-
pressive stress and strain in the specimens were deter-
mined, respectively, using a 100-kN capacity load cell
(Instron: Model 2525-801) and an extensometer (Instron:
Model 2620-601). Both load and displacement data were
recorded at sampling rates of 5 Hz for Vc = 1.3 mm min-1
and 500 Hz for Vc = 130 and 650 mm min-1.
Split Hopkinson Pressure Bar Testing
Figure 3 indicates a schematic of the standard SHPB sys-
tem used, which consists principally of 2024-T4 Al alloy
input and output bars, a 2024-T4 Al alloy striker bar, a gun
barrel and an associated recording system (not shown here;
see Ref. [58]). The specifications for the SHPB system are
listed in Table 4. The Al alloy bars with low mechanical
impedance were used to reduce a drastic impedance mis-
match between the polymer specimen (Z *
1 * 2 9 106 kg m-2 s-1) and conventional steel bars
(Z * 40 9 106 kg m-2 s-1), resulting in a transmitted
strain signal with a very low signal-to-noise ratio. The
specimen was sandwiched between the input and output
bars. As in the low and intermediate strain-rate tests,
lubricant (or petroleum jelly) was also applied to the two
bar/specimen interfaces to reduce the frictional effects [9,
10, 18, 25]. A pulse shaping technique [17] was used to
generate well-defined compressive strain pulses without
Fig. 1 Photograph of six different extruded polymer rods
Table 2 Shape and nominal dimensions of static compression spec-
imens. a l/d = 2.0, b l/d = 1.0
Polymer Length l (mm) Diameter d (mm) Slenderness ratio l/d
(a)
ABS 17.97 ± 0.03 8.97 2.0
HDPE 17.97 ± 0.02 8.98
PC 18.01 ± 0.04 8.99
POM 18.00 ± 0.01 8.99
PP 17.97 ± 0.04 8.96
PVC 17.94 ± 0.04 8.96
(b)
ABS 8.99 ± 0.04 9.00 1.0
HDPE 8.98 ± 0.02 8.99
PC 8.99 ± 0.02 8.99
POM 8.99 ± 0.01 9.01
PP 8.99 ± 0.03 8.99
PVC 8.98 ± 0.02 8.99
J. dynamic behavior mater. (2015) 1:15–27 17
123
higher frequency components in the input bar. Namely, a
0.2 mm-thick 1050 Al disk of nearly 10 mm in diameter
was attached onto the impact (left) end of the input bar
using a thin layer of petroleum jelly. Details of the test
procedure can be found elsewhere [23].
From one-dimensional elastic wave propagation theory,
we can determine the nominal strain eðtÞ, strain rate _eðtÞand stress rðtÞ in the specimen from the SHPB test records
as [59]
eðtÞ ¼ u1ðtÞ � u2ðtÞl
¼ 2co
l
Z t
0
eiðt0Þ � etðt0Þf g dt0 ð1Þ
_eðtÞ ¼ _u1ðtÞ � _u2ðtÞl
¼ 2co
leiðtÞ � etðtÞf g ð2Þ
rðtÞ ¼ P2ðtÞAS
¼ AE
AS
etðtÞ ð3Þ
Here u and P are the displacement and the axial force on
both ends of the specimen (where subscripts 1 and 2 denote
the left and right interfaces, respectively, see an inset in
Fig. 3); an overdot denotes the time derivative; A, E and co
are the cross-sectional area, Young’s modulus and the
longitudinal elastic wave velocity; AS is the cross-sectional
area of the specimen. Equations (1)–(3) are derived on the
assumption of dynamic force equilibrium across the spec-
imen, i.e.,
P1ðtÞ ¼ P2ðtÞ or eiðtÞ þ erðtÞ ¼ etðtÞ ð4Þ
where
P1ðtÞ ¼ AE ½eiðtÞ þ erðtÞ�; P2ðtÞ ¼ AEetðtÞ
In the above derivations, the incident and reflected strain
pulses are time-shifted to the specimen-input bar interface,
and the transmitted strain pulse is time-shifted to the
specimen-output bar interface.
In order to derive the constitutive equation, we have to
obtain the true stress–true strain curves. Siviour et al. [19],
and El-Qoubaa and Othman [27] verified that the total
volume of the polymer specimen remains constant during
the test. We can thus convert the nominal compressive
strain eðtÞ, strain rate _eðtÞ and stress rðtÞ to the true com-
pressive strain �eðtÞ, strain rate _�eðtÞ and stress �rðtÞ as
�eðtÞ ¼ � ln½1� eðtÞ� ð5Þ
_�eðtÞ ¼ _eðtÞ1� eðtÞ ð6Þ
�rðtÞ ¼ rðtÞ½1� eðtÞ� ð7Þ
Eliminating time t through Eqs. (5)–(7) yields the true
compressive stress–strain and strain rate–strain relations,
where compression is taken as positive.
Results and Discussion
Low Strain-Rate Response
Low strain-rate compressive stress–strain loops up to a
strain of nearly 0.10 were determined from the static
specimens with l/d = 2.0. At least, two repeatable tests
were made for each polymer. Figure 4 gives typical low
Fig. 3 Schematic of conventional SHPB system (associated recording system not shown)
Fig. 2 Effect of specimen geometry on low strain-rate (nominal)
compressive stress–strain loops for PC
18 J. dynamic behavior mater. (2015) 1:15–27
123
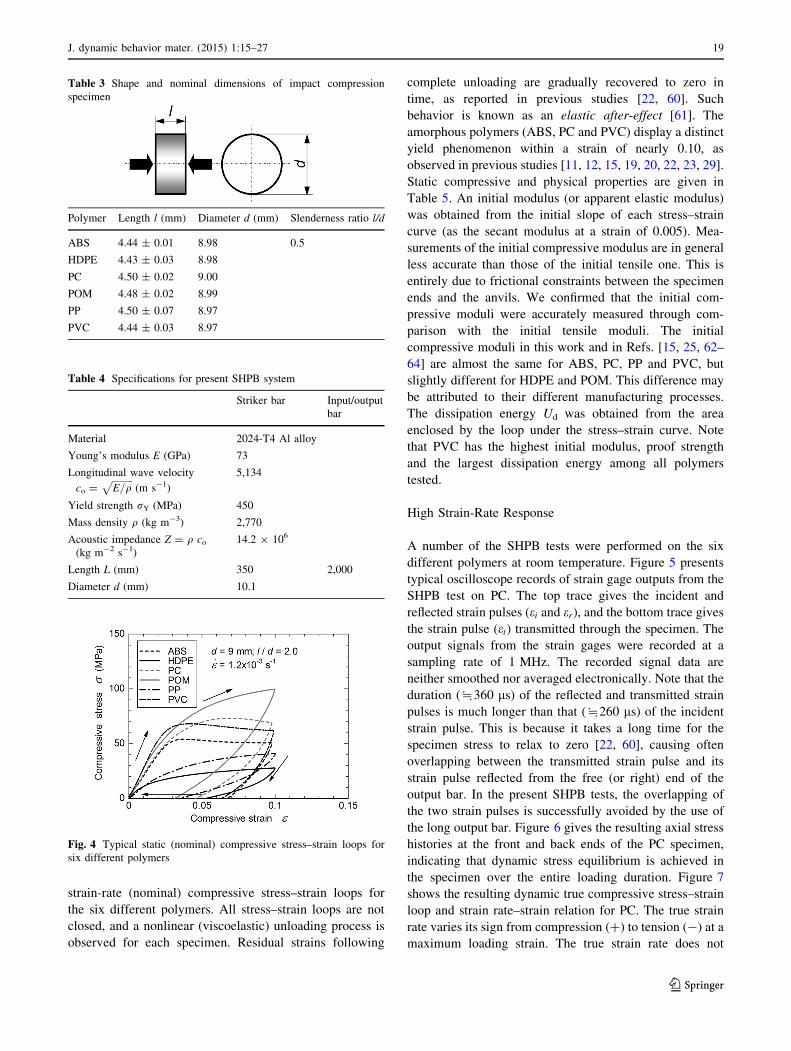
strain-rate (nominal) compressive stress–strain loops for
the six different polymers. All stress–strain loops are not
closed, and a nonlinear (viscoelastic) unloading process is
observed for each specimen. Residual strains following
complete unloading are gradually recovered to zero in
time, as reported in previous studies [22, 60]. Such
behavior is known as an elastic after-effect [61]. The
amorphous polymers (ABS, PC and PVC) display a distinct
yield phenomenon within a strain of nearly 0.10, as
observed in previous studies [11, 12, 15, 19, 20, 22, 23, 29].
Static compressive and physical properties are given in
Table 5. An initial modulus (or apparent elastic modulus)
was obtained from the initial slope of each stress–strain
curve (as the secant modulus at a strain of 0.005). Mea-
surements of the initial compressive modulus are in general
less accurate than those of the initial tensile one. This is
entirely due to frictional constraints between the specimen
ends and the anvils. We confirmed that the initial com-
pressive moduli were accurately measured through com-
parison with the initial tensile moduli. The initial
compressive moduli in this work and in Refs. [15, 25, 62–
64] are almost the same for ABS, PC, PP and PVC, but
slightly different for HDPE and POM. This difference may
be attributed to their different manufacturing processes.
The dissipation energy Ud was obtained from the area
enclosed by the loop under the stress–strain curve. Note
that PVC has the highest initial modulus, proof strength
and the largest dissipation energy among all polymers
tested.
High Strain-Rate Response
A number of the SHPB tests were performed on the six
different polymers at room temperature. Figure 5 presents
typical oscilloscope records of strain gage outputs from the
SHPB test on PC. The top trace gives the incident and
reflected strain pulses (ei and er), and the bottom trace gives
the strain pulse (et) transmitted through the specimen. The
output signals from the strain gages were recorded at a
sampling rate of 1 MHz. The recorded signal data are
neither smoothed nor averaged electronically. Note that the
duration (*360 ls) of the reflected and transmitted strain
pulses is much longer than that (*260 ls) of the incident
strain pulse. This is because it takes a long time for the
specimen stress to relax to zero [22, 60], causing often
overlapping between the transmitted strain pulse and its
strain pulse reflected from the free (or right) end of the
output bar. In the present SHPB tests, the overlapping of
the two strain pulses is successfully avoided by the use of
the long output bar. Figure 6 gives the resulting axial stress
histories at the front and back ends of the PC specimen,
indicating that dynamic stress equilibrium is achieved in
the specimen over the entire loading duration. Figure 7
shows the resulting dynamic true compressive stress–strain
loop and strain rate–strain relation for PC. The true strain
rate varies its sign from compression (?) to tension (-) at a
maximum loading strain. The true strain rate does not
Table 4 Specifications for present SHPB system
Striker bar Input/output
bar
Material 2024-T4 Al alloy
Young’s modulus E (GPa) 73
Longitudinal wave velocity
co =ffiffiffiffiffiffiffiffiffiE=q
p(m s-1)
5,134
Yield strength rY (MPa) 450
Mass density q (kg m-3) 2,770
Acoustic impedance Z = q co
(kg m-2 s-1)
14.2 9 106
Length L (mm) 350 2,000
Diameter d (mm) 10.1
Fig. 4 Typical static (nominal) compressive stress–strain loops for
six different polymers
Table 3 Shape and nominal dimensions of impact compression
specimen
Polymer Length l (mm) Diameter d (mm) Slenderness ratio l/d
ABS 4.44 ± 0.01 8.98 0.5
HDPE 4.43 ± 0.03 8.98
PC 4.50 ± 0.02 9.00
POM 4.48 ± 0.02 8.99
PP 4.50 ± 0.07 8.97
PVC 4.44 ± 0.03 8.97
J. dynamic behavior mater. (2015) 1:15–27 19
123
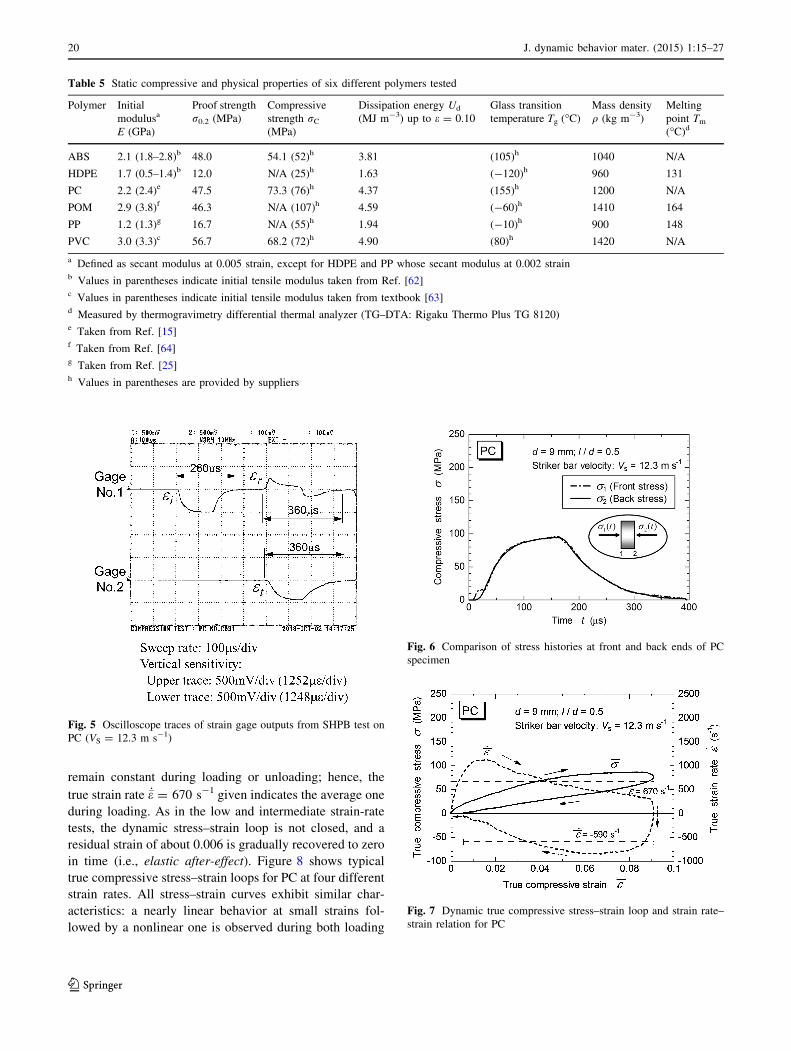
remain constant during loading or unloading; hence, the
true strain rate _�e = 670 s-1 given indicates the average one
during loading. As in the low and intermediate strain-rate
tests, the dynamic stress–strain loop is not closed, and a
residual strain of about 0.006 is gradually recovered to zero
in time (i.e., elastic after-effect). Figure 8 shows typical
true compressive stress–strain loops for PC at four different
strain rates. All stress–strain curves exhibit similar char-
acteristics: a nearly linear behavior at small strains fol-
lowed by a nonlinear one is observed during both loading
Table 5 Static compressive and physical properties of six different polymers tested
Polymer Initial
modulusa
E (GPa)
Proof strength
r0.2 (MPa)
Compressive
strength rC
(MPa)
Dissipation energy Ud
(MJ m-3) up to e = 0.10
Glass transition
temperature Tg (�C)
Mass density
q (kg m-3)
Melting
point Tm
(�C)d
ABS 2.1 (1.8–2.8)b 48.0 54.1 (52)h 3.81 (105)h 1040 N/A
HDPE 1.7 (0.5–1.4)b 12.0 N/A (25)h 1.63 (-120)h 960 131
PC 2.2 (2.4)e 47.5 73.3 (76)h 4.37 (155)h 1200 N/A
POM 2.9 (3.8)f 46.3 N/A (107)h 4.59 (-60)h 1410 164
PP 1.2 (1.3)g 16.7 N/A (55)h 1.94 (-10)h 900 148
PVC 3.0 (3.3)c 56.7 68.2 (72)h 4.90 (80)h 1420 N/A
a Defined as secant modulus at 0.005 strain, except for HDPE and PP whose secant modulus at 0.002 strainb Values in parentheses indicate initial tensile modulus taken from Ref. [62]c Values in parentheses indicate initial tensile modulus taken from textbook [63]d Measured by thermogravimetry differential thermal analyzer (TG–DTA: Rigaku Thermo Plus TG 8120)e Taken from Ref. [15]f Taken from Ref. [64]g Taken from Ref. [25]h Values in parentheses are provided by suppliers
Fig. 5 Oscilloscope traces of strain gage outputs from SHPB test on
PC (VS = 12.3 m s-1)
Fig. 6 Comparison of stress histories at front and back ends of PC
specimen
Fig. 7 Dynamic true compressive stress–strain loop and strain rate–
strain relation for PC
20 J. dynamic behavior mater. (2015) 1:15–27
123
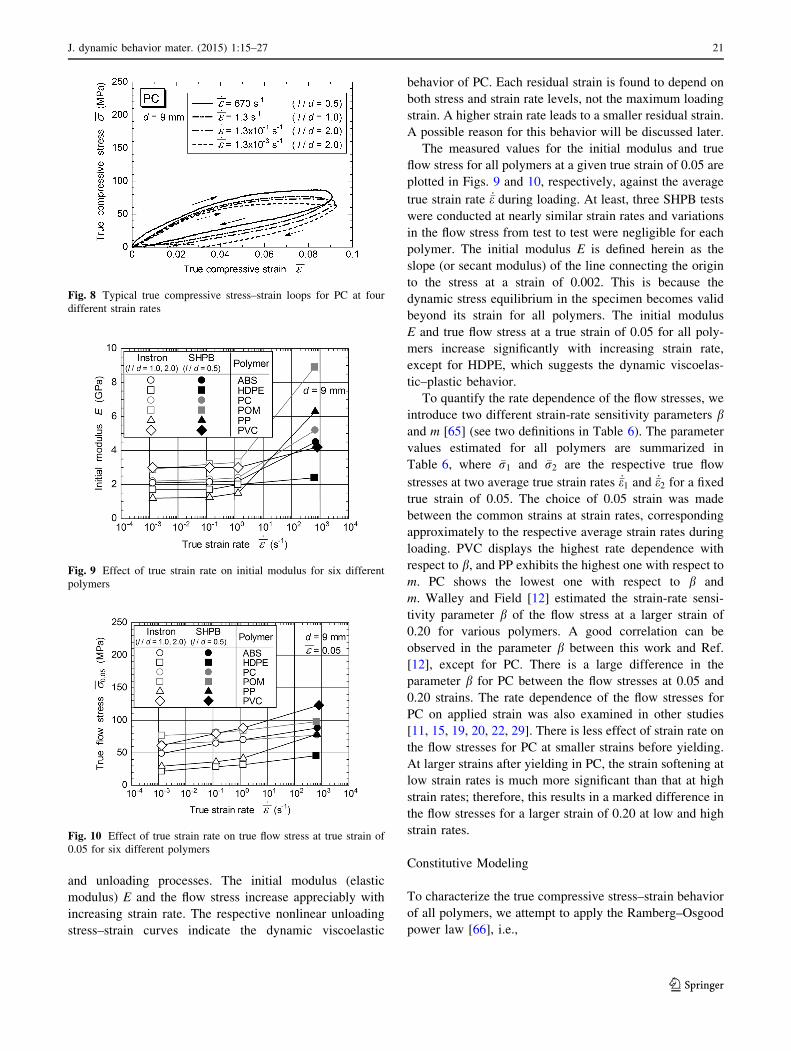
and unloading processes. The initial modulus (elastic
modulus) E and the flow stress increase appreciably with
increasing strain rate. The respective nonlinear unloading
stress–strain curves indicate the dynamic viscoelastic
behavior of PC. Each residual strain is found to depend on
both stress and strain rate levels, not the maximum loading
strain. A higher strain rate leads to a smaller residual strain.
A possible reason for this behavior will be discussed later.
The measured values for the initial modulus and true
flow stress for all polymers at a given true strain of 0.05 are
plotted in Figs. 9 and 10, respectively, against the average
true strain rate _�e during loading. At least, three SHPB tests
were conducted at nearly similar strain rates and variations
in the flow stress from test to test were negligible for each
polymer. The initial modulus E is defined herein as the
slope (or secant modulus) of the line connecting the origin
to the stress at a strain of 0.002. This is because the
dynamic stress equilibrium in the specimen becomes valid
beyond its strain for all polymers. The initial modulus
E and true flow stress at a true strain of 0.05 for all poly-
mers increase significantly with increasing strain rate,
except for HDPE, which suggests the dynamic viscoelas-
tic–plastic behavior.
To quantify the rate dependence of the flow stresses, we
introduce two different strain-rate sensitivity parameters band m [65] (see two definitions in Table 6). The parameter
values estimated for all polymers are summarized in
Table 6, where �r1 and �r2 are the respective true flow
stresses at two average true strain rates _�e1 and _�e2 for a fixed
true strain of 0.05. The choice of 0.05 strain was made
between the common strains at strain rates, corresponding
approximately to the respective average strain rates during
loading. PVC displays the highest rate dependence with
respect to b, and PP exhibits the highest one with respect to
m. PC shows the lowest one with respect to b and
m. Walley and Field [12] estimated the strain-rate sensi-
tivity parameter b of the flow stress at a larger strain of
0.20 for various polymers. A good correlation can be
observed in the parameter b between this work and Ref.
[12], except for PC. There is a large difference in the
parameter b for PC between the flow stresses at 0.05 and
0.20 strains. The rate dependence of the flow stresses for
PC on applied strain was also examined in other studies
[11, 15, 19, 20, 22, 29]. There is less effect of strain rate on
the flow stresses for PC at smaller strains before yielding.
At larger strains after yielding in PC, the strain softening at
low strain rates is much more significant than that at high
strain rates; therefore, this results in a marked difference in
the flow stresses for a larger strain of 0.20 at low and high
strain rates.
Constitutive Modeling
To characterize the true compressive stress–strain behavior
of all polymers, we attempt to apply the Ramberg–Osgood
power law [66], i.e.,
Fig. 8 Typical true compressive stress–strain loops for PC at four
different strain rates
Fig. 9 Effect of true strain rate on initial modulus for six different
polymers
Fig. 10 Effect of true strain rate on true flow stress at true strain of
0.05 for six different polymers
J. dynamic behavior mater. (2015) 1:15–27 21
123
�e ð�rÞ ¼ �rEþ �r
H
� �1n
ð8Þ
where E is the initial (or elastic) modulus, H the strength
coefficient and n the strain-hardening exponent (or coeffi-
cient). The first and second terms on the right-hand side of
Eq. (8) correspond to the true elastic strain �ee and the true
plastic strain �ep, respectively. From Eq. (8), we can obtain
�r ð�epÞ ¼ H�enp ¼ H �e� �r
E
� �n
ð9Þ
Taking logarithms of both sides of Eq. (9) yields
log �r ¼ log H þ n log �ep ð10Þ
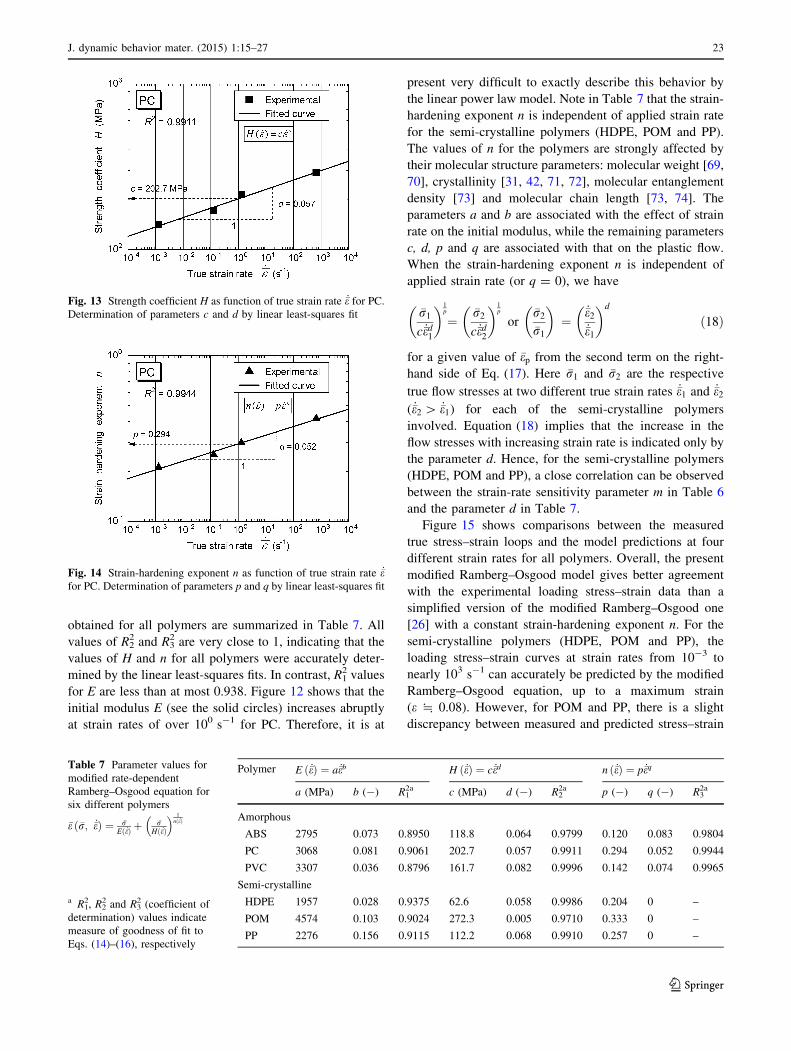
Figure 11 gives typical log–log plots of the true stress
�r—true plastic strain �ep for PC at four different strain
rates obtained from Fig. 8. The two constants H and n
were determined by fitting the measured data points on the
�r� �ep curves to Eq. (10) using a linear least-squares
technique. The total number of the data points used was
nearly 180 for low and intermediate strain-rate tests, and
nearly 150 for high strain-rate tests. The constant H cor-
responds to the value of �r at �ep = 1. The constant n was
obtained from the slope of a linear fit line. A value of R2
(coefficient of determination) indicates a measure of the
goodness of fit to Eq. (10). Figure 11 suggests also that
both H and n depend on the true strain rate _�e alone.
Therefore, E, H and n are, respectively, assumed to be
represented by simple power law functions of _�e as
E ð _�eÞ ¼ a _�eb ð11Þ
H ð _�eÞ ¼ c _�ed ð12Þ
n ð _�eÞ ¼ p _�eq ð13Þ
where a, b, c, d, p and q are material parameters. Again
taking logarithms of both sides of Eqs. (11)–(13) leads to
log E ¼ log aþ b log _�e ð14Þ
log H ¼ log cþ d log _�e ð15Þ
log n ¼ log pþ q log _�e ð16Þ
Substituting Eqs. (11)–(13) into Eq. (8) yields the
modified rate-dependent Ramberg–Osgood equation [26,
67, 68] as
�e ð�r; _�eÞ ¼ �r
a _�ebþ �r
c _�ed
� � 1p _�eq
ð17Þ
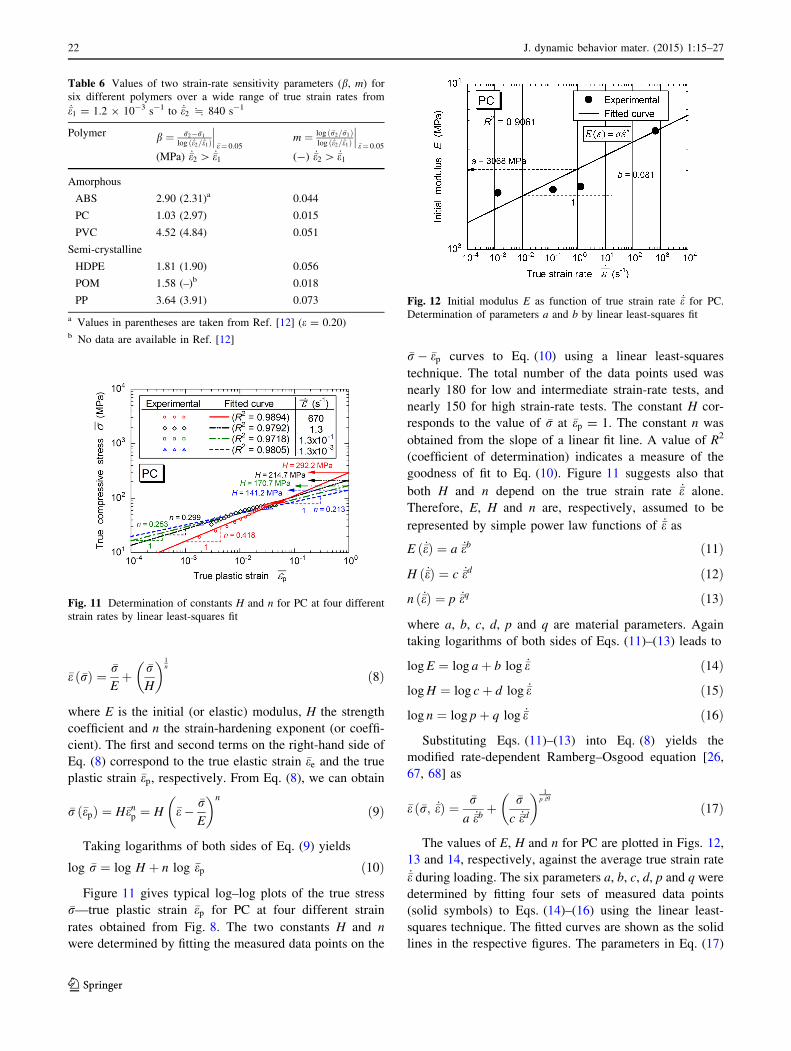
The values of E, H and n for PC are plotted in Figs. 12,
13 and 14, respectively, against the average true strain rate_�e during loading. The six parameters a, b, c, d, p and q were
determined by fitting four sets of measured data points
(solid symbols) to Eqs. (14)–(16) using the linear least-
squares technique. The fitted curves are shown as the solid
lines in the respective figures. The parameters in Eq. (17)
Table 6 Values of two strain-rate sensitivity parameters (b, m) for
six different polymers over a wide range of true strain rates from_�e1 = 1.2 9 10-3 s-1 to _�e2 * 840 s-1
Polymer b ¼ �r2� �r1
log ð _�e2= _�e1Þ
����e¼ 0:05
(MPa) _�e2 [ _�e1
m ¼ log ð �r2= �r1Þlog ð _�e2= _�e1Þ
����e¼ 0:05
(-) _�e2 [ _�e1
Amorphous
ABS 2.90 (2.31)a 0.044
PC 1.03 (2.97) 0.015
PVC 4.52 (4.84) 0.051
Semi-crystalline
HDPE 1.81 (1.90) 0.056
POM 1.58 (–)b 0.018
PP 3.64 (3.91) 0.073
a Values in parentheses are taken from Ref. [12] (e = 0.20)b No data are available in Ref. [12]
Fig. 11 Determination of constants H and n for PC at four different
strain rates by linear least-squares fit
Fig. 12 Initial modulus E as function of true strain rate _�e for PC.
Determination of parameters a and b by linear least-squares fit
22 J. dynamic behavior mater. (2015) 1:15–27
123
obtained for all polymers are summarized in Table 7. All
values of R22 and R3
2 are very close to 1, indicating that the
values of H and n for all polymers were accurately deter-
mined by the linear least-squares fits. In contrast, R12 values
for E are less than at most 0.938. Figure 12 shows that the
initial modulus E (see the solid circles) increases abruptly
at strain rates of over 100 s-1 for PC. Therefore, it is at
present very difficult to exactly describe this behavior by
the linear power law model. Note in Table 7 that the strain-
hardening exponent n is independent of applied strain rate
for the semi-crystalline polymers (HDPE, POM and PP).
The values of n for the polymers are strongly affected by
their molecular structure parameters: molecular weight [69,
70], crystallinity [31, 42, 71, 72], molecular entanglement
density [73] and molecular chain length [73, 74]. The
parameters a and b are associated with the effect of strain
rate on the initial modulus, while the remaining parameters
c, d, p and q are associated with that on the plastic flow.
When the strain-hardening exponent n is independent of
applied strain rate (or q = 0), we have
�r1
c _�ed1
� �1p
¼ �r2
c _�ed2
� �1p
or�r2
�r1
� �¼
_�e2
_�e1
� �d
ð18Þ
for a given value of �ep from the second term on the right-
hand side of Eq. (17). Here �r1 and �r2 are the respective
true flow stresses at two different true strain rates _�e1 and _�e2
( _�e2 [ _�e1) for each of the semi-crystalline polymers
involved. Equation (18) implies that the increase in the
flow stresses with increasing strain rate is indicated only by
the parameter d. Hence, for the semi-crystalline polymers
(HDPE, POM and PP), a close correlation can be observed
between the strain-rate sensitivity parameter m in Table 6
and the parameter d in Table 7.
Figure 15 shows comparisons between the measured
true stress–strain loops and the model predictions at four
different strain rates for all polymers. Overall, the present
modified Ramberg–Osgood model gives better agreement
with the experimental loading stress–strain data than a
simplified version of the modified Ramberg–Osgood one
[26] with a constant strain-hardening exponent n. For the
semi-crystalline polymers (HDPE, POM and PP), the
loading stress–strain curves at strain rates from 10-3 to
nearly 103 s-1 can accurately be predicted by the modified
Ramberg–Osgood equation, up to a maximum strain
(e * 0.08). However, for POM and PP, there is a slight
discrepancy between measured and predicted stress–strain
Fig. 13 Strength coefficient H as function of true strain rate _�e for PC.
Determination of parameters c and d by linear least-squares fit
Fig. 14 Strain-hardening exponent n as function of true strain rate _�efor PC. Determination of parameters p and q by linear least-squares fit
Table 7 Parameter values for
modified rate-dependent
Ramberg–Osgood equation for
six different polymers
�e ð�r; _�eÞ ¼ �rEð _�eÞ þ
�rHð _�eÞ
� � 1nð _�eÞ
a R12, R2
2 and R32 (coefficient of
determination) values indicate
measure of goodness of fit to
Eqs. (14)–(16), respectively
Polymer E ð _�eÞ ¼ a _�eb H ð _�eÞ ¼ c _�ed n ð _�eÞ ¼ p _�eq
a (MPa) b (-) R12a c (MPa) d (-) R2
2a p (-) q (-) R32a
Amorphous
ABS 2795 0.073 0.8950 118.8 0.064 0.9799 0.120 0.083 0.9804
PC 3068 0.081 0.9061 202.7 0.057 0.9911 0.294 0.052 0.9944
PVC 3307 0.036 0.8796 161.7 0.082 0.9996 0.142 0.074 0.9965
Semi-crystalline
HDPE 1957 0.028 0.9375 62.6 0.058 0.9986 0.204 0 –
POM 4574 0.103 0.9024 272.3 0.005 0.9710 0.333 0 –
PP 2276 0.156 0.9115 112.2 0.068 0.9910 0.257 0 –
J. dynamic behavior mater. (2015) 1:15–27 23
123

curves in the initial elastic region at low and intermediate
strain rates. To reduce this discrepancy, we have to further
consider the rate dependence of the initial modulus using
nonlinear models. For the amorphous polymers (ABS, PC
and PVC), the predicted stress–strain curves start to deviate
from the experimental curves beyond a strain of approxi-
mately 0.05. This is because the amorphous polymers
exhibit intrinsic strain softening followed by hardening
phenomena [20, 29, 52–54] after yielding, independently of
the strain rate. This characteristic behavior cannot reason-
ably be described by the modified Ramberg–Osgood rela-
tion. The strain softening is induced by chains slippage,
whereas the strain hardening is caused by alignment and
extension of chains in the loading direction [54, 64, 75]. At
higher strain rates, amorphous polymers reveal the intrinsic
strain softening and thermal softening [7, 15, 20, 22, 29,
54] due to adiabatic heating after yielding. Mulliken and
Boyce [20], Porter and Gould [51], and Richeton et al. [54]
argued that it is possible to capture the strain softening
followed by hardening behavior of amorphous polymers
over a wide range of strain rates and temperatures using
extended constitutive relations including molecular struc-
ture parameters and adiabatic parameters. Figure 15
suggests also that the unloading stress–strain curves at any
strain rate for all polymers cannot be predicted by the
modified Ramberg–Osgood equation. The residual strain
after complete unloading decreases with increasing strain
rate, although the maximum loading strain is almost the
same (emax * 0.08) for the amorphous polymers (ABS, PC
and PVC). This result is quite consistent with other com-
pression data on an amorphous polymer (PMMA) by Song
and Chen [17]. Meanwhile, the residual strain is indepen-
dent of strain rate for the semi-crystalline polymers
(HDPE, POM and PP). This different unloading stress–
strain behavior may arise from differences in the molecular
structures between the amorphous and semi-crystalline
polymers. In an effort to express the high strain-rate
unloading stress–strain relations for the polymers, we need
to further develop a rate-dependent constitutive model
based on their molecular structures [20, 49, 51, 54].
Finally, we mention the advantages and limitations of
the modified rate-dependent Ramberg–Osgood constitutive
model or Eq. (17). The simple constitutive model with six
parameters can represent complicated dynamic viscoelas-
tic–plastic characteristics of polymers. A closed-form of
the stress in terms of the strain and strain rate cannot
Fig. 15 Comparisons between experimental true compressive stress–strain loops and model predictions at four different strain rates for six
different polymers
24 J. dynamic behavior mater. (2015) 1:15–27
123

directly be derived from Eq. (17). The applicability of the
simple constitutive model is limited within a strain of
nearly 0.05, especially, for the three amorphous polymers
(ABS, PC and PVC). Nevertheless, we can assert that the
simple model is valid for conducting numerical simulations
of the mechanical response of polymers at strain rates up to
approximately 103 s-1 within a limited strain region.
Conclusions
The rate dependence of uniaxial compressive stress–strain
loops for the six commercial polymers has been investi-
gated using the standard SHPB and the Instron testing
machine. The modified rate-dependent Ramberg–Osgood
model was developed and its advantages and limitations
were discussed. From the present experimental work, we
can conclude the following:
(1) All polymers exhibit intrinsic dynamic viscoelastic–
plastic behavior and a higher elastic after-effect
following complete unloading.
(2) The initial modulus and flow stresses for all poly-
mers increase appreciably with increasing strain rate,
except for HDPE.
(3) For the semi-crystalline polymers (HDPE, POM and
PP), the loading compressive stress–strain curves at
strain rates from 10-3 to nearly 103 s-1 can success-
fully be represented by the modified Ramberg–
Osgood equation.
(4) For the amorphous polymers (ABS, PC and PVC),
the loading compressive stress–strain curves up to a
strain of nearly 0.05 at strain rates from 10-3 to
nearly 103 s-1 can be expressed in terms of the
modified Ramberg–Osgood equation, except for the
strain softening after yielding regime.
(5) The modified Ramberg–Osgood equation cannot be
applied to model the unloading compressive stress–
strain behavior at low or high strain rates.
The polymers are known to reveal different mechanical
characteristics in tension and compression. Further work is
needed for constitutive modeling of the tensile behavior of
the six polymers over a broad range of strain rates and
temperatures.
Acknowledgments This work was supported in part by a Grant-in-
Aid for Scientific Research (C) (No. 22560686) from the Japan
Society for Promotion of Science. The authors wish to thank two
reviewers for their helpful comments and suggestions.
References
1. Wada Y, Kasahara T (1967) Relation between impact strength
and dynamic mechanical properties of plastics. J Appl Polym Sci
11:1661–1665
2. Brown HR (1973) A critical examination of the impact test for
glassy polymers. J Mater Sci 8:941–948
3. Allen G, Morley DCW, Williams T (1973) The impact strength
of polycarbonate. J Mater Sci 8:1449–1452
4. Oshinski AJ, Keskkula H, Paul DR (1996) The role of matrix
molecular weight in rubber toughened nylon 6 blends: 2. room
temperature Izod impact toughness. Polymer 37:4909–4918
5. Davies EDH, Hunter SC (1963) The dynamic compression testing
of solids by the method of the split Hopkinson pressure bar.
J Mech Phys Solids 11:155–179
6. Chiu SS, Neubert VH (1967) Difference method for wave ana-
lysis of the split Hopkinson pressure bar with a viscoelastic
specimen. J Mech Phys Solids 15:177–193
7. Chou SC, Robertson KD, Rainey JH (1973) The effect of strain
rate and heat developed during deformation on the stress–strain
curve of plastics. Exp Mech 13:422–432
8. Chase KW, Goldsmith W (1974) Mechanical and optical char-
acterization of an anelastic polymer at large strain rates and large
strains. Exp Mech 14:10–18
9. Briscoe BJ, Nosker RW (1984) The influence of interfacial
friction on the deformation of high density polyethylene in a split
Hopkinson pressure bar. Wear 95:241–262
10. Walley SM, Field JE, Pope PH, Safford NA (1989) A study of the
rapid deformation behaviour of a range of polymers. Philos Trans
R Soc Lond A 328:1–33
11. Dioh NN, Leevers PS, Williams JG (1993) Thickness effects in
split Hopkinson pressure bar tests. Polymer 34:4230–4234
12. Walley SM, Field JE (1994) Strain rate sensitivity of polymers in
compression from low to high rates. DYMAT J 1:211–227
Fig. 15 continued
J. dynamic behavior mater. (2015) 1:15–27 25
123
13. Tay TE, Ang HG, Shim VPW (1995) An empirical strain rate-
dependent constitutive relationship for glass-fibre reinforced
epoxy and pure epoxy. Compos Struct 33:201–210
14. Buckley CP, Harding J, Hou JP, Ruiz C, Trojanowski A
(2001) Deformation of thermosetting resins at impact rates of
strain. Part I: experimental study. J Mech Phys Solids
49:1517–1538
15. Li Z, Lambros J (2001) Strain rate effects on the thermome-
chanical behavior of polymers. Int J Solid Struct 38:3549–3562
16. Chen W, Lu F, Cheng M (2002) Tension and compression tests of
two polymers under quasi-static and dynamic loading. Polym
Test 21:113–121
17. Song B, Chen W (2004) Loading and unloading split Hopkinson
pressure bar pulse-shaping techniques for dynamic hysteretic
loops. Exp Mech 44:622–627
18. Trautmann A, Siviour CR, Walley SM, Field JE (2005) Lubri-
cation of polycarbonate at cryogenic temperatures in the split
Hopkinson pressure bar. Int J Impact Eng 31:523–544
19. Siviour CR, Walley SM, Proud WG, Field JE (2005) The high
strain rate compressive behaviour of polycarbonate and polyvi-
nylidene difluoride. Polymer 46:12546–12555
20. Mulliken AD, Boyce MC (2006) Mechanics of the rate-dependent
elastic-plastic deformation of glassy polymers from low to high
strain rates. Int J Solid Struct 43:1331–1356
21. Jordan JL, Siviour CR, Foley JR, Brown EN (2007) Compressive
properties of extruded polytetrafluoroethylene. Polymer
48:4184–4195
22. Garg M, Mulliken AD, Boyce MC (2008) Temperature rise in
polymeric materials during high rate deformation. ASME J Appl
Mech 75:011009–1–011009–8
23. Nakai K, Yokoyama T (2008) Strain rate dependence of com-
pressive stress–strain loops of several polymers. J Solid Mech
Mater Eng 2:557–566
24. Naik NK, Shankar PJ, Kavala VR, Ravikumar G, Pothnis JR,
Arya H (2011) High strain rate mechanical behavior of epoxy
under compressive loading: experimental and modeling studies.
Mater Sci Eng A 528:846–854
25. Okereke MI, Buckley CP, Siviour CR (2012) Compression of
polypropylene across a wide range of strain rates. Mech Time-
Depend Mater 16:361–379
26. Nakai K, Yokoyama T (2012) High strain-rate compressive
properties and constitutive modeling of selected polymers. J Solid
Mech Mater Eng 6:731–741
27. El-Qoubaa Z, Othman R (2014) Volume change in polyethere-
therketone under compression loads over wide ranges of strain
rate and temperature. J Strain Anal 49:315–324
28. Acharya S, Mukhopadhyay AK (2014) High strain rate com-
pressive behavior of PMMA. Polym Bull 71:133–149
29. Kendall MJ, Siviour CR (2014) Experimentally simulating high-
rate behaviour: rate and temperature effects in polycarbonate and
PMMA. Philos Trans R Soc A 372:20130202
30. Shim VPW, Yuan J, Lee S-H (2001) A technique for rapid two-
stage dynamic tensile loading of polymers. Exp Mech
41:122–127
31. Rae PJ, Brown EN (2005) The properties of poly(tetrafluoro-
ethylene) (PTFE) in tension. Polymer 46:8128–8140
32. Gilat A, Goldberg RK, Roberts GD (2007) Strain rate sensitivity
of epoxy resin in tensile and shear loading. J Aerosp Eng
20:75–89
33. Sarva SS, Boyce MC (2007) Mechanics of polycarbonate during
high-rate tension. J Mech Mater Struct 2:1853–1880
34. Naik NK, Perla Y (2008) Mechanical behaviour of acrylic under
high strain rate tensile loading. Polym Test 27:504–512
35. Fu S, Wang Y, Wang Y (2009) Tension testing of polycarbonate
at high strain rates. Polym Test 28:724–729
36. Fleck NA, Stronge WJ, Liu JH (1990) High strain-rate shear
response of polycarbonate and polymethyl methacrylate. Proc R
Soc Lond A 429:459–479
37. Kolsky H (1949) An investigation of the mechanical properties of
materials at very high rates of loading. Proc Phys Soc B
62:676–700
38. Tardif HP, Marquis H (1963) Some dynamic properties of plas-
tics. Can Aeronaut Space J 9:205–213
39. Briscoe BJ, Hutchings IM (1976) Impact yielding of high density
polyethylene. Polymer 17:1099–1102
40. Hamdan S, Swallowe GM (1996) The strain-rate and temperature
dependence of the mechanical properties of polyetherketone and
polyetheretherketone. J Mater Sci 31:1415–1423
41. Roland CM, Twigg JN, Vu Y, Mott PH (2007) High strain rate
mechanical behavior of polyurea. Polymer 48:574–578
42. Rae PJ, Brown EN, Orler EB (2007) The mechanical properties
of poly(ether-ether-ketone) (PEEK) with emphasis on the large
compressive strain response. Polymer 48:598–615
43. Furmanski J, Trujillo CP, Martinez DT, Gray GT III, Brown EN
(2012) Dynamic-Tensile-Extrusion for investigating large strain
and high strain rate behavior of polymers. Polym Test
31:1031–1037
44. Millett JCF, Bourne NK (2000) The deviatoric response of
polymethylmethacrylate to one-dimensional shock loading.
J Appl Phys 88:7037–7040
45. Millett JCF, Bourne NK (2004) The shock induced equation of
state of three simple polymers. J Phys D Appl Phys
37:2901–2907
46. Chen W, Zhou B (1998) Constitutive behavior of Epon 828/T-
403 at various strain rates. Mech Time-Depend Mater 2:103–111
47. Sadd MH, Morris DH (1976) Rate-dependent stress–strain
behavior of polymeric materials. J Appl Polym Sci 20:421–433
48. Khan A, Zhang H (2001) Finite deformation of a polymer:
experiments and modeling. Int J Plast 17:1167–1188
49. Porter D (1995) Group interaction modelling of polymer prop-
erties. Marcel Dekker, New York
50. Buckley CP, Dooling PJ, Harding J, Ruiz C (2004) Deformation
of thermosetting resins at impact rates of strain. Part 2: consti-
tutive model with rejuvenation. J Mech Phys Solids
52:2355–2377
51. Porter D, Gould PJ (2009) Predictive nonlinear constitutive
relations in polymers through loss history. Int J Solid Struct
46:1981–1993
52. Richeton J, Ahzi S, Daridon L, Remond Y (2005) A formulation
of the cooperative model for the yield stress of amorphous
polymers for a wide range of strain rates and temperatures.
Polymer 46:6035–6043
53. Richeton J, Ahzi S, Vecchio KS, Jiang FC, Adharapurapu RR
(2006) Influence of temperature and strain rate on the mechanical
behavior of three amorphous polymers: characterization and
modeling of the compressive yield stress. Int J Solid Struct
43:2318–2335
54. Richeton J, Ahzi S, Vecchio KS, Jiang FC, Makradi A (2007)
Modeling and validation of the large deformation inelastic
response of amorphous polymers over a wide range of tempera-
tures and strain rates. Int J Solid Struct 44:7938–7954
55. Khan AS, Lopez-Pamies O, Kazmi R (2006) Thermo-mechanical
large deformation response and constitutive modeling of visco-
elastic polymers over a wide range of strain rates and tempera-
tures. Int J Plast 22:581–601
56. ASTM E9-89a (1995) Standard test methods of compression
testing of metallic materials at room temperature. American
Society for Testing and Materials, Philadelphia
57. Gray GT III, Blumenthal WR (2000) Split-Hopkinson pressure
bar testing of soft materials. In: ASM Handbook�, Vol. 8,
26 J. dynamic behavior mater. (2015) 1:15–27
123
Mechanical Testing and Evaluation. ASM International, Materi-
als Park
58. Yokoyama T, Ogawa K (2003) Impact tensile properties of 6061
aluminium alloy to SUS 304 stainless steel friction-welded butt
joints. Weld Int 17:514–523
59. Lindholm US (1964) Some experiments with the split Hopkinson
pressure bar. J Mech Phys Solids 12:317–335
60. Bernatskii AD, Rabinovich AL (1964) Strain in certain cross-
linked polymers. Polym Sci USSR 6:1166–1175
61. Dieter GE (1988) Mechanical metallurgy. McGraw–Hill, London
62. Swallowe GM (1999) Mechanical properties and testing of
polymers: an A-Z reference. Kluwer Academic Publishers,
Dordrecht
63. Brinson HF, Brinson LC (2008) Polymer engineering science and
viscoelasticity: an introduction. Springer, New York
64. Ghorbel E (2008) A viscoplastic constitutive model for polymeric
materials. Int J Plast 24:2032–2058
65. Malatynski M, Klepaczko J (1980) Experimental investigation of
plastic properties of lead over a wide range of strain rates. Int J
Mech Sci 22:173–183
66. Ramberg W, Osgood WR (1943) Description of stress–strain
curves by three parameters. Technical note 902; National Advi-
sory Committee for Aeronautics, Washington DC
67. McLellan DL (1967) Constitutive equations for mechanical
properties of structural materials. AIAA J 5:446–450
68. Hight TK, Brandeau JF (1983) Mathematical modeling of the
stress strain–strain rate behavior of bone using the Ramberg–
Osgood equation. J Biomech 16:445–450
69. Nunes RW, Martin JR, Johnson JF (1982) Influence of molecular
weight and molecular weight distribution on mechanical prop-
erties of polymers. Polym Eng Sci 22:205–228
70. Hallam MA, Cansfield DLM, Ward IM, Pollard G (1986) A study
of the effect of molecular weight on the tensile strength of ultra-
high modulus polyethylenes. J Mater Sci 21:4199–4205
71. Talbott MF, Springer GS, Berglund LA (1987) The effects of
crystallinity on the mechanical properties of PEEK polymer and
graphite fiber reinforced PEEK. J Compos Mater 21:1056–1081
72. Lee LH, Vanselow JJ, Schneider NS (1988) Effects of mechan-
ical drawing on the structure and properties of PEEK. Polym Eng
Sci 28:181–187
73. Hoy RS, Robbins MO (2006) Strain hardening of polymer glas-
ses: effect of entanglement density, temperature, and rate.
J Polym Sci Part B Polym Phys 44:3487–3500
74. Vorselaars B, Lyulin AV, Michels MAJ (2009) Microscopic
mechanisms of strain hardening in glassy polymers. Macromol-
ecules 42:5829–5842
75. Bouvard JL, Ward DK, Hossain D, Marin EB, Bammann DJ,
Horstemeyer MF (2010) A general inelastic internal state variable
model for amorphous glassy polymers. Acta Mech 213:71–96
J. dynamic behavior mater. (2015) 1:15–27 27
123