unexpected rates of cannibalism under competitive
TRANSCRIPT

UNEXPECTED RATES OF CANNIBALISM UNDER COMPETITIVE CONDITIONS BY THE NATICID GASTROPOD NEVERITA DUPLICATA (SAY)
Emily S. Gould
A Thesis Submitted to the University of North Carolina Wilmington in Partial Fulfillment
of the Requirements for the Degree of
Master of Science
Center for Marine Science
University of North Carolina Wilmington
2010
Approved by
Advisory Committee
Gregory Dietl Richard Laws b
Patricia Kelley .
Chair
Accepted by
_______________________________
Dean, Graduate School

TABLE OF CONTENTS
ABSTRACT....................................................................................................................................iv
ACKNOWLEDGMENTS ..............................................................................................................vi
LIST OF TABLES ........................................................................................................................ vii
LIST OF FIGURES ..................................................................................................................... viii
INTRODUCTION ...........................................................................................................................1
Background ..............................................................................................................1
Optimal Foraging Theory.........................................................................................2
Cannibalism .............................................................................................................5
PURPOSE ......................................................................................................................................12
HYPOTHESIS ...............................................................................................................................12
METHODS ....................................................................................................................................12
Experimental Setup ...............................................................................................12
Data Collected........................................................................................................16
RESULTS ......................................................................................................................................18
Prey Consumption..................................................................................................18
Growth Rates..........................................................................................................24
Boreholes ...............................................................................................................26
DISCUSSION ................................................................................................................................31
Prey Consumption..................................................................................................31
Growth Rates..........................................................................................................33
Boreholes ...............................................................................................................34
Future Work ...........................................................................................................36

iii
CONCLUSIONS ...........................................................................................................................37
LITERATURE CITED ..................................................................................................................39

iv
ABSTRACT
Cannibalism by shell-drilling naticid gastropods is common in the fossil record and has
been considered a predictable result of selective predation that depends on the size ratio of two
naticids, not on availability of bivalve prey. In contrast, a pilot project suggested that
cannibalism only occurred when bivalve prey were greatly depleted. This study further explores
the conditions under which cannibalism occurs.
Because cannibalism may benefit the predator by reducing competition, I hypothesized
that naticid cannibalism is more likely in high competition (HC) than low competition (LC)
environments in the presence of bivalve prey. Three replicates of a HC environment for naticids
were set up with four Neverita duplicata (two large, two small). Three replicates of a LC
environment contained two Neverita (one large, one small). Six control tanks, three containing
one large naticid and three containing one small naticid, were used to monitor feeding rates
without competition. Small and large naticids measured 15-16mm and 25-26mm, respectively.
Three Mercenaria prey were provided in each tank in two size categories within the limits of
predator manipulation, 7-13mm and 14-23mm. Consumed prey were replaced ~2-3 days with a
similar item.
Cannibalism did not occur in the HC tanks until the seventh week, even though predator
density was much greater than in nature and small naticids were available as prey. By measuring
borehole size, I found the large naticid responsible for two HC cannibalistic events and the small
for one event. Contrary to my hypothesis, cannibalism readily occurred in all three LC tanks,
appearing the first week of the experiment and often occurring before and sometimes instead of
the consumption of bivalve prey. The large naticid was responsible for all thirty-one cannibalistic
events in the LC tanks.
Control and Experimental tanks showed a significant difference in consumption by
Neverita of 5.1 prey/predator/week (2.76mL of prey/predator/week) under no competition vs. 2.2
prey/predator/week (1.22mL of prey/predator/week) under HC conditions and 3.8

v
prey/predator/week (1.78mL of prey/predator/week) under LC conditions. Greater risk to naticid
predators may account for the decreased feeding rates in the Experimental tanks compared to the
Control tanks, especially in the HC tanks.

vi
ACKNOWLEDGMENTS
Dr. Patricia Kelley, Dr. Greg Dietl, and Dr. Richard Laws served as my thesis committee
and provided guidance, advice, and revisions to the following work. Dr. Kelley and Dr. Laws are
responsible for all of my learning experiences within the classroom, and Dr. Dietl with the help
of Dr. Kelley is responsible for all of my field methods and experience. The pilot study that led
to this project was funded by the National Science Foundation under grant number EAR-
0755109. Without the use of the Center for Marine Science at the University of North Carolina
Wilmington, this study could not have taken place. I would like to acknowledge Christy Visaggi,
Dana Friend, Greg Burzynski, Patti Mason, and Stephanie White for providing intellectual
debates and questions on this project that helped shape many ideas. Finally, I would like to take
the opportunity to thank any professor who ever taught me something about geology or marine
biology.

vii
LIST OF TABLES
Table Page
1. Rankings of Neverita, Mercenaria, Mya, and Mytilus by energetic value of prey species and prey length (Figure 3), energetic profitability
by the ratio of drilling time: energetic value and prey length
(Figure 4), and preference as prey selected by Neverita predators. From Kitchell et al. (1981) ........................................................................................................................11
2. Weekly Outer Borehole Diameter Ranges for a Noncompetitive
Predator (mm) ....................................................................................................................26
viii
LIST OF FIGURES
Figure Page
1. Cross-section of a borehole of Neverita, showing diameter (D) shell thickness (T) ................................................................................................................2
2. Drilling frequency through time for samples larger than 40 specimens
that represent conspecific cannibalism throughout many stratigraphic units ranging from the Gulf Coastal Plain to the Maryland Coastal Plain, dating from the Cretaceous through the Pleistocene .....................................................................................6
3. Relationship of energetic value of four prey species and prey length ...............................10
4. Cost:benefit curves of four prey species illustrating the relationship of drilling
time: energetic value in weight and prey length ................................................................10
5. Geographic range of Neverita on the eastern coast of the U.S. ........................................13
6. Relationship between outer borehole diameter representative of predator size
and the size of Neverita prey compared to Anadara prey .................................................15
7. Relationship between outer and inner borehole diameters and size of Neverita
predators from completed boreholes only on Mercenaria, Mya, Mytilus, and Neverita prey......................................................................................................................15
8. Eight-sector grid for determining position of boreholes in naticid gastropod shells ..................................................................................................................17
9. Sector designations for left valve for determining position of boreholes
in bivalve shells..................................................................................................................17
10. Cumulative frequency of cannibalistic events within High Competition
tanks by tank number .........................................................................................................20
11. Cumulative frequency of cannibalistic events within Low Competition
tanks by tank number .........................................................................................................21
12. Bivariate regression of internal volume on shell length for Mercenaria prey.................. 21
13. Average number of prey items consumed per predator over ten weeks ............................22
14. Average biomass (measured as internal volume of the prey shell in mL)
consumed per predator over ten weeks ..............................................................................23

ix
15. Mean biomass consumed per week by tank treatment plotted with standard error bars..............................................................................................................24
16. Mean growth rates per week for small naticids within all tanks........................................25
17. Mean growth rates per week for large naticids within all tanks ........................................25
18. Weekly average outer borehole diameter for the non-competitive Control tank naticids .......................................................................................................................27
19. Percent of incomplete boreholes in prey drilled by Neverita by tank................................28
20. Most commonly drilled sectors by Neverita predators in Mercenaria and Neverita by percentage using Figures 8 and 9 ...................................................................29
21. a.) Sector preferences for the Control tank small Neverita to drill in small
and large Mercenaria .........................................................................................................30
b.) Sector preferences for the Control tank large Neverita to drill in small and large Mercenaria .........................................................................................................30
22. Percent of prey consumed by Neverita without being drilled for each tank......................30

INTRODUCTION
Background
Naticid gastropods have been of particular interest to paleoecologists because of the
implications of their Recent predator-prey interactions to the fossil record. Naticids are infaunal
shell-drilling gastropods dating back to the Cretaceous that leave behind preservable predatory
boreholes in the shells of their molluscan prey (Figure 1) (Kelley, 1991). These parabolic-shaped
boreholes are unique to naticids, with the exception of a few species of the gastropod family
Muricidae, and are able to withstand various levels of taphonomic damage, permitting studies of
the evolution of naticid predator-prey interactions (Kelley, 1992). Carriker and Yochelson (1968)
observed drilling by both muricids and naticids and concluded that slower drilling rates by
muricids may account for the differences in borehole geometry; muricid boreholes tend to be
circular and unbeveled. Because of the importance of predation in shallow marine environments,
these specific interactions could be a significant evolutionary force in those environments
(Hagadorn and Boyajian, 1997).
The drilling process involves locating a suitable drilling site on the surface of a prey‟s
shell (Hagadorn and Boyajian, 1997). The prey is enveloped in the naticid‟s large mesopodium
and, over the course of several hours to several days, the snail uses its radula and secretions by
the accessory boring organ to drill a hole, through which it then feeds (Kelley et al., 2001). It is
thought that the chemical agents for dissolution are a mixture consisting of hydrochloric acid,
enzymes, and chelating agents (Carriker and Williams, 1978), although exact composition is
difficult to determine.

2
Optimal Foraging Theory
Optimal foraging theory has been applied to naticid gastropod predation by previous
workers (e.g. Kitchell et al., 1981). Optimal foraging theory operates under the premise that a
predator always should take the prey type with the greatest net energy gained per unit foraging
time (Leighton, 2002). Naticids, like most other marine invertebrate predators, function under
sequential foraging encounters in their natural environment, meaning that they generally
encounter one potential prey item at a time (Leighton, 2002). In these predator-prey systems, the
predator chooses whether to attack the present prey item, or to continue searching (Leighton,
2002). It is important to note that within these systems, the predator does not choose between
prey items, because the predator has not encountered the next prey item yet (Leighton, 2002).
Stephens and Krebs (1986) described that foraging consists of many repetitions of the following
sequence: search – encounter – decide. The ”decision” of an optimally foraging predator to
attack the present prey ( j), as opposed to continuing to search can be described by the following
Figure 1: A cross-section of a borehole of Neverita, showing diameter (D)
shell thickness (T), pris matic shell layer (P), and nacreous shell layer (N).
From W iltse (1980).

3
equation in which the given prey (left side of equation) is evaluated relative to all higher-ranked
prey that are taken (right side of equation):
( [ ej ] / [ hj ] ) ≥ { ( ∑ λiei ) / (1 + [ ∑ λihi ] ) }
(Stephens and Krebs, 1986)
• e = net energy gained
• h = handling time
• λ = encounter rate for the prey type
Each prey type (i) within the system has means ei and hi where e is the benefit minus the
cost in energy [eg – ec], and where cost includes search, pursuit, and handling energy from a
given prey type (Leighton, 2002). Handling time (hi ) is represented as time to subdue the prey
type (Leighton, 2002). A prey item has a fixed mean amount of energy and a fixed mean amount
of time is required to pursue, capture, and consume, which is represented by handling time
(Stephens and Krebs, 1986). Optimally foraging predators should always take the prey type with
the greatest net energy gained per unit time (ei/hi). The option to continue searching would result
in additional loss of energy and time. The encounter rate (λ) is the reciprocal of the time between
encounters (Stephens and Krebs, 1986). If the statement is true, the predator can maximize its net
energy gain per time by consuming the prey; if the statement is false, the predator will continue
searching (Leighton, 2002).
The zero-one rule of optimal foraging describes that in order to maximize energy gained
per unit time, an optimally foraging predator should either always pass over or always take a
given prey type (Leighton, 2002). The probability of taking any given prey type thus should
equal either 0 or 1. Further, once a predator encounters a prey type, the zero-one rule is in effect,
and any prey type that is ever chosen will always be chosen (Leighton, 2002).

4
Many objections to the optimal foraging theory are based on the assumption that
invertebrate predators are able to make complex decisions (Leighton, 2002). However, optimally
foraging predators gain more net energy, and therefore could be favored by natural selection
because they can live longer and produce more offspring (Leighton, 2002). Leighton (2002)
argued that natural selection would tend to favor predators that distinguish between prey types.
Optimal foraging theory has also been criticized for ignoring the role of constraints on
foraging (Sih, 1980). Organisms may be constrained from foraging optimally by abiotic and
biotic factors. Hughes and Burrows (1991) found that optimal foraging by the gastropod Nucella
lapillus was constrained by weather conditions, which affected wave energy and desiccation.
Foraging can also be constrained by biotic factors such as avoidance of predators and reactions
to competitors. Sih (1980) has argued for the importance of avoidance of predation risk in
affecting foraging behavior, as organisms must simultaneously balance feeding and antipredatory
demands. While working with the aquatic insect, Notonecta hoffmanni, Sih (1980) found that
foragers may alter their behavior in a way that reduces the risk of predation.
Mitchell et. al (1990) addressed the influence of competition as a constraint on optimal
foraging. Competition affects resource densities, and the optimal foraging theory predicts that
foraging decisions are partly based on the density of resources; therefore, variation in the
foraging behavior of individuals in response to the density of competitors should influence the
degree of competition (Mitchell et al., 1990). Competition can affect optimal foraging in three
possible ways: 1) Competition could reduce the marginal benefit of foraging relative to the
marginal cost, and individual foraging effort would be reduced; 2) Competition could reduce the
marginal cost of foraging relative to the marginal benefit, and individual foraging efforts would
increase; or 3) Competition may not change the marginal benefit relative to the marginal cost,

5
and individual foraging efforts would remain unchanged (Mitchell et al., 1990). Empirical work
on two species of gerbil (Gerbillus) showed reduced foraging with increase in density of
intraspecific competitors (Mitchell et al., 1990).
Optimal foraging appears to be constrained in the case of cannibalism (Kitchell et al.,
1981; Polis, 1981). Polis (1981) stated that when prey are ranked by weight/volume, the
frequency of consumption of conspecifics (cannibalism) may be lower than expected, even
though they are present as a significant food source.
Cannibalism
Cannibalism has implications for both competitive and predator-prey interactions, and
therefore should be included when considering constraints on optimal foraging. Polis (1981)
called cannibalism a major aspect of the biology of many species, affecting the population
structure, life history, competition for mates and resources, and behavior. Extant naticids are
frequently cannibalistic, in both the conspecific (Carriker, 1951; Kitchell et al., 1981) and
confamilial sense. Confamilial predation has been detected as early as the Cretaceous (Kelley,
1991), and has increased through the Pleistocene in the Gulf and Atlantic Coastal Plains of the
U.S. (Kelley and Hansen, 2007). In fossil assemblages where more than one naticid species is
found, however, it can be difficult to distinguish conspecific from confamilial cannibalism
because of the similarity of boreholes among naticid species (Kelley, 1991; Dietl and Kelley,
2006). Observation of extant naticid behavior implies that many extinct naticids could have been
conspecific cannibals, particularly in fossil assemblages dominated by a single species (Kelley,
1991). Kelley and Hansen (2007) found the frequencies of true conspecific cannibalism
throughout many formations ranging from the Gulf Coastal Plain to the mid Atlantic Coastal

6
Plain, dating from the Cretaceous through the Pleistocene (Figure 2). True cannibalism was
recognized by the absence of other confamilial predators within a fossil assemblage, leading to
the conclusion that actual conspecific cannibalism was occurring. The frequency of true
cannibalism in naticids varies considerably throughout the geologic past ranging from 1-35%
(Figure 2).
Kitchell et al. (1981) found by behavioral observations of extant naticids that interactions
between dissimilar-sized Neverita duplicata ended in prompt, successful capture and
consumption of the smaller individual. However, interactions between similar-sized Neverita
duplicata never resulted in one succeeding over the other. Ziemba et al. (2000) also explained
that size variation is often a result of differences in age, and that when conspecifics of different
ages cohabitate, there can be strong, asymmetric competitive and predatory interactions among
age classes.
0
0.05
0.1
0.15
0.2
0.25
0.3
0.35
0.4
Dri
llin
g fre
qu
en
cy
Stratigraphic level
Figure 2: Drilling frequency through time fo r samples larger than 40 specimens that represent
conspecific cannibalis m throughout many stratigraphic units ranging from the Gulf Coastal Plain
to the Maryland Coastal Plain, dating from the Cretaceous through the Pleistocene. Abbreviations
for stratigraphic levels: R, Rip ley; RB, Red Bluff; MS, Mint Spring; BY, Byram; BE, Belgrade;
CA, Calvert; D, Drumcliff; LC, Little Cove Point; WP, Windmill Po int; MH, Moore House; CR,
Chowan River; JC, James City/Waccamaw. From Kelley and Hansen (2007).

7
There are many possible reasons for cannibalism to play a major role within a species,
including nutrient deficiencies, food scarcity, and lack of availability of alternate prey (Polis,
1981). Low availability of food increases the amount of foraging time, which can leave animals
weak from expending energy without successful consumption and therefore susceptible to being
cannibalized (Polis, 1981).
Dietl and Alexander (2000) considered naticid cannibalism a much more complex
interaction than predation on bivalve prey because of the prey‟s ability to escape predation and
attack its predator, unlike bivalve prey. Furthermore, in modern environments (and presumably
in the geologic past), naticids are forced to challenge both conspecific and confamilial
competitors for necessary resources (Kitchell et al., 1981; Dietl and Alexander, 2000) to the
extent of becoming their predators or prey (Dietl and Alexander, 2000).
Two contrasting hypotheses have been proposed concerning naticid cannibalism: 1)
naticid cannibalism is anomalous and is associated with the unavailability of bivalve prey
(Carriker, 1951); and 2) naticid cannibalism is a predictable result of selective predation that
maximizes energy gain per unit foraging time (Kitchell et al., 1981; Kelley, 1991).
Many studies have found results that challenge Carriker‟s hypothesis. Cannibalism can be
maladaptive and result from stress, accidents or possibly laboratory conditions; however, other
cannibalism can occur as normal feeding behavior (Polis, 1981). Based on the theory of optimal
foraging and previous observations of extant species, cannibalism should be a natural
occurrence, not an anomalous occurrence. For this reason, Kitchell et al. (1981) and Kelley
(1991) argued that naticids should be favorable prey items to other, larger naticid individuals.
Because chemosensory predators, like naticids, are less able to quickly survey total prey
availability of an area, estimates of prey are more likely to be mistaken than those of visual

8
predators (Kitchell et al., 1981). By modifying the optimal foraging theory, prey preferences of
chemosensory predators (specifically extant naticids) have been predicted accurately by using
Kitchell et al.‟s (1981) energy maximization model, which involves calculating cost:benefit
ratios of potential naticid prey:
Ei = EiSi Ti Hi + Ri
• Ei = energetic value
• Ti = time cost • Si = success probability • Hi = handling time
• Ri = recognition for prey type i
Energetic value (Ei ) of prey is derived from biomass, correlated with the internal volume
of the shell. Energetic content of the prey is assumed to be equivalent to energetic benefit to the
predator (Kitchell et al., 1981) as naticids generally ingest their prey entirely (Kelley, 1988).
Handling time (Hi) is correlated with drilling time, which Kitchell et al. (1981) explained is a
function of shell thickness, and is greater than capture time and consumption time. Kitchell et at.
(1981) described drilling time as a measure of essential costs lost before benefit can be returned
to the predator by ingestion. Ingestion time (Ti ) is related to prey biomass (Kitchell et al., 1981).
Recognition time (Ri ) was found to be negligible. The success probability (Si ) is highly
dependent on the prey:predator size ratio, and is included in the equation because drilling may be
interrupted and a borehole left incomplete with a net energetic loss (Kitchell et al., 1981).
Kitchell et al. (1981) stated that this model assumes that the predator is food- limited and that
prey are substitutable rather than complementary.
9
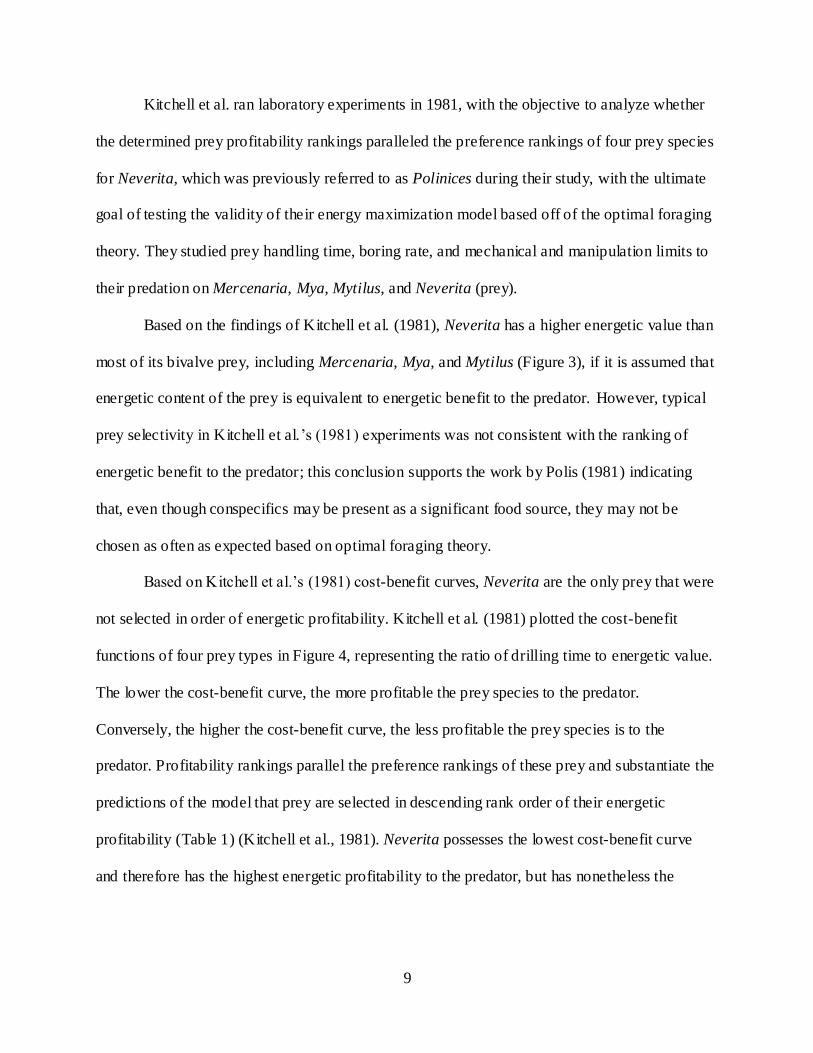
Kitchell et al. ran laboratory experiments in 1981, with the objective to analyze whether
the determined prey profitability rankings paralleled the preference rankings of four prey species
for Neverita, which was previously referred to as Polinices during their study, with the ultimate
goal of testing the validity of their energy maximization model based off of the optimal foraging
theory. They studied prey handling time, boring rate, and mechanical and manipulation limits to
their predation on Mercenaria, Mya, Mytilus, and Neverita (prey).
Based on the findings of Kitchell et al. (1981), Neverita has a higher energetic value than
most of its bivalve prey, including Mercenaria, Mya, and Mytilus (Figure 3), if it is assumed that
energetic content of the prey is equivalent to energetic benefit to the predator. However, typical
prey selectivity in Kitchell et al.‟s (1981) experiments was not consistent with the ranking of
energetic benefit to the predator; this conclusion supports the work by Polis (1981) indicating
that, even though conspecifics may be present as a significant food source, they may not be
chosen as often as expected based on optimal foraging theory.
Based on Kitchell et al.‟s (1981) cost-benefit curves, Neverita are the only prey that were
not selected in order of energetic profitability. Kitchell et al. (1981) plotted the cost-benefit
functions of four prey types in Figure 4, representing the ratio of drilling time to energetic value.
The lower the cost-benefit curve, the more profitable the prey species to the predator.
Conversely, the higher the cost-benefit curve, the less profitable the prey species is to the
predator. Profitability rankings parallel the preference rankings of these prey and substantiate the
predictions of the model that prey are selected in descending rank order of their energetic
profitability (Table 1) (Kitchell et al., 1981). Neverita possesses the lowest cost-benefit curve
and therefore has the highest energetic profitability to the predator, but has nonetheless the

10
lowest prey preference ranking, even lower than the less profitable Mercenaria (Kitchell et al.,
1981).
Although energy expended to capture naticid prey is much more substantial than that
expended on the capturing of bivalve prey because of the mobility of the naticid, the thin naticid
shell can be bored at a much more rapid rate after capture and manipulation (finding a suitable
drilling site) (Kelley and Hansen, 2007). The low cost-benefit ratio of cannibalism as compared
to predation on their thicker bivalve counterparts suggests that naticids can be more profitable
than bivalve and non-naticid gastropod prey (Kelley and Hansen, 2007).
Kitchell et al. (1981) rejected their null hypothesis that prey selection by naticid
gastropods is random with respect to prey species or prey size, and explained that both
interspecific and intraspecific selection of prey proceed in descending rank order of prey
profitability. Based on their studies, prey selection by Neverita followed the energy
Figure 3: Relat ionship of energetic value (i.e.
energetic benefit) of four prey species
and prey length. (Polinices is now referred to
as Neverita.) From Kitchell et al. (1981).
Figure 4: Cost: benefit curves of four prey
species illustrating the relationship of drilling
time Ht(hr):energetic value in weight E(kJ) and
prey length. (Polinices is now referred to as
Neverita.) From Kitchell et al. (1981).

11
Most Least
Energetic Value Neverita Mercenaria Mya Mytilus
Energetic Profitability Neverita Mya Mercenaria Mytilus Preference as prey Mya Mercenaria Mytilus Neverita
maximization premise, but they emphasized that extrapolation and generalization should be done
with caution (Kitchell et al., 1981).
High profitability may not serve as the sole benefit of conspecific cannibalism.
Cannibalism also serves the function of reducing competition and potential predation (Kelley,
1991). Polis (1981) argued that cannibalism regulates communities by controlling population
fluctuations and should be favored by natural selection. Cannibalism creates a more stable
population that is dominated by vigorous individuals and therefore achieves increased resistance
to extinctions (Polis, 1981).
The debate over the nature of naticid cannibalism continues today. This study will
address the following questions: 1) does the level of competition, including predation threat,
among conspecific naticid predators (Neverita duplicata) affect their cannibalistic behavior (as
implied by departures from optimal foraging noted by Kitchell et al. 1981 for Neverita prey); and
2) does the availability or lack of bivalve prey affect cannibalistic behavior among conspecific
naticid predators?
Table 1: Rankings of Neverita, Mercenaria, Mya, and Mytilus by energetic value of prey species and prey
length (Figure 3), energetic profitability by the ratio of drilling time: energetic value and prey length (Figure
4), and preference as prey selected by Neverita predators. From Kitchell et al. (1981).

12
PURPOSE
The purpose of this research is to determine whether or not conspecific competition
and/or predation threat has an effect on the frequency of cannibalism among the naticid Neverita
duplicata in the presence of bivalve prey, and if conspecific cannibalism depends on the absence
of bivalve prey. By interpreting the conditions under which cannibalism occurs in extant
naticids, it could be possible to eventually apply this knowledge to the fossil record to further
understand the biological structure of paleocommunities, as well as the evolution of their
predator-prey interactions.
HYPOTHESIS
Because cannibalism may benefit the predator by reducing competition, I hypothesized
that naticid cannibalism is more likely in high competition (HC) environments than in low
competition (LC) environments and does not depend on the presence of bivalve prey.
METHODS
Experimental Setup
Ecological factors and interactions have a large effect on the ability of a predator to
search for and capture food resources, including: food abundance and distr ibution, habitat
structure, predation risk (Whelan and Brown, 2005), and competition along with abiotic factors
(Claessen et al., 2003). Taking these factors into consideration, a twelve tank experiment was
created and maintained in the wet laboratory at the Center for Marine Science (CMS) at
University of North Carolina Wilmington in Wilmington, North Carolina, using Neverita

13
duplicata (previously referred to as Polinices duplicatus) because of its abundance and long
stratigraphic and geographic range on the eastern coast of the U.S. (Figure 5). Standard 38 liter
(10 gallon), 51cmx25cmx30cm, tanks were kept within an open seawater system from the
IntraCoastal Waterway, a few hundred meters away, in order to replicate the natural environment
as much as possible.
Tanks were provided with
constant minimal light as some previous
studies have concluded that the light
regime did not modify feeding behavior
(Kitchell et al., 1981). The substrate was
made up solely of medium to coarse sand.
This was the easiest substrate to use in order to keep track of all animals included. Naticids are
able to function in most substrates from coarse sand to mud, although Kingsley-Smith et al.
(2003) found in the absence of substrate, or even with very small amounts of substrate (1-2cm)
Polinices pulchellus will maintain their natural behaviors. However, during a pilot experiment,
Neverita did not appear to behave normally or consume prey, so each tank was provided with
approximately 7cm of substrate to allow each Neverita the option to consume prey infaunally, as
they naturally would. The focus of this study does not require the observation of the drilling
process.
Over 50 Neverita duplicata were collected by hand, solely from the UNCW Research
Lease on Masonboro Sound in Wilmington, North Carolina, during periods of low tide when
their trails are clearly visible in the sand (Carriker, 1951). Mercenaria mercenaria were
purchased to serve as bivalve prey from a hatchery at Sea Level, North Carolina, on Core Sound.
Figure 5: Geographic range of Neverita on the eastern coast of
the U.S. From Malaco log (2010). (Photo courtesy of Dana
Friend.)

14
Although bivalve prey were not collected at the same locality as the naticids, these species do co-
exist in their intertidal environment.
Two size classes of naticids (small: 14-16mm, large: 25-26mm) were used in order to test
Kitchell et al.‟s (1981) observations on the cannibalistic interaction between dissimilar sized
naticids. Consequently, two different sizes of Mercenaria were provided, 7-13mm and 15-
23mm. The reasons for providing two different size groups of bivalve prey are: 1) Large
Neverita may perceive the 7-13mm Mercenaria as too small to expend energy to drill because
they would receive little energy in return to sustain their body mass; 2) small Neverita may
recognize the 15-23mm Mercenaria as too large, and they may cost too much energy to drill,
while 7-13mm Mercenaria that are easier to prey upon can sustain their body mass. It is
important that both size groups of Neverita have the option to select prey that are optimal in
terms of cost-benefit ratio. However, it is important to note that by using Kitchell et al.‟s (1981,
p. 541) prey selection graphs using Anadara prey (similar to Mercenaria) (Figure 6), and figure
plotting the relationship between outer and inner borehole diameters vs. the size of Neverita
predator (Figure 7), all bivalve prey are well within the range of manipulation by both size
categories of Neverita.
The first three tanks set up contained only one small naticid, while the second three tanks
contained only one large naticid. These first six tanks served as my controls in order to monitor
feeding rates with no competition involved.
The other half of the tanks were the experimental tanks, which were used to test the
effects of conspecific competition. The first set of three contained four Neverita predators per
tank (two small, two large), representing a high competition environment (HC). The last set of

15
three tanks contained two Neverita predators per tank (one small, one large), representing a low
competition environment (LC).
All twelve tanks were provided with three small (7-13mm) Mercenaria to start, and were
replenished to three again every 2-3 days as they were consumed. The decision to provide three
Mercenaria per tank was to support the foundation of the competitive environments. By
providing only three Mercenaria prey for the four naticid predators in the High Competition
tanks, the environment then was truly highly competitive as I forced them to compete for limited
resources, creating an „odd man out‟ scenario. Providing three Mercenaria for the Low
Competition tanks sustained a level of low competition, but competition nonetheless, for the
limited resources. Providing the Control tanks with three Mercenaria supported the controlled
environment and supplied all twelve tanks with a consistent amount of bivalve prey.
Each consumed prey item (Mercenaria or Neverita) was removed, collected, and stored
by tank number, competition level, and consumption date for later measurements, and then
Figure 6: Relat ionship between outer borehole
diameter representative of predator size and the
size of Polinices (now Neverita) prey compared to
Anadara prey. From Kitchell et al. (1981).
Figure 7: Relat ionship between outer and inner
borehole diameters and size of Polinices (now
Neverita) predators from completed boreholes
only on Mercenaria, Mya, Mytilus, and
Polinices prey. From Kitchell et al. (1981).

16
replaced with a live prey item of the same species. Neverita was always replaced with the same
size, but replacement sizes of Mercenaria varied. Determining which size category of
Mercenaria was added was randomized by flipping a coin. By comparing the non-competitive
feeding rates from the Control tanks, any changes in feeding behavior due to competitive
conditions could be observed in the Experimental tanks.
This experiment ran ten weeks, starting July 8, 2009, and running until September 20,
2009. This time was chosen because many results of similar experiments indicated that the
maximum consumption rates for naticids occur in late summer (Edwards and Huebner, 1977;
Kingsley-Smith et al., 2003). The experiment ran until a significant drop in consumption rates
was witnessed, thought to be related to a drop in water temperature in mid September, which
correlated with Edwards and Huebner‟s (1977) findings that feeding rates appear to be direct
linear functions of both temperature and predator size. Temperatures ranged from 24.7-30.0°C
from the beginning of July through the ten week period.
Data Collected
Linking each consumed prey shell with the correct predator is critical. Determining the
responsible predator can be accomplished using the size of the inner and outer bore holes.
Following previous work (e.g., Kelley 1988), I recorded several measurements for each drilled
specimen:
1) Outer (OBD) and inner borehole diameters (IBD). Kitchell et al. (1981) and Kelley
(1991) stated that the OBD measurement is more highly correlated with the size of the predator
than the IBD, and therefore, the more important measurement in this experiment (Figure 7). The

17
ranges of borehole diameters produced by snails of a known size in the Control tanks was used to
determine which predator (large or small) in the Experimental tanks drilled a given prey item.
2) Completion of boreholes. With removed shells, it was also possible to witness
evidence of unsuccessful drilling attempts. Possible reasons for these unsuccessful attempts
could be related to competition (interruptions of the drilling process by other snails), escaping of
prey (after the borehole penetrates the shell, but before the prey is eaten; Kelley and Hansen,
2003; Ishikawa and Kase, 2007) or possibly interruption by artificial means (stirring of water by
removal and replacement of predators).
3) Borehole siting. By assigning borehole site on each
drilled specimen using grids created by Kelley in 1988 and 1991
(Figures 8 and 9), it is possible to identify the most commonly
drilled sectors in Mercenaria and Neverita drilled by Neverita.
Determining drillhole site is useful because boreholes
outside of commonly drilled sectors could be an indication
of competitive pressure, forcing handling and manipulation
times to accelerate.
4) Growth rate. Through the experiment, it was
possible to keep track of the growth rate of each snail by
measuring the snail‟s shell. The purpose was to be able to
standardize feeding rate over the duration of the
experiment, as feeding rates might change with
growth. One problem that could not be avoided is
that the Control tanks had almost unlimited prey availability, which could maximize the potential
Figure 8: Eight-sector grid for
determining position of boreholes in
naticid gastropod shells. From Kelley
(1991).
Figure 9: Sector designations for left valve for
determining position of boreholes in bivalve
shells. Sector designations for right valve are
the mirror image of these. From Kelley (1988).

18
growth rate of the Control snails, whereas snails in the Experimental tanks competed, and most
likely went for some days or weeks without food, substantially slowing their potential or optimal
growth rates.
Feeding rates were based on the number of prey items bored during the ten week period
and then further analyzed by calculating internal volume (a proxy for biomass) of prey consumed
by each naticid individual. To determine internal volume (a proxy for biomass), I measured
internal volume (using fine-grained sand and a 10mL graduated cylinder) and length of a subset
of shells spanning the range of sizes of drilled Mercenaria, then regressed internal volume on
length. I used the regression equation to determine the internal volume of each drilled
Mercenaria. Because of the small size variation of Neverita prey, I calculated an average range
of biomass on drilled specimens by measuring the internal volume with fine-grained sand.
Cumulative frequency of cannibalism for both HC and LC tanks was plotted. It was
anticipated that behavioral interactions between predators would either increase feeding or
reduce feeding if predators became more cautious (Edwards and Huebner, 1977). Some studies
have even observed larger snails taking partially ingested prey away from smaller snails
(Edwards and Huebner, 1977). One indication of increased stress due to competition occurring
would be a high rate of interrupted (or abandoned) boreholes.
RESULTS
Prey Consumption
Cannibalism did not occur in the HC tanks until seven weeks after the start of the
experiment (Figure 10), despite the fact that predator density was much greater than under

19
normal conditions and that small naticids were continuously available as prey. However,
contrary to my hypothesis, cannibalism occurred in all three LC tanks, appearing in the first
week of the experiment as a last resort when all bivalve prey had been consumed in tank 3LC
(Figure 11). Cannibalism of the small naticid in these tanks then began occurring before and
sometimes instead of the consumption of bivalve prey.
The naticid in CL2 died from zero consumption after six weeks. It was replaced with a
new predator of similar size. Therefore the consumption rate for CL2 was averaged over a four
week period instead of the ten week period for all other tanks.
Prey consumption per predator was usually much higher (from 1-4 more prey items per
week) in the Control tanks than in the Experimental tanks throughout the duration of the
experiment (Figure 13). Comparison (using t-tests) of Control and Experimental tanks showed a
significant difference in consumption by Neverita of 5.1 prey/week under no competition versus
2.2 prey/week under HC conditions (t = 5.8, p < 0.0001, n = 20), and 3.8 prey/week under LC
conditions (t = 2.27, p < 0.017, n = 20). HC and LC feeding rates were also significantly
different (t = -4.49, p < 0.0001, n = 20).
By using the calculated regression line for the internal volume of Mercenaria (Figure 12),
I was able to witness that the Control tanks demonstrated much higher biomass consumption per
predator/week with an average of 2.76mL of prey consumed, with the small Control snails
averaging 2.58mL of prey versus the large Control snails, which consumed an average of
2.93mL of prey per predator/week. In comparison, the naticids in the Experimental tanks showed
a significantly lower rate of biomass consumption (t = -3.53, p < 0.0027, n = 12) with an average
of 1.45mL of prey per predator/week. Snails in the HC tanks consumed an average of 1.22mL,

20
and snails in the LC tanks averaged 1.78mL per predator/week (Figure 14). When plotting mean
biomass consumed per week by predator within tank treatments (Figure 15), similar trends result.
Results indicate no starvation period directly prior to cannibalistic events. Biomass consumption
2-3 days before cannibalistic events was not substantially lower, which could have possibly
explained the basis for cannibalism, based on the energetic value of Neverita prey over
Mercenaria (Kitchell et al., 1981). Additionally, there was no frequent evidence of energetic loss
without return represented by incomplete or failed drilling attempts (Kitchell et al., 1981)
directly prior to cannibalistic events, which could have also explained the subsequent
cannibalism.
0
3
6
9
12
15
Nu
mb
er
of
tota
l eve
nts
Week
Cumulative Frequency of Cannibalism in High Competition Tanks
HC2
HC3
HC1
Figure 10: Cumulative frequency of cannibalistic events within High Competition t anks by tank number.
Abbreviations for tanks: HC1, High Competition Tank 1; HC2, High Competit ion Tank 2; HC3, High
Competition Tank 3.

21
0
3
6
9
12
15
Nu
mb
er
of
tota
l eve
nts
Week
Cumulative Frequency of Cannibalism in Low Competition Tanks
LC1
LC2
LC3
y = 0.0864x - 0.6812
R² = 0.935
0
0.2
0.4
0.6
0.8
1
1.2
1.4
1.6
0 5 10 15 20 25
Inte
rnal
Vo
lum
e (
mL)
Length (mm)
Internal Volume vs. Length of Mercenaria prey
Figure 11: Cumulative frequency of cannibalistic events within Low Competition t anks by tank number.
Abbreviations for tanks: LC1, Low Competit ion Tank 1; LC2, Low Competition Tank 2; LC3, Low Competit ion
Tank 3.
Figure 12: Bivariate regression of internal vo lume on shell length for Mercenaria prey.

22
Figure 13: Average number of prey items consumed per predator over ten weeks. Abbreviations for tanks:
HC, High Competit ion; LC, Low Competit ion.

23
Figure 14: Average biomass (measured as internal volume of the prey shell in mL) consumed per predator over
ten weeks. Abbreviations for tanks: HC, High Competition; LC, Low Competition.

24
Growth Rates
Growth rates of the small naticids in the Control tanks were fairly substantial; Control
snails started at 14-16mm in July and grew to a size of 21-24mm. During collection, field
observations indicated that adult Neverita in their environment reach a maximum of ~30-35mm.
Predictably, large naticids in the Control tanks had less substantial growth rates, starting between
25-26mm and ending between 27-29mm with a nearly limitless food supply and no competition.
Because of the frequent replacement of small naticids that had been consumed as prey in
the Experimental tanks, the short length of time in the experiment kept them between 14-16mm,
with the exception of HC2 (which never cannibalized), in which the small naticids grew to
16mm and 19mm. Because of the extreme competition involved in the HC tanks, the large
naticids that started out at 25-26mm ended between 25-27mm with extremely (if any) low
0.00
1.00
2.00
3.00
4.00
ConSm ConLg HC LC
Bio
mas
s C
on
sum
ed
pe
r W
ee
k (m
L)
Treatment
Mean Biomass Consumed Per Week by Predator
Figure 15: Mean biomass consumed per week by tank treatment plotted with standard error bars.
Abbreviations for tanks: ConSm, Control small; ConLg, Control large; HC, High Competit ion; LC,
Low Competition.

25
growth rates. Still, despite the competition in the LC tanks, the large naticids grew from 25-
26mm at the start to 28-31mm at the end of the experiment. See Figures 16 and 17.
0 0.1 0.2 0.3 0.4 0.5 0.6
LC Small
HC Small
Con Small
Growth per week (mm)
Mean Growth Rates Per Week for Small Naticids
0 0.1 0.2 0.3 0.4 0.5 0.6
LC Large
HC Large
Con Large
Growth per week (mm)
Mean Growth Rates Per Week for Large Naticids
Figure 16: Mean growth rates per week for small naticids within all tanks. Abbreviations for tanks:
Con Small, Control s mall snails; HC Small, High Competition small snails; LC Small, Low
Competition s mall snails.
Figure 17: Mean growth rates per week for large naticids within all tanks. Abbreviations for tanks:
Con Large, Control large snails; HC Large, High Competit ion large snails; LC Large, Low
Competition large snails.

26
Boreholes
Using the outer borehole diameter ranges from the Control tanks, it was possible to
determine which naticid predator (large or small) was responsible for a particular drilling attempt
in the Experimental tanks. However, this approach is complicated by the fact that the small
Control snails grew throughout the experiment, producing a larger range of borehole diameters
than would be produced by the small Experimental snails, which did not grow significantly
(Figures 16 and 17). As a result, there is some considerable overlap in drilling ranges during
some weeks--meaning the largest OBD value for a small naticid overlaps the smallest OBD
value for a large naticid (Table 2 and Figure 18). Outer borehole diameter ranges of the small
Control snails and the large Control snails overlapped from as early as the second week of the
experiment (Table 2), indicating that the overlapping of outer borehole diameters may not be an
artifact of significant growth rates by the small Control snails.
Small Naticid Large Naticid
Wk1 1.20-1.90 2.20-2.50
Wk2 1.50-2.00 1.60-2.70
Wk3 1.25-2.15 1.50-2.80
Wk4 1.35-2.15 2.00-2.70
Wk5 1.80-2.35 2.10-2.70
Wk6 1.70-2.40 2.10-2.70
Wk7 1.60-2.40 2.00-2.80
Wk8 1.90-2.80 2.00-3.30
Wk9 1.40-2.50 2.10-3.15
Wk10 1.90-2.60 2.25-2.95
TOTAL 1.20 - 2.80mm 1.50 - 3.30mm
Table 2: Weekly outer borehole diameter ranges for a noncompetit ive predator (mm).

27
Figure 18: Weekly average outer borehole diameter (OBD) for the non-competit ive Control tank naticids.

28
However, many predation events produced boreholes that were well within a known
individual‟s drilling range. Of the five cannibalistic events taking place within the HC tanks, the
large naticid was responsible for two, and the small naticid was responsible for one (two events
were unclear due to overlapping ranges of bore hole sizes by large and small naticids). On the
other hand, in the LC tanks the large naticid was responsible for all thirty-one cannibalistic
events.
All but one tank (Control large tank 2) had evidence of failed or abandoned predation
indicated by incomplete boreholes (Figure 19). In all other tanks, the percent of incomplete
boreholes ranged between 2-6%, with the exception of Cs1 (Control small tank 1) and LC3 (Low
Competition tank 3). In Cs1, 9% of boreholes were incomplete, while in LC3, 14% were
incomplete. Incomplete boreholes within the entire experiment averaged 5.5% of all boreholes.
Figure 19: Percent of incomplete boreholes of drilled prey by Neverita for each tank. Abbreviations of
tanks: Cs1, Control small tank 1; Cs2, Control s mall tank 2; Cs3, Control s mall tank 3; CL1, Control large
tank 1; CL2, Control large tank 2; CL3, Control large tank 3; HC1, High Competition tank 1; HC2, High
Competition tank 2; HC3, High Competition tank 3; LC1, Low Competit ion tank 1; LC2, Low
Competition tank 2; LC3, Low Competit ion tank 3.
0
2
4
6
8
10
12
14
16
Cs1 Cs2 Cs3 CL1 CL2 CL3 HC1 HC2 HC3 LC1 LC2 LC3
% o
f in
com
ple
te b
ore
ho
les
Tank
Percent of Incomplete Boreholes of Drilled Prey

29
The percent of incomplete boreholes in the Control tanks averaged 5.2%, while the
Experimental tanks had an average of 5.8% incomplete boreholes. The small naticid was
responsible for five abandoned drilling attempts, and the large naticid abandoned four shells
without completing the borehole in the HC tanks. In the LC tanks, the small naticid was
responsible for four abandoned drilling attempts, and the large naticid abandoned ten shells
without completing the borehole.
Position of the borehole on the shell of all drilled prey is shown in Figure 20. Of the 726
predation events on Mercenaria, 74% of boreholes were drilled in Sector 1, 25% were drilled in
Sector 2, and ~1% were drilled in Sectors 3 and 4. Of the 39 cannibalistic events on Neverita,
51% of boreholes were drilled in Sector 2, followed by 46% bored in Sector 3, leaving the last
3% drilled in Sector 4.
Borehole position varied somewhat with size of both predator and prey. Small naticids
within the Control tanks preferred drilling small Mercenaria in Sector 1 (63%) and Sector 2
(37%). Control small naticids also preferred drilling large Mercenaria in Sector 1 (83%) and
Sector 2 (17%) (Figure 21a). Large Control naticids drilled small Mercenaria less frequently in
Sector 1 (42%) than Sector 2 (58%). Large Control naticids preferred drilling large Mercenaria
Figure 20: Most
commonly d rilled
sectors by Neverita
predators in
Mercenaria (left) and
Neverita (right) by
percentage using
Figures 8 and 9 from
Kelley (1991, 1988).

30
in Sector 1 by 89% over Sector 2 with 11% (Figure 21b). All drilling events outside of Sectors 1
and 2 were within the Experimental tanks.
a. b.
Figure 21: a.) Sector preferences for the Control s mall snails to drill in s mall (left) and large (right)
Mercenaria. b.) Sector preferences for the Control large snails to drill in s mall (left) and large (right)
Mercenaria. Sector designations used for left valve for determining position of boreholes in bivalve shells.
Sector designations for right valve are the mirror image of these. From Kelley (1988).
0
2
4
6
8
10
12
14
16
18
Cs1 Cs2 Cs3 CL1 CL2 CL3 HC1 HC2 HC3 LC1 LC2 LC3
% o
f p
rey
Tank
Percent of Prey Consumed Without Drilling
Figure 22: Percent of prey consumed by Neverita without drilling for each tank. Abbreviations of tanks:
Cs1, Control small tank 1; Cs2, Control s mall tank 2; Cs3, Control s mall tank 3; CL1, Control large tank 1;
CL2, Control large tank 2; CL3, Control large tank 3; HC1, High Competition tank 1; HC2, High
Competition tank 2; HC3, High Competition tank 3; LC1, Low Competit ion tank 1; LC2, Low Competit ion
tank 2; LC3, Low Competit ion tank 3.

31
There were also a total of 81 undrilled predation events (all on Mercenaria). Undrilled
predation events were identified as entirely consumed prey completely lacking a borehole
(complete or incomplete). Forty-four percent of the 81 undrilled prey were found in the six
control tanks with no competitive predators present, with 33% found in the HC tanks, and the
remaining 22% found in the LC tanks. All prey were found undrilled and entirely consumed. All
twelve tanks had evidence of consumption without drilling. The tanks had an average percentage
rate of 10.5% of prey consumed without any attempt to drill, with tank LC2 having the lowest
percent (4%), and Cs1 and CL2 having the highest percent consumed, undrilled prey (17%)
(Figure 22).
DISCUSSION
Prey Consumption
It appears that the majority of cannibalism among the naticid predator, Neverita
duplicata, occurs under levels of normal competition, represented by the Low Competition tanks.
Based on this evidence, it does not appear that cannibalism represents a strategy to reduce
competition under highly competitive circumstances. The frequent cannibalism within the LC
tanks thus supports the hypothesis that, under low competition conditions, cannibalism depends
on the size ratio of the two naticids (Kitchell et al., 1981). The level of competition in the LC
tanks may be more similar to competitive conditions in the field. The level of competition within
the High Competition tanks was hypercompetitive and did not represent natural competitive
conditions, which could explain the infrequent cannibalism. Rarely are four naticids found
naturally in such close proximity to one another and contained in such a small area. High levels
of cannibalism may thus indicate intermediate levels of competition. Too much competitive

32
pressure seems to raise cautiousness and awareness of added potential predators. Predation risk
thus provided a constraint on cannibalism in the HC tanks. This result may help explain why
prey were not selected in rank order of energetic profitability as found by Kitchell et al. (1981).
Greater risk to naticid predators also may account for the decreased feeding rates in the
Experimental tanks compared to the Control tanks, especially in the HC tanks in which the least
amount of prey items and biomass per week were consumed. Because of the reduced feeding
rates within the Experimental tanks, competition and predation threat appear to be constraints on
foraging behavior. The work of Sih (1980) on the aquatic insect Notonecta hoffmanni also
revealed that, although foragers were rarely killed by predators, the need to avoid predators
reduced their feeding rate. Ziemba et al. (2000) agreed that smaller conspecifics may reduce their
feeding rate in the presence of larger individuals to reduce the risk of detection and possible
cannibalism by balancing the benefits of energy intake with the risks of predation while foraging.
In the presence of a predator, threat-sensitive individuals may forage less since foraging
movements attract the attention of potential predators (Ziemba et al., 2000). If smaller
individuals reduce feeding in the presence of larger individuals, this could lead to greater
variance in feeding rates, a positive relationship between size and feeding rate, and increased size
variation (Ziemba et al., 2000).
The absence of a starvation period immediately prior to a cannibalistic event, along with
the lack of evidence for energetic loss without return represented by incomplete or failed drilling
attempts, rejects this idea as a basis for cannibalism.
The experimental design and setup proved to be fairly representative of the naticid‟s
natural environment. Although the species density may not have been typical of field conditions,
the established abiotic factors represented a stable and realistic environment. This conclusion is

33
supported by egg collar production being absent. Naticids will produce egg collars when under
abiotic stress due to the threat of mortality. All differences in prey consumption were thus a
result of biological factors.
Growth Rates
As shown in Figures 16 and 17, growth rates of the large naticid within the LC tanks
were far more substantial than those of the large Control snails and the large HC snails. One
possible explanation would be that an enhanced diet (surplus of cannibalism) could maximize
potential growth rates. Polis (1981) and Claessen et al. (2000) added that the growth rate of a
cannibal may be much larger than that of noncannibalistic conspecifics, resulting in phenotypic
differences, or “cannibalistic polyphenism.” Polis (1981) suggested that cannibalism may be an
adaptation to promote higher fitness by the increasing nutrient availability provided by the
consumption of conspecifics. However, it is also important to note that, even though cannibalism
appears to be associated with the normal feeding behavior of naticids, some cannibalism may
result from or be enhanced by stressful conditions (Polis, 1981).
During random sampling along the Atlantic Coastal Plain, Carriker and Gruber (1999)
found that North Carolina Polinices had a mean height of 34.3mm. Therefore, it is very possible
that the large Control naticids grew at a much slower rate as compared to the small Control
naticids because they had already reached maturity. The threat of behavioral interactions
between Neverita in the competitive (Experimental) tanks was most likely the culprit for the
reduced growth rates (Edwards and Huebner, 1977).

34
Boreholes
Kitchell et al. (1981) suggested that outer and inner diameters of a series of boreholes
drilled by a single predator are comparatively fixed with the relationship between predator size
and borehole diameters being highly significant. Wiltse (1980) found similar results to the
present study while conducting laboratory experiments with Neverita, confirming the ability of a
single sized predator to have a range of OBD measurements.
Because Mercenaria were well within the size range of manipulation for both size
categories of Neverita, there are two main causes for incompleteness of boreholes in this study:
1) artificial disturbances by the mixing of sediment during replacement of predators and prey, or
2) abandonment due to a larger predator interrupting the drilling process. There was a 95%
completion rate for boreholes, leaving 5% of boreholes incomplete.
Artificial disturbances are most likely responsible for the 5.2% incomplete boreholes in
the Control tanks. The Experimental tanks shared a similar 5.8% rate of incomplete boreholes,
which suggests that the competitive interactions may not have played an important role in the
abandoning of half-drilled prey since drilling in Control and Experimental tanks were disrupted
equally. This idea is supported by the fact that the incomplete boreholes were abandoned equally
by both the small and large naticid in the HC tanks, as evidenced by measuring the outer
borehole diameters. Additionally, in the LC tanks, the large naticid abandoned twice as many
boreholes than the small naticid. However, the greater frequency of 14% incomplete boreholes
for LC3 (Low competition tank 3) could be attributable to intense competition from the larger
predator within the tank (Figure 19). The abandonment of boreholes before completion could be
attributed to the threat of competitive interactions.

35
Behavioral responses between interacting Neverita can generate “vigorous avoidance
reactions” (Edwards and Huebner, 1977, p. 1230). Dietl and Alexander (2000, p. 423) pointed
out that siting the borehole more umbilically can assist the predator in hindering egress of the
prey foot in efforts to escape by “negating its efforts to dig, burrow, and possibly dislodge a
mounted predator.” However, thickness varies over the mollusc (Kitchell et al., 1981) and the
consequence is that this part of the body whorl is where the shell is the thickest (Dietl and
Alexander, 2000). Although commonly drilled sectors vary with predator and prey, Kitchell et al.
(1981) reported that naticid boreholes have nonrandom siting. Kitchell et al. (1981) explained
that non-normal borehole sitings appear to be an effect of prey size outside the range of
preference. Further, if a prey is outside the optimal size range, normal manipulation may be
altered, which would cause non-normal borehole sitings (Kitchell et al., 1981). However, in the
present study all prey were within the manipulation limits of the predators, so that any
abnormally sited boreholes were not caused by predator-prey size mismatch.
Boreholes outside of commonly drilled sectors (1 and 2) could have been an indication of
competitive pressure, as it could force handling and manipulation times to accelerate. However,
with ~1% of borehole sitings outside of the most commonly drilled sectors, it does not appear
that competitive pressure forced accelerated or sloppy handling and manipulation while attacking
prey. In other words, competitive pressure had little effect on the consumption of a prey item
once capture and handling began.
The possibility of smothering before attempting to drill could be particularly relevant in
competitive conditions with other predators competing for limited resources, and the variable
percentage of prey consumed without drilling in this experiment (Figure 22) shows that this
method of consumption may be more prevalent than previously thought, ranging from 4-17%.

36
Observations show, after capture of prey, Neverita will manipulate and consume prey infaunally.
As naticids infaunally drag their prey within their mesopodium, prey could potentially be
smothered if extensive roaming occurred prior to drilling due to the perceived threat from other
predators. However, because prey were also consumed without drilling in the Control tanks,
smothering might have occurred if the depth of sediment was less than the naticids‟ preferred
depth for drilling.
There is also the possibility that the prey died naturally and were then scavenged upon.
The debate upon which naticids are scavengers continues today. However, Carriker (1981)
observed naticids preying on gaping bivalves that had been recently killed by another predator.
Medcof and Thurber (1958) also claimed that 60% of Neverita and Lunatia heros (now referred
to as Euspira heros) prey are consumed without perforating the shells after physically separating
predator from prey during feeding and finding a significant amount of meat consumed with the
shell still intact. Another possibility is that, with warm water temperatures, bacterial decay could
rapidly remove soft tissue of the molluscs before consumption could take place.
Further Work
It is possible that snail gender could play a significant role in naticid cannibalism. Polis
(1981) gave substantial evidence that gender can play various roles related to cannibalism
throughout the Animal Kingdom. Females prey on males after breeding, males prey on other
males to reduce mating competitors, and males could potentially prey on females, as well (Polis,
1981). Unfortunately, assigning gender to naticids is very difficult to do without injuring the
snail, which is precisely the reason so little is known on this matter. Edwards and Huebner
(1977) said that sex had no visible effect on the growth rates of Neverita within their

37
experiments. Medcof and Thurber (1958) suggested different growth rates for male and female
Neverita, after observing that males in mating pairs were nearly constantly smaller than females.
The effect of gender on cannibalism is beyond the scope of this thesis. However, many
snails have been collected from the same locality on Masonboro Sound during the same time of
year (early July) to be dissected and assigned genders. By doing this, I will be looking for
gender trends within the two size categories of snails used in this experiment (14-16mm and 25-
26mm). I will be particularly interested in the possibility of snails within my two size categories
being primarily male or primarily female. Many questions have arisen about the likelihood of
one size category being dominated by a single gender, and by dissecting a large sample size, I
hope to answer this question.
CONCLUSIONS
Experimental results showed that rates of cannibalism vary under competitive conditions.
The High Competition tanks were overly competitive, not representative of field conditions, and
therefore had significantly less cannibalism, with only five cannibalistic events. However, the
level of competition within the Low Competition tanks proved to be more similar to competitive
conditions in the field, and may provide support for Kitchell et al.‟s (1981) and Kelley‟s (1991)
hypothesis that naticid cannibalism is a predictable result of selective predation. The LC tanks
had 31 cannibalistic events, confirming that the small naticids were favorable prey items.
Cannibalism in the LC tanks was found to be dependent on the size ratio of the two snails, with
all cannibalism taking place upon a smaller individual.
Consumption measured by both the number of prey items and biomass proved to be
significantly lower in the Experimental (competitive) tanks than in the Control (noncompetitive)

38
tanks. Feeding rates were lowest in the HC tanks, most likely attributable to constrained
foraging due to the threat of interaction under competitive conditions. Lower consumption rates
also decreased the growth rates of the Experimental tank snails in comparison to those that had
zero competition for the limited resources (Controls). Intense competition and pressures from the
larger predators were not responsible for incomplete boreholes, with perhaps the exception of
LC3 (Low Competition tank 3). Nor did intense competition cause abnormal siting of boreholes
on the prey shell.
Results indicated that the majority of cannibalism among the naticid predator, Neverita
duplicata, occurs under levels of normal competition, represented by the Low Competition tanks.
High levels of cannibalism in the fossil record may thus indicate intermediate levels of
competition. Too much competitive pressure (represented by the High Competition tanks) seems
to raise cautiousness and awareness of added potential predators and thus provides a constraint
on foraging. Competition proved to be a significant factor in the occurrence of cannibalism
among Neverita. The idea that cannibalism is abnormal should be dismissed.

LITERATURE CITED
Carriker, M.R., 1951. Observations on the penetration of tightly closing bivalves by Busycon and other predators. Ecology, Vol. 31, Is. 1, pp. 73-83.
Carriker, M.R., 1981. Shell penetration and feeding by Naticacean and Muricacean predatory gastropods: A synthesis. Malacologia, Vol. 20, Is. 2, pp. 403-422.
Carriker, M.R., and G.L. Gruber, 1999. Uniqueness of the gastropod accessory boring organ
(ABO): Comparative biology, an update. J. of Shellfish Res., Vol. 18, Is. 2, pp. 579-595. Carriker, M.R., and L.G. Williams, 1978. The chemical mechanism of shell dissolution by
predatory boring gastropods: A review and an hypothesis. Malacologia, Vol. 17, Is. 1, pp. 143-156.
Claessen, D., A.M. deRoos, and L. Persson, 2000. Dwarfs and giants: Cannibalism and competition in size-structured populations. The Am. Nat., Vol. 155, Is. 2, pp.219-236.
Claessen, D., A.M. deRoos, and L. Persson, 2003. Population dynamic theory of size-dependent
cannibalism. Proc. R. Soc. Lond., Vol. 271, pp. 333-340.
Dietl, G.P., and R.R. Alexander, 2000. Post-Miocene shift in stereotypic naticid predation on
confamilial prey from the Mid-Atlantic shelf: Coevolution with dangerous prey. Palaios, Vol. 15, pp. 414-429.
Dietl, G.P., and P.H. Kelley, 2006. Can naticid gastropod predators be identified by the holes they drill? Ichnos, Vol. 13, pp. 103-108.
Edwards, D.C., and J.D. Huebner, 1977. Feeding and growth rates of Polinices duplicatus
preying on Mya arenaria at Barnstable Harbor, Massachusetts. Ecol., Vol. 58, pp. 1218 -1236.
Hagadorn, J.W. and G.E. Boyajian, 1997. Subtle changes in mature predator-prey systems: An example from Neogene Turritella (Gastropoda). Palaios, Vol. 12, pp. 372-379.
Harries, P.J. and K.M. Schopf, 2007. Late Cretaceous gastropod drilling intensities: data from the Maastrichtian Fox Hills Formation, Western Interior Seaway, USA. Palaios, Vol. 22,
Is. 1, pp. 35-46.
Hoffman, A., A. Pisera, and M. Ryszkiewicz, 1974. Predation by muricid and naticid gastropods on the Lower Tortonian mollusks from the Korytnica clays. Acta Geol Polonca, Vol. 24, pp. 249-260.
Hughes, R.N., and M.T. Burrows, 1991. Diet selection by dogwhelks in the field: An example of
constrained optimization. Anim. Behav., Vol. 42, pp. 47-55.
33
Ishikawa, M. and T. Kase, 2007. Multiple predatory drill holes in Cardiolucina (Bivalvia; Lucinidae): effect of conchiolin sheets in predation. Palaios, Vol. 254, Is. 3-4, pp. 508
-522.
Kelley, P.H., 1988. Predation by Miocene gastropods of the Chesapeake Group: Stereotyped and predictable. Palaios, Vol. 3, pp. 436-448.
Kelley, P.H., 1989. Evolutionary trends within bivalve prey of Chesapeake Group naticid gastropods. Hist. Bio., Vol. 2, pp. 139-156.
Kelley, P.H., 1991. Apparent cannibalism by Chesapeake Group naticid gastropods: A predictable result of selective predation. J. of Paleo., Vol. 65, Is. 1, pp. 75-79.
Kelley, P.H., 1992. Evolutionary patterns of naticid gastropods of the Chesapeake Group: An
example of coevolution? J. of Paleo., Vol. 66, Is. 5, pp. 794-800. Kelley, P.H. et al., 2001. Temporal patterns in the efficiency of naticid gastropod predators
during the Cretaceous and Cenozoic of the United States Coastal Plain. Palaios, Vol. 166, pp. 165-176.
Kelley, P.H., and T.A. Hansen, 2007. A case for cannibalism: Confamilial and conspecific predation by naticid gastropods, Cretaceous through Pleistocene of the United States
Coastal Plain. In, Predation in Organisms: A Distinct Phenomenon, edited by A.M.T. Elewa, Springer Verlag, p. 151-170.
Kingsley-Smith, P.R., C.A. Richardson and R. Seed, 2003. Stereotypic and size-selective predation in Polinices pulchellus (Gastropoda: Naticidae) Risso 1826. J. of Exp. Mar.
Biol. and Ecol., Vol. 295, pp. 173-190.
Kitchell, J.A., C.H. Boggs, J.F. Kitchell, and J.A. Rice, 1981. Prey selection by naticid gastropods: Experimental tests and application to the fossil record. Paleobiology, Vol. 7, Is. 4, pp. 533-552.
Leighton, L.R., 2002. Inferring predation intensity in the marine fossil record. Paleobiology, Vol.
28, Is. 3, pp. 328-342. Mitchell, W.A., et al., 1990. The effect of competition on foraging activity in desert rodents:
Theory and experiments. Ecol., Vol. 71, Is. 3, pp. 844-854.
Malacolog. “Neverita duplicata (Say 1822).” A Database of Western Atlantic Marine Mollusca. 2010. The Academy of Natural Sciences. http://www.malacolog.org
Medcof, J.C., and L.W. Thurber, 1958. Trial control of the greater clam drill (Lunatia heros) by manual collection. Fish. Res. B. of Can., Vol. 15, Is. 6, pp. 1355-1369.

34
Polis, G.A., 1981. The evolution and dynamics of intraspecific predation. Ann. Rev. of Ecol. Syst., Vol. 12, pp. 225-251.
Sih A., 1980. Optimal behavior can foragers balance two conflicting demands? Science, Vol.
210, pp. 1041-1043. Stanton, R.J., and P.C. Nelson, 1980. Reconstruction of the trophic web in paleontology:
community structure of the Stone City Formation (middle Eocene, Texas). J. of Paleo., Vol. 54, pp. 118-135.
Stephens, D.W., and J.R. Krebs, 1986. Foraging Theory. In, Monographs in Behavior and Ecology, edited by J.R. Krebs and T. Clutton-Brock, Princeton University Press, p. 1-247.
Wiltse, W.I., 1980. Predation by juvenile Polinices duplicatus (Say) on Gemma gemma
(Totten). J. of Exp. Mar. Biol. and Ecol., Vol. 42, pp. 187-199. Whelan, C.J., and J.S. Brown, 2005. Optimal foraging and gut constraints: Reconciling two
schools of thought. Oikos, Vol. 110, pp. 481-496.
Ziemba, R.E., M.T. Myers, and J.P. Collins, 2000. Foraging under risk of cannibalism leads to divergence in body size among tiger salamander larvae. Oecolgia, Vol. 124, pp. 225-231.