undp,mdg,global compact
TRANSCRIPT

8/8/2019 Undp,Mdg,Global Compact
http://slidepdf.com/reader/full/undpmdgglobal-compact 1/32
UNDP AND THE MILLENNIUM
DEVELOPMENT GOALS
By
Karkuzhali V (09AA16)
Nandhini S (09AA24)
Shiny Queen P (09AA36)
Sneha KS (09AA38)

8/8/2019 Undp,Mdg,Global Compact
http://slidepdf.com/reader/full/undpmdgglobal-compact 2/32
What is UNDP
The United Nations (UN) is a unique international organization of 192 sovereign
states. One of the central mandates of the United Nations is the promotion of development
and economic and social progress. The United Nations Development Programme (UNDP)
is a development organization of the United Nations, focusing on five specific areas. UNDP
is the UN¶s largest provider of grants for human development. UNDP was established in
1965 by the General Assembly of the United Nations. In most country offices, the UNDP
representative serves as the coordinator of development activities for the United Nations
system as a whole. Through such coordination, UNDP seeks to ensure the most effective use
of UN and international aid resources. UNDP¶s headquarters are located in New York
UNDP has liaison offices in Geneva, Brussels, Copenhagen, Tokyo, and Washington D.C.
UNDP has currently about 7000 staff members on the ground in 166 countries.
What does the UNDP want to achieve?
UNDP¶s mandate is to fight poverty. UNDP works to achieve this through supporting
human development in a sustainable way. Recently, the overarching goal of reducing poverty
has been more concretely defined through the Millennium Development Goals
The Millennium Development Goals
In 2000, the members of the United Nations set the international agenda for the
beginning of the new century. The resulting Millennium Declaration is a broad commitment
of all UN member states.
The goals are time-bound, starting in 1990 and to be achieved by 2015. They
comprise only those elements of the Millennium Declaration which are both related to
development and quantifiable. The first seven goals stress the responsibility of developing
countries to undertake policy reforms and enhance good governance. Goal eight focuses on
the responsibility of developed nations to relieve debt, increase aid and give developing
countries better access to its technologies and markets.
The MDGs also provide a framework for the entire international community to work
together towards a common end ± making sure that human development reaches everyone,
everywhere. If these goals are achieved, world poverty will be cut by half, tens of millions of
lives will be saved, and billions more people will have the opportunity to benefit from the

8/8/2019 Undp,Mdg,Global Compact
http://slidepdf.com/reader/full/undpmdgglobal-compact 3/32
global economy. The eight MDGs break down into 21 quantifiable targets that are measured
by 60 indicators.
The eight goals are listed below:
1. Eradicate extreme poverty and hunger
2. Achieve universal primary education
3. Promote gender equality and empower women
4. Reduce child mortality
5. Improve maternal health
6. Combat HIV/AIDS, malaria and other diseases
7. Ensure environmental sustainability
8. Develop a global partnership for development
R ole of UNDP
UNDP, global development network on the ground in 166 countries, is in a unique
position to advocate for change, connect countries to knowledge and resources, and
coordinate broader efforts at the country level.
y First, campaigning & mobilisation - supporting advocacy for the MDGs and working with
partners to mobilise the commitments and capabilities of broad segments of society to build
awareness on the MDGs.
y Second, analysis - researching and sharing best strategies for meeting the MDGs in terms of
innovative practices, policy and institutional reforms, means of policy implementation, and
evaluation of financing options.
y Third, monitoring - helping countries report advancement towards the MDGs and track
progress.

8/8/2019 Undp,Mdg,Global Compact
http://slidepdf.com/reader/full/undpmdgglobal-compact 4/32
y Fourth, operational activities - goal-driven assistance to support governments to tailor
MDGs to local circumstances and challenges; address key constraints to progress on the
MDGs.
GOAL 1: ER ADICATE EXTR EME POVER TY AND HUNGER
Target 1a: R educe by half the proportion of people living on less than a dollar a day
1.1 Proportion of population below $1 (PPP) per day
1.2 Poverty gap ratio
1.3 Share of poorest quintile in national consumption
Target 1b: Achieve full and productive employment and decent work for all, including
women and young people
1.4 Growth rate of GDP per person employed
1.5 Employment-to-population ratio
1.6 Proportion of employed people living below $1 (PPP) per day
1.7 Proportion of own-account and contributing family workers in total employment
Target 1c: R educe by half the proportion of people who suffer from hunger
1.8 Prevalence of underweight children under-five years of age
1.9 Proportion of population below minimum level of dietary energy consumption
ACTION TAKEN
Efforts are being made to eliminate extreme poverty, measured as $1.25 a day in 2005
prices (revised from the previous $1.08 a day in 1993 prices).
Governments, along with the international community, have made poverty alleviation
a top priority in their development strategies.

8/8/2019 Undp,Mdg,Global Compact
http://slidepdf.com/reader/full/undpmdgglobal-compact 5/32
The number of people living in extreme poverty fell from 1.9 billion in 1981 to 1.8
billion in 1990, and to about 1.4 billion in 2005.
This significant reduction in poverty disguises large regional differences. Millions of
people are trapped in poverty, most of them in Sub-Saharan Africa and South Asia.
Poor health and lack of education that deprive people of productive employment;
depleted and spoiled environmental resources; and corruption, conflict, and
misgovernance that waste public resources and discourage private investment also
trap people in poverty.

8/8/2019 Undp,Mdg,Global Compact
http://slidepdf.com/reader/full/undpmdgglobal-compact 6/32
Viability of the indicator
The magnitude of the poverty eradication challenge is determined not only by the
number of poor people worldwide, but also by how far they fall below the poverty
line.
The increase in average incomes since 2000 has enabled many people to lift
themselves out of poverty and has reduced the depth of poverty of those who remain
extremely poor.
Against a poverty line of $1.25 a day, the poverty gap fell between 1990 and 2005 in
all regions except Western Asia.
In 2005, the depth of poverty was greatest in sub-Saharan Africa, but has fallen since
1999 to reach the level that prevailed in Eastern Asia in 1990.
The global economic crisis as well as high food prices are likely to have reversed
these favourable trends.

8/8/2019 Undp,Mdg,Global Compact
http://slidepdf.com/reader/full/undpmdgglobal-compact 7/32
GOAL 2: ACHIEVE UNIVER SAL PR IMAR Y EDUCATION
Target 2a: Ensure that all boys and girls complete a full course of primary schooling
2.1 Net enrolment ratio in primary education
2.2 Proportion of pupils starting grade 1 who reach last grade of primary
2.3 Literacy rate of 15-24 year-olds, women and men
Definition:
Net primary enrolment ratio is the ratio of the number of children of official school
age (as defined by the national education system) who are enrolled in primary school to the
total population of children of official school age.
The indicator is used to monitor progress toward the goal of achieving universal
primary education.
It shows the proportion of children of primary school age who are enrolled in primary
school.
Net enrolment refers only to children of official primary school age. (Gross enrolment
includes children of any age.)
Net enrolment rates below 100 percent provide a measure of the proportion of schoolage children who are not enrolled in the primary level.
This difference does not necessarily indicate the percentage of students who are not
enrolled, since some children might be enrolled at other levels of education.

8/8/2019 Undp,Mdg,Global Compact
http://slidepdf.com/reader/full/undpmdgglobal-compact 8/32
GOAL 3: PR OMOTE GENDER EQUALITY AND EMPOWER WOMEN
Target
Eliminate gender disparity in primary and secondary education, preferably by 2005,
and in all levels of education no later than 2015.
Indicators
y Ratios of girls to boys in primary, secondary and tertiary education
y Ratio of literate women to men, 15-24 years old
y Share of women in wage employment in the non-agricultural sector
y Proportion of seats held by women in national parliament
Gender Parity Index
Gender Parity Index in enrolment at primary, secondary and tertiary levels is the ratio
of the number of female students enrolled at primary, secondary and tertiary levels in public
and private schools to the number of male students
GPI(GER)= GER(Female)/GER(Male)
A GPI of 1 indicates parity between the sexes or no gender disparity. A GPI that
varies between 0 and 1 typically means a disparity in favour of males; whereas a GPI greater
than 1 indicates a disparity in favour of females. Target 4 is intended to achieve GPI of 1 by
2005 for Primary Enrolment and by 2015 for all levels. In general, at the national level, the
number of girls enrolled in all levels i.e. primary, secondary and higher education is less than
their counterparts. However the female male ratio in education has been steadily improving
over the years. In Primary education the GPI ratio has gone up from 0.76 in 1990 -91 to 0.94
in 2006-07, in secondary education the increase is from 0.60 in 1990-91 to 0.82 in 2006-07
and in higher education it is from 0.54 to 0.70 during the same period.
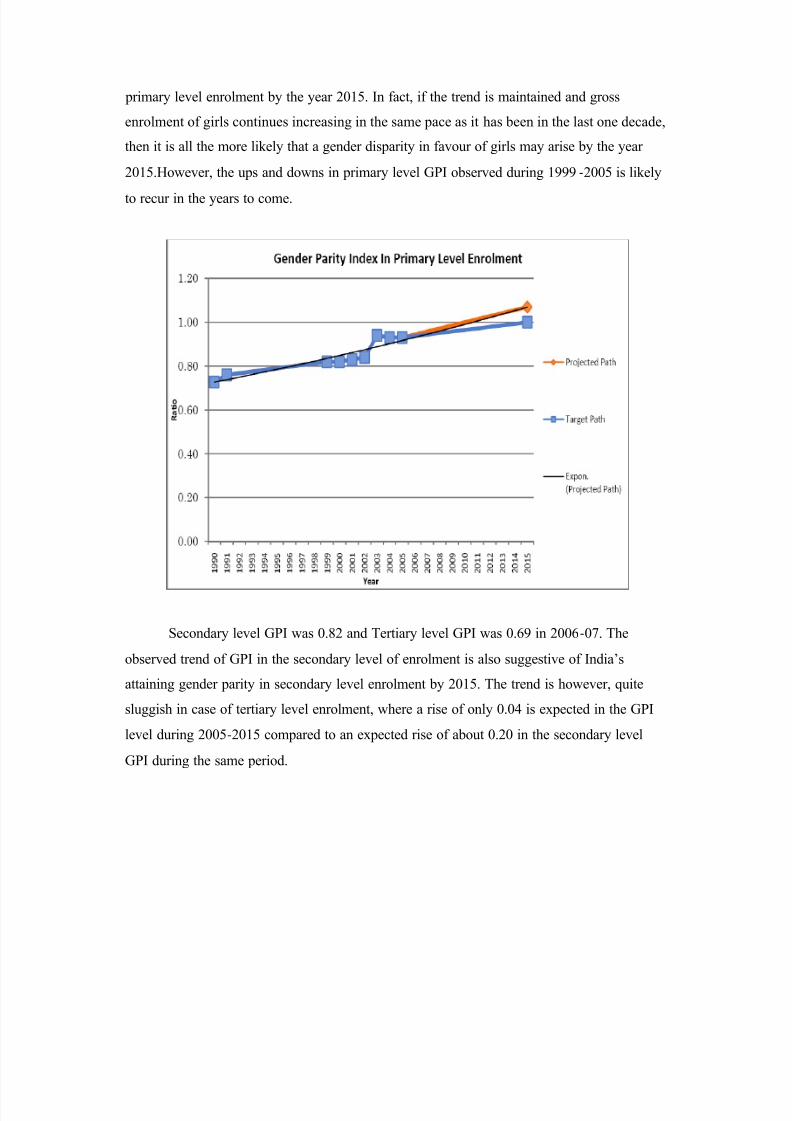
The target for eliminating gender disparity in primary enrolment by 2005 has not been
achieved in India. With steady increase in Gross Enrolment Ratio (GER) of both boys and
girls in primary grades over the last decade, India attained a reasonably high GPI (GER) for
primary enrolment (0.94) by 2006-07. Compared to female:male enrolment in primary
education of 0.88 in 2006-07, the GPI gives a better gender parity in favour of girls in the
year 2006-07. This is also indicative of on-track progress to eliminate gender disparity in
8/8/2019 Undp,Mdg,Global Compact
http://slidepdf.com/reader/full/undpmdgglobal-compact 9/32
primary level enrolment by the year 2015. In fact, if the trend is maintained and gross
enrolment of girls continues increasing in the same pace as it has been in the last one decade,
then it is all the more likely that a gender disparity in favour of girls may arise by the year
2015.However, the ups and downs in primary level GPI observed during 1999 -2005 is likely
to recur in the years to come.
Secondary level GPI was 0.82 and Tertiary level GPI was 0.69 in 2006-07. The
observed trend of GPI in the secondary level of enrolment is also suggestive of India¶s
attaining gender parity in secondary level enrolment by 2015. The trend is however, quite
sluggish in case of tertiary level enrolment, where a rise of only 0.04 is expected in the GPI
level during 2005-2015 compared to an expected rise of about 0.20 in the secondary level
GPI during the same period.

8/8/2019 Undp,Mdg,Global Compact
http://slidepdf.com/reader/full/undpmdgglobal-compact 10/32
The observed GPI based on DISE 2007-08 reports show GPI for primary level to be
0.93 in 2006-07 and 2007-08, GPI for upper-primary classes to be 0.87 in 2006-07 and 0.89
in 2007-08. These observed figures suggest on-track movement of the indicator for attaining
the 2015 target.
Literacy Gender Parity Index
The ratio of literate women to men, 15-24 years old is defined as the ratio of the
female literacy rate to the male literacy rate for the age group 15-24 years.

8/8/2019 Undp,Mdg,Global Compact
http://slidepdf.com/reader/full/undpmdgglobal-compact 11/32
The ratio of literate women to men in the age group 15-24 years tends to exceed 1 by
2015, implying attainment of gender parity in literacy by 2015. It also signifies a presumed
outcome of attending school and indicates empowerment of women in the society. This
attainment along with the attainment of gender parity in primary, secondary and tertiary
levels of education can be a major gain for women in acquiring access to wider world of
learning and development of skills, economic independence, authority of decision making
and self-determination.
Empowerment of women
The third important indicator is the Share of Women in Wage Employment in the
NonAgricultural Sector, which is defined as the share of female workers in the
non-agricultural sector expressed as a percentage of total employment in the sector. This
measures the degree to which labour markets are open to women in industry and service
sectors, which affects not only equal employment opportunity for women but also economic
efficiency through flexibility of the labour market and, therefore, the economy¶s ability to
adapt to change.
The indicator value can hardly be translated into a quantifiable target in linkage with
achieving the overall target of universalisation of gender equality in primary, secondary and
tertiary enrolment by 2015. It is a matter of lag in time to get the full effect of gender equity

8/8/2019 Undp,Mdg,Global Compact
http://slidepdf.com/reader/full/undpmdgglobal-compact 12/32
in education on women¶s participation in the labour markets of industry and services. So a
50:50 share between men and women in wage employment in the non-agricultural sector
cannot be taken as a target for this indicator to be achieved by 2015. The rate of change over
time in India in respect of the Share of women in wage employment in the non -agricultural
sector is rather slow-
about 2 percentage points over a period of 5 years in the recent past. It
is projected that at this rate of progression, the share of women in wage employment can at
best reach a level of about 24% by 2015. Labour markets in industry and services sectors in
India are heavily male dominated and a 50:50 situation for men and women is too ideal to be
true given the market dynamics and existing socio-cultural framework.
Proportion of seats held by women in National Parliament
India is the first country where, since independence, women have the right to vote to
elect representatives for the National Parliament as well as State Assemblies. The women
have equal right to contest any election subject to the fulfilment of other eligibility
conditions.
So far 15 General Elections have been held for the Lok Sabha. The percentage of lady
parliamentarians fluctuates between 8 to 12 % in these elections. In the current Loksabha (as
on 27/1/2010) there are 59 (10.8%) women members out of 545. As on 27/1/2010 there are
21 women members (9.0%) out of 234 in the Rajya Sabha. Overall percentage of lady
parliamentarians stands at 10.3%.

8/8/2019 Undp,Mdg,Global Compact
http://slidepdf.com/reader/full/undpmdgglobal-compact 13/32
Initiatives Taken
y Providing secondary school stipends for girls in Bangladesh:
The Female Secondary School Stipend programme in Bangladesh has provided
money directly to girls and their families to cover tuition and other costs, on the condition
that they enrol in secondary school and remain unmarried until the age of 18. By 2005, girls
accounted for 56 per cent of secondary school enrolment in the areas covered by the
programme, compared with 33 per cent in 1991.
y Furthering women¶s empowerment in Mexico:
Mexico has developed an innovative federal programme called Generosidad that
awards a ³Gender Equity Seal´ to private firms. Seals are granted through an independent
evaluation that assesses a company¶s achievement of specific standards related to gender
equity, including recruitment, career advancement, training and reducing sexual harassment.
By 2006, 117 companies had obtained the Seal. Similar initiatives have been launched in
Brazil, Costa Rica and Egypt.
y Setting a gender quota for Parliament in Kyrgyzstan:
In 2005, there were no women in the Kyrgyz Parliament and only one woman in a
cabinet position. In 2007, following a nationwide discussion facilitated by the UNDevelopment Programme (UNDP), a 30 per cent gender quota was enshrined in the election
code. By 2008, Kyrgyzstan had the highest proportion of women in Parliament (25.6 percent)
and in Government (21 per cent) in Central Asia.
R ole of UN in attaining the goal
y The UN Population Fund (UNFPA) and the UN Children¶s Fund (UNICEF) are
working in a joint programme to reduce female genital mutilation and cutting by
40 per cent between 2008 and 2012 in a number of countries, including Burkina Faso,
Djibouti, Egypt, Ethiopia, Gambia, Guinea, Guinea-Bissau, Kenya, Senegal, Somalia,
Sudan and Uganda.
y In Cambodia, an initiatie run by the UN Development Fund for Women (UNIFEM),
in partnership with seven NGOs, provided training in political campaigning and
8/8/2019 Undp,Mdg,Global Compact
http://slidepdf.com/reader/full/undpmdgglobal-compact 14/32
governing to 919 women candidates. The initiative helped increase the number of
women running for office from 16 per cent in 2002 to 21 per cent in 2007, and the
number of women elected rose from 8.5 per cent to 15 per cent.
y The UN Educational, Scientific and Cultural Organization (UNESCO) support
teacher training and the development of learning materials that promote gender
equality. Through the UN Girls¶ Education Initiative, UNESCO also develops legal
tools to reduce gender-based violence in schools and supports innovative methods to
bring education to hard-to-reach women, such as through mobile phones.
GOAL 4: R EDUCE CHILD MOR TALITY
Target
Reduce by two-thirds, between 1990 and 2015, the under-five mortality rate.
Indicators
y Under-five mortality rate
y Infant mortality rate
y Proportion of 1 year-old children immunised against measles
Under 5 Mortality R ate
The Under 5 Mortality Rate (U5MR) is the probability (expressed as a rate per 1000
live births) of a child born in a specified year dying before reaching the age of five if
subjected to current age specific mortality rates. U5MR at national level has declined during
the last decade. The trend for projecting estimates for 2015 suggest India is likely to fall short
of the U5MR level of 42 by about 28 percentage points. By UNSD estimates based on
country adjusted data, the shortfall is likely to be less, of the order of 12 percentage points
only. The observed U5MR by NFHS-III for 2005-06 is 74.6 per µ000 live births, and the
projected measure for 2015 is about 70 per µ000 live births.

8/8/2019 Undp,Mdg,Global Compact
http://slidepdf.com/reader/full/undpmdgglobal-compact 15/32
Infant Mortality R ate (IMR )
The number of infant deaths in less than a year of births per thousand live births
(p.t.l.b) is referred to as IMR. Data is expressed as number of deaths per 1000 live births. The
country has observed a continuous decline in IMR. It stood at 192 during 1971, 114 in the
year 1980 and 57 in 2006 and 53 in 2008. The decline in IMR has been noticed both for male
and female during the period. However, the rate of decline is more pronounced in the case of
male as compared to female.

8/8/2019 Undp,Mdg,Global Compact
http://slidepdf.com/reader/full/undpmdgglobal-compact 16/32
With reference to the base year (1990) IMR value of 80 p.t.l.b, India has to reduce the
IMR to 26.7 p.t.l.b by 2015. At the rate of decline experienced during 1990 to 2007, India¶s
IMR is likely to come down to about 46 p.t.l.b. Thus the target for IMR is not likely to be
achieved unless comprehensive improvement in infant mortality takes place in the
particularly lagging States and with respect to neo-natal deaths. Early neo
-natal deaths
(deaths occurring to newborns within seven days of life) constitute as high as 51.6% of total
number of infant deaths in 2007. The share of neo-natal deaths (deaths occurring to infants
within the first month of life) is 65.5% of total number of infant deaths in 2007. Incidence of
early neo-natal deaths during 2001 to 2007 in some states viz. Chhatisgarh, Madhya Pradesh,
Rajasthan and Orissa has not declined and for a few of them is on rise. On the whole, infancy
deaths constitute 17.2% of total deaths in 2007.
Immunization
MDG target for reducing child mortality does not envisage explicit target towards
universal coverage of immunisation, particularly immunisation against measles in the age
group 12-23 months. Proportion of one-year old (12-23 months) children immunised against
measles is the prescribed statistical indicator for measuring the coverage of immunisation in
the country.

8/8/2019 Undp,Mdg,Global Compact
http://slidepdf.com/reader/full/undpmdgglobal-compact 17/32
The national level measure of the proportion has been 42.2% in 1992-93, 50.7% in
1998-99 and 58.8 in 2005-06%. At this historical rate of increase, India is expected cover
about 97% children in the age group 12-23 months for immunisation against measles by
2015. Thus India is likely to fall short of universal immunisation of one-year olds against
measles by about 3 percentage points in 2015. According to DLHS-3 for 2007
-08, national
coverage of immunisation of 1- year -olds has reached 69.6% with 77.6% in urban and 66.6%
in rural areas.
Initiatives Taken
y Expanding immunization programmes in Egypt, VietNam and Bangladesh:
Egypt has already surpassed the MDG target for reducing child mortality in children
under five. This achievement has been aided by a significant expansion in measlesvaccination coverage, which stood at 92 per cent in 2008. Viet Nam¶s Expanded Programme
of Immunization has benefited more than 90 per cent of children and pregnant women. The
mortality rate of under-fives in the country was more than halved, from 56 per 1,000 live
births in 1990 to 14 per 1,000 live births in 2008. And in 2006, Bangladesh conducted the
world¶s largest-ever measles campaign, vaccinating 33.5 million children between the ages of
nine months and 10 years, over a 20-day period.
y Promoting breastfeeding in Cambodia:
The Cambodian Ministry of Health¶s Baby-Friendly Community Initiative, a network
of community support groups that promote exclusive breastfeeding in rural areas, increased
the rate of breastfed babies from 13 to 60 per cent between 2000 and 2005. Originally
launched in 50 villages, the initiative has since expanded to 2,675 ² or 20 per cent of all
villages in the country. Breastfeeding strengthens children and reduces their vulnerability to
disease.
y Providing mosquito nets in the R epublic of Congo, Gabon, Mali, Nigeria and
Zimbabwe:
Through the ³Nothing But Nets´ campaign, initiated by a number of foundations and
corporate, sports related and religious partners, more than three million insecticide-treated
anti-malaria nets have been distributed to children, pregnant women and refugees in Africa
since the campaign¶s inception in 2006. The effectiveness of such mosquito nets has been
shown by a previous distribution programme in Kenya, where a ten-fold increase in the

8/8/2019 Undp,Mdg,Global Compact
http://slidepdf.com/reader/full/undpmdgglobal-compact 18/32
number of young children sleeping under nets between 2004 and 2006 resulted in 44 per cent
fewer deaths from malaria than among children not protected by them.
R ole of UN in attaining the goal
y UN Secretary-General Ban Ki-moon, together with leaders from governments,
foundations, NGOs and business launched in 2010 a Global Strategy for Women¶s
and Children¶s Health, setting out key actions to improve the health of women and
children worldwide, with the potential of saving 16 million lives by 2015. The Global
Strategy spells out steps to enhance financing, strengthen policy and improve service
delivery, and sets in motion international institutional arrangements for global
reporting, oversight and accountability on women¶s and children¶s health.
y In partnership with governments, the World Health Organization (WHO) and others,
the UN Children¶s Fund (UNICEF) provides high-impact, cost-effective health and
nutrition interventions to reduce the number of neonatal and young child deaths from
preventable and easily treatable causes. UNICEF purchases vaccines, negotiates
favourable prices and forecasts vaccine requirements to ensure sustainable supplies.
When delivering vaccines, UNICEF adds micronutrient supplements to offset
malnutrition, another critical factor in child survival.
GOAL 5: IMPR OVE MATER NAL HEALTH
Target
Reduce by three quarters, between 1990 and 2015, the Maternal Mortality Ratio
Indicators
y Maternal Mortality Ratioy Proportion of births attended by skilled health personnel
Maternal Mortality R atio (MMR )
The Maternal Mortality Ratio (MMR) is the number of women who die from any
cause related to or aggravated by pregnancy or its management (excluding accidental or

8/8/2019 Undp,Mdg,Global Compact
http://slidepdf.com/reader/full/undpmdgglobal-compact 19/32
incidental causes) during pregnancy and childbirth or within 42 days of termination of
pregnancy, irrespective of the duration and site of the pregnancy, per 100,000 live births. The
incidence of maternal deaths is too rare an event to provide a robust estimate of the MMR by
sample survey method. The present estimates are available from SRS- based studies 20 taking
into account the requirement of large sample size for sub-national estimates of MMR.
The national MMR level has come down from 398 per 100,000 live births in 1997-
98to 254 per 100,000 live births in 2004 -06, a 36% decline over a span of seven years as
compared to a 25% decline in the preceding eight years from 1990-1997. Given to achieve an
MMR of 109 per 100,000 live births by 2015, India tends to fall short by about 26 points as it
tends to reach MMR of about 135 per 100,000 live births in 2015. The States which seem to
have done considerably well in arresting incidence of maternal deaths and tend to reach their
respective targets before 2015 are Kerala and West Bengal.
Safe Motherhood
Life risk in motherhood is gradually diminishing across the country mainly due to
promotion of reproductive health care facilities through government-run programmes.
Towards attaining Target 5, the MDG indicator for measuring progress is proportion of births
attended by skilled health personnel. There is no explicit target in MDG framework for this to

8/8/2019 Undp,Mdg,Global Compact
http://slidepdf.com/reader/full/undpmdgglobal-compact 20/32
be attained by 2015. Obviously universality of deliveries being attended by skilled health
personnel is the most ideal objective.
Initiatives Taken
Widening access to maternal health services in Egypt:The Ministry of Health and Population significantly increased access to obstetric and
neonatal care, in particular to vulnerable populations in Upper Egypt. About 32 maternity
homes were constructed in rural areas. The number of births attended by trained healthcare
workers in rural areas has since doubled to 50 per cent.
Fighting fistula in sub-Saharan Africa, South Asia and the Arab States:
In 2003, the UN Population Fund (UNFPA), together with government and private
partners, launched the Campaign to End Fistula, a childbirth injury that leaves womenincontinent, isolated and ashamed. The campaign is now active in 49 countries across sub-
Saharan Africa, South Asia and the Arab States. More than 28 countries have integrated the
issue into relevant national policies and more than 16,000 women have received fistula
treatment and care.

8/8/2019 Undp,Mdg,Global Compact
http://slidepdf.com/reader/full/undpmdgglobal-compact 21/32
Investing in mobile maternal health units in Pakistan:
UNFPA-supported mobile clinics were set up in Pakistan in 2005 and had received
nearly 850,000 patients by 2008. Women can use them for antenatal consultations, deliveries,
post-miscarriage complications and referrals for Caesarean section. The mobile units
managed to provide skilled birth attendance to 43 per cent of pregnant women in remote
areas, 12 per cent higher than the national average.
R ole of UN in attaining the goal
y UNFPA, the UN Children¶s Fund (UNICEF), the World Health Organization (WHO),
and the World Bank, as well as the Joint UN Programme on HIV/AIDS (UNAIDS),
have joined forces as Health 4+ (H4+) to support countries with the highest rates of
maternal and newborn mortality. The H4+ partners support emergency obstetric and
neonatal care needs assessments and help cost national maternal, newborn and child
health plans, mobilize resources, increase the number of skilled health workers, and
improve access to reproductive health services.
y In 2009, WHO, UNICEF and UNFPA partnered with the African Union Ministers of
Health as well as bilateral aid and non-governmental organizations to launch the
Campaign on Accelerated R eduction of Maternal Mortality in Africa
(CARMMA). The campaign aims to save the lives of mothers and newborns. It is
active in 20 African countries, including Chad, Ethiopia, Ghana, Malawi,
Mozambique, Namibia, Nigeria, Rwanda, Sierra Leone and Swaziland.
y UNFPA¶s Global Programme to Enhance R eproductive Health Commodity
Security and WHO¶s evidence-based guidance in family planning have helped
improve access to reproductive health supplies in more than 70 countries, including in
Ethiopia, where the contraceptive prevalence rate has more than doubled since 2005,and in Laos, Madagascar and Mongolia, where significant progress in the use of
voluntary family planning was also noted.

8/8/2019 Undp,Mdg,Global Compact
http://slidepdf.com/reader/full/undpmdgglobal-compact 22/32
GOAL OMBAT /AIDS, MALA IA AND OT ER DISEASES
T 1:
Have halted by 2015 and begun t reverse the spread of HIV/¡
IDS
Indi :
HIV prevalence among pregnant women aged 15-24 years
Condom use rate of the contraceptive prevalence rate.
Condom use at last high r isk sex.
Percentage of Population aged 1524 years with comprehensive correct knowledge of
HIV/¢
IDS.
Contraceptive
P
revalence R ate
PRE ALENCE O HIV/AIDS
HIV situation in the country is assessed and monitored through regular annual sentinel surveillance
mechanism established since 1992. As the HIV prevalence among the high r isk group is very high
compared to that among the general population, India continues to be in the category of concentrated
epidemic. The sexual mode of transmission continues to be the ma jor transmission mode, though
transmission through in jecting drug and men having sex with men is very high in a few pockets.
According to the recent estimates, using the international comparable work method data book and
using multi ple data sources (expanded sentinel surveillance system, National Family Health Survey ±
III, Integrated Bio-Behavioral Assessment and Endline Behavioral Surveillance Survey), there were
2.31 million people living with HIV/AIDS at the end of 2007.
Thus the spread of HIV/AIDS in the country shows a downward trend i.e., from 2.73 million (0.45%)
people living with HIV/AIDS in 2002, the number has declined to 2.31 million (0.34%) by 2007.
8/8/2019 Undp,Mdg,Global Compact
http://slidepdf.com/reader/full/undpmdgglobal-compact 23/32
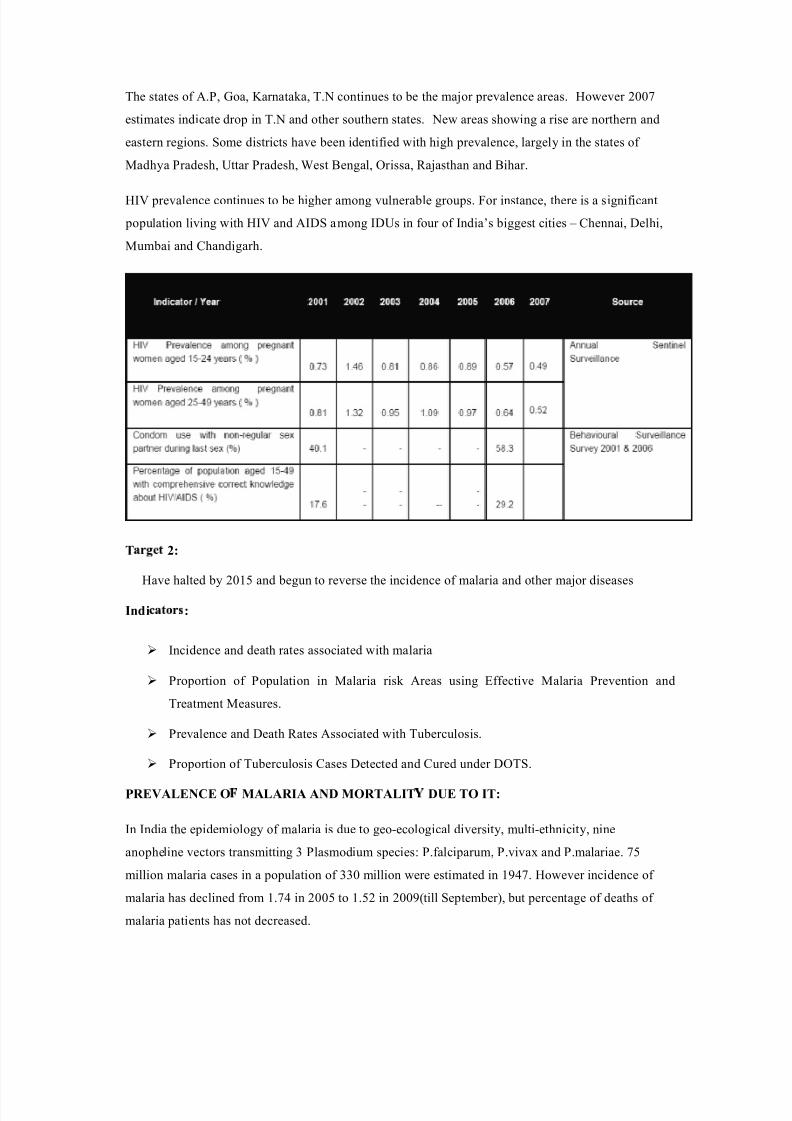
The states of A.P, Goa, Karnataka, T.N continues to be the ma jor prevalence areas. However 2007
estimates indicate drop in T.N and other southern states. New areas showing a r ise are nor thern and
eastern regions. Some distr icts have been identif ied with high prevalence, largely in the states of
Madhya Pradesh, Uttar Pradesh, West Bengal, Or issa, R a jasthan and Bihar.
HIV prevalence continues to be higher among vulnerable groups. For instance, there is a signif icant
population living with HIV and AIDS among IDUs in four of India¶s biggest cities ± Chennai, Delhi,
Mumbai and Chandigarh.
T 2:
Have halted by 2015 and begun to reverse the incidence of malar ia and other ma jor diseases
Indi :
Incidence and death rates associated with malar ia
Propor tion of Population in Malar ia r isk Areas using Effective Malar ia Prevention and
Treatment Measures.
Prevalence and Death R ates Associated with Tuberculosis.
Propor tion of Tuberculosis Cases Detected and Cured under DOTS.
PREVALENCE O MALAR IA AND MORTALIT DUE TO IT:
In India the epidemiology of malar ia is due to geo-ecological diversity, multi-ethnicity, nine
anopheline vectors transmitting 3 Plasmodium species: P.falci parum, P.vivax and P.malar iae. 75
million malar ia cases in a population of 330 million were estimated in 1947. However incidence of
malar ia has declined from 1.74 in 2005 to 1.52 in 2009(till September), but percentage of deaths of
malar ia patients has not decreased.

8/8/2019 Undp,Mdg,Global Compact
http://slidepdf.com/reader/full/undpmdgglobal-compact 24/32
In states of Arunachal Pradesh, Assam, Gujarat, Karnataka, Madhya Pradesh, Maharashtra,
Meghalaya, Mizoram, Nagaland, Orissa, Rajasthan, Tripura, and West Bengal, where deaths are
associated with malaria are generally high compared to other states
PR EVALENCE OF TUBER CULOSIS AND MOR TALITY DUE TO IT:
India is the highest TB burden country accounting for one fifth of the global incidence which means
India is 17th among 22 High Burden Countries in terms of TB incidence rate (Source: WHO global
TB report 2008). The Revised National TB Control Programme (RNTCP), based on the
internationally recommended Directly Observed Treatment Shortcourse (DOTS) strategy, was
launched in 1997 expanded across the country in a phased manner with support from the World Bank
and other development partners.
The objectives of the programme were (a) to achieve and maintain cure rate of atleast 85% among
New Sputum Positive (NSP) patients; and (b) to achieve and maintain case detection of at least 70%

8/8/2019 Undp,Mdg,Global Compact
http://slidepdf.com/reader/full/undpmdgglobal-compact 25/32
of the estimated NSP cases in the community. Full nation wide coverage was achieved in March 2006
cover ing over a billion population (1114 million) in 632 distr icts / repor ting units. In terms of
treatment of patients, R NTCP is the largest and the fastest expanding programme in the wor ld. The
prevalence of TB in the country has steadily declined from as high as 586 per 1,00,000 population in
1990 to 283 per 1,00,000 population in 2007
TB patients declared and registered for treatment under DOTS were 1,517,602 of which 6,
16,053 were new smear positive cases.

8/8/2019 Undp,Mdg,Global Compact
http://slidepdf.com/reader/full/undpmdgglobal-compact 26/32
GOAL 7: ENSURE ENVIR ONMENTAL SUSTAINABILIT
T 1
Integrate the pr inci ples of sustainable development into country policies and programmes and
reverse the loss of environmental resources
Indi :
Propor tion of Land Area covered by Forest.
R atio of Area Protected to Maintain Biological Diversity to Surface Area.
Energy use (Kg Oil equivalent) per unit of GDP (R upee).
Carbon Dioxide emissions per capita and Consumption of Ozonedepleting Chlorof luoro
Carbons (ODP Tons)
Propor tion of the Population Using Solid Fuels.
India¶s N £ ti¤ ¥ £ l E ¥ vi¦ ¤ ¥ § ¨ ¥ t P ¤ lic© , 2006 (NEP2006) seeks to extend the coverage of all the existing
policies and f ill in gaps that still exist. In response to the national commitment to a clean environment,
mandated in the Constitution in Ar ticles 48 A and 51 A(g), and as strengthened by judicial
interpretation of Ar ticle 21, the NEP 2006 intends to mainstream environment concerns in all
development activities.

8/8/2019 Undp,Mdg,Global Compact
http://slidepdf.com/reader/full/undpmdgglobal-compact 27/32
FOREST AND TREE COVER :
The Eleventh FiveYear Plan (20072012) of India envisages 5 percentage point increase in forest and
tree cover by the end of the Plan per iod, apar t from a few other monitorable targets for pr ior ity actions
in environment related areas. The forest cover -increased considerably dur ing the last two decades. In
the past 10 years, forest cover has increased by 3.31 million hectares, showing an average 0.46%
increase every year.
YEAR AREA UNDER
FOREST SQ.KM)
1995 639,600
2005 677,171
2007 690,899
PR OTECTION OF BIODIVER SITY
India, a mega diverse country with only 2.4 per cent of the land area, accounts for 78 per cent of the
recorded species of the wor ld. The total area covered under National Parks and Wildlife Sanctuar ies,
which constitute ma jor par t of the protected areas in India, has increased from 155,961.06 sq.km in
1999 to 155,980.15 sq.km in 2006 (4.74% of country¶s GA)

8/8/2019 Undp,Mdg,Global Compact
http://slidepdf.com/reader/full/undpmdgglobal-compact 28/32
CARBON DIOXIDE EMISSION:
In spite of a reasonable growth in GDP and dependence on fossil fuels to meet the energy needs for
industr ial development and better living of the people of the country, carbon dioxide emission per
capita in India is still low compared to most of the developed countr ies
In terms of CO2 emission per unit of Total Pr imary Energy Supply (in MT/tera joule) India has
comparatively low intensity of emission (53.2 in 2007) as compared to developed countr ies:
China(73.6), R ussia(56.4), UK(59.1), France(33.4), Germany(57.6), Canada(50.8), USA(58.9) and
Australia(76.3).
OZONE DEPLETING POTENTIAL:
India became par ty to the Montreal Protocol in 1992. As per Ar ticle 7 of the Montreal Protocol, India
maintains and repor ts Ozone Depleting substance (ODP) data on year to year basis. The per capita
consumption of ODS in India did not cross 20 g between 199597 (base line) as against 300 g
permitted under the Protocol. India was self suff icient in production of Cloro Fluro Carbons (CFCs)
and was mainly producing and using nine of the 95 substances controlled under the Montreal
Protocol. India is in the process of phasing out ODS both in the end use consumption sector and in
production sector. As on 31 August 2009, India has 299 ODS phase out pro jects to phase out 47,085
ODP tonne.

8/8/2019 Undp,Mdg,Global Compact
http://slidepdf.com/reader/full/undpmdgglobal-compact 29/32
EFFICIENT ENER GY USE:
Lower ing energy intensity of GDP growth through higher energy eff iciency is key to meeting India¶s
energy challenge and achieving its energy secur ity. The industry sector is the largest user of
commercial energy in India, accounting for 42% of the country¶s total commercial energy use dur ing
200405 (NAPCC 2008).
As a par ty to the UN Framework Convention on Climate Change (UNFCCC) and its Kyoto protocol,
India played an active role in multilateral cooperation to address climate change. The Global
Environmental Facility (GEF) f inances implementation of pro jects in developing countr ies under the
Convention. Additionally, the Kyoto Protocol created the Clean Development Mechanism (CDM),
which allows developed countr ies to meet par t of their emission reduction commitments by
purchasing credits from emission reduction pro jects in developing countr ies. India accounts for about
32% of the wor ld total 1081 pro jects registered with the CDMEB, followed by China (20%), Brazil
(13%) and Mexico (10%) (Source: UNFCCC). While per capita energy consumption increased from
2337.47 KWH in 198990 to 3928.16 KWH in 200708, the energy consumption per unit (R upee) of
GDP at 19992000 pr ices decreased from 0.17 in 198990 to 0.13 in 200708
T 2
Halve, by 2015, the propor tion of people without sustainable access to safe dr ink ing water and
basic sanitation

8/8/2019 Undp,Mdg,Global Compact
http://slidepdf.com/reader/full/undpmdgglobal-compact 30/32
Indi
y Propor tion of Population with Sustainable Access to an Improved Water Source, Urban and
R ural.
y P
ropor tion of population with Access to Improved Sanitation, Urban and R ural.
ACCESS TO IMPR OVED DR INKING WATER SOUR CES:
In terms of actual estimates from NFHS and DLHS, the coverage of households having access to
improved water sources gives a clear trend in attainment of MDGtarget. The overall propor tion of
households having access to improved water sources increased from about 68.2% in 199293 (about
60.9% for rural and 87.6% for urban) to 84.4% in 200708 (79.6% for rural and 94.4% for urban).
The latest estimates based on DLHS 200708 show a down turn following the NFHS estimates for
200506 register ing a much better situation with the overall propor tion of about 88% (84.5% for rural
and 95% for urban)
The propor tion of rural households having access to improved dr ink ing water sources is likely to
reach 99% by 2015 (against target of 79.5%) and that of the urban households is likely to reach
98%(against the target of 94%).
ACCESS TO IMPR OVED SANITATION FACILITIES:
India, one of the most densely populated countr ies in the wor ld, has the lowest sanitation coverage. Households without any sanitation facility at 76% (1990) were required to reduce that propor tion to
38% by 2015. But the expected rate is 46% by 2015 and India is missing the target by about 8
percentage points.
T 3
By 2020, to have achieved a signif icant improvement in the lives of at least 100 million slumdwellers
Indi :
Propor tion of households with access to secure tenure
India is home to 63% of all slum dwellers in South Asia. This amounts to 170 million people, 17% of
the wor ld¶s slum dwellers. In India, slum data have been collected for the f irst time in Census 2001

8/8/2019 Undp,Mdg,Global Compact
http://slidepdf.com/reader/full/undpmdgglobal-compact 31/32
for towns/cities having urban population of 50000 or more. Comparative figures for any other period
is not available for assessing any progress in the situation.
SLUM POPULATION 1991 (TCPO
ESTIMATES)
46.26 MILLION
SLUM POPULATION 2001 (TCPO
ESTIMATES)
61.82 MILLION
NO. OF TOWNS R EPOR TING SLUMS IN
CENSUS 2001
640(TOWNS WITH POPULATION OF 50000
OR MORE)
R EPOR TED SLUM POPULATION IN 640
TOWNS, 2001
42.58 MILLION
POPULATION OF TOWNS/CITIES
R EPOR TING SLUMS, 2001
184.35 MILLION
GOAL 8: DEVELOP A GLOBAL PAR TNER SHIP FOR DEVELOPMENT
Target 1
in cooperation with the private sector, make available the benefits of new technologies, especially
information and communications
Indicators
y telephone lines and cellular subscribers per 100 population
y personal computers in use per 100 population internet users per 100 population
India has emerged as one of the major development partner for nurturing techno economic and
intellectual assistance to various developed countries across the different regions of the world. Indian
ICT is well known and provides reputed ICT solutions across the world. Government of India plans
to raise internet subscriber base to 100 million, provide internet connectivity to all villages in the
country by 2014.Currently India has about 45 million internet users.
The broadband connectivity at
present is available to only 2% of the country¶s population and PC penetration is just 3%.

8/8/2019 Undp,Mdg,Global Compact
http://slidepdf.com/reader/full/undpmdgglobal-compact 32/32
By end of September 2009 Total telephone subscr i ber base has reached to 509.03 million with 471.03
million wireless connection and 37.31 million wire line connections. The rural subscr i ber base is
151.81 million against the urban base of 357.22 million. The tele density in the urban areas of the
states of Andhra Pradesh, Bihar, Himachal, Pradesh, Kerala, and R a jasthan is more than 100, which
signify more than one telephone per head in these areas.