underwriting and policy management - guidewire...
TRANSCRIPT

Underwriting and Policy Management Summary of Strategic Study Results
May 2011
Sponsored by:
Empowering Companies Through Knowledge®

Underwriting and Policy Management May 2011
©Copyright, Ward Group 2011 PAGE 1
Table of Contents
Introduction Overview ............................................................................ 2 Profile of Participants ......................................................... 2 Financial Calculations ......................................................... 3 Calculation of Performance Measures ................................ 3
Key Findings Overall Benchmark Results ................................................. 5 High Profit Performers • Profile for Personal Lines ............................................ 14 • Profile for Commercial Lines ...................................... 18 High Efficiency • Impact on Personal Lines ........................................... 22 • Impact on Commercial Lines ....................................... 27 Growth • Impact on Personal Lines ........................................... 32 • Impact on Commercial Lines ...................................... 36
Ward Group 11500 Northlake Drive Suite 305 Cincinnati, OH 45249-1662 Phone: 513-791-0303 Fax: 513-985-3442 www.wardinc.com

Underwriting and Policy Management May 2011
©Copyright, Ward Group 2011 PAGE 2
Introduction
Overview
Ward Group conducted a survey of underwriting and policy management business practices at property and casualty insurance companies to determine the impact these business practices may have on a company’s underwriting performance. Survey responses were combined with publicly available financial data to complete this analysis. The following report summarizes the findings.
Profile of Participants
• A diverse group of 51 insurance carriers from the United States and Canada participated in the study. In order to maintain the confidentiality of the data, the names of the participants have not been disclosed. Results are calculated using the total number of participant responses to each survey topic.
• Premium volume of participants ranged from $12 million to $4.5 billion and was made up of 30 personal lines focused carriers and 21 commercial lines focused carriers.
• Benchmark groups were developed to highlight participant line of business focus, profitability, efficiency and growth.
• A complete comparison by benchmark group is provided in the appendix.
Participant Profile Overall Personal Carriers
Commercial Carriers
Number of Companies 51 30 21
Gross Premium Written $573M $548M $593M
Business Mix Personal Auto 46.0% 61.2% 25.6% Homeowners 14.0% 16.9% 10.1% Workers Compensation
10.5% 1.2% 23.1%
Other Commercial Lines
24.7% 13.0% 40.3%
Other 4.8% 7.6% 0.9%
Distribution Channel Mix Independent Agency 75.4% 69.4% 85.3% Captive/Exclusive Agency
14.0% 22.1% 1.7%
Direct Writer 10.6% 8.6% 13.0%
Active States 14.2 11.3 18.0
Underwriting and Policy Management INTRODUCTION May 2011
©Copyright, Ward Group 2011 PAGE 3
Financial Calculations
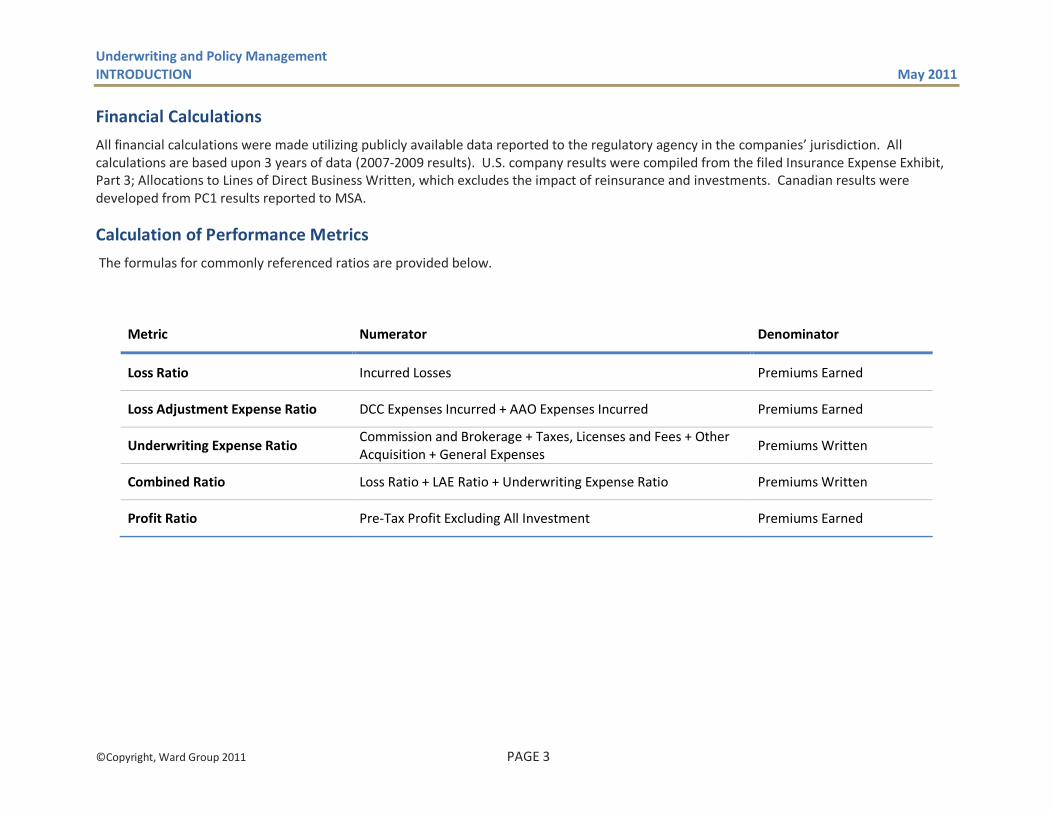
All financial calculations were made utilizing publicly available data reported to the regulatory agency in the companies’ jurisdiction. All calculations are based upon 3 years of data (2007-2009 results). U.S. company results were compiled from the filed Insurance Expense Exhibit, Part 3; Allocations to Lines of Direct Business Written, which excludes the impact of reinsurance and investments. Canadian results were developed from PC1 results reported to MSA.
Calculation of Performance Metrics
The formulas for commonly referenced ratios are provided below.
Metric Numerator Denominator
Loss Ratio Incurred Losses Premiums Earned
Loss Adjustment Expense Ratio DCC Expenses Incurred + AAO Expenses Incurred Premiums Earned
Underwriting Expense Ratio Commission and Brokerage + Taxes, Licenses and Fees + Other Acquisition + General Expenses
Premiums Written
Combined Ratio Loss Ratio + LAE Ratio + Underwriting Expense Ratio Premiums Written
Profit Ratio Pre-Tax Profit Excluding All Investment Premiums Earned

Underwriting and Policy Management May 2011
©Copyright, Ward Group 2011 PAGE 4
Key Findings

Underwriting and Policy Management May 2011
©Copyright, Ward Group 2011 PAGE 5
Overall Benchmark Results
Financial Results of the Benchmark Group
The financial results of the participants in this survey were representative of the total US Property & Casualty Industry as a whole.
Most Profitable Line of Business:
Commercial lines excluding workers compensation with a 3 year profit ratio of 8.6%, primarily driven by a loss ratio of 51.2%.
Least Profitable Line of Business:
Workers compensation was the line of business with the lowest profit ratio, posting a 10.5% loss.
Lowest Underwriting Expense Ratio:
Personal auto and workers compensation reported the lowest underwriting expense ratios at 23.7% and 23.8% respectively.
Highest Underwriting Expense Ratio:
Homeowners had the highest underwriting expense ratio at 31.3%.
Benchmark versus Industry Comparison US P&C
Industry Overall
Benchmark
Loss Ratio 59.9% 59.9% LAE Ratio 11.7% 10.5% Underwriting Expense Ratio 26.2% 26.9% Profit Ratio 1.6% 1.1%
Financial Results – Overall Benchmark
Loss Ratio Underwriting Expense Ratio
Profit Ratio
Personal Auto 64.2% 23.7% 0.8% Homeowners 64.8% 31.3% -5.3% Workers Comp. 64.8% 23.8% -10.5% Other Commercial 51.2% 30.3% 8.6% Total 59.9% 26.9% 1.1%

Underwriting and Policy Management OVERALL BENCHMARK RESULTS May 2011
©Copyright, Ward Group 2011 PAGE 6
Growth and Expansion
From 2007 to 2009, personal lines focused carriers experienced more premium growth. Personal lines focused carriers grew 2.9% while the average commercial lines company premium decreased by -3.0%.
• Average Number of Active States: 14
• Experienced State Expansion Within Last 3 Years: 40% of companies
• State Expansion Expected in Next 3 Years: 56% of companies plan to expand with 18% planning to expand into 3 or more states/provinces
Growth impacted carrier performance. Personal lines carriers in the top quartile of growth experienced a profit ratio that was 1 point lower, a combined ratio 1.5 points higher, and a underwriting expense ratio that was 2 points higher than the overall personal lines benchmark. Commercial carriers in the top quartile of growth had slightly better results with a profit ratio 4 points higher, combined ratio 1 point lower, and a underwriting expense ratio 1.5 points higher than the overall commercial lines group. Both personal and commercial growth companies experienced lower retention than their line of business peers.
How do companies plan to grow their business?
1. Organic growth of existing products 2. Introduction of new products to current lines of business 3. Geographic expansion
Introduction of new lines of business and the acquisition of other insurers were the two lowest ranked growth opportunities.
Growth Rate
Overall Personal Carriers
Commercial Carriers
Personal Auto 3.5% 3.7% 0.5% Homeowners 4.3% 4.5% 3.1% Workers Comp. -9.8% -5.4% -10.1% Other Commercial 6.8% 8.7% 5.4% Total 0.2% 2.9% -3.0%

Underwriting and Policy Management OVERALL BENCHMARK RESULTS May 2011
©Copyright, Ward Group 2011 PAGE 7
Underwriting Profitability
Risk Selection and Pricing were the primary concerns for participating companies. Personal lines carriers focused more on pricing, while commercial lines companies were more focused on risk selection.
Ranked Drivers of Profitability
1. Underwriting decision making 2. Actuarial analysis 3. Customer Service/Retention 4. Data quality
Expense Trend Analysis
32% of the survey participants indicated their expense performance was inferior to that of their peers.
• 30% of carriers indicated underwriting expenses trends increased over the last 3 years.
• Commercial carriers were more likely to indicate a trend of increasing underwriting expenses.
41.2%
37.3%
13.7%
7.8%
Primary Underwriting Focus Overall Benchmark
Pricing
Risk Selection
Ease of Doing Business
Service
4.0%
22.0%
42.0%
28.0%
4.0%
Significantly Outperforming Peers
Outperforming Peers
Equal to Peers
Underperforming Peers
Significantly Underperforming Peers
Underwriting Expense ComparisonOverall Benchmark

Underwriting and Policy Management OVERALL BENCHMARK RESULTS May 2011
©Copyright, Ward Group 2011 PAGE 8
Operational Focus
Staffing
• Carriers felt they were appropriately staffed in most underwriting areas. Product development was the most commonly understaffed function, with 45% of participants indicating they were currently understaffed in that area.
• 72% of participants indicated that underwriter policy and premium expectations have increased over the last five years.
• While underwriters were focused more on the higher value activities of underwriting decision making and customer interaction, managers highlighted the need to further reduce the amount of time spent on administrative activities such as policy processing and procedural compliance.
Efficiency
• A larger percentage of companies (38%) believed their employees are as efficient as their industry peers.
• 30% of companies felt their employees are more efficient.
• 32% of companies believed their employees are less efficient than their peers.
• Only 6% of companies indicated operational efficiency as a primary driver of profitability and only 8% indicated a need for improved operational efficiency to achieve better underwriting results.
17.8%
14.0%
32.4%
35.8%
7.7%
10.5%
38.9%
43.0%
Policy Processing
Procedural Compliance
Customer Interaction
Underwriting Decision Making
Underwriter Time By Activity Overall Benchmark
Preferred Actual
30.0%
38.0%
32.0%
Perceived Employee Efficiency Overall Benchmark
Outperforming Compentition
Equal to Competition
Underperforming Competition

Underwriting and Policy Management OVERALL BENCHMARK RESULTS May 2011
©Copyright, Ward Group 2011 PAGE 9
Agency/Broker Engagement
Having an easy to use agent portal and fast response times to inquiries was rated as the most important factor for agent ease of doing business.
Agent/Broker Evaluation of Ease of Doing Business
• 43% outperforming peers
• 21% equal to peers
• 36% underperforming peers
Agent Self-Service Capabilities
• More self-service capabilities are provided to agents for front-end activities such as quoting, binding and viewing policy information. Fewer capabilities are offered for post issuance activities like policy changes, reporting claims or viewing commission information.
• Agents of personal lines carriers have more self-service capabilities than those of commercial lines carriers.
37.5%
25.0%
16.7%
16.7%
4.2%
Primary Factor for Agent/Broker Ease of Doing Business
Easy to Use Agent/Broker Portal
Fast Response to Inquires/Requests
Real Time Quotes
Friendly Staff
Transparency
83.0%
83.0%
83.0%
78.7%
61.7%
70.2%
80.9%
74.5%
57.4%
View Account Information
View Policies
Generate Quotes
Bind Policies
Policy Changes
Report Claims
View Claim Status
Bill Pay
View Commission Information
Agent/Broker Self-Service Capabilities

Underwriting and Policy Management OVERALL BENCHMARK RESULTS May 2011
©Copyright, Ward Group 2011 PAGE 10
The Customer
Customer Retention
• Line of Business with Highest Retention: Homeowners with an average retention ratio of 86.3%.
• Line of Business with Lowest Retention: Personal auto and workers compensation had the lowest average retention ratios at 83.6%.
Brand Recognition
Half of all participants indicated that their company had lower brand recognition than their peers. Lower brand recognition was more pronounced for highly profitable personal lines companies with 63% of them indicating lower brand recognition compared to their peers.
Ranked Consumer Ease of Doing Business Factors:
1. Short response times to inquiries 2. Ability to talk to a live person 3. Friendly Staff
Web and phone self-service capabilities were the two lowest ranked factors carriers felt consumers considered when determining ease of doing business.
84.1%83.6%
86.3%
83.6% 83.9%
Overall Personal Auto
Homeowners Workers Compensation
All Other Commercial
Lines
Retention Ratios by Line of Business Overall Benchmark

Underwriting and Policy Management OVERALL BENCHMARK RESULTS May 2011
©Copyright, Ward Group 2011 PAGE 11
The Customer (continued)
Customer Self-Service Capabilities
Online bill pay and online submission of claims were the most widely offered self-service options to consumers. Because 75% of the companies in the survey distributed their products through independent agents, fewer of them offered self-service options for online quotes and purchasing of a policy.
34%
26%
29%
57%
26%
74%
63%
24%
21%
27%
55%
12%
70%
70%
38%
24%
48%
52%
10%
71%
76%
9%
3%
19%
28%
66%
56%
Receive Quote
Purchase Policy
Bind Policy
View Policy
Change Policies
Online Bill Pay
Online Claims Reporting
Customer Self-Service Capabilities by Line of Business
Other Commercial Work Comp Homeowners Personal Auto

Underwriting and Policy Management OVERALL BENCHMARK RESULTS May 2011
©Copyright, Ward Group 2011 PAGE 12
Technology
Core System Functionality
• 60% of participants indicated the need for better core system functionality in order to make improved underwriting decisions.
• 40% of companies indicated that their policy administration system is technologically behind that of their peers.
• Nearly 70% of companies are considering or have recently replaced their policy administration system or rating application in the last 5 years.
Cross-sell/Up-sell Integration
• 68% of the participants indicated the introduction of new products and organic growth of existing products to be the best opportunity for growth. They also indicated their current systems do not adequately support product cross-sell and up-sell.
• 71% of companies did not have systems that identified cross-sell/up-sell opportunities based on customer characteristics.
• 90% of the participant’s systems did not track offers made and conversion rates.
• 30% of companies believed they were not collecting sufficient information during the upfront sales process.
• 70% of companies indicated they must have better quality data in order to segment customers, define markets and find new business opportunities.
Number of Policy Administration Systems 1.5
Total Number of Systems Required for Complete View of Customer
2.5
Average Policy Administration Age 10.9
Years
Average Rating System/Software Age 9.4
Years Percentage of Systems Developed by External Vendors
54%
45.0%
23.0%
32.0%
Percent of Companies Likely to Replace Underwriting System
Yes
Recently Replaced
No

Underwriting and Policy Management OVERALL BENCHMARK RESULTS May 2011
©Copyright, Ward Group 2011 PAGE 13
Processing
Straight Through Processing Adoption
• Personal auto was the line of business with the highest utilization of new business straight through processing.
• Commercial lines straight through adoption rates were less than 50%.
• The top quartile of performers for straight through processing have a personal auto new business pass rate of 90% and 78% for homeowners.
• 42% of participants indicated that pass rates have increased in the last 3 years.
New Business Pass Rates
Overall
Benchmark Top Quartile
Personal Auto – Actual 46.2% 89.7%
Personal Auto –Target 66.7% 92.2%
Homeowners – Actual 31.7% 78.0%
Homeowners – Target 49.9% 82.8%
Workers Compensation – Actual 12.9% 53.6%
Workers Compensation – Target 23.4% 63.5%
All Other Commercial Lines – Actual 4.6% 24.7%
All Other Commercial Lines – Target 20.6% 46.4%
83.3%73.5%
48.0% 47.4%
Personal Auto Homeowners Workers Compensation
Other Commercial
Lines
Companies Utilizing Straight Through Processing by Line of Business

Underwriting and Policy Management May 2011
©Copyright, Ward Group 2011 PAGE 14
Profile of a Personal Lines High Performer Financial Results - Personal Lines To understand if there is a correlation of business practices and profitability in personal lines, those personal lines companies in the top quartile of profit ratio over the 3 year period analyzed, were grouped into the Personal Lines High Performer Benchmark Group.
• The companies in this high performer group had profit ratios that significantly outperformed the overall personal lines group on both personal auto and homeowners. The high performers outperformed the overall personal lines group by 4.3 points on personal auto and 10.5 points on homeowners. For all lines of business, the high performers profit ratio was 4.4 points higher than the overall personal lines group.
• The high performing companies, on average, were slightly larger than the overall personal lines benchmark, $625M in gross premium written versus $548M, yet they had a comparable business mix to the overall group.
• Profitability for this group was primarily driven by a lower underwriting expense ratio. The underwriting expense ratio for the high performers was 9 points lower at 17.4% compared to 26.4% for the overall personal lines group. Interestingly, 50% of the high performers indicated they believed their underwriting expense performance was underperforming their peers. 37% of the high performers also indicated that their three year underwriting expenses increased as a percent of premium, compared to only 19% of the overall group.
• The high profit performers had a loss ratio that was 2.5 points higher than the overall group primarily driven by losses in the auto and other commercial lines of business.
• High performers were aware they were more profitable, with 88% indicating they believed their underwriting profitability was outperforming that of their peers.
KEY FACTS Personal Lines High Performer Benchmark
- Larger in size - Wrote business in fewer states - Lower premium growth rate - Introduction of new products seen as best
opportunity for growth - Less likely to expand geographically - Higher retention ratio - Higher straight through pass rates - Ease of doing business ranked as highest area
of underwriting focus - Better utilized systems to identify cross-
sell/up-sell opportunities
Financial Results
Personal
Lines High
Performer Profit Ratio
Personal Auto 1.0% 5.3% Homeowners -4.6% 5.9%
Loss Ratio Personal Auto 64.3% 65.8% Homeowners 63.9% 56.7%
Expense Ratio Personal Auto 23.4% 16.0% Homeowners 31.4% 28.4%

Underwriting and Policy Management PROFILE OF PERSONAL LINES HIGH PERFORMERS May 2011
©Copyright, Ward Group 2011 PAGE 15
The Focus - Personal Lines
• Underwriting decision making was ranked as the highest factor of profitability by both the personal lines high performers and the overall group. The personal lines high performers considered rate calculations to be the second most important factor. The overall group was more likely to believe that actuarial analysis and operational efficiency were also significant contributors to profitability.
• To achieve better underwriting results, 26.7% of the overall personal group indicated the need for better data gathering during the submission process. None of the high performers indicated that need. The high performers were more likely to indicate a need for real time guidance to staff and agents as part of the up-front sales effort.
• The personal lines high performers, while larger in premium size, were not as focused on growth and actively wrote business in a fewer number of states, 8 versus 11 for the overall group.
• The high performers were less likely to have expanded geographically in the last 3 years. As a result, the premium growth rate of the high performers was 1.6% compared to a 2.9% growth rate for the overall group.
• High performers consider the addition of new products to existing lines of business as the greatest opportunity for growth compared to the overall group that believed organic growth of existing products to present the best opportunity.
33.3%
26.7%
6.7%
6.7%
16.7%
10.0%
37.5%
12.5%
12.5%
12.5%
25.0%
Decision Making
Actuarial Analysis
Customer Service
Data Quality
Rate Calculations
Operational Efficiency
Profitability Driver
53.3%
23.3%
16.7%
6.7%
37.5%
50.0%
12.5%
0.0% 20.0% 40.0% 60.0%
Organic Growth
New Products to Current Lines
Geographical Expansion
Acquisitions
Best Growth Opportunity
High Performers Personal Lines

Underwriting and Policy Management PROFILE OF PERSONAL LINES HIGH PERFORMERS May 2011
©Copyright, Ward Group 2011 PAGE 16
The Customer – Personal Lines
Service
• The primary underwriting focus of the high performers was slightly different than the overall benchmark. 38% of high performers rated customer and agent ease of doing business as their primary underwriting focus compared to only 20% of the overall personal lines group. This increased focus on ease of doing business highlights the fact that the high performers were less likely to offer agent/broker and customer self-service capabilities.
Retention
• Even with fewer self-service capabilities, personal lines high performers indicated higher retention ratios across all lines of business with a total retention ratio 5 points higher than the overall group.
Customer Retention Ratio
Personal Lines High Performer Personal Auto 83.6% 90.0% Homeowners 86.3% 89.6% Workers Comp. 81.8% 87.5% Other Commercial 83.9% 88.3% Total 84.5% 89.4%
• When asked to rank what factors a consumer considers
important with regard to ease of doing business, the high performers 63% of the time indicated the ability to speak with a live person as the most important factor. This compares to only 32% of the overall personal lines group.
38%
31%
31%
59%
28%
62%
13%
13%
13%
25%
13%
63%
Receive Quote
Purchase Policy
Bind Policy
View Policy
Change Policies
Report Claims
Customer Self-Service Capabilities - Personal Auto
93%
89%
96%
89%
68%
82%
75%
63%
88%
88%
50%
75%
View Accounts
View Policies
Generate Quotes
Bind Policies
Report Claims
View Claim Status
Agent/Broker Self-Service Capabilities
High Performers Personal Lines

Underwriting and Policy Management PROFILE OF PERSONAL LINES HIGH PERFORMERS May 2011
©Copyright, Ward Group 2011 PAGE 17
Technology – Personal Lines
• High performing personal lines companies were more likely to have a newer policy administration system and rating engine. The average age for the high performers processing systems was 8.2 years, compared to 11.6 for the overall benchmark. Although the high performers had newer core systems, they were more likely to be considering replacement of those systems.
• The high performers had fewer processing systems than the overall personal lines group.
• 75% of high performers indicated that their systems were on par or more advanced than their peers, compared to 56% of the overall group.
• While the high performers indicated the introduction of new products and organic growth of existing products to be the best opportunity for growth, they also indicated that their current systems do not adequately support product cross-sell and up-sell.
• High performing personal lines carriers have slightly higher new business straight through pass rates than the overall personal lines group, with a personal auto pass rate of 67% compared to 58%, and a homeowners pass rate of 46% compared to 39%.
53%
22%
24%
56%
31%
13%
Yes, Considering
Recently Replaced
No, Not Considering
Underwriting System Replacement Consideration
High Performers Personal Lines
58%
39%
67%
46%
Personal Auto Homeowners
Straight Through ProcessingPercent of New Business
Personal Lines High Performers

Underwriting and Policy Management May 2011
©Copyright, Ward Group 2011 PAGE 18
Profile of a Commercial Lines High Performer Financial Results - Commercial Lines
To understand if there is a correlation of business practices and profitability on commercial lines, those commercial lines companies in the top quartile of profit ratio over the 3 year period analyzed, were grouped into the Commercial Lines High Performer Benchmark Group.
• The commercial lines high performers had profit ratios that were superior to the overall commercial lines group. The high performers profit exceeded the overall commercial lines group by 31.5 points on workers compensation and 21.3 points on all other commercial lines. For all lines of business, the commercial high performers profit ratio was 22.7 points higher than the overall commercial lines group.
• In contrast to the personal lines high performers, the high performing commercial carriers, on average, were significantly smaller than the overall commercial lines benchmark, $115M in GPW versus $593M. These companies were more targeted in their business model, working in niche markets or offering specialty products.
• The primary driver of the profit variance from the high performers to the overall commercial lines group was a lower loss ratio, with the high performers having a 3 year loss ratio 24.2 points lower on workers compensation and 11.1 point lower on all other commercial lines.
• Expense ratios for workers compensation were consistent between the two groups, except for the high performers in all other commercial lines, who had an expense ratio 5.2 points lower than the overall commercial group. Approximately 50% of the high performers indicated their underwriting expenses have increased over the last 3 years, while 33% reported expenses have remained flat.
• As we saw in personal lines, high performing commercial carriers were also aware they were more profitable, with 50% indicating they believed their profitability was outperforming their peers.
KEY FACTS Commercial Lines High Performer Benchmark
- Significantly smaller in size - Lower premium growth than the overall
group - Operate in more states - Less likely to have expanded geographically - Consider geographic expansion as the best
opportunity for growth - Slightly lower retention - Focused equally on pricing and risk selection - Slightly newer systems and rating engine - Limited straight-through processing
Financial Results
Commercial
Lines High
Performer Profit Ratio
Workers Comp. -10.4% 21.1% All Other 9.8% 31.1%
Loss Ratio Workers Comp. 64.9% 40.7% All Other 51.8% 40.7%
Expense Ratio Workers Comp. 23.6% 23.9% All Other 29.4% 24.2%
Underwriting and Policy Management PROFILE OF COMMERCIAL LINES HIGH PERFORMERS May 2011
©Copyright, Ward Group 2011 PAGE 19
The Focus – Commercial Lines
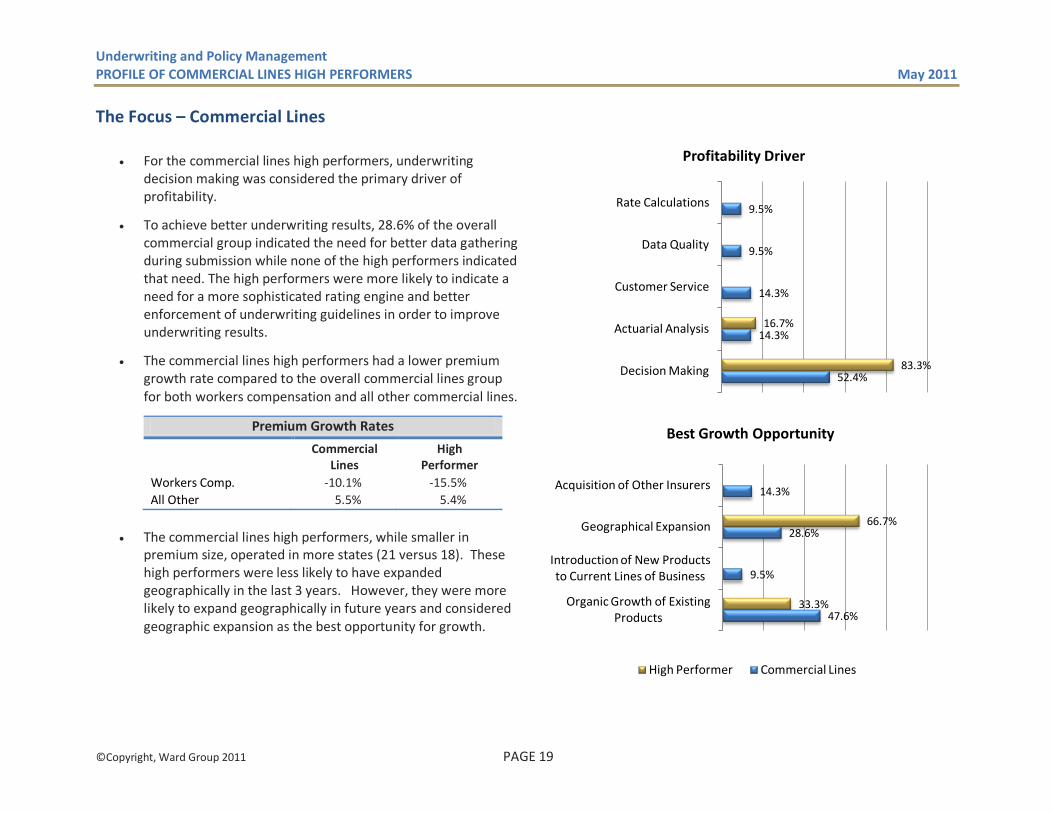
• For the commercial lines high performers, underwriting decision making was considered the primary driver of profitability.
• To achieve better underwriting results, 28.6% of the overall commercial group indicated the need for better data gathering during submission while none of the high performers indicated that need. The high performers were more likely to indicate a need for a more sophisticated rating engine and better enforcement of underwriting guidelines in order to improve underwriting results.
• The commercial lines high performers had a lower premium growth rate compared to the overall commercial lines group for both workers compensation and all other commercial lines.
Premium Growth Rates
Commercial
Lines High
Performer Workers Comp. -10.1% -15.5% All Other 5.5% 5.4%
• The commercial lines high performers, while smaller in
premium size, operated in more states (21 versus 18). These high performers were less likely to have expanded geographically in the last 3 years. However, they were more likely to expand geographically in future years and considered geographic expansion as the best opportunity for growth.
52.4%
14.3%
14.3%
9.5%
9.5%
83.3%
16.7%
Decision Making
Actuarial Analysis
Customer Service
Data Quality
Rate Calculations
Profitability Driver
47.6%
9.5%
28.6%
14.3%
33.3%
66.7%
Organic Growth of Existing Products
Introduction of New Products to Current Lines of Business
Geographical Expansion
Acquisition of Other Insurers
Best Growth Opportunity
High Performer Commercial Lines

Underwriting and Policy Management PROFILE OF COMMERCIAL LINES HIGH PERFORMERS May 2011
©Copyright, Ward Group 2011 PAGE 20
The Customer – Commercial Lines
Service
• When asked to rate their agent/broker’s impression of their company’s ease of doing business, 50% of the commercial lines carriers indicated that they were outperforming their peers, compared to 33% of the high performers.
• The high profit performers were also more focused on speed. They considered short response times to inquiries as the most important factor for ease of doing business with consumers.
Retention
• Retention results were consistent between the high performers and the overall commercial group with a 1.4% higher retention rate for the high performer on workers compensation and identical rates on all other commercial lines.
Customer Retention
Commercial
Lines High
Performer Personal Auto 84.6% 75.0% Homeowners 86.4% 82.5% Workers Comp. 84.4% 85.8% Other Commercial 83.8% 83.8% Total 83.8% 82.5%
70.0%
75.0%
65.0%
65.0%
30.0%
75.0%
80.0%
66.7%
66.7%
50.0%
50.0%
16.7%
66.7%
50.0%
View Accounts
View Policies
Generate Quotes
Bind Policies
Policy Changes
Report Claims
View Claim Status
Agent/Broker Self-Service Abilities
High Performers Commercial Lines

Underwriting and Policy Management PROFILE OF COMMERCIAL LINES HIGH PERFORMERS May 2011
©Copyright, Ward Group 2011 PAGE 21
Technology – Commercial Lines
• High performing commercial lines policy administration
systems were 9.3 years old, just slightly newer than those of overall commercial carriers at 9.7 years. None of the commercial high performers were considering system replacement.
• The high performers were also more likely to have newer rating software than the overall commercial group (6.3 years versus 8.9). Again, none of the high performing companies were considering replacement of their rating software despite the fact they considered a more sophisticated rating engine as their greatest need for achieving underwriting profitability.
• The high performer group is more likely to utilize their systems to develop cross-sell and up-sell opportunities and also track the conversion rates of those opportunities.
33%
24%
43%
33%
67%
Yes, Considering
Recently Replaced
No, Not Considering
Underwriting System Replacement Consideration
10%
5%
17% 17%
Cross-sell/Up-sell Opportunities
Integrated into Front End Applications
System Tracks Offers Made and Conversion Rate of Those Offers
System Based Cross Selling
Commercial Lines High Performer

Underwriting and Policy Management May 2011
©Copyright, Ward Group 2011 PAGE 22
Straight Through Processing: Impact on Personal Lines
Profile of a Personal Lines High Efficiency Benchmark Group
Straight through processing on new business has been embraced by most personal lines carriers. 83% of the companies surveyed utilized straight through processing on personal auto and 76% indicated the same for homeowners. To determine if there is a correlation between straight through processing and financial results, a benchmark group of companies with high straight through processing pass rates was created.
• This “Personal Lines High Efficiency” benchmark is made up of
the top quartile of companies that had higher new business pass through rates than the overall personal lines benchmark. The personal auto pass rate for the high efficiency group was almost 40 points higher than overall personal lines group and the homeowners pass rate was 24 points higher. The high efficiency group also had higher targets for new business pass rates and was more likely to have had significant increases in pass rates over the past 3 years compared to the overall group.
• The high efficiency group was larger in size at $1,029M, compared to the overall personal lines group at $548M. They also had a lower growth rate and slightly less exposure to commercial lines than the overall group (9% versus 14% commercial lines exposure).
• Geographically, both the high efficiency and overall groups wrote in approximately 11 states and had similar geographic expansion plans.
KEY FACTS Personal Lines High Efficiency Benchmark
- Higher straight through new business pass rates
- Better financial results - Larger average in-force premium - Higher customer retention - Greater focus on pricing - Spend less time on basic policy processing - More customer self-service offerings - Focused on high-touch customer
interactions - Newer underwriting systems - Utilize systems to develop cross-sell/up-sell
opportunities
New Business Straight Through Pass Rate
Personal
Lines High
Efficiency
Personal Auto – Actual 48.2% 87.4%
Personal Auto – Target 68.9% 93.0%
Homeowners – Actual 29.5% 53.8%
Homeowners – Target 51.2% 71.9%

Underwriting and Policy Management HIGH EFFICIENCY: IMPACT ON PERSONAL LINES May 2011
©Copyright, Ward Group 2011 PAGE 23
Financial Results – Personal Lines High Efficiency Benchmark
• Financial results for the high efficiency companies were more favorable compared to the overall personal lines group.
Personal Lines High Efficiency Benchmark Combined
Ratio Underwriting Expense Ratio
Loss Ratio Profit Ratio
2 Pts Lower 3 Pts Lower On Par 2 Pts Higher
• The variance in profit ratio between the high efficiency and
overall personal benchmark was most evident in the homeowners line of business. The overall personal benchmark had a -4.6% loss in homeowners, compared to a 3.1% profit for the high efficiency companies.
• While both the high efficiency and overall personal groups indicated the primary driver of their profitability to be actuarial analysis, high efficiency companies ranked data quality as the second highest factor. The overall personal group ranked underwriting decision making second.
• High efficiency companies ranked better real-time guidance and improved customer information visibility as the two most important needs to achieve better underwriting results, compared to the overall personal group, which ranked better data gathering during submission and a more sophisticated rating engine as their primary needs.
• Customer retention was also better for the high efficiency group both for personal auto and homeowners.
Financial Results by Line of Business
Personal Lines High Efficiency Profit Ratio
Personal Auto 1.0% 2.9% Homeowners -4.6% 3.1%
Loss Ratio Personal Auto 64.3% 63.2% Homeowners 63.9% 58.7%
Expense Ratio Personal Auto 23.4% 22.0% Homeowners 31.4% 29.5%
84%
86%
87%
88%
Personal Auto
Homeowners
Personal Lines Retention Ratios
High Efficiency Personal Lines

Underwriting and Policy Management HIGH EFFICIENCY: IMPACT ON PERSONAL LINES May 2011
©Copyright, Ward Group 2011 PAGE 24
The Focus – Personal Lines High Efficiency Benchmark
• The underwriting focus of high efficiency companies was more
on pricing than the overall personal lines group.
• The high efficiency group (55%) was more likely to agree that their company was not collecting sufficient data and information in the upfront sales process in order to appropriately price risks compared to the overall personal group (40%).
• Underwriters at the high efficiency companies spent less time on basic policy processing activities and more time on underwriting decision making than the overall group. Both the high efficency and overall groups indicated a desire to further reduce underwriter focus on administrative activities such as policy processing and procedural complaince.
36.7%
33.3%
20.0%
10.0%
55.6%
33.3%
11.1%
Pricing
Risk Selection
Ease of Doing Business
Service
Primary Underwriting Focus
20.9%
14.5%
31.7%
32.9%
13.9%
18.3%
31.7%
36.1%
Policy Processing
Procedural Compliance
Customer Interaction
Underwriting Decision Making
Underwriter Time by Activity
High Efficiency Personal Lines

Underwriting and Policy Management HIGH EFFICIENCY: IMPACT ON PERSONAL LINES May 2011
©Copyright, Ward Group 2011 PAGE 25
The Customer – Personal Lines High Efficiency Benchmark
Service
• All of the companies in the high efficiency group gave their agents the ability to quote, bind and make policy changes. The overall group was slightly less likely to provide those capabilities with only 96% able to generate quotes, 90% bind policies and 85% make changes to policies once issued. This difference in capability was well known by the carriers as 62.5% of the high efficiency group indicated that they were outperforming their peers with regards to agent/broker ease of doing business, compared to only 35% of the overall personal group.
• For the overall personal group, an easy to use agent/broker portal was indicated as the most important factor agents consider for ease of doing business. Conversely, the high efficiency companies believed real time quoting was the most important factor.
• The personal lines high efficiency group was more focused on high-touch interactions with customers and indicated that web self service capabilities were less important than the ability for a customer to speak with a live person. 50% of the high performers rated talking to a live person as most important factor to customer ease of doing business.
14%
35%
17%
10%
17%
7%
11%
55%
11%
11%
11%
Short Response Times for Inquires
Ability to Talk to a Live Person
Friendly Staff
Transparency
Web Self Service Capabilities
Phone Self Service Capabilities
Consumer Ease of Doing Business Primary Factor
High Efficiency Personal Lines

Underwriting and Policy Management HIGH EFFICIENCY: IMPACT ON PERSONAL LINES May 2011
©Copyright, Ward Group 2011 PAGE 26
Technology – Personal Lines High Efficiency Benchmark
• The high efficiency group was more likely to have replaced an underwriting processing system in the last five years. Although, the average age for their systems is 1 year older than the overall personal lines group (12.69 versus 11.61). 55% of the high efficiency companies felt they needed improved core system functionality to make better underwriting decisions.
• Not only was the high efficiency group utilizing their systems to improve new business pass rates, but they were also more likely to utilize their systems to develop cross-sell and up-sell opportunities and track the conversion rate of those opportunities.
53.4%
22.4%
24.1%
44.4%
33.3%
22.2%
Yes, Considering
Recently Replaced
No, Not Considering
Underwriting System Replacement Consideration
21%
14%
33%
22%
Cross-sell/Up-sell Opportunities
Integrated into Front End Applications
System Tracks Offers Made and Conversion Rate of Those Offers
System Based Cross Selling
Personal Lines High Efficiency
6.7%
20.0%
30.0%
36.7%
6.7%
0.0%
22.2%
33.3%
33.3%
11.1%
Cutting Edge and Advanced Compared to Peers
More Advanced than Peers
On Par with Peers
Slightly Behind Peers
Severely Behind Peers
Underwriting System Technology Advancement Comparison to Peers

Underwriting and Policy Management May 2011
©Copyright, Ward Group 2011 PAGE 27
Straight Through Processing: Impact on Commercial Lines
Profile of a Commercial Lines High Efficiency Benchmark Group
Straight through processing on new business has not been consistently deployed in commercial lines. 59% of the companies surveyed indicated straight through processing on workers compensation and only 43% indicated the same for their other commercial lines. To determine if there is a correlation between straight through processing and financial results, a benchmark group of companies with high straight through processing pass rates was created.
• This “Commercial Lines High Efficiency” benchmark group is made up of the top quartile of companies that had higher new business pass through rates than the overall commercial lines benchmark. The workers compensation pass rate for the high efficiency group was almost 40 points higher than overall commercial lines group and the other commercial lines rate was 17 points higher. The high efficiency group also had higher targets for new business pass rates and was more likely to indicate significant increases in pass rates over the past 3 years compared to the overall group.
• The high efficiency group was, on average, smaller in premium volume ($263M) compared to the overall commercial lines group ($593M). The high efficiency group also had more workers compensation exposure than the overall group (83.1% versus 23.1%). This is primarily driven by the fact that workers compensation carriers were more likely to utilize straight through processing than commercial multi-line carriers.
• The high efficiency benchmark had better premium growth on the other commercial lines but significant premium declines on workers compensation.
• Geographically, the high efficiency carriers wrote in fewer states, 4 compared to the overall commercial group at 18. The high efficiency group was less likely to have expanded geographically in the prior three years and is also less likely to expand in the near future.
KEY FACTS Commercial Lines High Efficiency Benchmark
- Higher straight through new business pass rates
- Mixed financial results - Smaller average in-force premium - Wrote in fewer states - Same to slightly higher customer retention - Focused on pricing - Less time spent on basic policy processing and
more time on underwriting decision making - Timely responses to agent and customer
inquiries of high importance - Newer systems, but believe their systems are
slightly behind peers
New Business Straight Through Pass Rate
Commercial
Lines High
Efficiency
Workers Comp – Actual 18.9% 57.9%
Workers Comp- Target 28.3% 66.2%
Other Commercial - Actual 2.9% 20.0%
Other Commercial – Target 13.9% 52.5%

Underwriting and Policy Management HIGH EFFICIENCY: IMPACT ON COMMERCIAL LINES May 2011
©Copyright, Ward Group 2011 PAGE 28
Financial Results - Commercial Lines High Efficiency Benchmark
• Financial results were mixed for the commercial lines high efficiency group, indicating no clear correlation between straight through processing and profit. In fact, profit ratio, combined ratio and loss ratio were less favorable for this high efficiency group.
Commercial Lines High Efficiency Benchmark Combined
Ratio Underwriting Expense Ratio
Loss Ratio Profit Ratio
2 Pts Higher 3 Pts Lower 6 Pts Higher 15 Pts Lower
• Retention on workers compensation was consistent across the
commercial groups, while the high efficiency group did see high retention on all other commercial lines.
• Better data gathering during submission was the highest rated need that both groups indicated as necessary to achieve better underwriting results. Second most important to achieving better underwriting results for high efficiency companies was improved operational efficiencies compared to a more sophisticated rating engine for the overall commercial group.
Financial Results
Commercial
Lines High Efficiency
Profit Ratio Workers Comp -10.4% -18.2% Other Commercial 9.8% 7.5%
Loss Ratio Workers Comp 64.9% 67.5% Other Commercial 51.8% 50.1%
Expense Ratio Workers Comp 23.6% 23.2% Other Commercial 29.4% 31.0%
84.4%
83.8%
84.0%
85.0%
Workers Compensation
All Other Commercial Lines
Commercial Lines Retention Ratios
High Efficiency Commercial Lines

Underwriting and Policy Management HIGH EFFICIENCY: IMPACT ON COMMERCIAL LINES May 2011
©Copyright, Ward Group 2011 PAGE 29
The Focus – Commercial Lines High Efficiency Benchmark
• Underwriting focus of the two groups was consistently on
pricing. The high efficiency companies had a greater focus on risk selection and service than the overall commercial group.
• Reflecting better use of technology to handle routine tasks, underwriters at the high efficiency group spent less time on basic policy processing activities and more time on underwriting decision making than the overall commercial group.
• Both the high efficency and overall groups indicated a desire to continue to shift underwriter focus from administrative activities such as policy processing and procedural complaince to the higher value activities of underwriter decision making and customer interaction.
47.6%
42.9%
4.8%
4.8%
50.0%
33.3%
16.7%
Pricing
Risk Selection
Ease of Doing Business
Service
Primary Underwriting Focus
13.3%
13.3%
33.3%
40.0%
5.8%
14.2%
34.2%
45.8%
Policy Processing
Procedural Compliance
Customer Interaction
Underwriting Decision Making
Underwriter Time By Activity
High Efficency Commercial Lines
Underwriting and Policy Management HIGH EFFICIENCY: IMPACT ON COMMERCIAL LINES May 2011
©Copyright, Ward Group 2011 PAGE 30
The Customer – Commercial Lines High Efficiency Benchmark
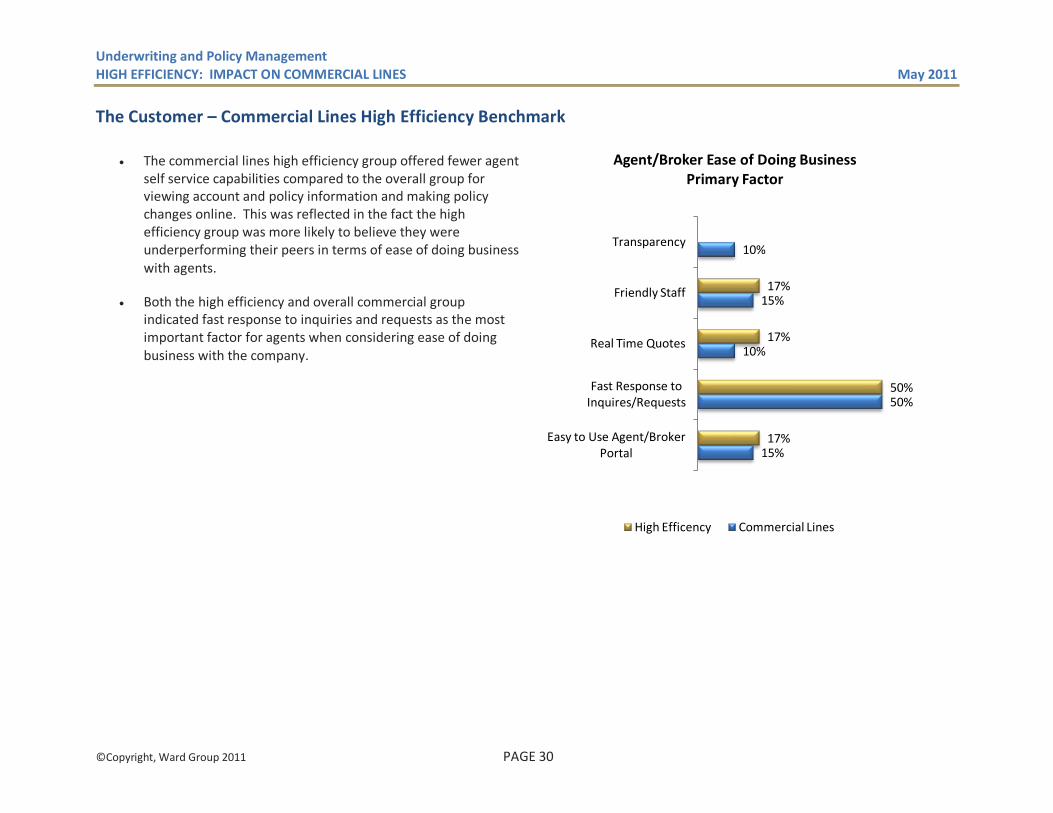
• The commercial lines high efficiency group offered fewer agent self service capabilities compared to the overall group for viewing account and policy information and making policy changes online. This was reflected in the fact the high efficiency group was more likely to believe they were underperforming their peers in terms of ease of doing business with agents.
• Both the high efficiency and overall commercial group indicated fast response to inquiries and requests as the most important factor for agents when considering ease of doing business with the company.
15%
50%
10%
15%
10%
17%
50%
17%
17%
Easy to Use Agent/Broker Portal
Fast Response to Inquires/Requests
Real Time Quotes
Friendly Staff
Transparency
Agent/Broker Ease of Doing Business Primary Factor
High Efficency Commercial Lines
Underwriting and Policy Management HIGH EFFICIENCY: IMPACT ON COMMERCIAL LINES May 2011
©Copyright, Ward Group 2011 PAGE 31
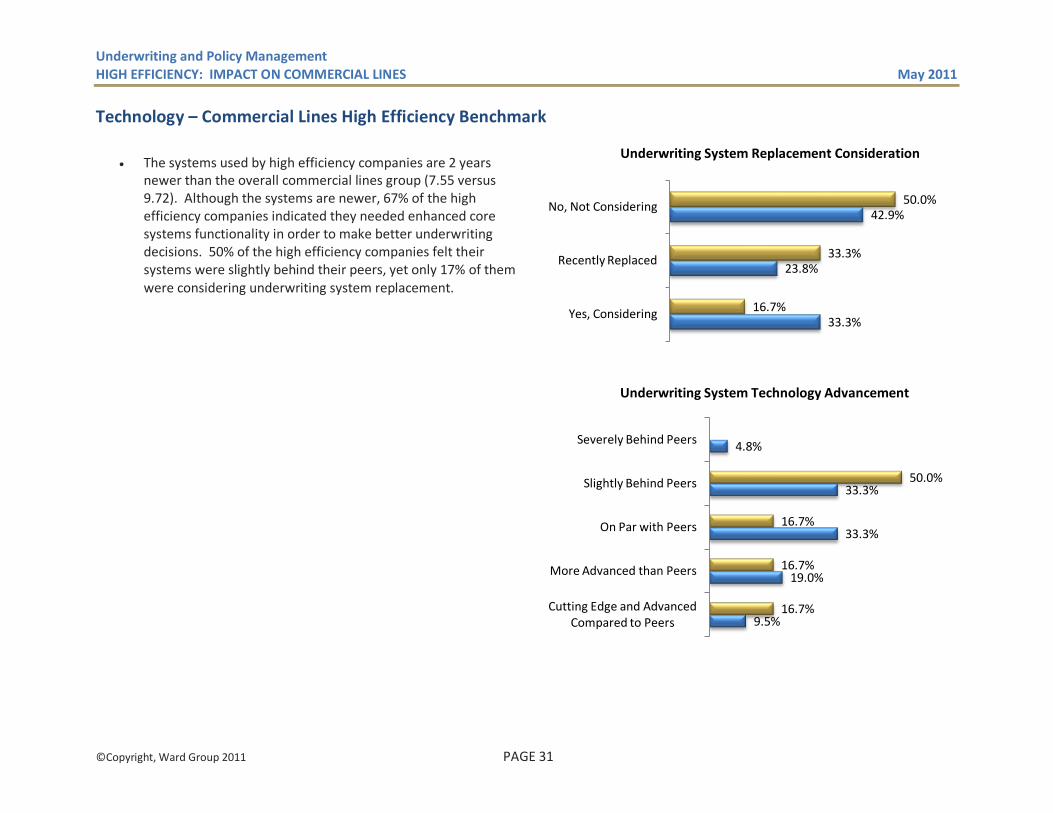
Technology – Commercial Lines High Efficiency Benchmark
• The systems used by high efficiency companies are 2 years
newer than the overall commercial lines group (7.55 versus 9.72). Although the systems are newer, 67% of the high efficiency companies indicated they needed enhanced core systems functionality in order to make better underwriting decisions. 50% of the high efficiency companies felt their systems were slightly behind their peers, yet only 17% of them were considering underwriting system replacement.
33.3%
23.8%
42.9%
16.7%
33.3%
50.0%
Yes, Considering
Recently Replaced
No, Not Considering
Underwriting System Replacement Consideration
9.5%
19.0%
33.3%
33.3%
4.8%
16.7%
16.7%
16.7%
50.0%
Cutting Edge and Advanced Compared to Peers
More Advanced than Peers
On Par with Peers
Slightly Behind Peers
Severely Behind Peers
Underwriting System Technology Advancement

Underwriting and Policy Management May 2011
©Copyright, Ward Group 2011 PAGE 32
Growth: Impact on Personal Lines Profile of a Personal Lines High Growth Benchmark Group
Despite tough market conditions, the overall personal lines group had modest premium growth over the past 3 years. The group had 3.7% growth in personal auto and 4.5% growth in homeowners. To determine if there are any business practices of growth companies that lead to higher performance, a benchmark group was created to include the top quartile of companies based on personal lines premium growth.
• The “Personal Lines High Growth” group experienced premium
growth rates that were significantly higher than those of the overall personal lines group.
• The personal lines high growth companies were slightly smaller ($415M) than the overall personal lines group ($548M), though both groups had similar business mixes. A higher percentage of the high growth companies utilized an independent agency distribution channel (87.5%) more so than the overall personal lines group, (69.4%).
• The high growth companies were more ambitious regarding geographic growth, actively writing business in more states, 16 versus 11 states for the overall personal lines group. 62% of the high growth companies had expanded geographically in the prior 3 years and 75% were planning to continue to expand in the next three years. This compares to 30% of the overall group expanding in the prior three years and 43% planning to expand in the next three years. While geographic expansion was and will be a significant contributor to growth, organic growth of existing products is also seen as primary means of expansion in the future. In addition, 60% of the high growth companies indicated they need a better product fit in order to achieve higher quote to issue conversion rates.
KEY FACTS Personal Lines High Growth Benchmark
- Less favorable combined financial results - Slightly smaller in size - Actively writing in more states - Organic growth of existing products seen as
the primary means of expansion - Lower retention rate - Focused on risk selection - Had newer systems, but felt they needed
better core functionality - Lower usage of systems for cross-sell/up-sell
opportunities - Indicated a strong need for more and better
quality data about customers
Premium Growth Rate
Personal Lines High Growth
Personal Auto 3.7% 13.3%
Homeowners 4.5% 8.3%

Underwriting and Policy Management GROWTH: IMPACT ON PERSONAL LINES May 2011
©Copyright, Ward Group 2011 PAGE 33
Financial Results – Personal Lines High Growth Benchmark
• The high growth companies experienced less favorable financial results compared to the overall personal lines group, with profit ratios lower for both personal auto and homeowners. The high growth personal auto profit ratio was nominally (.7 points) lower and homeowners profit ratio almost 7.5 points lower than the personal lines group. The negative performance in homeowners was primarily driven by a higher loss ratio. The high growth companies were aware they were underperforming their peers in terms of profitability and underwriting expense management.
• High growth companies indicated that the key to their profitability was equally balanced between actuarial analysis, rating calculations and operational efficiency.
• Customer retention results were also mixed, with the high growth companies indicating a lower personal auto retention rate of 80.3% compared to 83.6% for the overall group. 25% of the companies in the high growth group indicated a personal auto retention ratio of less than 70%, compared to only 10% of the overall group. The high growth companies did see a slightly higher homeowners retention, at 87.5% compared to 86.3%.
Financial Metrics
Personal Lines High Growth Loss Ratio
Personal Auto 64.3% 64.7% Homeowners 63.9% 72.9%
Expense Ratio Personal Auto 23.4% 24.1% Homeowners 31.4% 28.1%
Profit Ratio Personal Auto 1.0% 0.3% Homeowners -4.6% -12.0%
84.5%
81.1%
Personal Lines
High Growth
Overall Customer Retention

Underwriting and Policy Management GROWTH: IMPACT ON PERSONAL LINES May 2011
©Copyright, Ward Group 2011 PAGE 34
The Focus – Personal Lines High Growth Benchmark
• Like the overall commercial lines group, the high growth companies were focused on risk selection and pricing.
• Underwriter time by activity for the high growth companies were slightly more focused on basic policy processing and less on underwriting decision making than it was the overall personal lines group.
• Although they were less focused on ease of doing business, the high growth companies considered the agent portal and customer‘s ability to talk to a live person as important factors. They also offered the most consumers self-service capabilities for receiving quotes, purchasing policies, making changes and billing and payment options.
36.7%
33.3%
20.0%
10.0%
25.0%
50.0%
12.5%
12.5%
Pricing
Risk Selection
Ease of Doing Business
Service
Primary Underwriting Focus
53.3%
23.3%
16.7%
6.7%
50.0%
25.0%
25.0%
Organic Growth
New Products
Geographical Expansion
Acquisition of Other Insurers
Best Growth Opportunities
High Growth Personal Lines

Underwriting and Policy Management GROWTH: IMPACT ON PERSONAL LINES May 2011
©Copyright, Ward Group 2011 PAGE 35
Technology – Personal Lines High Growth Benchmark
• Personal lines high growth companies had rating applications and policy administration systems that were newer than the overall personal lines group, (rating system 5.33 versus 9.85, policy admin system 9.33 versus 11.61). On the other hand, 62.5% indicated that their systems were behind that of their peers compared to 42% of the overall group.
• New business pass through rates were comparable for personal auto between the two groups, approximately 50%. However, the homeowners pass through rate was 10 points higher for the high growth group, at 40% versus 30%.
• Systematic identification of cross-sell/up-sell opportunities was less evident at high growth personal lines companies. Only 25% of the companies had systems that identified cross-sell opportunities based on customer characteristics compared to 35% of the overall personal lines group.
20.7%
6.9%
12.5% 12.5%
Cross-sell/Up-sell Opportunities
Integrated into Front End Applications
Offers Integrated Across All Touch Points
System Based Cross Selling
Personal Lines High Growth

Underwriting and Policy Management May 2011
©Copyright, Ward Group 2011 PAGE 36
Growth: Impact on Commercial Lines Profile of Commercial Lines High Growth Benchmark
The workers compensation market has remained soft over the past 3 years, with premium degrading by 10.06% from 2007 to 2009. Other commercial lines have seen a slight uptick in premium with a growth rate of 5.45%. To determine if there are any business practices of growth companies that lead to higher performance, a benchmark group was created to include the top quartile of companies based on commercial lines business.
• The “Commercial Lines High Growth” group experienced negative premium growth rates on workers compensation that were similar to those of the overall commercial group and positive growth rates on other commercial lines almost 3 times as high as the overall group.
• Similar to personal lines, the high growth commercial lines companies were smaller ($409M) than the overall commercial lines group ($593M). The high growth companies had a higher percentage of premium in other commercial lines (71.5% versus 40.3%) and less in workers compensation (13.2% versus 23.1%). Distribution channel mix was consistent between the two groups.
• The high growth companies had a slightly larger geographic footprint, writing in 19 states compared to 18 for the overall group. 18.7% of the high growth companies had expanded geographically in the prior 3 years, but 83% were planning to expand in the next three years, compared to 57% of the overall group expanding in the prior three years and 76.2% planning to expand in the next three years. Geographic expansion was ranked as the greatest opportunity for growth, followed by organic growth of existing products. Even so, like in personal lines, commercial growth companies felt better product fit was a greater need to achieving a higher quote to conversion ratio.
KEY FACTS Commercial Lines High Growth Benchmark
- Better combined financial results - Smaller in size - Wrote in mores states - Geographic expansion rated as best
opportunity for growth - Lower customer retention - Focused on risk selection - Less likely to use straight through processing - Offered more self-service options for
consumers - Significantly newer, more advanced systems
More sophisticated rating engine and better enforcement of underwriting guidelines was needed to achieve improved results
Premium Growth Rate
Personal Lines High Growth
Workers Compensation -10.1% -10.1%
Other Commercial Lines 5.4% 14.7%

Underwriting and Policy Management GROWTH: IMPACT ON COMMERCIAL LINES May 2011
©Copyright, Ward Group 2011 PAGE 37
Financial Results
• Financial results were mixed, with the high growth companies outperforming on workers compensation profit ratio, but underperforming on other commercial lines.
• Customer retention results were lower for the high growth companies at 83.3% for workers compensation and 82% for other commercial lines. The overall group indicated a workers’ compensation retention ratio of 84.4% and other commercial lines ratio of 83.8%.
Financial Metrics
Commercial
Lines High Growth
Loss Ratio Workers Compensation 64.9% 63.5%
Other Commercial Lines 51.8% 52.0%
Expense Ratio
Workers Compensation 23.6% 24.0% Other Commercial Lines 29.4% 29.2%
Profit Ratio Workers Compensation -10.4% -2.1%
Other Commercial Lines 9.8% 8.8%
83.8%
80.0%
Commercial Lines
High Growth
Overall Customer Retention

Underwriting and Policy Management GROWTH: IMPACT ON COMMERCIAL LINES May 2011
©Copyright, Ward Group 2011 PAGE 38
The Focus – Commercial Lines High Growth Companies
• Risk selection was the predominate area of underwriting focus for the high growth commercial group followed by pricing.
• Underwriter’s at high growth commercial companies were spending most of their time on underwriting decision making and basic policy processing.
• The high growth companies put more emphasis on equipping agents with self-service capabilities and less emphasis on customer self-service than the overall commercial group. Similar to the overall commercial group, high growth companies rated short response to inquiries as the number one factor for agent and consumer ease of doing business.
47.6%
42.9%
4.8%
4.8%
33.0%
50.0%
16.7%
Pricing
Risk Selection
Ease of Doing Business
Service
Primary Underwriting Focus
47.6%
9.5%
28.6%
14.3%
33.3%
50.0%
16.7%
Organic Growth
New Products to Current Lines
Geographical Expansion
Acquisitions
Best Growth Opportunity
High Growth Commercial Lines

Underwriting and Policy Management GROWTH: IMPACT ON COMMERCIAL LINES May 2011
©Copyright, Ward Group 2011 PAGE 39
Technology – Commercial Lines High Growth Companies
• Commercial lines high growth companies on average had rating applications and policy administration systems that were newer than the overall personal lines group, (rating system 6 versus 8.85, policy admin system 5.17 versus 9.72); 50% of the high growth companies indicated that their system was more advanced than that of their peers, compared to 28.5% of the overall group. Fewer high growth companies were likely to have new business straight through processing, with none of the high growth companies indicating straight through processing on workers compensation and only one company indicating it on other commercial lines. A more sophisticated rating engine and better enforcement of underwriting guidelines were identified as the greatest requirements to achieving better underwriting results for the high growth companies.
• Systematic identification of cross-sell/up-sell opportunities was more evident at high growth commercial lines companies. 33% of the companies had systems that identified cross-sell opportunities based on customer characteristics compared to only 19% of the overall commercial lines group. The high growth companies also had better capabilities to track offers made.
19%
5%
33%
17%
Cross-sell/Up-sell Opportunities
Identified by System
System Tracks Offers Made and
Conversion Rate of Those Offers
System Based Cross Selling
Commercial Lines High Growth