understanding voluntary turnover: path-specific job
TRANSCRIPT

UNDERSTANDING VOLUNTARY TURNOVER:PATH-SPECIFIC JOB SATISFACTION EFFECTS AND THE
IMPORTANCE OF UNSOLICITED JOB OFFERS
TAE HEON LEENorth Carolina Central University
BARRY GERHARTUniversity of Wisconsin–Madison
INGO WELLERFreie Universitaet Berlin
CHARLIE O. TREVORUniversity of Wisconsin–Madison
In response to traditional approaches’ limited success in explaining voluntary turn-over, we explored a paradigmatic shift in turnover research. Using a large nationalsample, we found we could more successfully model voluntary turnover by recogniz-ing that job (dis)satisfaction and ease of movement importance depend on the group ofleavers being studied. For example, ongoing job satisfaction had smaller effects forturnover driven by certain shocks (unsolicited job offers and family-related reasons),which accounted for 40 percent of all quits. Moreover, the prevalence of unsolicited joboffers may necessitate rethinking the role of ease of movement in turnover decisions.
With thousands of published studies of “volun-tary turnover” (quitting), it may seem incongruousto argue that, in fact, still little is known about whypeople quit. Yet the roles of perceived desirabilityof movement (often represented as job satisfac-tion) and ease of movement (often represented asunemployment rate), which are the two dominantpredictors in voluntary turnover research, remainproblematic in explaining quitting behavior.Thus, despite the numerous, often compelling,efforts at describing turnover processes, it ap-pears that there is considerable room for im-provement in how researchers approach thesetwo fundamental precursors.
The stakes are high, as improving upon turnoverprediction promises considerable consequences.From the applied perspective, more effective turn-over prediction potentially offers extensive gains,given that voluntary turnover is associated withhigh replacement costs (Cascio, 2000), the loss ofstar performers (Trevor, Gerhart, & Boudreau,1997), and organization-level financial outcomes(e.g., Glebbeek & Bax, 2004; Kacmar, Andrews, VanRooy, Steilberg, & Cerrone, 2006; Shaw, Gupta, &Delery, 2005). On the research side, rethinking howthe primary turnover predictors are approached in-volves a qualitative shift in turnover theory.
Recently, the unfolding model of turnover (Lee &
Mitchell, 1994) has initiated this shift by demon-strating, using data on leavers, the presence of mul-tiple turnover pathways, some of which deviatefrom traditional turnover perspectives that focus onperceived desirability and ease of movement. Herewe take the next logical step by using data on bothleavers and stayers, which allows us to statisticallyevaluate the relative effect sizes of desirability andease of movement for different turnover pathways.Specifically, we examine job satisfaction effects forvarious employee groupings. We also explore animportant alternative means of studying the impactof ease of movement on voluntary turnover by fo-cusing on unsolicited job offers as “shocks” thatmay lead to quitting. Consequently, we prescribeconsiderable changes to the traditional turnoverresearch paradigm’s approach to the two funda-mental predictors of voluntary turnover.
CONCEPTUAL DEVELOPMENT
March and Simon (1958) described each mem-ber’s participation in an organization as contingentupon an inducement-contribution utility balancethat is, in turn, a function of two major distinct butrelated motivational forces: (1) the perceived desir-ability and (2) the perceived ease of movement outof the organization. Perceived desirability of move-
� Academy of Management Journal2008, Vol. 51, No. 4, 651–671.
651
Copyright of the Academy of Management, all rights reserved. Contents may not be copied, emailed, posted to a listserv, or otherwise transmitted without the copyright holder’s expresswritten permission. Users may print, download or email articles for individual use only.

ment is mainly influenced by job satisfaction and isoften described as a “push” factor. Perceived easeof movement depends on each person’s perceptionof the availability of jobs in the external job marketand is often described as a “pull” factor.
Despite March and Simon’s (1958) pioneeringwork on psychological mechanisms, which sug-gested the interaction of perceived desirability andease of movement as a main determinant of actualturnover, it was not until Mobley’s (1977) modelthat researchers began to elaborate on the cognitiveor psychological decision processes linking nega-tive job attitudes with actual voluntary turnover.Mobley focused on turnover as a process andsought to map out psychological and perceptualprocesses thought to mediate the relationship be-tween satisfaction and turnover. Specifically, in themodel he proposed a series of links between indi-viduals’ evaluations of their current jobs and actualturnover in a causal order: Evaluation of existingjob 3 job dissatisfaction 3 thinking of quitting 3evaluation of expected utility of search and cost ofquitting 3 intention to search for alternatives 3search for alternatives 3 evaluation of alterna-tives 3 comparison of alternatives vs. presentjob 3 intention to quit/stay 3 quit/stay. Subse-quent models (see Griffeth & Hom, 1995; Lee &Mitchell, 1994; Maertz & Campion, 1998; Steel,2002) have generally reflected the influence of bothMarch and Simon’s (1958) push and pull factorsand the intervening psychological mechanisms be-tween job satisfaction and actual turnover de-scribed by Mobley (1977).
We make three general observations on suchmodels. First, they typically describe “the employ-ment search process as an outgrowth of disaffec-tion” (Steel, 2002: 354) and the translation of dis-satisfaction into search and then quitting as “highlyrationalized, systematic, and orderly” (Steel, 2002:353). Such models have likewise been described asdepicting an “orderly progression from dissatisfac-tion” or a “slow burn, deliberative process” (Kam-meyer-Mueller, Wanberg, Glomb, & Ahlburg, 2005:3). Second, although these models do include pullfactors (e.g., unemployment rate, perceived alterna-tive job opportunities), it may be that too littleconceptual and empirical attention has been paidto the ease of movement component of the originalMarch and Simon (1958) model (see also Griffeth,Steel, Allen, & Bryan, 2005). For example, in theirmeta-analysis of voluntary turnover determinants,Griffeth, Hom, and Gaertner (2000) found 67 stud-ies of job satisfaction as a predictor, but only 11studies of alternative job opportunities.
Third, and almost certainly related to the firsttwo observations, empirical evidence over the
years appears to indicate that there is room forimprovement in such models regarding how well(e.g., in terms of predictive validity and/or modelfit) they capture and describe voluntary turnoverdecisions. The most recent meta-analytic study(Griffeth et al., 2000) showed a mean correlationbetween job satisfaction and voluntary turnover of�.19 (representing roughly 3.6 percent variance ex-plained). Efforts to incorporate pull factors such asunemployment rate (e.g., Gerhart, 1990; Hom &Kinicki, 2001; Trevor, 2001) and perceived avail-ability of job alternatives (Griffeth et al., 2000; Grif-feth & Hom, 1988; Hom, Caranikas-Walker, Prussia,& Griffeth, 1992; Steel & Griffeth, 1989) have pro-duced an even more modest level of variance ex-plained (e.g., Griffeth al. [2000] reported a meancorrelation of .12, which translates to 1.4 percentvariance explained). Indeed, although the predic-tive validity of perceived alternatives is consideredto be weak (Griffeth et al., 2000), unemploymentrate prediction of turnover, though robust at aggre-gated levels of analysis (e.g., Armknecht & Early,1972; Eagly, 1965), has been mixed at the individ-ual level (Trevor, 2001).
How should one interpret these findings? Do theydemonstrate that the key push and pull constructs aremuch less important than existing theoretical modelssuggest? Perhaps. However, it is also possible that afew straightforward changes to the traditional turn-over research paradigm would make an importantdifference in findings and interpretations. First, it isnecessary to recognize that some types of turnoverfollow the traditional model, with its central role forjob satisfaction, and others do not. Second, it may benecessary to approach the ease of movement part ofthe model in a new way.
On the first issue, the evidence increasingly sug-gests that many instances of turnover follow pathsthat are either not described or are peripheral in tra-ditional models (Lee & Mitchell, 1994; Lee, Mitchell,Wise, & Fireman, 1996; Lee, Mitchell, Holtom, Mc-Daniel, & Hill, 1999; Maertz & Campion, 2004; Steel,2002). For example, quits may be triggered by reasonsother than job dissatisfaction—including unsolicitedjob offers (Gerhart, 1990; Hulin et al., 1985), job-re-lated shocks such as downsizing (Lee et al., 1999),pure impulse (Hulin et al., 1985; Lee & Mitchell,1994), pursuit of nonwork alternatives (e.g., school-ing, family), or a strategy of quitting after a certainamount of time (e.g., after receiving a retention bo-nus)—without other jobs necessarily being in place(Lee & Mitchell, 1994; Lee et al., 1999).
On the second issue, the lack of predictive valid-ity of pull factors in voluntary turnover modelsmay be a result of thinking too narrowly about easeof movement. Of particular relevance is evidence
652 AugustAcademy of Management Journal

that one of the most important paths overlooked intraditional turnover models is initiated by theshock of an unsolicited job offer (Holtom, Mitchell,Lee, & Inderrieden, 2005; Lee et al., 1999; Mitchell,Holtom, & Lee, 2001; Steel, 2002), a very tangibleand relevant measure of ease of movement in anyemployee’s turnover decision. The implication isthat researchers have perhaps greatly underesti-mated the importance of pull factors in voluntaryturnover decisions by not paying sufficient atten-tion to the role of unsolicited job offers.
In the present study, we develop a conceptuallogic for why the key desirability of movement andease of movement factors, job satisfaction and un-employment rate, are expected to have differenteffects for different types of job leavers (different“voluntary turnover groups”). In other words, thetraditional model of voluntary turnover is expectedto apply reasonably well to some turnover groups,less well to others. We also focus on the potentialimportance of unsolicited job offers as providing animportant alternative means of studying the impactof ease of movement on voluntary turnover.
On the empirical front, we note that the pioneeringempirical work on distinct paths in the unfoldingmodel program of research has relied exclusively ondata on leavers and that these data have been col-lected following the decisions to leave. By contrast,we have data on both leavers and stayers and a pre-dictive design. Thus, our study has the importantadvantage of being able to build on the substantialfoundation provided by the unfolding model and toexamine, in a predictive fashion, the degree to whichthe probability of different types of turnover is differ-entially responsive to ease of movement and desir-ability of movement factors. With our use of a large,diverse, national sample, we are also able to provideestimates of the relative size of different turnovergroups, which is important to the degree that thegroups to which the traditional turnover model ap-plies less well (e.g., those receiving unsolicited offers)are large. We return to the potentially important roleof unsolicited offers below but first introduce thebroader unfolding model of turnover.
DISTINCT PATHS AND THE UNFOLDINGMODEL OF TURNOVER
A key overriding hypothesis of the unfoldingmodel (Lee & Mitchell, 1994; Lee et al., 1999) is thatthe relative importance of job dissatisfaction, jobsearch, and shocks varies across five separate turn-over paths (referred to as paths 1, 2, 3, 4a, and 4b),some of which clearly deviate from the traditional,linear, slow-burn turnover process (see below). Animportant new construct in the unfolding model is
the “shock to the system,” described as a jarringevent that makes employees reassess their currentemployment situations. In contrast to traditionalmodels, the unfolding model suggests that suchshocks can drive a decision to leave. The shockitself can be negative or positive, job-related ornon-job-related, internal or external to an individ-ual, and expected or unexpected. Examples includeunsolicited job offers, promotion, changes in mari-tal status, transfers, firm mergers, and downsizing.
According to the model, employees following path1 leave without extensive mental deliberation aboutthe current and/or alternative jobs because leaving isa preprogrammed action plan for answering a specifickind of shock (e.g., a planned pregnancy). In responseto shocks, employees following path 2, in the absenceof a script-driven action plan, first reevaluate theircurrent work circumstances in terms of fit or compat-ibility with their images, which comprise self-heldvalues, goals, and strategies for goal attainment. If animage violation occurs during this path 2 “compati-bility test,” employees leave their current jobs with-out seeking alternative jobs. Path 3 applies to employ-ees who experience a shock and an image violation,but unlike path 2, it includes an evaluation of at leastone alternative. Although there may also be activesearch for alternatives, such search may be limited ornonexistent if the shock of an unsolicited job offerserves as the alternative. Alternatives are subjected toa “profitability test” in which they are compared to acurrent job, as in traditional turnover models’ eco-nomically rational decision making (e.g., Parsons,1973). The traditional turnover process is also incor-porated into the unfolding model in path 4b, in whichquitting, rather than being triggered by a shock, is afunction of an accumulated negative job attitude (e.g.,dissatisfaction) stemming from the routine, casual, orrandom ongoing reassessment of the current workenvironment. Though similar to path 4b, path 4a doesnot include consideration of alternatives prior toquitting.
In sum, the unfolding model explicitly addressesand systematically describes multiple distinct turn-over paths. In particular, in the unfolding model thekey push factor of job (dis)satisfaction does not al-ways drive turnover, and the turnover decision situ-ation can change rapidly because of shocks (note thatany dissatisfaction in paths 2 and 3 would simply bemediating shock effects). It is explicitly recognizedthat even relatively satisfied employees may decideto quit, given certain circumstances (such as unsolic-ited job offers and family reasons), and that dissatis-fied employees may not quit, which may help explainthe limited predictive validity of job satisfaction ob-served in empirical research. Empirical evidence sup-ports the idea that there are distinct paths and that a
2008 653Lee, Gerhart, Weller, and Trevor

substantial amount of voluntary turnover is not wellcaptured in traditional turnover models that focus onthe conventional dissatisfaction3 search3 turnoverpath.1
Hypotheses: Distinct Paths and the Roles of Pushand Pull
As our above review indicates, it appears thatmuch turnover follows a path that differs from thetraditional turnover path. Researchers, however,have yet to study and document statistically differ-ent effects of key voluntary turnover determinantson the different paths. Thus, we now turn to anexamination of how push and pull factors (job sat-isfaction and labor market conditions) are expectedto differ in their ability to explain voluntary turn-over in different groups.
We distinguish four groups of leavers: employeeswho quit to accept other jobs after employedsearching (group 1); those who search for alterna-tive jobs (group 2); those who accept unsolicitedjob offers (group 3); and those who focus on family-related issues, including pregnancy (group 4). Be-low, we describe how the turnover process is ex-pected to differ in these groups. Specifically, wefocus on the differential roles of job satisfaction andgeneral labor market opportunities, as measured byunemployment rate.
Group 1: Individuals who quit after successfulsearch for another job (dissatisfaction 3 search3 new job 3 quit). Individuals who leave to takeother jobs are likely to follow the well-describedturnover path laid out by traditional models. Thatis, these employees are dissatisfied with their cur-rent jobs and quit with job offers in hand after goingthrough a decision process characterized by searchactivity and comparison of alternative jobs. Thisprocess is similar to path 4b in the unfoldingmodel. (To the degree that job dissatisfaction re-sults from a shock such as an unsolicited job offer,and this disaffection results in search and turnover,elements of path 3 are also relevant.) In this group,job satisfaction is expected to have a negative maineffect on voluntary turnover. Also, the availability
of alternative jobs in the external market (e.g., asindicated by a relatively low unemployment rate) isexpected to have a positive main effect on volun-tary turnover. In addition, conceptual models(March & Simon, 1958; Mobley, Griffeth, Hand, &Meglino, 1979; Muchinsky & Morrow, 1980; Price,1977; Trevor, 2001) and empirical evidence (Carsten& Spector, 1987; Gerhart, 1990; Steel & Griffeth,1989; Trevor, 2001) have suggested a statistical in-teraction whereby job dissatisfaction is more likelytranslated into voluntary turnover when alternativejobs are readily available in the external job market.That is, people should be more likely to act ondissatisfaction by quitting when the job marketmakes it easier or less costly for them to do so.
Hypothesis 1a. In group 1 (individuals whoquit after successful search for other jobs), therelationship between job satisfaction and vol-untary turnover is negative.
Hypothesis 1b. In group 1, the relationship be-tween unemployment rate and voluntary turn-over is negative.
Hypothesis 1c. In group 1, the negative rela-tionship between job satisfaction and turnoveris stronger when the unemployment rate is low.
Group 2: Individuals who quit to search forother jobs (dissatisfaction3 quit3 no new job3search). Individuals in group 2 decide to quit tosearch without first lining up other jobs. Althoughresearchers have recognized this jobless turnoverpath (Hom et al., 1992; Hom & Griffeth, 1991; Hom,Griffeth, & Sellaro, 1984; Lee & Mitchell, 1994;Maertz & Campion, 2004; Matilla, 1974), it has re-ceived much less research attention than group 1.
Individuals in group 2 may have followed one ofat least two possible decision processes. Some em-ployees may or may not have actually been engagedin search activities but decide to quit without lin-ing up alternative jobs because they have decidedthat unemployed job search might be more efficientthan employed search (Burdett, 1978; Kahn & Low,1984). (This path does not appear to be captured inthe unfolding model.) Other possibilities are thatpeople decide that anything would be better thanremaining in their current jobs because of unbear-able employment situations and/or impulse moti-vates their decisions to quit (Hulin et al., 1985).This case is perhaps analogous to decision paths 2and 4a in the unfolding model (Lee & Mitchell,1994). In either case, low job satisfaction initiatesthe decision process, low satisfaction that has ei-ther been induced by a shock (path 2) or accumu-lated over time (path 4a), and the job satisfaction–
1 Holtom, Mitchell, Lee, and Inderrieden (2005) exam-ined 1,205 leavers across multiple samples and foundthat 711 (59%) of these cases involved shocks. Further,371 of these shocks (52 percent of shocks, 31 percent ofall turnover) involved job offers. The great majority ofthese offers appear to have been unexpected, given thedefinition of a shock as a “jarring event” (Holtom et al.,2005: 343) and given that a deeper analysis of a sub-sample of 169 path 3 shocks showed that 153 (81%) were“unexpected” as opposed to “expected.”
654 AugustAcademy of Management Journal

voluntary turnover relationship is expected to benegative and of similar size to that in group 1.
Hypothesis 2a. In group 2 (individuals whoquit to search for other jobs), the relationshipbetween job satisfaction and voluntary turn-over is negative.
The effect of unemployment rate on voluntary turn-over is unclear here and may depend on the specificdecision process followed. In the case of those quit-ting in the belief that full-time search is more effi-cient, we expect this strategy to be seen as most ad-visable when there are thought to be significantopportunities available to be explored. Thus, labormarket conditions are expected to be factored intothese employees’ quit decisions, as in the group1 case.
By contrast, impulsive quitting might result in aweaker effect of the unemployment rate, relative tothe above subgroup and to group 1, because strongdissatisfaction, without significant concern for thepossible consequences (e.g., long-term incomeloss), is the key driver for truly impulsive quitting(e.g., Maertz & Campion, 2004). However, we sus-pect that this pure form of impulsive quitting is rareand that to some degree, people often give at leastpartial consideration to the availability of alterna-tives, making the decision path more similar to thatof the “efficient quitting” subgroup above.
Yet what the two subgroups have in common—akey difference between them and group 1—is thatthe people in both quit without search. It is likelythat an absence of search diminishes the accuracywith which people can assess either general labormarket or individual labor market opportunities(Steel, 2002). Thus, the absence of search in group2, and the consequently poorer labor market knowl-edge, leads us to expect a relatively weak (com-pared to group 1, which did search) effect of theunemployment rate on quit decisions in group 2.Similarly, the poorer labor market informationshould, when group 2 is compared to group 1,reduce the likelihood that satisfaction effectswould depend on the unemployment rate.
Hypothesis 2b. In group 2, the negative rela-tionship between the unemployment rate andvoluntary turnover is weaker than in group 1.
Hypothesis 2c. In group 2, the interaction be-tween job satisfaction and the unemploymentrate in the prediction of voluntary turnover isweaker than in group 1.
Group 3: Individuals who accept unsolicitedjob offers (no search 3 new job 3 quit). Theseindividuals received unsolicited job offers and quit to
take those jobs. To the degree that this turnover groupmakes up a significant share of turnover (see footnote1 above for such evidence), it poses a significant chal-lenge to conventional satisfaction- and search-driventurnover models, which have all but ignored the un-solicited job offer path to turnover.
Hulin, Roznowski, and Hachiya suggested yearsago that most workers “do not quit on the basis ofprobabilities estimated from alternatives available;they quit on the basis of certainties represented byjobs already offered” (1985: 244). Gerhart furtherpointed out that such offers “are often unexpectedand unsolicited” (1990: 474). The implication then isthat, in response to unsolicited job offers, not onlymay employees leave without actively searching foralternative jobs, but also that even relatively satisfiedemployees may choose to leave (Lee et al., 1999;Steel, 2002), as unsolicited offers are often compel-ling (or at least improved) opportunities. Indeed, Leeet al. (1999) reported that the mean satisfaction for theunfolding model’s path 3, which includes this group,was higher than it was in the traditional turnoverpath (4b). However, their data included only leavers(no stayers), which precluded the testing of whetherthe relationship between satisfaction and turnover(i.e., the satisfaction effect) differed by path/group.Because it is common for those in this unsolicitedoffer group to have been relatively satisfied prior toreceiving the alternative offers, we expect that satis-faction will be less predictive of turnover for group 3than for groups 1 and 2. A small satisfaction effectshould still emerge, however, as unsolicited offer re-cipients are more likely to accept such offers if theyare less satisfied.
Hypothesis 3a. In group 3 (individuals whoaccepted unsolicited job offers), the relation-ship between job satisfaction and voluntaryturnover is negative; this relationship is weakerin group 3 than in groups 1 and 2.
Note that the role of pull factors in this group is,by definition, highly important, as nothing is moreof a pull factor than an alternative job offer. How-ever, a traditional turnover design has little chanceof being able to document this importance of pullfactors, as typically measured by perceptions ofmovement ease. As Gerhart observed, an individuallabor market can change quickly so that although “aperson may perceive ease of movement to be low,an attractive job offer may nevertheless arise thatresults in turnover” (1990: 467) and that “undersuch circumstances, ease-of-movement perceptionswill typically change too quickly to be capturedwith traditional measurement approaches” (1990:474) (i.e., collection of turnover data six months toa year after collection of predictor data). Steel
2008 655Lee, Gerhart, Weller, and Trevor

(2002) likewise noted that such “static” designs arenot well suited to studying the impact of any turn-over causes that change over time and/or quickly.Actual offers have been referred to as “crystalliza-tion of alternatives” and have been found to relateonly modestly to general ease of movement percep-tions and to relate more strongly than these generalperceptions to turnover (Griffeth et al., 2005).
Similarly, “average” indicators of job alternatives(e.g., the unemployment rate) likely also have lim-ited predictive validity for this type of turnover.Employee raids/offers can take place even when jobmarkets are relatively loose and, at the individuallevel, one can almost envision “a separate labormarket existing for each person” (Gerhart, 1990:467) that is a function not only of general labormarket indicators such as the unemployment rate,but also of individual attributes (e.g., “movementcapital” [Trevor, 2001]). The receipt of an unex-pected job offer makes irrelevant any general labormarket condition indicator like the unemploymentrate. Thus, we expect that in this group defined byunsolicited offers, the unemployment rate, whichis the traditional measure of job alternatives, willplay less of a role than in group 1, where job searchproduces offers. Given that unemployment rateshould matter little for this group, the job satisfac-tion by unemployment rate interaction should alsobe less likely to emerge in group 3 than in group 1.
Hypothesis 3b. In group 3, the negative rela-tionship between unemployment rate and vol-untary turnover is weaker than it is in group 1.
Hypothesis 3c. In group 3, the interaction be-tween job satisfaction and unemployment ratein the prediction of voluntary turnover isweaker than it is in group 1.
Group 4: Individuals who quit for family-re-lated reasons (quit 3 no new job 3 no search).This group consists of employees who quit becauseof pregnancy or for other family reasons. At theoutset, it is important to note that a majority ofwomen with small children are in the labor force.Nevertheless, it is also the case that women withsmall children are significantly less likely thanother women to be in the labor force (U.S. Bureau ofLabor Statistics, 2004). Thus, family issues con-tinue to play a major role in the employment deci-sions of some women (and men). Lee and Maurer(1999) noted, for example (in keeping with thelower labor force participation of women withsmall children), that choices sometimes must bemade regarding the time and energy devoted towork and family roles. Although some companiesprovide some form of child care assistance (or make
broader, more integrated attempts to introducework-family flexibility and reduce quits [Batt &Valcour, 2003]), Lee and Maurer (1999) cited U.S.Bureau of Labor Statistics data indicating that thisassistance is the exception rather than the rule.They argued that the roles of family and nonworkfactors in general, although recognized (e.g., Mob-ley, 1977), have received too little attention in turn-over theory and research, and that, in keeping withour general logic and that of the unfolding model,employee attitudes and cognitive processes mayoperate to influence turnover differently for thosefacing work-family choices.
The main difference between this family-relatedturnover group and the turnover groups discussedpreviously is that the focal attention here is not onthe near-term transition to another job. Nonjob fac-tors (e.g., pregnancy, transfer of spouse, healthproblem, etc.) may change the turnover decisionprocess (Mobley, 1977), and the unfolding modelallocates paths 1 and 2 to this type of voluntaryleaver. Path 1 is initiated by a shock (e.g., preg-nancy), but an individual on this path has ascripted action plan at hand. Path 2 is identicalwith path 1, except that employees do not haveready responses. In either case, these two paths inthe unfolding model involve few, if any, of the keyconstructs associated with the decision process de-scribed by traditional turnover models. We thushypothesize that, in terms of the two key variablesin our study, voluntary leavers from this group willbe significantly less affected than leavers who fol-low the traditional turnover path depicted bygroup 1.
Hypothesis 4a. In group 4 (individuals whoquit for family reasons), the negative relation-ship between job satisfaction and voluntaryturnover is weaker than it is in groups 1 and 2.
Hypothesis 4b. In group 4, the negative rela-tionship between unemployment rate and vol-untary turnover is weaker than it is in group 1.
Hypothesis 4c. In group 4, the interaction be-tween job satisfaction and unemployment ratein the prediction of voluntary turnover isweaker than it is in group 1.
Table 1 summarizes all of our hypotheses.
DATA AND METHODS
Sample
The primary data source for the present studywas the National Longitudinal Survey of Youth,1979 Cohort (NLSY79), sponsored and directed by
656 AugustAcademy of Management Journal

the U.S. Bureau of Labor Statistics (BLS). We alsoobtained additional data from the BLS (the CurrentPopulation Survey and the NLSY79 “geocode”).The NLSY79 is a survey of a nationally representa-tive sample of young men and women who were 14to 21 years of age when first interviewed in 1979.The cohort was interviewed annually through1994, and after 1994 the survey was put on a bien-nial schedule. The present study used the 1996,1998, and 2000 surveys. The study window al-lowed us to capitalize on the new availability ofunsolicited job offer questions in the 1996, 1998,and 2000 NLSY79 surveys. The present sampleconsisted of respondents who were interviewed in1996 and provided information on their current ormost recent jobs.2 We excluded nonrespondents aswell as those respondents who were self-employed,working in a family business, or serving in thearmed forces. This left a possible sample of 6,366,which was reduced to a final sample of 6,198 afterwe dropped observations with missing data on keyvariables.3 The age range in our data was 31 to 38 in1996 and 35 to 42 by 2000. In the U.S. economy,
total employment (age 20 and over) was 124.4 mil-lion in 1996, with roughly 42 million, or aboutone-third, of that total falling into the 31 to 42 agegroup we used. In 1996 alone, 208 different three-digit industries and 312 different three-digit occu-pations, as defined by the SIC system and the Dic-tionary of Occupational Titles respectively, wererepresented.
Analytical Method
We used survival analysis, which is designed foruse in modeling “time to event” data. (Primers onsurvival analysis are provided by Allison [1984]and Tuma [1982], and see Morita, Lee and Mowday[1993] for an explanation of survival analysis in thespecific context of employee turnover research.) Instudying turnover, we modeled the amount of timean employee “survived” with an employer prior tothe focal event (quitting, or turnover) taking place.An important issue in studying survival time in anemployee turnover context is “right-censoring,” inwhich a study period ends before the event of in-terest occurs for all observations. A key advantageof survival analysis over traditional turnover re-search designs is its ability to handle this and otherforms of censoring (see Morita et al., 1993). Forinstance, when group 1 (those who quit to takeother jobs) is the subject of analysis, observationsfor individuals in other groups (involuntary leaversand voluntary leavers for other reasons) are treatedas censored at the point of turnover. Unlike tradi-tional regression models, however, survival analy-sis can utilize the information that individuals witha censored observation survived up to the point ofcensoring. Unless these censored observations arerandom with regard to model variables and rela-tionships, failure to account for them can result inbiased estimates (Morita et al., 1993; Sturman &Trevor, 2001), as described in Cook and Campbell’s
2 An employment history for the reported job, withinformation on tenure, job characteristics, demographiccharacteristics, etc., was created for each subject. If arespondent had already left his or her job before the 1996survey date, the inclusion of that respondent was basedon whether all relevant information on the most recentjob was reported. If a respondent reported a current job atthe 1996 survey date, the individual was followed up tothe date of turnover, or up to the date of the 2000 surveyif no transition occurred.
3 As some predictors (e.g., job satisfaction, unemploy-ment rate, wage, age, etc.) change over time, the originaldata were reconfigured into multiple spells per person sothat different values of time-varying predictors matchedthe periods of tenure corresponding to the dates of eachinterview, voluntary turnover, or censoring. The finaldata set contained 14,360 observation records (or spells)for the 6,198 persons. A maximum of one quit event (i.e.,the first quit event reported during the study window)was observed for each respondent, which precludes po-
tential statistical complications associated with using re-peated quit events.
TABLE 1Summary of Hypotheses and Relationships to Paths in the Unfolding Model
Relationship with Turnover
Group 1 (TakeAnother Job):
Path 4b
Group 2 (Look forAnother Job):
Paths 2 and 4a
Group 3 (ReceiveUnsolicited JobOffer): Path 3
Group 4 (Leave forFamily Reasons):
Paths 1 and 2
Job satisfaction 3 turnover Yes Yes Weaker than groups 1and 2
Weaker than groups 1and 2
Unemployment rate 3 turnover Yes Weaker than group 1 Weaker than group 1 Weaker than group 1Job satisfaction � unemployment rate 3
turnoverYes Weaker than group 1 Weaker than group 1 Weaker than group 1
2008 657Lee, Gerhart, Weller, and Trevor

(1979) discussion of nonrandom mortality as athreat to internal validity.
The above model amounts to what is called “acompeting-risks model” in the survival analysis lit-erature (e.g., Allison, 1984; Yamaguchi, 1991).Competing-risks models deal with situations ofmultiple types of events (competing risks), inwhich the occurrence of one type of event removesa person from the risk of all other types of events;the person will thus no longer contribute to thesuccessive risk set. Given that different groups ofvoluntary leavers follow qualitatively different pro-cesses, we assumed that the turnover paths de-picted above were independent of each other (i.e.,we had an independent competing-risks model).The independence assumption allowed us to esti-mate separate event-specific survival models; italso allowed for an equality test of parameters in-cluding covariate effects across separate event-spe-cific models (Narendranathan & Stewart, 1991).
Within the competing-risks framework, we pri-marily used a semiparametric proportional hazardsmodel, also known as a Cox regression model (Cox,1972; Morita et al., 1993; Morita, Lee, & Mowday,1989). The hazard function of the model is givenwith r(t, x) � h(t)exp(�x) where h(t) denotes a base-line hazard function, x is a vector of (time-depen-dent) covariates, and � is a vector of unstandard-ized regression coefficients. The baseline hazardcan be interpreted as the general turnover probabil-ity, conditional on employee tenure. The modeldoes not include assumptions about the time de-pendence of the baseline hazard h(t) which, in fact,is not estimated (Kalbfleisch & Prentice, 1980).
The Cox model produces regression coefficientsthat can be used to determine the percent change inthe hazard rate (i.e., probability of a turnover eventhere), given a unit change in the independent vari-able. To derive the percent change in the probabil-ity of turnover from an unstandardized Cox regres-sion coefficient, we used the formula [exp(�) – 1] �100. Thus, for example, a coefficient of –.50 wouldimply that a one-unit change in the independentvariable is associated with a 39.3 percent decreasein turnover probability, whereas a coefficient of .50would imply a 64.9 percent increase in turnoverprobability.
In addition, to better understand the shape of thehazard function, we also estimated a fully parame-terized proportional hazards log-logistic model, assuggested by Bruderl and Diekmann (1995). Thisflexible model is given by the hazard function:
r(t, x) � bp(�t)p�1
1 � (�t)p . (1)
Through each model parameter, b, p, and �, co-variates can be introduced to the model. Covariatesintroduced to the b parameter make the model aproportional hazards model, and the correspondingregression function is b � exp(�0 � �x), where �0 isthe regression constant, x is a vector of (time-de-pendent) covariates, and � is a vector of coeffi-cients. If no covariates are introduced to a param-eter, only the constant is estimated. A scalingvector, �, determines the temporal properties of thehazard function, and p is a shape parameter. If p �1, the hazard function has an inverted U-shape; ifp � 1, the hazard function is monotonically de-creasing. As the model was fully parameterized, itallowed us to directly estimate individual turnoverhazards for any given tenure. We hoped that acloser examination of the temporal properties ofthe turnover hazard would provide additional in-sights into the decision processes of distinct groupsof leavers.4
Measures
Voluntary turnover. We used two questions inthe NLSY79 to classify voluntary leavers into thefour distinct groups:
Question 1 and its response options were, “Whatis the main reason you left your job? (1) layoff, (2)plant closed, (3) end of temporary or seasonal job,(4) discharged or fired, (5) program ended, (6) quitfor pregnancy or family related reasons, (7) quit tolook for another job, (8) quit to take another job, (9)quit for other reasons.” Question 2 was, “Were youlooking for work when you were offered this job?”(1 � “yes,” 0 � “no”). If the response was yes, theinterviewer asked follow-up questions regardingthe nature of the job search. The three most com-mon search activities were “contacted employer,”“contacted friends/relatives,” and “submitted aresume.”
4 In both cases, Cox and log-logistic models, the appli-cation of a proportional hazards model requires the haz-ard rates for varying values of the covariates to be pro-portional. We conducted two tests to confirm theassumption. The first test was interacting analysis time(tenure) with the covariates and verifying that the inter-acted variables did not have significant effects on thehazards, because the proportional hazards assumption isthat the effects do not change with time except in waysthat are already parameterized. The results did not revealsignificant interactions, which conformed to the propor-tional hazards assumption. The second test is a graphicalmethod (Andersen, 1982; Blossfeld & Rohwer, 2002). Theresulting plots were also in support of the proportionalityassumption.
658 AugustAcademy of Management Journal

Individuals who reported in question 1 that theyhad quit their jobs for reasons 6, 7, or 8 were clas-sified as exhibiting voluntary turnover as definedin this study. Individuals who left to look for otherjobs (reason 7) were assigned to group 2. Group 4consisted of individuals who left for pregnancy orother family-related reasons (reason 6). If a personanswered question 1 with reason 8, “quit to takeanother job,” we then checked the answer to ques-tion 2. A person reporting looking for work whenoffered a job, which we defined as a solicited joboffer, was assigned to group 1; if the individual wasnot looking when offered a job, a situation that wedefined as an unsolicited job offer, the person wasassigned to group 3. There were a total of 1,105voluntary leavers in groups 1 through 4.
Individuals who had quit their jobs and an-swered question 1 with reasons 1 through 5 wereclassified as involuntary leavers (872 individuals,14.1%). Thus, we considered observations for theseindividuals censored at the point of employmenttermination. Stayers (2,368 individuals, 38.2%),untraceable records (646 individuals, 10.4%), andindividuals who quit for unreported reasons (1,207individuals, 19.5%) were considered right-cen-sored at the end of the study window, at the timetheir records became untraceable, or at the timethey quit, respectively. Thus, censored observa-tions accounted for 5,093 (82%) of the total of 6,198persons in the sample, with the remaining 1,105persons (18%) voluntarily quitting during the timeframe of the study.
Job satisfaction. Global job satisfaction wasmeasured as follows: “How do/did you feel aboutyour job? Do/did you like it very much (3), like itfairly well (2), dislike it somewhat (1), or dislikeit very much (0)?” Despite concerns about thepotentially low reliability of a single-item mea-sure, researchers have demonstrated the superi-ority of a single-item measure to a summatedscale of “facet job satisfaction” when measuringoverall job satisfaction (Scarpello & Campbell,1983) and substantial convergent validity of asingle-item measure with facet scales (Wanous,Reichers, & Hudy, 1997). A meta-analysis by Tettand Meyer (1993) reported the mean correlationbetween voluntary turnover and global job satis-faction to be –.27 for multi-item scales and –.16for single-item scales. Thus, our use of a single-item scale likely attenuated observed relation-ships. However, as our hypotheses focus on therelative sizes of relationships (i.e., whether turn-over groups differ), any attenuation should leavehypothesis tests unaffected.
Relevant unemployment rate. FollowingTrevor’s (2001) approach, we created a yearly (com-
bined) unemployment rate for each individual byusing a linear combination of local and occupa-tional unemployment rates in which weights wereassigned on the basis of Boston’s (1990) decisionrule for assigning occupations to primary and sec-ondary labor markets. Thus, the occupational un-employment rate was emphasized for occupationsrequiring specific skills, while the local unem-ployment rate was emphasized for occupations inthe secondary labor market. The occupational un-employment rate at the three-digit occupationallevel and the local unemployment rate werebased on the Current Population Survey and theNLSY79 geocode, respectively.
Control variables and tenure. We included avariety of control variables in view of their likelyrelevance and use in prior related research. Table 2lists the control variables used and describes howwe measured them. We also included tenure, aduration variable, in analyses.
RESULTS
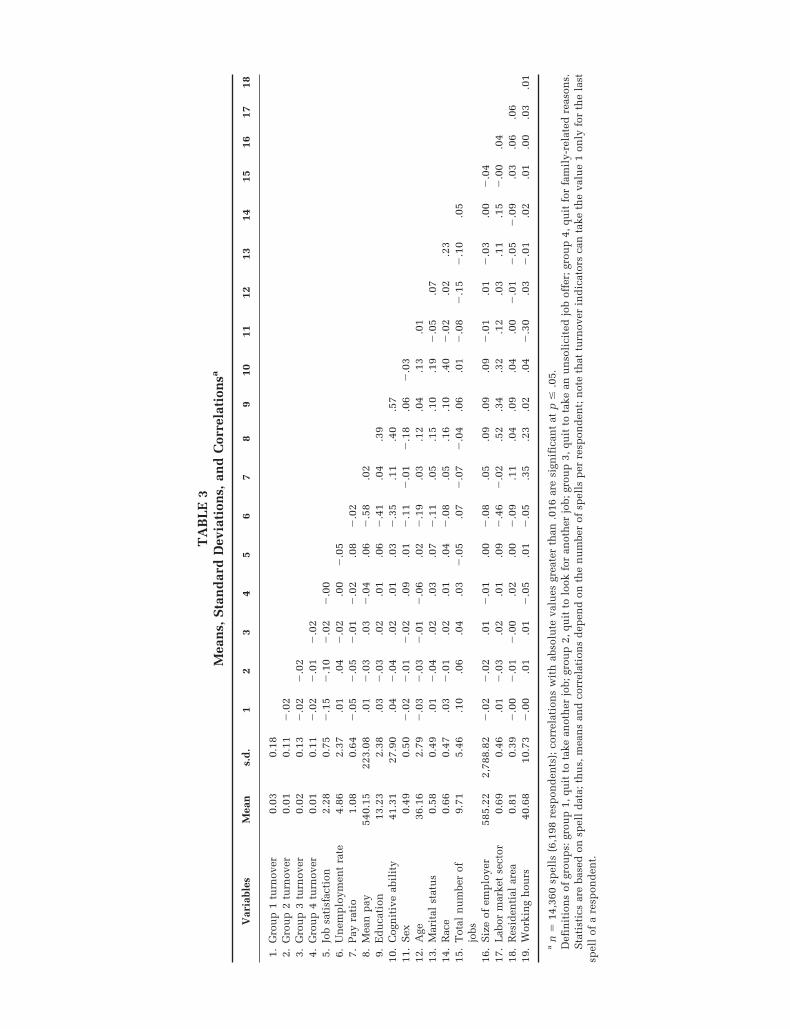
Table 3 reports descriptive statistics and correla-tions for all the study’s variables.
Hypothesis Tests
Table 4 displays the results of the competing-risks Cox proportional hazards models; all thereported coefficients are unstandardized. Table 5adds the cross-product of job satisfaction andunemployment rate to the Table 4 models. Aspredicted in Hypotheses 1a and 2a, in the modelsgiven in Table 4, job satisfaction is negativelyrelated to voluntary turnover probability forgroups 1 and 2. Supporting Hypotheses 3a and4a, the job satisfaction effect appears to be weakerin groups 3 and 4 than in groups 1 and 2. Waldchi-square tests of equality, reported in Table 6,provide statistical confirmation of this difference(with groups 1 and 2 both combined and heldseparate). For each group, we computed the per-cent change in the turnover hazard rate as a func-tion of a one-unit increase in job satisfaction,using the formula [exp(�) – 1] � 100. The percentchange is –56 percent for group 1, –55 percent forgroup 2, –24 percent for group 3, and – 8 percentfor group 4; for these results, see Table 7, whichpresents voluntary turnover characteristics bygroup. Thus, the effect of job satisfaction on thehazard rate is more than twice as large for group1 (take another job) and group 2 (look for anotherjob) as for group 3 (received unsolicited job offer)
2008 659Lee, Gerhart, Weller, and Trevor

TABLE 2Description of Control Variables
Variable Description
Tenure Total tenure in weeks at each reported job. Used as duration time in the analyses.
Education level The highest grade completed as of May in each survey year. Controls for differences inindividuals’ mobility due to different education levels (e.g., Cotton & Tuttle, 1986; March &Simon, 1958; Trevor, 2001).
Cognitive abilitya Scores in the Armed Forces Qualifications Test (AFQT) in the 1980 NLSY79 survey. Controlsfor differences in individuals’ mobility due to different cognitive abilities (e.g., Dickter etal., 1996; Gerhart, 1990; Trevor, 2001).
Relative pay ratiob An individual’s current pay level relative to the expected pay level in the relevant job marketdefined by the respondent’s three-digit occupation and individual characteristics. Serves asa partial indicator of the potential attractiveness or utility of alternative jobs (e.g., Blau &Kahn, 1981; Hom & Kinicki, 2001; March & Simon, 1958; Mobley et al., 1979; Parsons,1973; Trevor, 2001; Viscusi, 1980).
Mean occupational pay The mean pay level at each three-digit occupation calculated using the Center for PeopleStats (CPS) data. Controls for potential occupation-specific differences in turnoverpropensity (e.g., Trevor, 2001).
Labor market sector A binary variable indicating whether a respondent’s occupation belonged to the primary(coded 1) or secondary (coded 0) labor market (e.g., Boston, 1990; Trevor, 2001). Controlsfor potential labor market sector– (occupation)-specific differences in turnover propensity.
Weekly working hours Usual hours worked per week. Controls for possible differences in turnover propensity dueto full/part-time status (e.g., Hulin et al., 1985).
Residential area A binary variable for a respondent’s residence in a Standard Metropolitan Statistical Area(SMSA; coded 1) or non-SMSA (coded 0). Controls for possible differences in turnoverpropensity due to different geographical characteristics (e.g., Judge & Watanabe, 1995;March & Simon, 1958).
Employer size The number of employees working at the current job location. Controls for possibledifferences in turnover propensity as a function of employer size, such as opportunities forinternal transfer and visibility to external employers (e.g., March & Simon, 1958; Mobley etal., 1979).
Total number of jobs The accumulated number of jobs a respondent had held during his/her working career.Controls for differences in turnover propensity due to each individual’s inherent turnoverpropensity (e.g., job hopper [Judge & Watanabe, 1995]) or occupational characteristics.
Demographic variables Control for possible differences in turnover propensity due to discriminatory employmentpractices, different occupational or job markets, and etc. that can be functions ofdemographics.
Sex Coded 0 for male, 1 for female.Race Coded 0 for nonwhite, 1 for white.Marital status Coded 0 for nonmarried (i.e., never married, divorced, separated, etc.), 1 for currently
married.Age Age as of each interview date.
a This test is a composite of four quantitative and verbal tests (arithmetic reasoning, numerical operations, word knowledge, andparagraph comprehension) and was conducted in the 1980 survey. Although there was no recent follow-up test for the NLSY79 sample,the cognitive ability construct has been reported to be stable over time (Gottfredson, 1986). The AFQT composite has a reliability over .90(Bock & Moore, 1986).
b To calculate the individual relative pay ratio, we first used data from the CPS to compute a wage equation, by year, for each occupationin our study. The wage equations included education level, sex, race, age, and age squared as predictors. Then, using the estimatedregression coefficients obtained, for each three-digit occupation and year, each individual’s wage was predicted in our NLSY79 sampleusing each individual’s values on these independent variables. This predicted wage can be interpreted as the mean wage an individualwith certain characteristics (i.e., education, sex, age, and race) is expected to earn in the three-digit occupational job market in a specificyear. Finally, the pay ratio measure was computed as the ratio of the actual wage reported in the NLSY79 for each year to the predictedwage that was calculated for each individual and year using the CPS data. An individual with a lower pay ratio is more likely to find abetter-paying job in the external labor market, and thus more likely to leave than an individual with a higher pay ratio.
660 AugustAcademy of Management Journal
TA
BL
E3
Mea
ns,
Sta
nd
ard
Dev
iati
ons,
and
Cor
rela
tion
sa
Var
iabl
esM
ean
s.d
.1
23
45
67
89
1011
1213
1415
1617
18
1.G
rou
p1
turn
over
0.03
0.18
2.G
rou
p2
turn
over
0.01
0.11
�.0
23.
Gro
up
3tu
rnov
er0.
020.
13�
.02
�.0
24.
Gro
up
4tu
rnov
er0.
010.
11�
.02
�.0
1�
.02
5.Jo
bsa
tisf
acti
on2.
280.
75�
.15
�.1
0�
.02
�.0
06.
Un
emp
loym
ent
rate
4.86
2.37
.01
.04
�.0
2.0
0�
.05
7.P
ayra
tio
1.08
0.64
�.0
5�
.05
�.0
1�
.02
.08
�.0
28.
Mea
np
ay54
0.15
223.
08.0
1�
.03
.03
�.0
4.0
6�
.58
.02
9.E
du
cati
on13
.23
2.38
.03
�.0
3.0
2.0
1.0
6�
.41
.04
.39
10.
Cog
nit
ive
abil
ity
41.3
127
.90
.04
�.0
4.0
2.0
1.0
3�
.35
.11
.40
.57
11.
Sex
0.49
0.50
�.0
2�
.01
�.0
2.0
9.0
1�
.11
�.0
1�
.18
.06
�.0
312
.A
ge36
.16
2.79
�.0
3�
.03
�.0
1�
.06
.02
�.1
9.0
3.1
2.0
4.1
3.0
113
.M
arit
alst
atu
s0.
580.
49.0
1�
.04
.02
.03
.07
�.1
1.0
5.1
5.1
0.1
9�
.05
.07
14.
Rac
e0.
660.
47.0
3�
.01
.02
.01
.04
�.0
8.0
5.1
6.1
0.4
0�
.02
.02
.23
15.
Tot
aln
um
ber
ofjo
bs9.
715.
46.1
0.0
6.0
4.0
3�
.05
.07
�.0
7�
.04
.06
.01
�.0
8�
.15
�.1
0.0
5
16.
Siz
eof
emp
loye
r58
5.22
2,78
8.82
�.0
2�
.02
.01
�.0
1.0
0�
.08
.05
.09
.09
.09
�.0
1.0
1�
.03
.00
�.0
417
.L
abor
mar
ket
sect
or0.
690.
46.0
1�
.03
.02
.01
.09
�.4
6�
.02
.52
.34
.32
.12
.03
.11
.15
�.0
0.0
418
.R
esid
enti
alar
ea0.
810.
39�
.00
�.0
1�
.00
.02
.00
�.0
9.1
1.0
4.0
9.0
4.0
0�
.01
�.0
5�
.09
.03
.06
.06
19.
Wor
kin
gh
ours
40.6
810
.73
�.0
0.0
1.0
1�
.05
.01
�.0
5.3
5.2
3.0
2.0
4�
.30
.03
�.0
1.0
2.0
1.0
0.0
3.0
1
an
�14
,360
spel
ls(6
,198
resp
ond
ents
);co
rrel
atio
ns
wit
hab
solu
teva
lues
grea
ter
than
.016
are
sign
ific
ant
atp
�.0
5.D
efin
itio
ns
ofgr
oup
s:gr
oup
1,qu
itto
take
anot
her
job;
grou
p2,
quit
tolo
okfo
ran
oth
erjo
b;gr
oup
3,qu
itto
take
anu
nso
lici
ted
job
offe
r;gr
oup
4,qu
itfo
rfa
mil
y-re
late
dre
ason
s.S
tati
stic
sar
eba
sed
onsp
ell
dat
a;th
us,
mea
ns
and
corr
elat
ion
sd
epen
don
the
nu
mbe
rof
spel
lsp
erre
spon
den
t;n
ote
that
turn
over
ind
icat
ors
can
take
the
valu
e1
only
for
the
last
spel
lof
are
spon
den
t.

and more than six times as large as for group 4(had family reasons for leaving).
Turning back to Table 4, one can also see thatthe coefficient on unemployment rate fails toreach statistical significance in all turnovergroups. In addition, Table 6 indicates that thereare no differences among the turnover groups inthe magnitude of the unemployment rate coeffi-cient. Thus, no support was found for Hypothe-ses 1b, 2b, 3b, and 4b. Table 5 shows that thecross-product of job satisfaction and the unem-ployment rate reaches statistical significance ingroup 1, which is consistent with Hypothesis 1c.Specifically, when the unemployment rate is onestandard deviation below the mean (i.e., 2.49%),the job satisfaction coefficient becomes �.90,which means that a one-unit increase in job sat-isfaction is associated with a 59 percent decreasein the turnover hazard rate (i.e., [exp(–.90) – 1] �100 � –59%). In contrast, when the unemploy-ment rate is one standard deviation above themean (i.e., 7.23%), the job satisfaction coefficientbecomes –.71, which means that a one-unit in-crease in job satisfaction is associated with a 51
percent decrease in the turnover hazard rate.However, as Table 6 indicates, no support wasfound for Hypotheses 2c, 3c, and 4c, which pre-dict that the coefficient on the cross-product ofjob satisfaction and unemployment rate will dif-fer for the different turnover groups.
Group Differences in Model Fit
Given the empirical support for the hypothe-sized differential predictive validity of job satis-faction, it was of interest to us to see how thisfinding might affect the degree to which overallmodel fit differed among the turnover groups (seeTable 4). Both estimates of model fit that weused, the likelihood-ratio test statistic and thepseudo-R2
m, a variance-explained analogue forcompeting-risks (and single-risk) models(Maddala, 1983; Schemper, 1992), differed overthe groups, with model fit in group 1 (take an-other job) and group 2 (look for another job)better than in group 3 (get unsolicited job offer).Although model fit for group 4 (leave for familyreasons) is similar to that for group 2, it appears
TABLE 4Results of Competing-Risks Cox Regression Analysis: Main Effects by Turnover Groupa
Models/Variables
Group 1: TakeAnother Job
Group 2: Look forAnother Job
Group 3: AcceptUnsolicited Job
OfferGroup 4: Leave for
Family Reasons
b s.e. b s.e. b s.e. b s.e.
Job satisfaction �0.82 .05*** �0.80 .08*** �0.27 .08*** �0.08 .10Unemployment rate �0.02 .03 0.06 .04 0.04 .04 0.04 .04Pay ratio �0.68 .13*** �1.44 .24*** �0.18 .13 �0.12 .15Mean pay/100 �0.08 .03* �0.10 .05 0.01 .04 �0.08 .05Education 0.02 .03 �0.03 .04 0.03 .03 �0.04 .04Cognitive ability 0.10 .02*** �0.02 .04 0.02 .03 0.11 .04**Sex �0.21 .10* 0.10 .17 �0.25 .14 1.96 .24***Age �0.17 .02*** �0.16 .03*** �0.13 .03*** �0.29 .03***Marital status 0.22 .10* �0.41 .16** 0.36 .14** 0.59 .17***Race 0.02 .12 0.09 .17 0.06 .16 �0.06 .18Total number of jobs 0.06 .01*** 0.05 .01*** 0.04 .01*** 0.03 .01Size of employer �0.00 .00 �0.00 .00 0.00 .00 �0.00 .00Sector 0.21 .13 �0.03 .18 0.39 .18* 0.14 .20Residential area 0.05 .12 0.11 .18 0.01 .16 0.51 .22*Weekly working hours 0.01 .01* 0.03 .01*** 0.01 .01 �0.01 .01
Overall fitLog-likelihood (partial) �3,105.39 �1,205.45 �1,736.60 �1,169.34Likelihood-ratio test (�2) 499.54*** 243.65*** 81.12*** 253.78***
Pseudo-R2m .08 .04 .01 .04
a n � 14,360 spells (6,198 respondents); coefficients are unstandardized; pseudo-R2m for a single-risk model (turnover groups com-
bined) � .106; pseudo-R2m for the overall competing-risks model (turnover groups not combined) � .160.
* p � .05** p � .01
*** p � .001
662 AugustAcademy of Management Journal

that, as expected, demographic variables, ratherthan job satisfaction, primarily drive fit ingroup 4.
Further evidence of differences in the fourturnover groups’ fit (based on the Table 4 results)comes from comparing values of pseudo-R2
m for asingle-risk model and our competing-risksmodel. In the single-risk model, quits from thefour different turnover groups are combined intoa single group (pseudo-R2
m � .106); in the com-peting-risks model, estimation is separate foreach turnover group (pseudo-R2
m � .160). Thisdifference indicates that variance explained is 51percent higher (i.e., .160/.106) when the distinctpaths for each of the four turnover groups areincorporated using the competing-risks model.5
Thus, modeling the four turnover groups sepa-rately results in better explanatory power than
combining them. The difference in job satisfac-tion coefficients across groups, in combinationwith the fact that overall model fit also differsacross groups, suggests that the central role givento job satisfaction in traditional turnover modelsis better warranted for explaining some types ofturnover than others.
Table 7, in addition to summarizing the differ-ential effects of job satisfaction in the variousturnover groups, provides descriptive statisticsuseful in understanding the relative sizes of thefour turnover groups and their characteristics.The first row shows that of a total of 1,105 turn-over events modeled in our study 40 percent(254 � 184 � 438) were in group 3 (unsolicitedjob offer) or group 4 (family-related reasons).Thus, not only is model fit relatively poor for,and job satisfaction less predictive of, turnoverfor these groups, but also, nearly half of the vol-untary quits fall into these groups.
Table 7 also shows that group 3 (unsolicited joboffer) had a relatively high job satisfaction mean,as well as the highest percentage of respondents
5 A pseudo-R2 cannot be directly compared to an R2
because the two statistics are constructed differently. Forexample, in most cases, the maximum value of a pseu-do-R2 is less than unity.
TABLE 5Results of Competing-Risks Cox Regression Analysis: Main Effects and Interaction of Job Satisfaction and
Unemployment Rate by Turnover Groupa
Models/Variables
Group 1: TakeAnother Job
Group 2: Look forAnother Job
Group 3:Unsolicited Job
OfferGroup 4: Family
Reasons
b s.e. b s.e. b s.e. b s.e.
Job satisfaction �1.00 .10*** �0.93 .19*** �0.36 .17* �0.21 .22Unemployment rate �0.08 .06 �0.00 .09 �0.02 .11 �0.04 .14Job satisfaction � unemployment rate 0.04 .02* 0.02 .03 0.02 .03 0.03 .04Pay ratio �0.68 .13*** �1.44 .24*** �0.18 .13 �0.12 .15Mean pay/100 �0.08 .03* �0.10 .05 0.01 .04 �0.08 .05Education 0.02 .03 �0.03 .04 0.03 .03 �0.04 .04Cognitive ability 0.10 .02*** �0.01 .04 0.02 .03 0.11 .04**Sex �0.21 .10* 0.09 .17 �0.25 .14 1.95 .24***Age �0.17 .02*** �0.16 .03*** �0.13 .03*** �0.29 .03***Marital status 0.23 .10* �0.40 .16* 0.37 .14** 0.59 .17***Race 0.02 .12 0.09 .17 0.06 .16 �0.06 .18Total number of jobs 0.06 .01*** 0.05 .01*** 0.04 .01*** 0.03 .01Size of employer �0.00 .00 �0.00 .00 0.00 .00 �0.00 .00Sector 0.20 .13 �0.03 .18 0.39 .18* 0.13 .20Residential area 0.05 .12 0.12 .18 0.01 .16 0.51 .22*Weekly working hours 0.01 .01* 0.03 .01*** 0.01 .01 �0.01 .01
Overall fitLog-likelihood (partial) �3,103.46 �1,205.09 �1,736.40 �1,169.14Likelihood-ratio test (�2) 503.40*** 244.20*** 81.53*** 254.18***
Pseudo-R2m .08 .04 .01 .04
a n � 14,360 spells (6,198 respondents); coefficients are unstandardized.* p � .05
** p � .01*** p � .001
2008 663Lee, Gerhart, Weller, and Trevor

in managerial/professional occupations andworking full time. Group 4 (family-related rea-sons) had the highest job satisfaction mean andwas predominantly composed of women, manyof whom worked in service-related jobs and/orpart-time.
Group Differences in Hazard Function Shapes:Additional Analyses
The above results indicate important differencesin both model fit and the impact of job satisfactionfor the groups, especially when groups 1 and 2 arecompared with groups 3 and 4. In this section, weexplore whether there are also differences in theshapes of hazard functions (turnover hazard plot-ted against tenure) in the various groups.
The notes in Figure 1 report the log-logistic esti-mates of the parameters describing the shape of thehazard function in each group. Using these esti-mates and mean values of the covariates, Figure 1depicts the hazard functions of the four groups ofvoluntary leavers. As must be the case, the absolutelevels of the single hazard functions vary accordingto the number of turnover events observed. The pparameters for groups 1 and 3 are significantly dif-ferent from unity, thus indicating inverted
U-shaped turnover hazard functions. In contrast,p is greater than but not significantly differentfrom unity for groups 2 and 4, indicating that thehazard functions for these groups have a more orless monotonically decreasing shape. Corre-spondingly, for groups 1 and 3, the hazard func-tions peak after 112 and 97 weeks, respectively,and the peaks occur after 25 and 13 weeks forgroups 2 and 4. The turnover hazards for groups1 and 3 increase considerably after organizationalentry.
For group 1 (take another job), a possible ex-planation is that these individuals experiencesome degree of job dissatisfaction (or mismatch)after organizational entry. Motivated by dissatis-faction, they go through a deliberate process ofdeciding whether to stay or quit, which includessearching for alternative opportunities. Duringthis decision process, the turnover hazard in-creases as alternatives open up. Interestingly,group 3 (get unsolicited offer) has a hazard func-tion similar to that for group 1, even though ourearlier analyses demonstrated important differ-ences in other respects. It may be that group 3individuals are especially visible to other em-ployers because of high performance and/or pro-motion rate (Trevor et al., 1997). If so, it likely
TABLE 6Results of Equality Tests across Groups
Comparison Groupsa
Likelihood-Ratio Tests:Equality of All
Parametersb
Wald Likelihood-Ratio Tests: Equality of Coefficients on . . .
JobSatisfactionc
UnemploymentRatec
Job Satisfaction �Unemployment Rated
Job Satisfaction/Unemployment Rate/
Job Satisfaction �Unemployment Ratee
�2(16) �2(1) �2(1) �2(1) �2(3)
1 and 2 versus 3 1,174.58*** 36.82*** 0.02 0.11 41.41***1 and 2 versus 4 1,136.52*** 47.05*** 0.02 0.03 53.56***1 and 2 versus 3 and 4 1,663.43*** 71.44*** 0.05 0.05 77.71***1 versus 2 855.64*** 0.04 0.84 0.19 0.931 versus 3 1,014.86*** 34.79*** 0.23 0.21 38.03***1 versus 4 1,003.32*** 45.21*** 0.17 0.07 49.71***2 versus 3 710.51*** 23.48*** 0.16 0.00 24.94***2 versus 4 727.25*** 33.61*** 0.13 0.00 36.26***
a Group 1, quit to take another job; group 2, quit to look for another job; group 3, quit to take an unsolicited job offer; group 4, quit forfamily-related reasons.
b Test statistic based on Narendranathan and Stewart (1991: 335).c Wald tests for the equality of the main job satisfaction and unemployment rate effects for paired groups; i.e., models did not include
interaction effects of job satisfaction and unemployment rate (see Table 4 for main effect coefficients on job satisfaction andunemployment rate).
d Wald tests for the equality of the interaction effect of job satisfaction and unemployment rate for paired groups; interaction effectmodels (see Table 5 for coefficients).
e Likelihood-ratio tests for the joint equality of the coefficients of job satisfaction, unemployment rate and job satisfaction � unem-ployment rate for paired groups (see Table 5 for coefficients).
*** p � .001
664 AugustAcademy of Management Journal

takes time for this success to occur and be ob-served, which is consistent with occurrence ofthe hazard rate peak at 97 weeks. For both groups1 and 3, the hazard functions peak and largelystay at a relatively high level.
Group 2 (look for another job) and group 4 (leavefor family reasons) have differently shaped hazardfunctions in that the turnover hazard shows anoverall monotonically decreasing shape. However,the average slope is small, indicating a more or lessconstant hazard function. For group 2, a plausibleexplanation is that if these individuals experiencemismatch at any point after organizational entry,they do not delay their turnover decisions to firstsearch for alternatives. Group 4 individuals mayquit in response to a non-job-related shock as de-fined by the unfolding model of turnonver (e.g.,pregnancy), which can occur at any time duringtheir tenure with an organization. In sum, inspec-tion of the hazard functions provides further evi-dence of turnover group differences.
DISCUSSION
Since March and Simon’s (1958) seminal work,considerable effort has been devoted to elaborating
and testing their model of voluntary employeeturnover. There is a sense, however, that new ideasand approaches are needed to move the field sig-nificantly forward (Griffeth et al., 2005; Lee &Mitchell, 1994; Lee et al., 1999; Steel, 2002; Maertz& Campion, 2004). In response, we built on newerconceptualizations to advance treatments of Marchand Simon’s fundamental perceived desirabilityand ease of movement constructs.
First, we built on the important idea from theunfolding model of turnover (Lee et al., 1999; Lee &Mitchell, 1994) that there are multiple distinctpaths to employees’ leaving jobs and that one of thecrucial ways in which these paths are likely todiffer is in the role of job (dis)satisfaction. On theempirical front, we were able to bring to bear alarge, national sample of stayers and leavers ofdifferent types, which allowed us to go beyondprevious unfolding model work by providing the firstquantitative estimates of how the level of job satisfac-tion was differentially predictive of the probability ofturnover in different turnover groups. Consistentlywith the unfolding model, these differences were sub-stantial. We found that the satisfaction effect on turn-over for group 1 (those quitting after successfullysearching for other jobs), the focus of most standard
TABLE 7Voluntary Turnover Characteristics by Groups
CharacteristicsGroup 1:
Take Another JobGroup 2: Lookfor Another Job
Group 3:Unsolicited Job
OfferGroup 4:
Family Reasons
Frequency n (percentage of 6,198 respondents) 479 (7.7%) 188 (3.1%) 254 (4.1%) 184 (3.0%)
Coefficient on job satisfactiona �.82*** �.80*** �.27*** �.08Hazard ratio (change of turnover hazard) .44 (�56%) .45 (�55%) .76 (�24%) .92 (�8%)
Mean levels at the time of turnoverJob satisfaction 1.68 1.62 2.15 2.26Pay ratio 0.92 0.81 1.03 0.98
Occupation (%)Managerial and professional specialty 30.7 21.0 35.1 24.5Technical, sales, administrative support 29.6 27.4 32.3 38.6Services 14.5 17.2 10.4 22.8Precision production, craft, and repair 10.1 11.3 12.4 4.4Operators, fabricators, and laborers 14.3 20.4 9.6 9.2Farming, forestry, and fishing 0.8 2.7 0.4 0.5
Labor market sector (%)Primary 71.4 55.6 77.2 72.3
Full-time vs. part-time status (%)a
Full-time 85.5 78.5 87.3 70.1Sex (%)
Male 57.4 55.0 59.1 12.0Marital status (%)
Married 60.1 39.2 65.8 69.0Race (%)
White 72.9 63.0 72.1 70.7
a The coefficients are from Table 4.
2008 665Lee, Gerhart, Weller, and Trevor

dissatisfaction-driven turnover models, was overtwice as large as the satisfaction effect for group 3(those leaving in response to unsolicited job offers)and about seven times as large as for group 4 (thoseleaving because of family reasons). The fact thatgroups 3 and 4 accounted for nearly half of all turn-over in our national sample suggests that a lack of fitto the standard turnover model is more the rule thanthe exception and is a fact that turnover scholars mustacknowledge.
Second, our framework highlighted the possibleimportance of unsolicited job offers in the turnoverprocess and in supporting the ease of movementpart of the March and Simon (1958) model. Pullfactors in turnover decisions have long been a puz-zle because of the apparent lack of strong empiricalsupport for this aspect of the model. Specifically,the fact that 23 percent of turnover in our sampleoccurred not because of search (dissatisfaction-
induced or otherwise), but rather because of unso-licited job offers, provides compelling evidencethat pull factors are indeed an important factor inturnover decisions. This striking finding, whichconfirms our earlier interpretation of Holtom et al.(2005) as suggesting the importance of unexpectedoffers, and is consistent with notions such as a “warfor talent” and “employee raiding,” highlights anenormous gap in understanding of turnover behav-ior. Thus, although measures of general labor mar-ket conditions (e.g., the unemployment rate) or per-ceptions of ease of movement may not be highlypredictive of turnover, a more immediate and tan-gible indicator of ease of movement—whether anunsolicited job offer has been received—appears toplay a major role. Accordingly, we advocate thatfuture turnover research in the March and Simon(1958) tradition build on our unsolicited job offerresults to incorporate this apparently powerful pre-
FIGURE 1Hazard Functions for Distinct Turnover Groupsa
a Parameter estimates from proportional log-logistic hazard models for four groups are shown (b-values were obtained by using meanvalues of the covariates; p and � values are estimates of the vector constants; interaction effect models):
Group 1: b � 0.0007***, p � 1.38***, � � 0.004***, r(tmax) � 0.0006, tmax � 111.92Group 2: b � 0.0002***, p � 1.08, � � 0.004***, r(tmax) � 0.0002, tmax � 24.93Group 3: b � 0.0005***, p � 1.52**, � � 0.007***, r(tmax) � 0.0004, tmax � 96.62Group 4: b � 0.0002***, p � 1.06, � � 0.005***, r(tmax) � 0.0002, tmax � 13.08
Above, tmax �1�
(p � 1)1p is the time of the maximum hazard and r(tmax) � b(p � 1)
p � 1p is the maximum hazard at tmax (Bruderl &
Diekmann, 1995).The log-logistic model estimates (�) are virtually identical to the ones obtained from the Cox regression. For reasons of parsimony, we
only report the general model parameters that inform about the individual turnover hazards. Unreported results can be obtained from theauthors.
666 AugustAcademy of Management Journal

dictor into ease of movement conceptualizationsand predictions. Such an approach to unsolicitedoffers links the unfolding model to the traditionalMarch and Simon perspective in a manner thatshould help scholars to better explain whyemployees quit.
Although we believe that receipt of an unsolic-ited job offer is strong evidence for the ease ofmovement construct, we also wish to comment onthe lack of support for the more traditional measureof ease of movement, the unemployment rate. Ear-lier, we noted that there is evidence of strong rela-tionships between unemployment rates and turn-over at aggregated levels of analysis (e.g.,Armknecht & Early, 1972; Eagly, 1965) but thatresults are mixed at the individual level (Trevor,2001). In examining our own failure to find indi-vidual-level support for the effect, we believe it isvery important to note that both the level of and thevariation in the national unemployment rate duringthe time period of our study were quite low byhistorical standards.6 This observation suggeststhat jobs were relatively plentiful throughout ourstudy window, and this restriction in range mayhave limited our ability to find an unemploymentrate effect. The restricted range may also haveplayed a role in our only finding partial support forthe hypothesized job satisfaction by unemploy-ment rate interaction.
The common theme of many turnover models isthat the level of unemployment helps determinewhether job dissatisfaction can be translated intoturnover. Given the low unemployment rates duringour study window, it seems likely that in the econ-omy as a whole, job availability was high, allowingjob dissatisfaction (especially for our turnover groups1 and 2) to significantly affect turnover. Thus, inkeeping with standard turnover models, the state ofthe labor market during the time period of a studymay well influence the link between job dissatisfac-tion and turnover. Hence, in line with our finding ofthe importance of unsolicited job offers, we believe
there is good reason to believe that ease of movementand labor market conditions do play an importantrole in turnover decisions.
Practical Implications
To be able to exercise control over turnover in anorganization, one must first determine the relativeimportance of the different turnover paths. For in-stance, if groups 1 (take another job) and 2 (look foranother job) capture the main types of voluntaryturnover in the organization, then the traditionalfocus on monitoring and influencing job satisfac-tion likely makes sense. In contrast, this strategymay be considerably less effective for group 3 (un-solicited job offer). Receiving an unsolicited joboffer without active job search may indicate thatgroup 3 individuals are highly visible (Allen &Griffeth, 2001) to external employers because ofeither their performance or rate of promotion(Trevor et al., 1997). Griffeth and Hom (1995) sug-gested that “high performers” are expected to bepulled away from their jobs by factors unrelated tojob satisfaction level. In a similar vein, Dickter,Roznowski, and Harrison argued that although “jobsatisfaction typically has a key role as mediatorbetween antecedent conditions and turnover, indi-viduals who are excellent job candidates in theirfield may quit one satisfying job and easily move onto the next” (1996: 707). The implication, then, isthat each organization must decide if it can orshould work to preempt raids by other employers(e.g., by proactively adjusting salaries, managingcareers/promotion opportunities, etc.). The factthat unsolicited job offer shocks are hard to see inadvance perhaps magnifies the importance of suchstrategies and also raises the question of whetherorganizations would be well served to develop ad-ditional systems that more systematically and pro-actively seek out information about alternative of-fers. Finally, if an organization’s turnover is duelargely to family-related reasons (group 4), our re-sults suggest that job dissatisfaction is unlikely tobe a key driver. To reduce turnover in this group,an organization must consider its policies with re-spect to work-family coordination (e.g., child care,flexible work schedules, telecommuting/work-at-home arrangements). In summary, different typesof turnover likely require different types of reten-tion strategies.
Limitations
The present study has a number of potential lim-itations. First, although we believe our study pro-vides important evidence regarding the unfolding
6 Specifically, according to Bureau of Labor Statisticsdata, the national unemployment rate during the 20 years(1976–95) preceding our study had a mean of 6.9 (s.d. �1.2). In contrast, during the period of our study (1996–2000), the unemployment rate had a mean of 4.6 (s.d. �0.56). Thus, relative to the previous 20 years, the unem-ployment rate was one-third lower during our study, andthe variation in that level was less than one half. Cohen’sd-statistic (Cohen, 1988) revealed that the mean unem-ployment rate during the period of our study was 2.1(pooled) standard deviations lower than during the pre-ceding 20 years. (Note that Cohen’s rule of thumb is thata d of .80 or greater is “large.”)
2008 667Lee, Gerhart, Weller, and Trevor

model (Lee & Mitchell, 1996), it is not a test of thefull model, which includes a broader range of typesof shocks and paths to turnover, as well as a deepertreatment of their complexities and nuances. Sec-ond, in some cases, data in our sample were onlymeasured biennially. This schedule does not poseany problems in the case of time-constant variables,but the assumption of stability over time may beunrealistic for some of the time-dependent vari-ables. Third, as noted earlier, our use of a single-item measure of job satisfaction may have attenu-ated observed relationships. Our hope is that anysuch attenuation would not significantly affectturnover group differences in model fit and regres-sion coefficients, our primary focus.
A fourth possible limitation has to do with ourmeasurement of the turnover criterion variable. Forexample, if individuals anticipate being fired, theymight choose to “voluntarily” quit to avoid thestigma of firing. Conversely, individuals who wantto quit might arrange to be fired in order to collectunemployment insurance (Allison, 1984). More-over, multiple reasons may be involved in the sameturnover decision process (e.g., job dissatisfactionand family-related reasons). In a similar vein, Lee etal. (1999) noted the existence of hybrid turnoverpaths (paths followed by individuals who switchedfrom one type to another along the way). Thoseconducting future research may wish to considerthe implications of this measurement issue.
A fifth issue concerns the external validity of oursample. On the one hand, our sample was restrictedto people between the ages of 31 and 42. It iscertainly the case that turnover rates are higher foryounger workers, as well as for older workers nearretirement age. However, the age range included inour national sample accounts for about one-third ofU.S. employment and includes over 200 differentindustries and over 300 different occupations.Thus, the overall external validity of our sample isa clear strength.
A sixth area of concern has to do with the possi-bility of method variance or social desirability biasin measuring some variables. For example, the rea-son given for turnover by a respondent may reflecta lack of self-insight and/or striving for social de-sirability. However, relative to the case in whichturnover reasons are given in an exit interview toan employer (where there may be a concern, forexample, about not “burning bridges”), we believethat the nature of the interview process (e.g., itsresearch purpose) used here to collect the data maymake this problem less likely. Finally, although ourstudy was able to model the probability of fourdifferent turnover reasons, there are clearly otherreasons for quitting that we were unable to capture
(e.g., to start a business, or to respond to earlyretirement incentives).
Future Research
Contrary to the heavy focus on job dissatisfac-tion, and subsequent job search, in theoretical andempirical turnover research, our study, supportingthe unfolding model (e.g., Lee & Mitchell, 1994),demonstrates that a large number of quits resultfrom unsolicited job offers and family concerns.Such work-family issues, including relevant reten-tion-enhancing human resource practices, have re-ceived significant research attention. Very little ac-ademic work, however, has been conducted in thecase of those leaving in response to unsolicitedoffers. What is it that makes individuals the targetsof recruiting or raiding efforts by other employers?At present, the literature provides no answer to thisquestion, as, despite an emphasis on search byemployees, virtually nothing is known aboutsearch by firms. This appears to be a critical gap inthe literature, given the incidence of turnoverdriven by unsolicited offers in our study. Similarly,Rynes, Orlitsky, and Bretz (1997), who found thatover 60 percent of positions requiring a collegedegree were filled by hiring experienced peoplerather than through college recruiting, noted theneed to examine the role of “the explosive growthof certain intermediaries [such as] private searchfirms” in such hiring (Rynes et al., 1997: 26).Whether search is initiated by a firm or its interme-diary, the important matter of what makes an out-side employee a likely target probably involvesboth individual attributes/achievements (Bretz,Boudreau, & Judge, 1994; Trevor, 2001; Trevor etal., 1997) and firm and occupation attributes (e.g.,visibility, observability). The next question, also inneed of attention, is what it takes to retain an em-ployee for whom an unsolicited job offer, ratherthan dissatisfaction, is the primary driver of con-sidering turnover.
Finally, our study provided exploratory analysescomparing the shape and timing of the turnoverhazard function and how it differed across groups.The unfolding model has offered a general hypoth-esis that the length of the decision processes differsamong distinct groups (Lee & Mitchell, 1994). Ingeneral, the parametric models we estimated andthe corresponding hazard functions supported thisnotion. For different groups, there may also bechanging relationships between predictors andturnover over time. For example, previous research(Dickter et al., 1996; Hom & Griffeth, 1991) hassuggested that predictors may be more strongly as-sociated with turnover at some points in tenure
668 AugustAcademy of Management Journal

than at others. However, more research and directevidence on this issue are needed.
REFERENCES
Allen, D. G., & Griffeth, R. W. 2001. Test of a mediatedperformance-turnover relationship highlighting themoderating roles of visibility and reward contin-gency. Journal of Applied Psychology, 86: 1014–1021.
Allison, P. D. 1984. Event history analysis: Regressionfor longitudinal event data. Beverly Hills, CA: Sage.
Andersen, P. 1982. Testing goodness-of-fit of Cox’s re-gression and life model. Biometrics, 38: 67–77.
Armknecht, P. A., & Early, J. F. 1972. Quits in manufac-turing: A study of their causes. Monthly LaborReview, 95(11): 31–37.
Batt, R., & Valcour, P. M. 2003. Human resources prac-tices as predictors of work-family outcomes and em-ployee turnover. Industrial Relations, 42: 189–220.
Blau, F. D., & Kahn, L. M. 1981. Race and sex differencesin quits by young workers. Industrial and LaborRelations Review, 34: 563–577.
Blossfeld, H. P., & Rohwer, G. 2002. Techniques of eventhistory modeling: New approaches to causal anal-ysis (2nd ed.). Mahwah, NJ: Erlbaum.
Bock, R. D., & Moore, E. G. J. 1986. Advantage anddisadvantage: A profile of American youth. Hills-dale, NJ: Erlbaum.
Boston, T. D. 1990. Segmented labor markets: New evi-dence from a study of four race-gender groups. In-dustrial and Labor Relations Review, 44: 99–115.
Bretz, R. D., Boudreau, J. W., & Judge, T. A. 1994. Jobsearch behaviors of employed managers. PersonnelPsychology, 47: 275–301.
Bruderl, J., & Diekmann, A. 1995. The log-logistic ratemodel. Two generalizations with an application todemographic data. Sociological Methods & Re-search, 24: 158–186.
Burdett, K. 1978. A theory of employee job search andquit rates. American Economic Review, 68: 212–220.
Carsten, J. M., & Spector, P. E. 1987. Unemployment, jobsatisfaction, and employee turnover: A meta-analytictest of the Muchinsky model. Journal of AppliedPsychology, 72: 374–381.
Cascio, W. F. 2000. Costing human resources (4th ed.).Cincinnati: South-western.
Cohen, J. 1988. Statistical power analysis for the be-havioral sciences (2nd ed.). Hillsdale, NJ: Erlbaum.
Cook, T. D., & Campbell, D. T. 1979. Quasi-experimen-tation: design and analysis for field settings. Chi-cago: Rand McNally.
Cotton, J. L., & Tuttle, J. M. 1986. Employee turnover: A
meta-analysis and review with implications forresearch. Academy of Management Review, 11:55–70.
Cox, D. R. 1972. Regression models and life tables. Jour-nal of the Royal Statistics Society (series B), 34:187–202.
Dickter, D. N., Roznowski, M., & Harrison, D. A. 1996.Temporal tempering: An event history analysis ofthe process of voluntary turnover. Journal of Ap-plied Psychology, 81: 705–716.
Eagly, R. V. 1965. Market power as an intervening mech-anism in Phillips curve analysis. Economica,32(125): 48–64.
Fishbein, M., & Ajzen, I. 1975. Belief, attitudes, inten-tion, and behavior. Reading, MA: Addison-Wesley.
Gerhart, B. 1987. The prediction of voluntary turnoverusing behavioral intentions, job satisfaction, andarea unemployment rates. Paper presented at theannual meeting of the Academy of Management,New Orleans.
Gerhart, B. 1990. Voluntary turnover and alternative jobopportunities. Journal of Applied Psychology, 75:467–476.
Glebbeek, A. C., & Bax, E. H. 2004. Is high employeeturnover really harmful? An empirical test usingcompany records. Academy of Management Jour-nal, 47: 277–286.
Gottfredson, L. S. 1986. Societal consequences of the gfactor in employment. Journal of Vocational Behav-ior, 29: 379–410.
Griffeth, R. W., & Hom, P. W. 1988. A comparison ofdifferent conceptualizations of perceived alternativesin turnover research. Journal of Organizational Be-havior, 9: 103–111.
Griffeth, R. W., & Hom, P. W. 1995. The employee turn-over process. In G. R. Ferris (Ed.), Research in per-sonnel and human resources management, vol, 13:245–293. Greenwich, CT: JAI Press.
Griffeth, R. W., Hom, P. W., & Gaertner, S. 2000. A meta-analysis of antecedents and correlates of employeeturnover: Update, moderator tests, and research im-plications for the next millennium. Journal of Man-agement, 26: 463–488.
Griffeth, R. W., Steel, R. P., Allen, D. G., & Bryan, N. 2005.The development of a multidimensional measure ofjob market cognitions: The employment opportunityindex (EOI). Journal of Applied Psychology, 90:335–349.
Holtom, B. C., Mitchell, T. R., Lee, T. W., & Inderrieden,E. J. 2005. Shocks as causes of turnover: What theyare and how organizations can manage them. HumanResource Management, 44: 337–352.
Hom, P. W., Caranikas-Walker, F., Prussia, G. E., & Grif-feth, R. W. 1992. A meta-analytical structure equa-tions analysis of a model of employee turnover. Jour-nal of Applied Psychology, 77: 890–909.
2008 669Lee, Gerhart, Weller, and Trevor

Hom, P. W., & Griffeth, R. W. 1991. A structural equationmodel of the process of employee turnover: Cross-sectional and longitudinal tests. Journal of AppliedPsychology, 76: 350–366.
Hom, P. W., Griffeth, R. W., & Sellaro, C. L. 1984. Thevalidity of Mobley’s (1977) model of employee turn-over. Organizational Behavior and Human Perfor-mance, 34: 141–174.
Hom, P. W., & Kinicki, A. J. 2001. Toward a greaterunderstanding of how dissatisfaction drives em-ployee turnover. Academy of Management Journal,44: 975–87.
Hulin, C. L., Roznowski, M., & Hachiya, D. 1985. Alter-native opportunities and withdrawal decisions: Em-pirical and theoretical discrepancies and an integra-tion. Psychological Bulletin, 97: 233–250.
Judge, T. A., & Watanabe, S. 1995. Is the past prologue? Atest of Ghiselli’s hobo syndrome. Journal of Man-agement, 21: 211–229.
Kacmar, K. M., Andrews, M. C., Van Rooy, D. L., Steil-berg, R. C., & Cerrone, S. 2006. Sure everyone can bereplaced . . . but at what cost? Turnover as a predic-tor of unit-level performance. Academy of Manage-ment Journal, 48: 133–144.
Kahn, L. M., & Low, S. A. 1984. An empirical model ofemployed search, unemployed search, and non-search. Journal of Human Resources, 19: 104–117.
Kalbfleisch, J. D., & Prentice, R. L. 1980. The statisticalanalysis of failure time data. New York: Wiley.
Kammeyer-Mueller, J. D., Wanberg, C. R., Glomb, T. M., &Ahlburg, D. 2005. The role of temporal shifts inturnover processes: It’s about time. Journal of Ap-plied Psychology, 90: 644–658.
Lee, T. W., & Maurer, S. D. 1999. The effects of familystructure on organizational commitment, intentionto leave and voluntary turnover. Journal of Mana-gerial Issues, 11: 493–513.
Lee, T. W., & Mitchell, T. R. 1994. An alternative ap-proach: The unfolding model of voluntary employeeturnover. Academy of Management Review, 19:51–89.
Lee, T. W., Mitchell, T. R., Holtom, B. C., McDaniel, L. S.,& Hill, J. W. 1999. The unfolding model of voluntaryturnover: A replication and extension. Academy ofManagement Journal, 42: 450–62.
Lee, T. W., Mitchell, T. R., Wise, L., & Fireman, S. 1996.An unfolding model of voluntary employee turn-over. Academy of Management Journal, 39: 5–36.
Maddala, G. S. 1983. Limited-dependent and qualita-tive variables in econometrics. Cambridge, U.K.:Cambridge University Press.
Maertz, C. P., & Campion, M. A. 2004. Profiles in quitting:Integrating process and content turnover theory.Academy of Management Journal, 47: 566–582.
March, J. G., & Simon, H. A. 1958. Organizations. NewYork: Wiley.
Mattila, J. P. 1974. Job quitting and frictional unemploy-ment. American Economic Review, 64: 235–239.
Mitchell, T. R., Holtom, B. C., & Lee, T. W. 2001. How tokeep your best employees: Developing an effectiveretention policy. Academy of Management Execu-tive, 15(4): 96–108.
Mobley, W. H. 1977. Intermediate linkages in the rela-tionship between job satisfaction and employeeturnover. Journal of Applied Psychology, 62: 237–240.
Mobley, W. H., Griffeth, R. W., Hand, H. H., & Meglino,B. M. 1979. Review and conceptual analysis of theemployee turnover process. Psychological Bulletin,86: 493–522.
Morita, J. G., Lee, T. W., & Mowday, R. T. 1989. Intro-ducing survival analysis to organization researchers:A selected application to turnover research. Journalof Applied Psychology, 74: 280–292.
Morita, J. G., Lee, T. W., & Mowday, R. T. 1993. Theregression-analog to survival analysis: A selectedapplication to turnover research. Academy of Man-agement Journal, 36: 1430–1464.
Muchinsky, P. M., & Morrow, P. 1980. A multidisci-plinary model of voluntary employee turnover. Jour-nal of Vocational Behavior, 17: 263–290.
Narendranathan, W., & Stewart, M. B. 1991. Simplemethods for testing for the proportionality of cause-specific hazards in competing risks models. OxfordBulletin of Economics and Statistics, 53: 331–340.
Parsons, D. O. 1973. Quit rates over time: A search andinformation approach. American Economic Review,63: 390–401.
Price, J. L. 1977. The study of turnover. Ames: Iowa StateUniversity Press.
Rynes, S. L., Orlitsky, M. O., & Bretz, R. D. 1997. Expe-rienced hiring versus college recruiting: Practicesand emerging trends. Personnel Psychology, 50:309–339.
Scarpello, V., & Campbell, J. P. 1983. Job satisfaction: Areall the parts there? Personnel Psychology, 36: 577–600.
Schemper, M. 1992. Further results for explained varia-tion in proportional hazards regression. Biometrika,79: 202–204.
Shaw, J. D., Gupta, N., & Delery, J. E. 2005. Alternativeconceptualizations of the relationship between vol-untary turnover and organizational performance.Academy of Management Journal, 48: 50–68.
Steel, R. P. 2002. Turnover theory at the empirical inter-face: Problems of fit and function. Academy of Man-agement Review, 27: 346–350.
Steel, R. P., & Griffeth, R. W. 1989. The elusive relation-ship between perceived employment opportunity
670 AugustAcademy of Management Journal

and turnover behavior: A methodological or concep-tual artifact? Journal of Applied Psychology, 74:846–854.
Steel, R. P., & Ovalle, N. K. 1984. A review and meta-analysis of research on the relationship between be-havioral intentions and employee turnover. Journalof Applied Psychology, 69: 673–686.
Sturman, M. C., & Trevor, C. O. 2001. The implicationsof linking the dynamic performance and turnoverliteratures. Journal of Applied Psychology, 86:684 – 696.
Tett, R. P., & Meyer, J. P. 1993. Job satisfaction, organi-zational commitment, turnover intention, and turn-over: Path analyses based on meta-analytic findings.Personnel Psychology, 46: 259–293.
Trevor, C. O. 2001. Interactions among actual ease-of-movement determinants and job satisfaction in theprediction of voluntary turnover. Academy of Man-agement Journal, 44: 621–638.
Trevor, C. O., Gerhart, B., & Boudreau, J. W. 1997.Voluntary turnover and job performance: Curvilin-earity and the moderating influences of salarygrowth and promotions. Journal of Applied Psy-chology, 82: 44 – 61.
Tuma, N. B. 1982. Nonparametric and partially paramet-ric approaches to event-history analysis. Sociologi-cal Methodology, 13: 1–60.
U.S. Bureau of Labor Statistics. 2004. Mother’s laborforce participation. Monthly Labor Review, 127(5):2.
Viscusi, W. K. 1980. Sex differences in worker quitting.Review of Economics and Statistics, 62: 388–398.
Wanous, J. P., Reichers, A. E., & Hudy, M. J. 1997. Overalljob satisfaction: How good are single item measures?Journal of Applied Psychology, 82: 247–252.
Yamaguchi, K. 1991. Event history analysis. NewburyPark, CA: Sage.
Tae Heon Lee ([email protected]) is an assistant profes-sor in the School of Business at North Carolina CentralUniversity. He received his Ph.D. in industrial relationsfrom the University of Wisconsin–Madison. His researchinterests include employee turnover, compensation, andhuman resource strategy.
Barry Gerhart ([email protected]) is a professor ofmanagement and human resources and the Bruce R.Ellig Distinguished Chair at the School of Business,University of Wisconsin–Madison. He received hisPh.D. in industrial relations from the University ofWisconsin–Madison. His research interests includecompensation, human resource strategy, internationalhuman resources, and employee movement.
Ingo Weller ([email protected]) is an assistantprofessor in the Department of Business and Economicsat the Freie Universitat Berlin. He received his Ph.D.from the International Institute for Management at theUniversity of Flensburg. His research interests includeemployee turnover, employee compensation practicesand motivation, and practices of knowledge transfer inmulti-unit firms.
Charlie O. Trevor ([email protected]) is an associ-ate professor in the Management and Human Re-sources Department at the University of Wisconsin–Madison. He earned his Ph.D. in industrial and laborrelations from Cornell University. His current researchinterests include employee compensation and volun-tary turnover.
2008 671Lee, Gerhart, Weller, and Trevor
