understanding the us butter market - dairy markets · 5/6/16 1 understanding the us butter market...
TRANSCRIPT

5/6/16
1
UnderstandingtheUSButterMarketChristianEdmistonDirector,SourcingandRiskManagement
April2016
Disclaimer
LandO’Lakes isnotmakinganyspecificorgeneralrecommendations aboutmarkets, riskmanagementpolicies,ortransactions.

5/6/16
2
LandO’LakesDairyFoodsRiskManager
60%ofthetime Iamrightevery time
Agenda
• About LandO’Lakes• International ButterFundamentals• USDemandFundamentals• USProduction• ClassIBFUsage• Implications

5/6/16
3
Ourbusinesstoday
Agricultureservices,cropinputs,
precisionagriculture
Animalnutritionandfeed
Dairyfoods
LandO’Lakes,Inc.overview
10,000employees
3,574individualmembers
826membercooperatives
300,000+agriculturalproducers
Serving 290U.S.facilities

5/6/16
4
LandO’Lakes,Inc.overview
largestmember-ownedcooperativeinU.S.
2nd
#199on Fortune500
50statesand60+countries
In
Source:ChicagoMercantileExchange,USAForeignAgriculturalService
US
NZEU
Millbs.QuarterlyAverages

5/6/16
5
0
200
400
600
800
1000
1200
1400
1600
1800
2000
2000
2001
2002
2003
2004
2005
2006
2007
2008
2009
2010
2011
2012
2013
2014
2015
Millionlbs.
USAnnualButterProduction
Source:USDA DairyProductsReport
0
2
4
6
8
10
12
14
16
1909
1916
1923
1930
1937
1944
1951
1958
1965
1972
1979
1986
1993
2000
2007
2014
PerCapitaConsumptionofFat
ButterMargarine
Source:USDA EconomicResearchService,IRi

5/6/16
6
18
13
11
10
9
8
6
6
5
0 5 10 15 20 25
France
Germany
Austria
Denmark
Australia
Finland
UnitedKingdom
Russia
UnitedStates
AnnualPerCapitaLbs
GlobalButterConsumptionTrends
Source:USDA, DairyAustralia,CanadianDairyInformationCentre
Source:OECD.org
12%15%15%
0%
5%
10%
15%
20%
25%
30%
35%
40%
AustriaGermanyFranceUnitedStates
ObesityRates35%
5/6/16
7
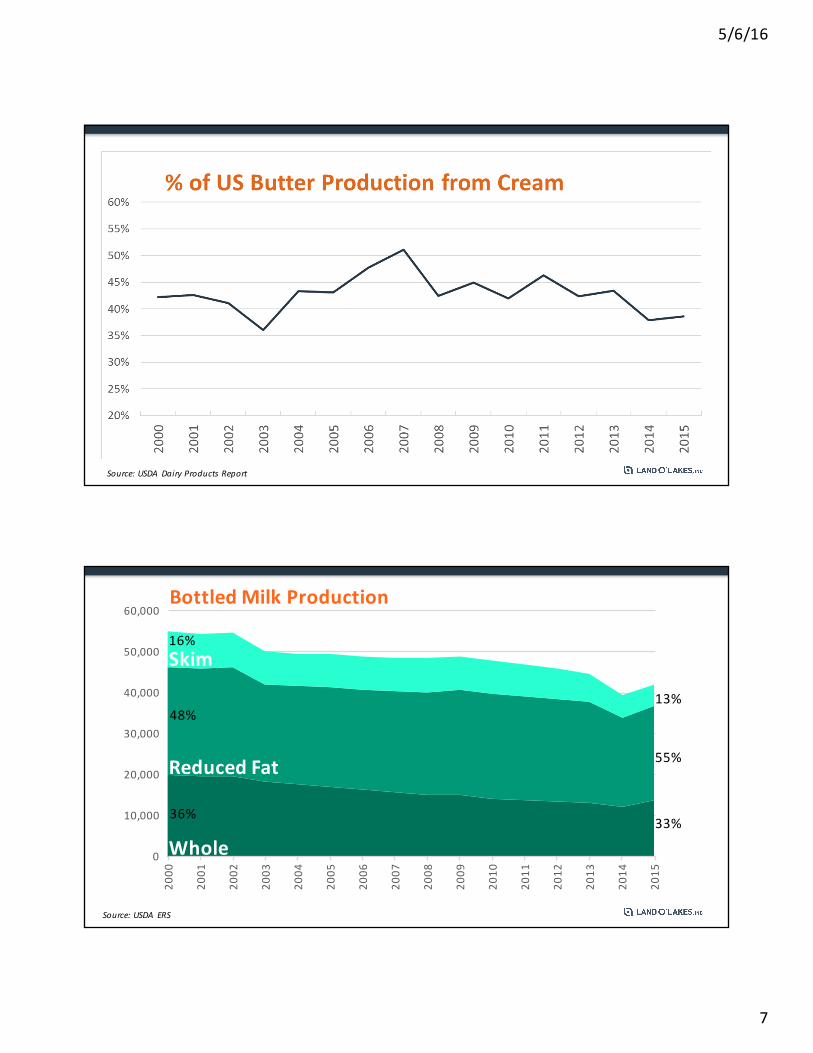
Source:USDA DairyProductsReport
ReducedFat
Whole0
10,000
20,000
30,000
40,000
50,000
60,000
2000
2001
2002
2003
2004
2005
2006
2007
2008
2009
2010
2011
2012
2013
2014
2015
BottledMilkProduction
Skim
ReducedFat
Whole
13%
33%
55%
16%
36%
48%
Source:USDA ERS

5/6/16
8
Source:USDA ERS
600
800
1000
1200
'00 '01 '02 '03 '04 '05 '06 '07 '08 '09 '10 '11 '12 '13 '14 '15
ButterfatinMilkDeliveredtoBottlers
Butterfat Utilized Butterfat Re-Supplied
Millbs.
Source:USDA DairyProductsReport

5/6/16
9
Conclusions• Developed countries tendtoexportprotein• HistoricallyUStradebalancehasbeensensitivetoglobalprices
• ButUSpriceshavebeenmainlydriven bydomesticmarkets
• Muchhigherpercapitabutterconsumption ispossible (EUdiet,UShistory)• ClassIproduction hasonly recently increased itscompetition forbutterfatsupply
Looking ahead
• Demand:• Willmorelow-fatmilkconsumersswitchtowholemilk?• Bigunknowns around extent ofUSbutterdemandgrowth
• Supply• Growthtrends infatyield inmilk• Manufacturingcapacity