understanding the role of residential addiction treatment for adolescent: an overview of...
TRANSCRIPT
Understanding the Role of Residential Addiction Treatment for Adolescent: An Overview of Characteristics, Services and Outcomes
Michael Dennis, Ph.D.Chestnut Health Systems, Bloomington, IL
January 10th, 2008 presentation at the Symposium on Adolescent Residential Alcohol and Drug Treatment, Cromwell, CT. This presentation reports on treatment & research funded by the Center for Substance Abuse Treatment (CSAT), Substance Abuse and Mental Health Services Administration (SAMHSA) under contract 270-2003-00006 and several individual grants. The opinions are those of the author and do not reflect official positions of the consortium or government. Available on line at www.chestnut.org/LI/Posters or by contacting Joan Unsicker at 720 West Chestnut, Bloomington, IL 61701, phone: (309) 827-6026, fax: (309) 829-4661, e-Mail: [email protected]
2
1. national trends in residential treatment for adolescents
2. how the clinical severity of adolescents varies by level of care
3. how the source of referral, length of stay, type of discharge, outcomes, and type of evidenced based practice varies by level of care
4. observational and experimental evidence on the impact of continuing care
5. the interaction of level of care and victimization
This presentation will examine..
3
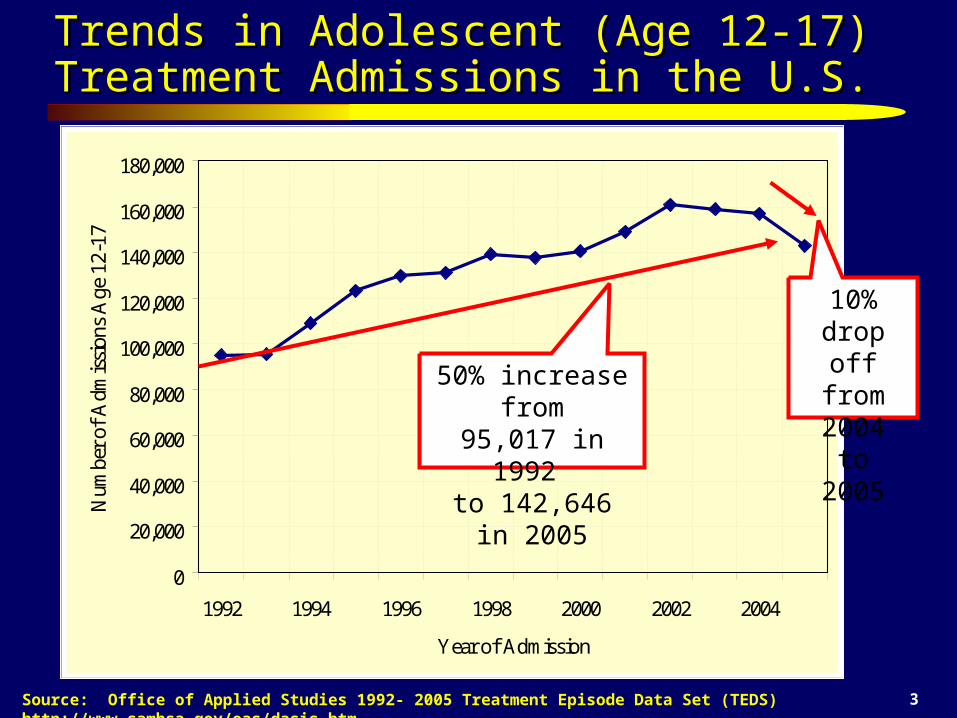
Trends in Adolescent (Age 12-17) Treatment Trends in Adolescent (Age 12-17) Treatment Admissions in the U.S.Admissions in the U.S.
Source: Office of Applied Studies 1992- 2005 Treatment Episode Data Set (TEDS) http://www.samhsa.gov/oas/dasis.htm
0
20,000
40,000
60,000
80,000
100,000
120,000
140,000
160,000
180,000
1992 1994 1996 1998 2000 2002 2004
Year of Admission
Num
ber
of A
dmis
sion
s A
ge 1
2-17
.
50% increase from95,017 in 1992
to 142,646 in 2005
10% drop off from 2004 to
2005
4
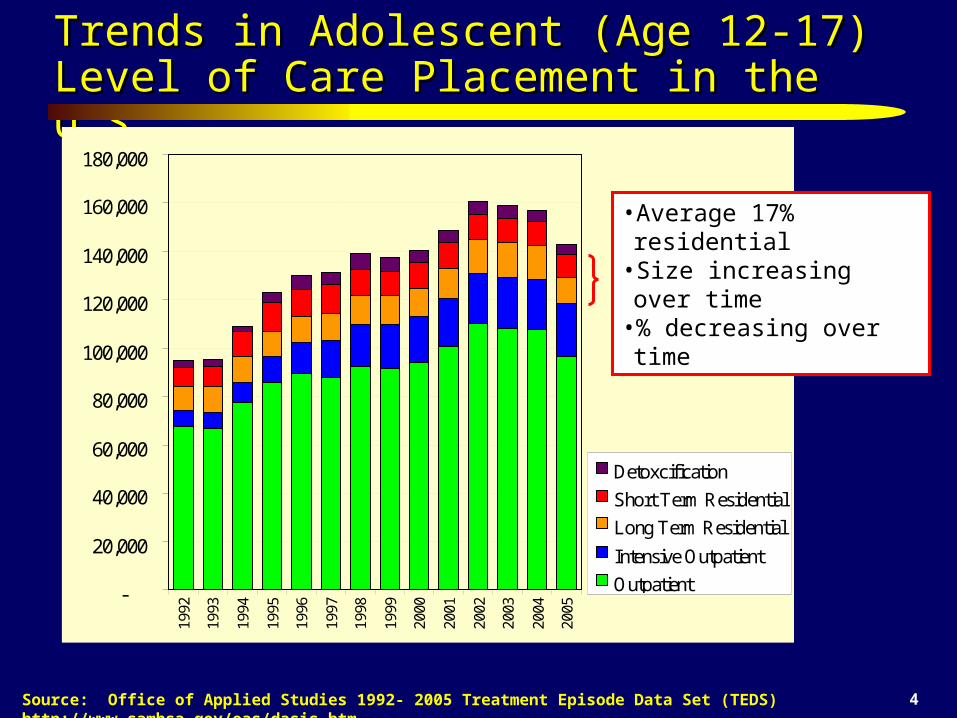
Trends in Adolescent (Age 12-17) Trends in Adolescent (Age 12-17) Level of Care Placement in the U.S.Level of Care Placement in the U.S.
Source: Office of Applied Studies 1992- 2005 Treatment Episode Data Set (TEDS) http://www.samhsa.gov/oas/dasis.htm
-
20,000
40,000
60,000
80,000
100,000
120,000
140,000
160,000
180,00019
92
1993
1994
1995
1996
1997
1998
1999
2000
2001
2002
2003
2004
2005
Detoxcification
Short Term Residential
Long Term Residential
Intensive Outpatient
Outpatient
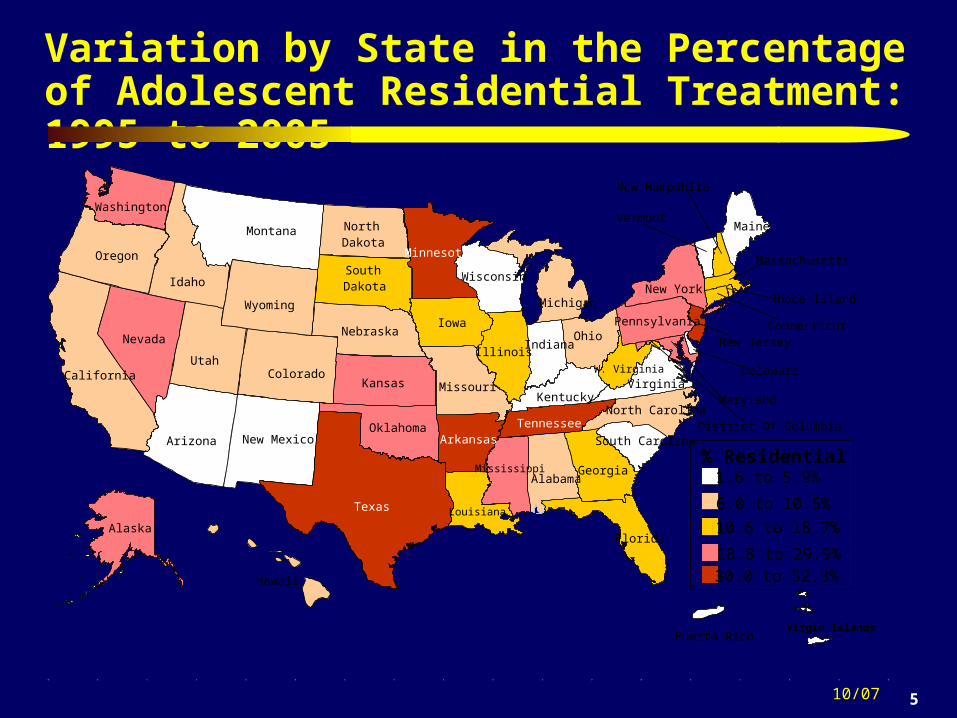
•Average 17% residential •Size increasing over time•% decreasing over time
5
Variation by State in the Percentage of Adolescent Residential Treatment: 1995 to 2005
10/07
Virgin Islands
1.6 to 5.9%
Indiana
Kansas
MaineMontana
NebraskaNevada
North Dakota
Puerto Rico
Hawaii
New Mexico
South Dakota
Alabama
Arkansas
Iowa
Oklahoma
Rhode Island
South CarolinaDistrict Of ColumbiaTennessee
Utah
Louisiana
W. Virginia
Minnesota
Wisconsin
New Jersey
North Carolina
Alaska
Delaware
Maryland
Pennsylvania
Georgia
KentuckyVirginia
MichiganNew York
Oregon
Colorado
Texas
New Hampshire
Connecticut
Illinois
Missouri
Arizona
Florida
Ohio
Vermont
Idaho
Massachusetts
California
Washington
Wyoming
% ResidentialMississippi
6.0 to 10.5%
10.6 to 18.7%
18.8 to 29.9%30.0 to 52.3%

6
Severity Goes up with Level of Care
Source: Treatment Episode Data Set (TEDS) 1993-2003.
0%
10%
20%
30%
40%
50%
60%
70%
80%
90%
100%
Weekly useat intake
First usedunder age 15
Dependence Prior Treatment
Case Mix Index (Avg)
Outpatient Intensive Outpatient DetoxificationLong-term Residential Short-term Residential
STR: Higher on
Dependence
Baseline Severity Goes up with Level
of CareDetox: Higher on Use
Detox: Higher on Use, but lower on prior tx
7
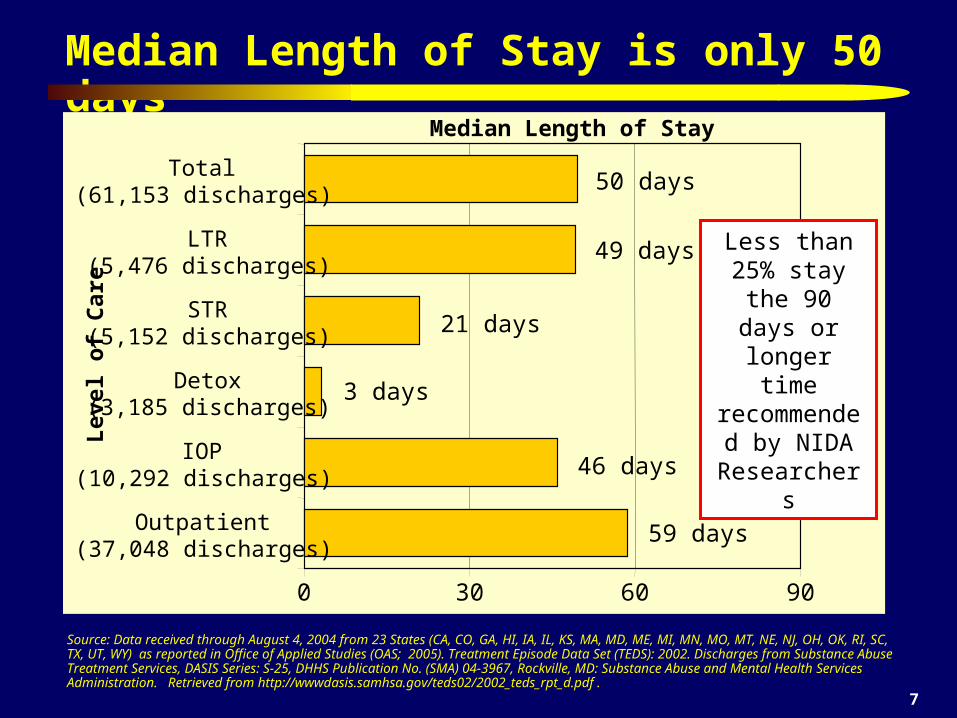
Median Length of Stay is only 50 days
Source: Data received through August 4, 2004 from 23 States (CA, CO, GA, HI, IA, IL, KS, MA, MD, ME, MI, MN, MO, MT, NE, NJ, OH, OK, RI, SC, TX, UT, WY) as reported in Office of Applied Studies (OAS; 2005). Treatment Episode Data Set (TEDS): 2002. Discharges from Substance Abuse Treatment Services, DASIS Series: S-25, DHHS Publication No. (SMA) 04-3967, Rockville, MD: Substance Abuse and Mental Health Services Administration. Retrieved from http://wwwdasis.samhsa.gov/teds02/2002_teds_rpt_d.pdf .
0 30 60 90
Outpatient(37,048 discharges)
IOP(10,292 discharges)
Detox(3,185 discharges)
STR(5,152 discharges)
LTR(5,476 discharges)
Total(61,153 discharges)
Lev
el o
f C
are
Median Length of Stay
50 days
49 days
46 days
59 days
21 days
3 days
Less than 25% stay the
90 days or longer time
recommended by NIDA
Researchers
8
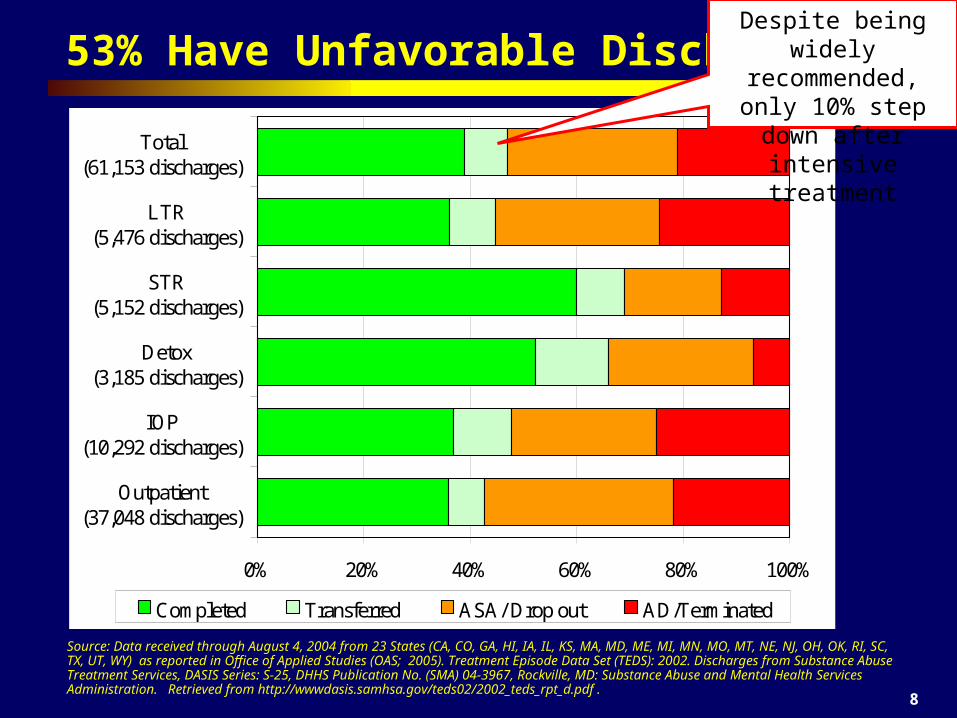
53% Have Unfavorable Discharges
Source: Data received through August 4, 2004 from 23 States (CA, CO, GA, HI, IA, IL, KS, MA, MD, ME, MI, MN, MO, MT, NE, NJ, OH, OK, RI, SC, TX, UT, WY) as reported in Office of Applied Studies (OAS; 2005). Treatment Episode Data Set (TEDS): 2002. Discharges from Substance Abuse Treatment Services, DASIS Series: S-25, DHHS Publication No. (SMA) 04-3967, Rockville, MD: Substance Abuse and Mental Health Services Administration. Retrieved from http://wwwdasis.samhsa.gov/teds02/2002_teds_rpt_d.pdf .
0% 20% 40% 60% 80% 100%
Outpatient(37,048 discharges)
IOP(10,292 discharges)
Detox(3,185 discharges)
STR(5,152 discharges)
LTR(5,476 discharges)
Total(61,153 discharges)
Completed Transferred ASA/ Drop out AD/Terminated
Despite being widely recommended, only 10% step down after intensive treatment
9
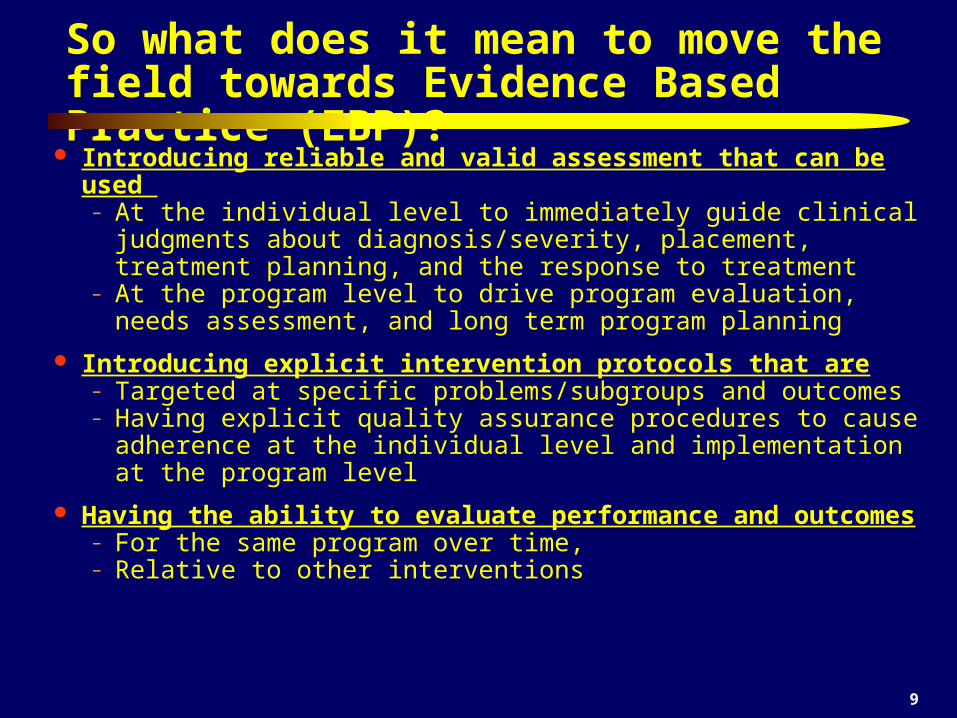
So what does it mean to move the field towards Evidence Based Practice (EBP)?
Introducing reliable and valid assessment that can be used – At the individual level to immediately guide clinical judgments
about diagnosis/severity, placement, treatment planning, and the response to treatment
– At the program level to drive program evaluation, needs assessment, and long term program planning
Introducing explicit intervention protocols that are– Targeted at specific problems/subgroups and outcomes– Having explicit quality assurance procedures to cause adherence
at the individual level and implementation at the program level
Having the ability to evaluate performance and outcomes – For the same program over time, – Relative to other interventions
10
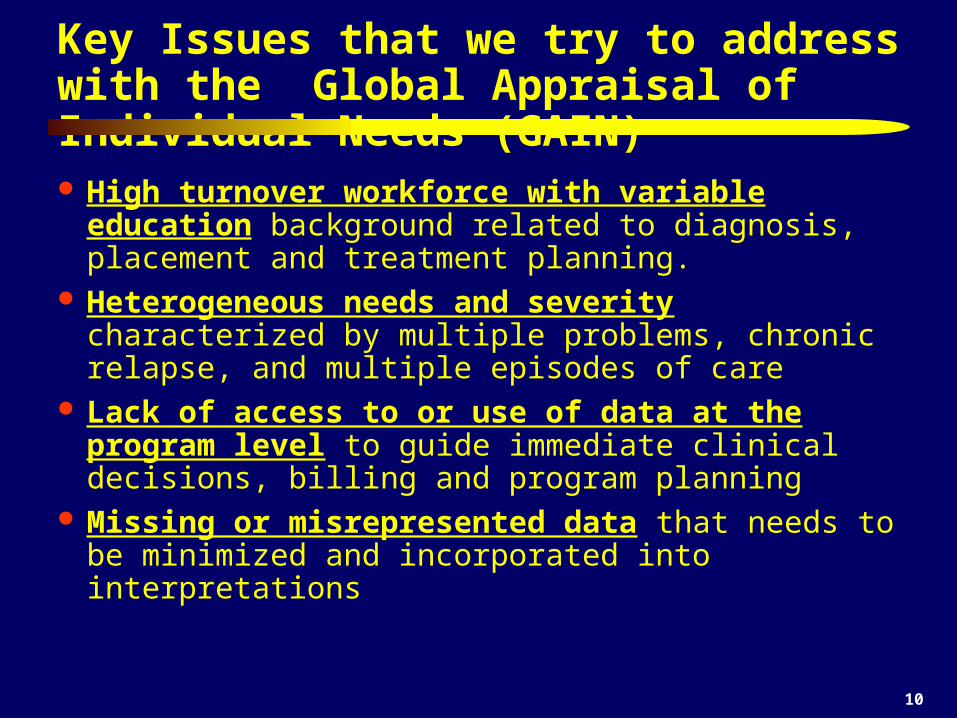
Key Issues that we try to address with the Global Appraisal of Individual Needs (GAIN)
High turnover workforce with variable education background related to diagnosis, placement and treatment planning.
Heterogeneous needs and severity characterized by multiple problems, chronic relapse, and multiple episodes of care
Lack of access to or use of data at the program level to guide immediate clinical decisions, billing and program planning
Missing or misrepresented data that needs to be minimized and incorporated into interpretations
11
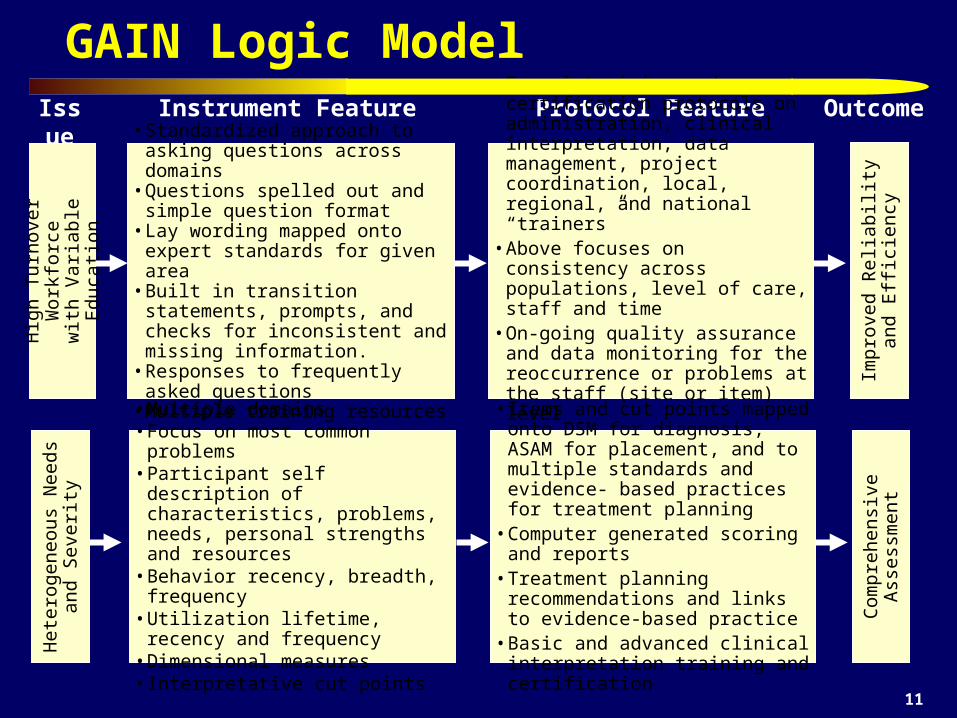
GAIN Logic ModelIssue Instrument Feature Protocol Feature Outcome
Hig
h T
urno
ver
Wor
kfor
cew
ith
Var
iabl
e E
duca
tion
• Standardized approach to asking questions across domains
• Questions spelled out and simple question format
• Lay wording mapped onto expert standards for given area
• Built in transition statements, prompts, and checks for inconsistent and missing information.
• Responses to frequently asked questions• Multiple training resources
• Formal training and certification protocols on administration, clinical interpretation, data management, project coordination, local, regional, and national “trainers”
• Above focuses on consistency across populations, level of care, staff and time
• On-going quality assurance and data monitoring for the reoccurrence or problems at the staff (site or item) level
• Availability of technical assistance
Impr
oved
Rel
iabi
lity
and
E
ffic
ienc
y
Het
erog
eneo
us N
eeds
an
d S
ever
ity
• Multiple domains• Focus on most common problems• Participant self description of
characteristics, problems, needs, personal strengths and resources
• Behavior recency, breadth, frequency• Utilization lifetime, recency and
frequency• Dimensional measures• Interpretative cut points
• Items and cut points mapped onto DSM for diagnosis, ASAM for placement, and to multiple standards and evidence- based practices for treatment planning
• Computer generated scoring and reports• Treatment planning recommendations
and links to evidence-based practice• Basic and advanced clinical
interpretation training and certification
Com
preh
ensi
ve A
sses
smen
t

12
GAIN Logic Model (continued)Issue Instrument Feature Protocol Feature Outcome
Mis
sing
or
Mis
repr
esen
ted
Dat
a
• Assurances, time anchoring, definitions, transition, and question order to reduce confusion and increase valid responses
• Cognitive impairment check• Validity checks on missing, bad,
inconsistency and unlikely responses• Validity checks for atypical and overly
random symptom presentations• Validity ratings by staff
• Training on optimizing clinical rapport• Training on time anchoring• Training answering questions, resolving
vague or inconsistent responses, following assessment protocol and accurate documentation.
• Utilization and documentation of other sources of information
• Post hoc checks for on-going site, staff or item problems
Impr
oved
Val
idit
y
Lac
k of
Acc
ess
to o
r us
e of
D
ata
at th
e P
rogr
am L
evel • Data immediately available to support
clinical decision making for a case• Data can be transferred to other clinical
information system to support billing, progress reports, treatment planning and on-going monitoring
• Data can be exported and cleaned to support further analyses
• Data can be pooled with other sites to facilitate comparison and evaluation
• PC and (soon) web based software applications and support
• Formal training and certification on using data at the individual level and data management at the program level
• Data routine pooled to support comparisons across programs and secondary analysis
• Over two dozen scientists working with data to link to evidence-based practice Im
prov
ed P
rogr
am P
lann
ing
and
Out
com
es
13
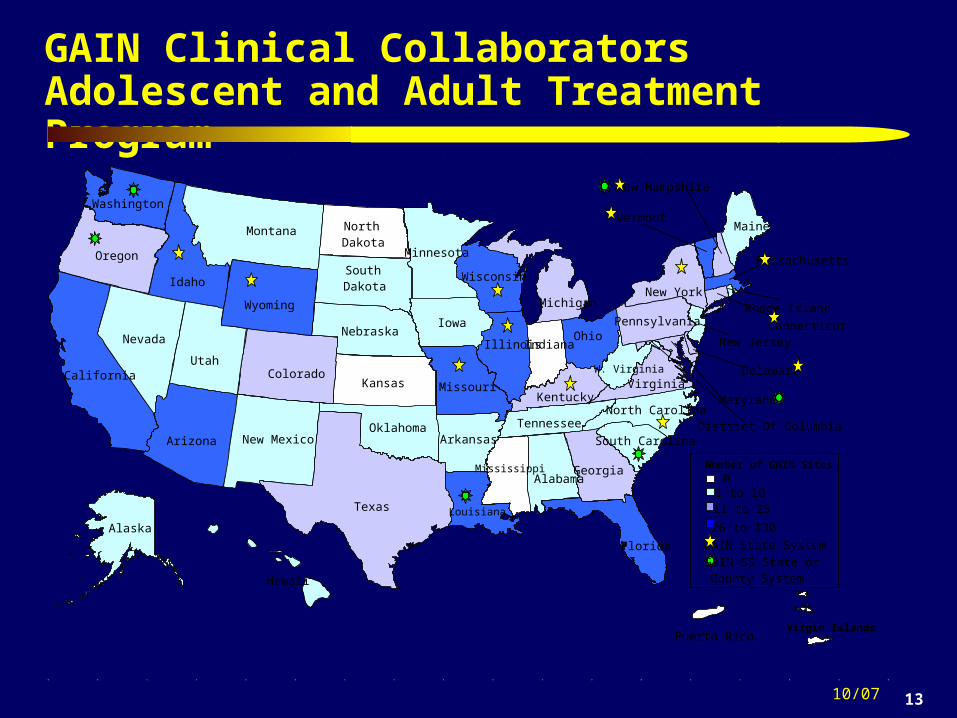
GAIN Clinical CollaboratorsAdolescent and Adult Treatment Program
10/07
GAIN State System
Virgin Islands
01 to 1011 to 25
26 to 130
Indiana
Kansas
MaineMontana
NebraskaNevada
North Dakota
Puerto Rico
Hawaii
New Mexico
South Dakota
Alabama
Arkansas
Iowa
Oklahoma
Rhode Island
South CarolinaDistrict Of ColumbiaTennessee
Utah
Louisiana
W. Virginia
Minnesota
Wisconsin
New Jersey
North Carolina
Alaska
Delaware
Maryland
Pennsylvania
Georgia
KentuckyVirginia
MichiganNew York
Oregon
Colorado
Texas
New Hampshire
Connecticut
Illinois
Missouri
Arizona
Florida
Ohio
Vermont
Idaho
Massachusetts
California
Washington
Wyoming
GAIN-SS State or County System
Number of GAIN SitesMississippi
14
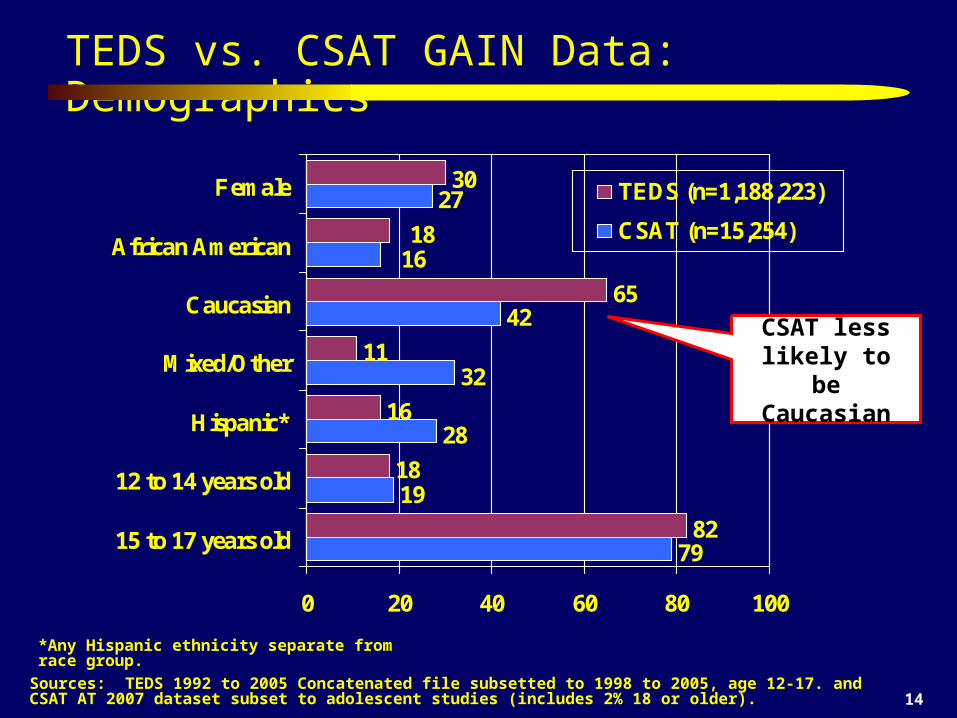
TEDS vs. CSAT GAIN Data: Demographics
*Any Hispanic ethnicity separate from race group.
Sources: TEDS 1992 to 2005 Concatenated file subsetted to 1998 to 2005, age 12-17. and CSAT AT 2007 dataset subset to adolescent studies (includes 2% 18 or older).
79
19
28
32
42
27
82
18
16
11
65
30
1618
0 20 40 60 80 100
15 to 17 years old
12 to 14 years old
Hispanic*
Mixed/Other
Caucasian
African American
Female TEDS (n=1,188,223)
CSAT (n=15,254)
CSAT less likely to be Caucasian
15
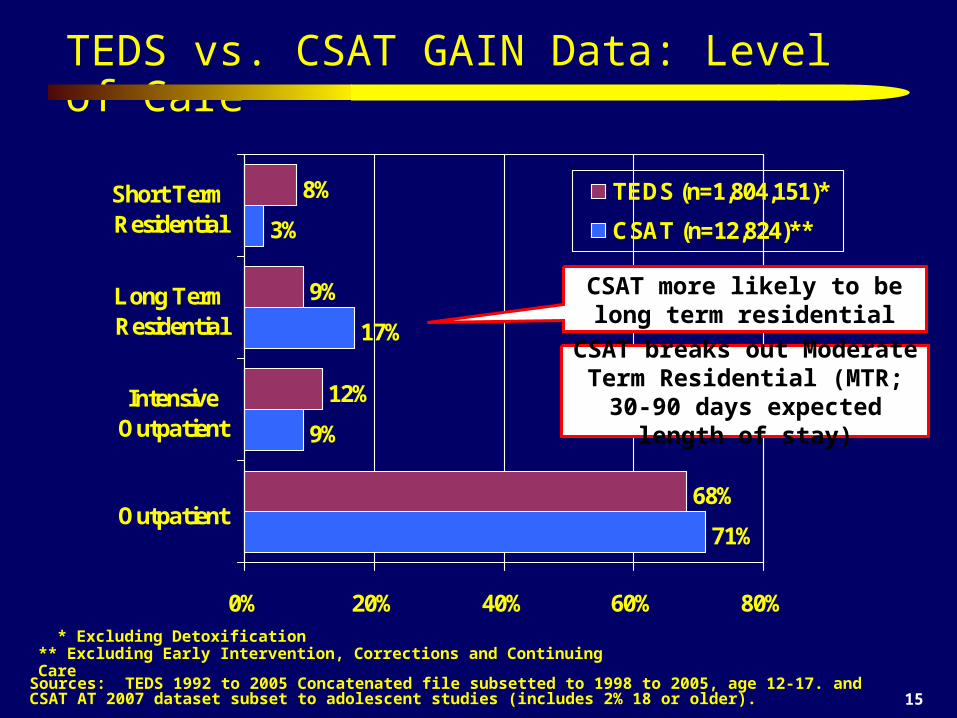
TEDS vs. CSAT GAIN Data: Level of Care
* Excluding Detoxification ** Excluding Early Intervention, Corrections and Continuing Care
Sources: TEDS 1992 to 2005 Concatenated file subsetted to 1998 to 2005, age 12-17. and CSAT AT 2007 dataset subset to adolescent studies (includes 2% 18 or older).
71%
9%
17%
3%
68%
12%
9%
8%
0% 20% 40% 60% 80%
Outpatient
IntensiveOutpatient
Long TermResidential
Short TermResidential
TEDS (n=1,804,151)*
CSAT (n=12,824)**
CSAT more likely to be long term residential
CSAT breaks out Moderate Term Residential (MTR; 30-90 days expected length of stay)
16
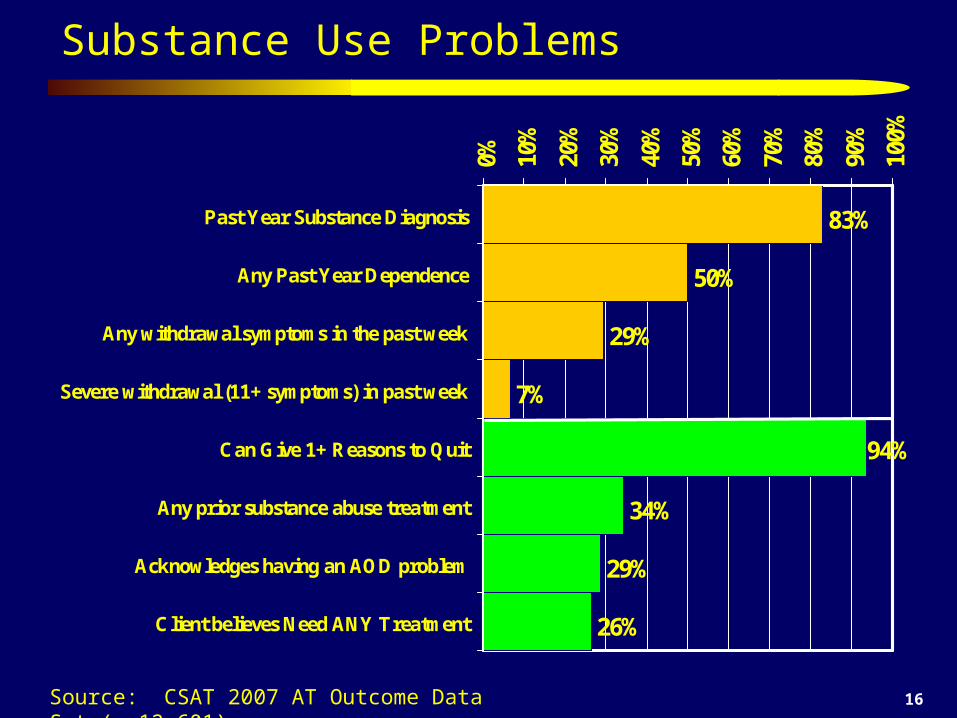
Substance Use Problems
83%
50%
29%
7%
34%
29%
26%
94%
0% 10%
20%
30%
40%
50%
60%
70%
80%
90%
100%
Past Year Substance Diagnosis
Any Past Year Dependence
Any withdrawal symptoms in the past week
Severe withdrawal (11+ symptoms) in past week
Can Give 1+ Reasons to Quit
Any prior substance abuse treatment
Acknowledges having an AOD problem
Client believes Need ANY Treatment
Source: CSAT 2007 AT Outcome Data Set (n=12,601)

17
Past Year Substance Severity by Level of Care
38%
57%
72% 75%86%
0%
10%
20%
30%
40%
50%
60%
70%
80%
90%
100%
Outpatient IOP LTR MTR STR
UseAbuseDependence
Source: CSAT 2007 AT Outcome Data Set (n=12,824)
18
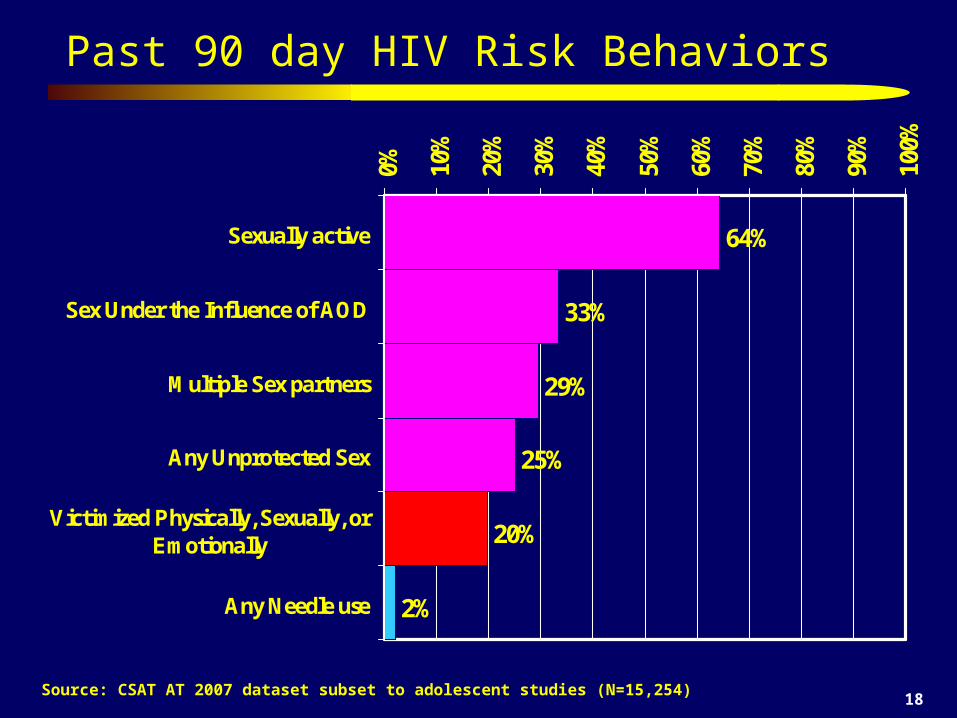
Past 90 day HIV Risk Behaviors
Source: CSAT AT 2007 dataset subset to adolescent studies (N=15,254)
64%
33%
29%
25%
20%
2%
0% 10%
20%
30%
40%
50%
60%
70%
80%
90%
100%
Sexually active
Sex Under the Influence of AOD
Multiple Sex partners
Any Unprotected Sex
Victimized Physically, Sexually, orEmotionally
Any Needle use
19
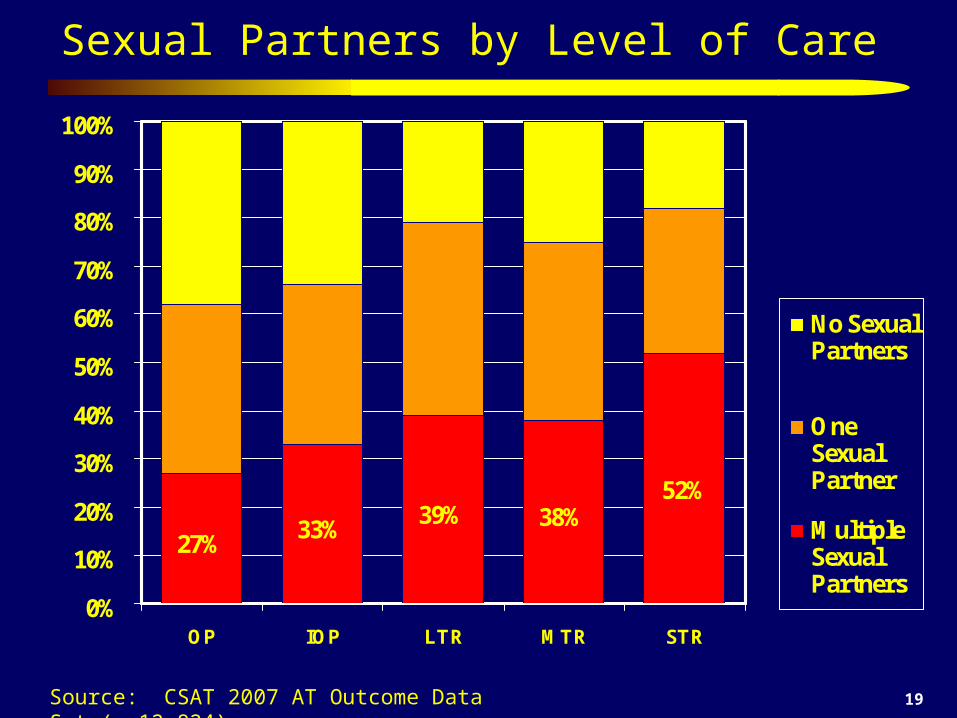
Sexual Partners by Level of Care
27%33%
39% 38%52%
0%
10%
20%
30%
40%
50%
60%
70%
80%
90%
100%
OP IOP LTR MTR STR
No SexualPartners
OneSexualPartner
MultipleSexualPartners
Source: CSAT 2007 AT Outcome Data Set (n=12,824)
20
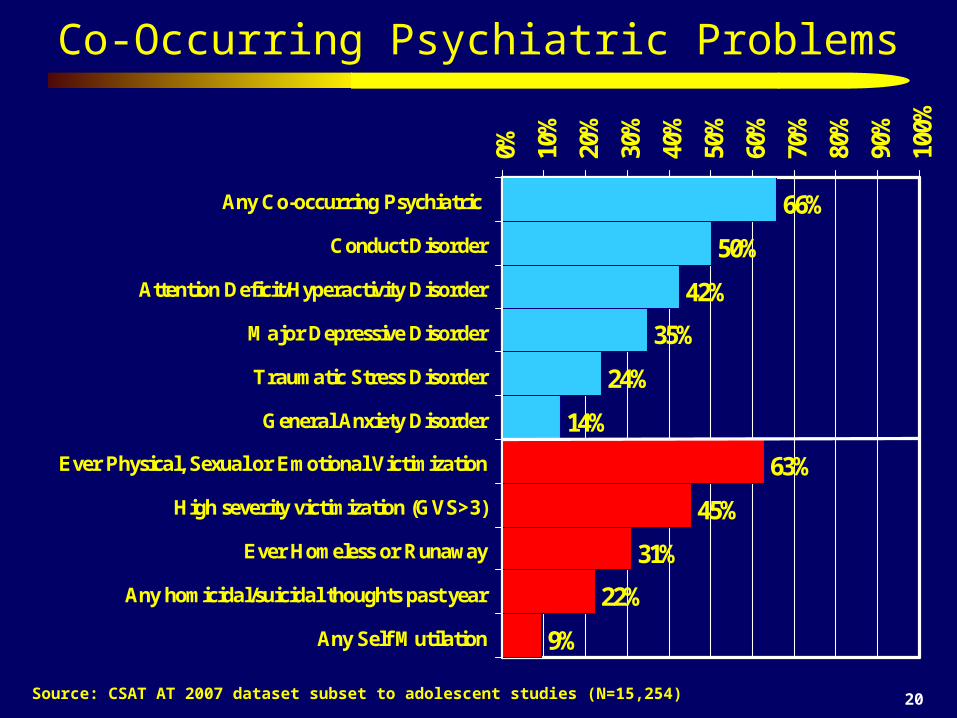
Co-Occurring Psychiatric Problems
Source: CSAT AT 2007 dataset subset to adolescent studies (N=15,254)
66%
50%
42%
35%
24%
14%
63%
45%
31%
22%
9%
0% 10%
20%
30%
40%
50%
60%
70%
80%
90%
100%
Any Co-occurring Psychiatric
Conduct Disorder
Attention Deficit/Hyperactivity Disorder
Major Depressive Disorder
Traumatic Stress Disorder
General Anxiety Disorder
Ever Physical, Sexual or Emotional Victimization
High severity victimization (GVS>3)
Ever Homeless or Runaway
Any homicidal/suicidal thoughts past year
Any Self Mutilation
21
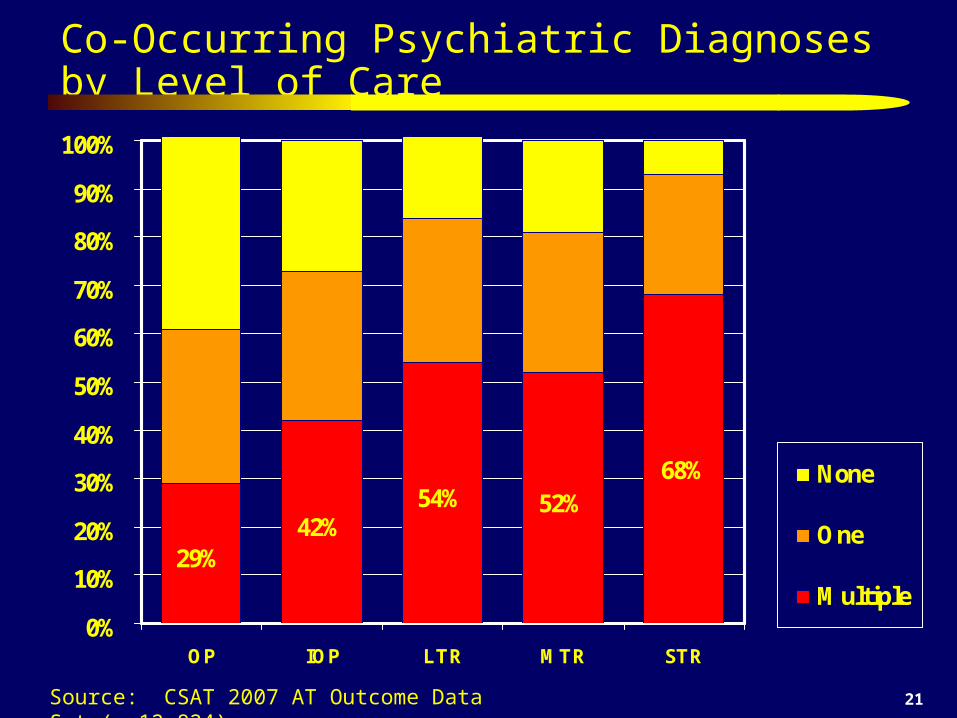
Co-Occurring Psychiatric Diagnoses by Level of Care
29%42%
54% 52%68%
0%
10%
20%
30%
40%
50%
60%
70%
80%
90%
100%
OP IOP LTR MTR STR
None
One
Multiple
Source: CSAT 2007 AT Outcome Data Set (n=12,824)

22
Severity of Victimization by Level of Care
38%
53%64% 59%
70%
0%
10%
20%
30%
40%
50%
60%
70%
80%
90%
100%
OP IOP LTR MTR STR
Low
Moderate
High
Source: CSAT 2007 AT Outcome Data Set (n=12,824)
23
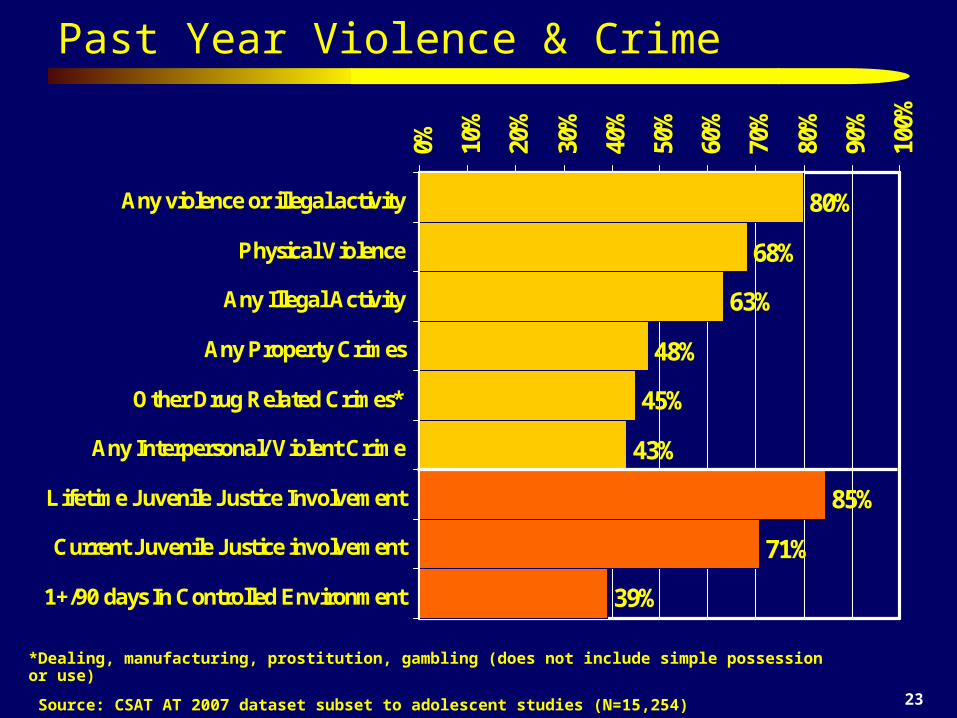
Past Year Violence & Crime
*Dealing, manufacturing, prostitution, gambling (does not include simple possession or use)
Source: CSAT AT 2007 dataset subset to adolescent studies (N=15,254)
80%
68%
63%
48%
45%
43%
85%
71%
39%
0% 10%
20%
30%
40%
50%
60%
70%
80%
90%
100%
Any violence or illegal activity
Physical Violence
Any Illegal Activity
Any Property Crimes
Other Drug Related Crimes*
Any Interpersonal/ Violent Crime
Lifetime Juvenile Justice Involvement
Current Juvenile Justice involvement
1+/90 days In Controlled Environment
24
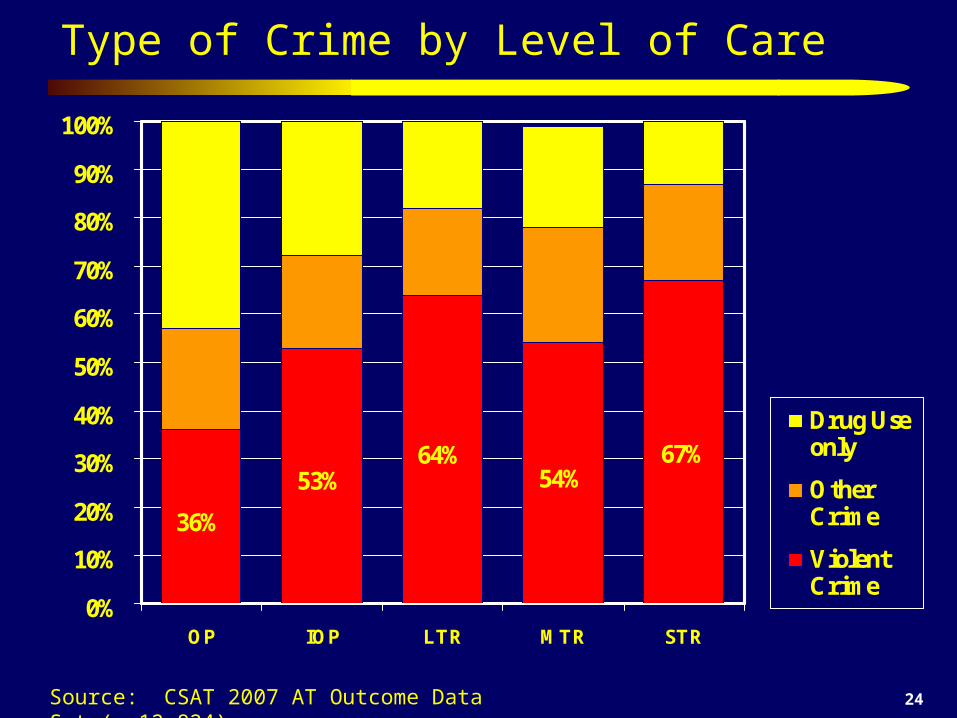
Type of Crime by Level of Care
36%
53%64%
54%67%
0%
10%
20%
30%
40%
50%
60%
70%
80%
90%
100%
OP IOP LTR MTR STR
Drug Useonly
OtherCrime
ViolentCrime
Source: CSAT 2007 AT Outcome Data Set (n=12,824)
25
Three
None
Five to Twelve
Four
Two
One
0%
10%
20%
30%
40%
50%
60%
70%
80%
90%
100%
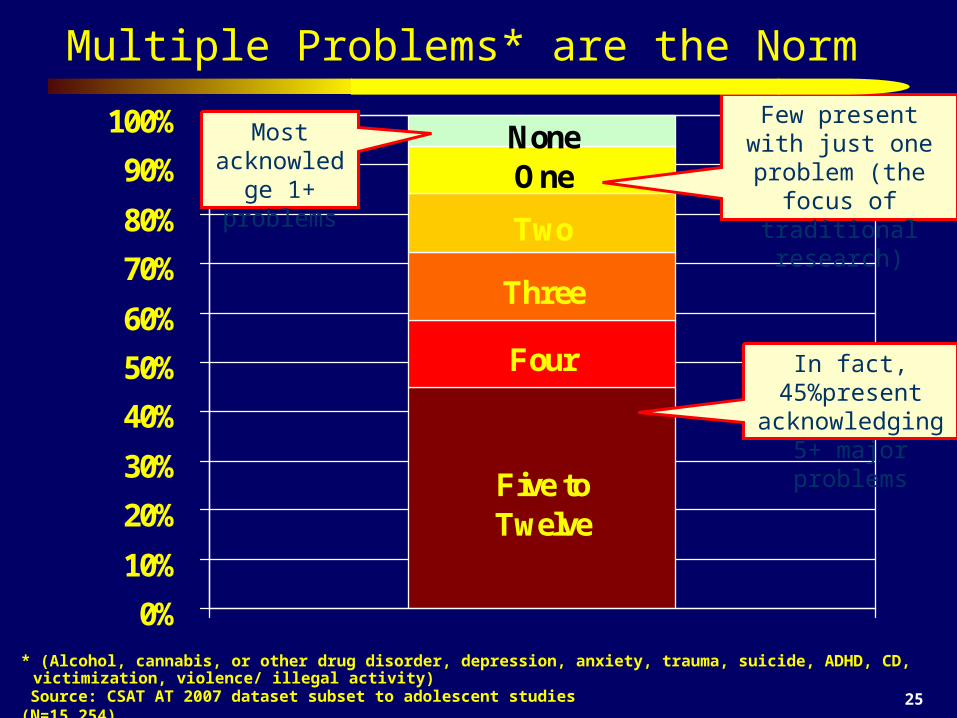
Multiple Problems* are the Norm
Source: CSAT AT 2007 dataset subset to adolescent studies (N=15,254)
Most acknowledge 1+ problems
Few present with just one problem (the
focus of traditional research)
In fact, 45%present acknowledging 5+
major problems
* (Alcohol, cannabis, or other drug disorder, depression, anxiety, trauma, suicide, ADHD, CD, victimization, violence/ illegal activity)
26
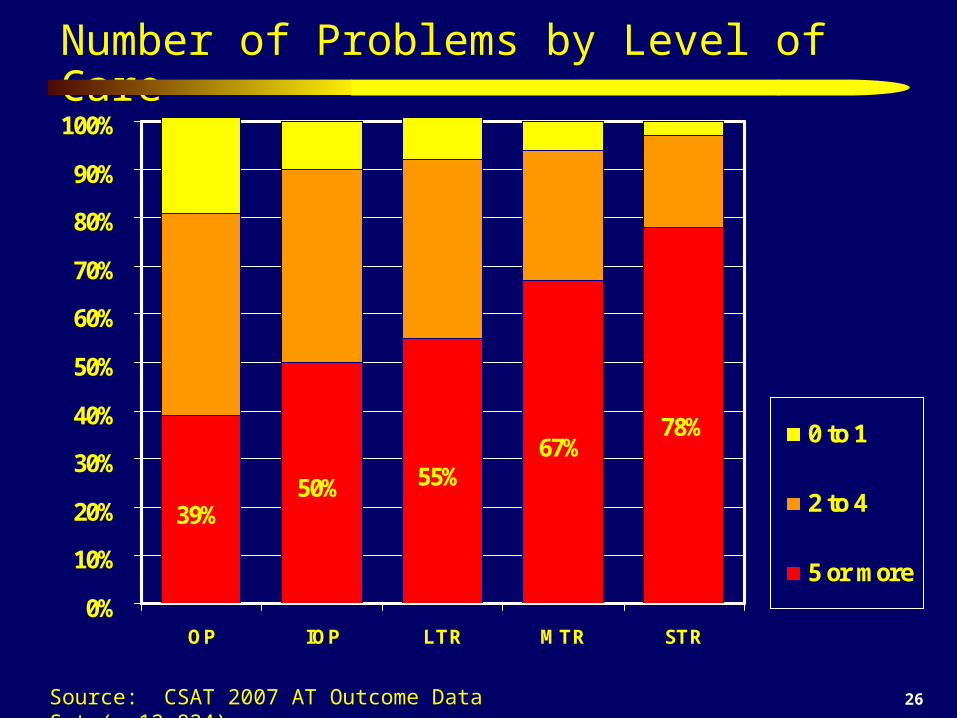
Number of Problems by Level of Care
39%50% 55%
67%78%
0%
10%
20%
30%
40%
50%
60%
70%
80%
90%
100%
OP IOP LTR MTR STR
0 to 1
2 to 4
5 or more
Source: CSAT 2007 AT Outcome Data Set (n=12,824)
27
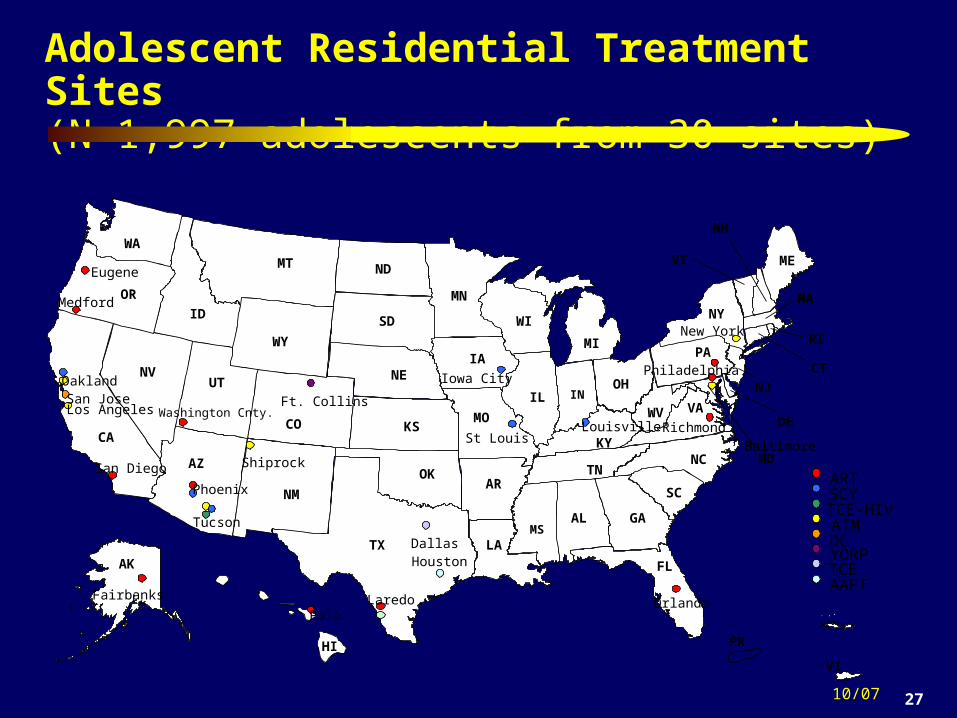
Adolescent Residential Treatment Sites (N=1,997 adolescents from 30 sites)
10/07
AL
AK
AZ
AR
CACO
CT
DE
FL
GA
HI
ID
IL IN
IA
KSKY
LA
ME
MD
MA
MI
MN
MS
MO
MT
NENV
NH
NJ
NM
NY
NC
ND
OH
OK
OR
PARI
SC
SD
TN
TX
UT
VT
VA
WA
WV
WI
WY
PR
VI
Baltimore
Dallas
Eugene
Fairbanks
Ft. Collins
Houston
Iowa City
Laredo
Los AngelesLouisville
Medford
New York
Oakland
OrlandoPaia
Philadelphia
Phoenix
Richmond
San Diego
San Jose
Shiprock
St Louis
Tucson
ARTSCYTCE-HIVATMDCYORPTCEAAFT
Washington Cnty.
28
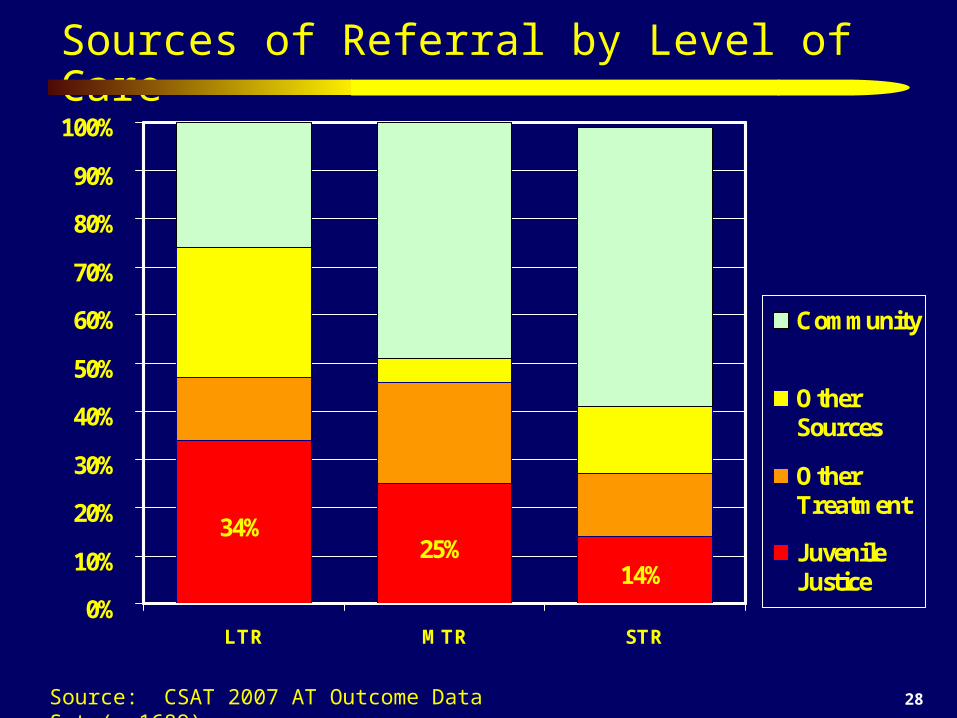
Sources of Referral by Level of Care
34%25%
14%0%
10%
20%
30%
40%
50%
60%
70%
80%
90%
100%
LTR MTR STR
Community
OtherSources
OtherTreatment
JuvenileJustice
Source: CSAT 2007 AT Outcome Data Set (n=1689)
29
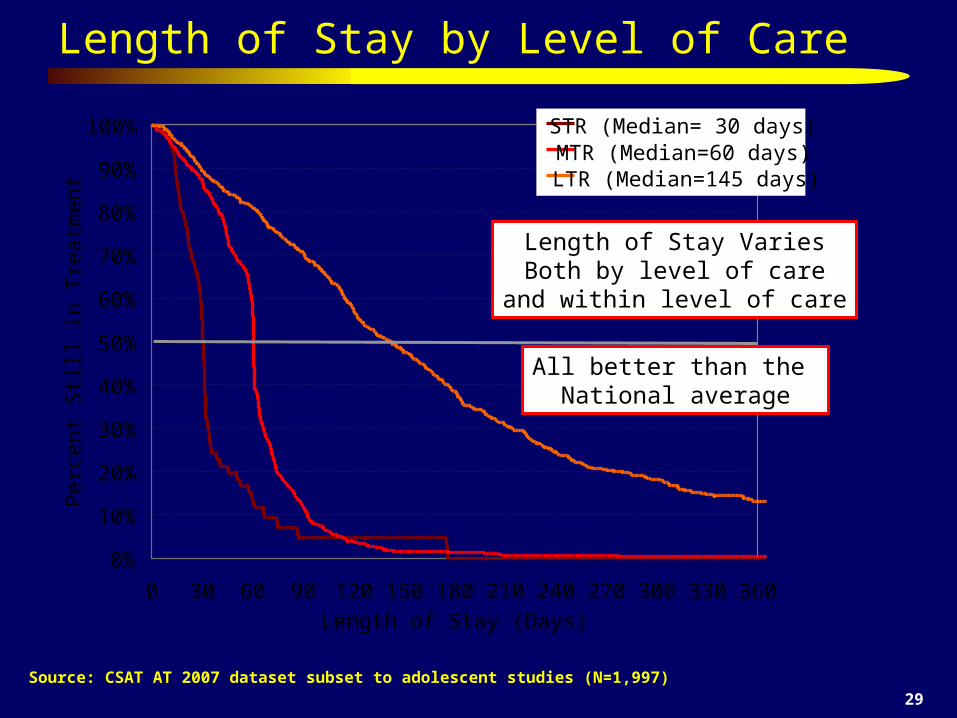
Length of Stay by Level of Care
Source: CSAT AT 2007 dataset subset to adolescent studies (N=1,997)
0%
10%
20%
30%
40%
50%
60%
70%
80%
90%
100%
0 30 60 90 120 150 180 210 240 270 300 330 360
Length of Stay (Days)
Per
cent
Sti
ll in
Tre
atm
ent
STR (Median= 30 days)MTR (Median=60 days)LTR (Median=145 days)
Length of Stay VariesBoth by level of care
and within level of care
All better than the National average
30
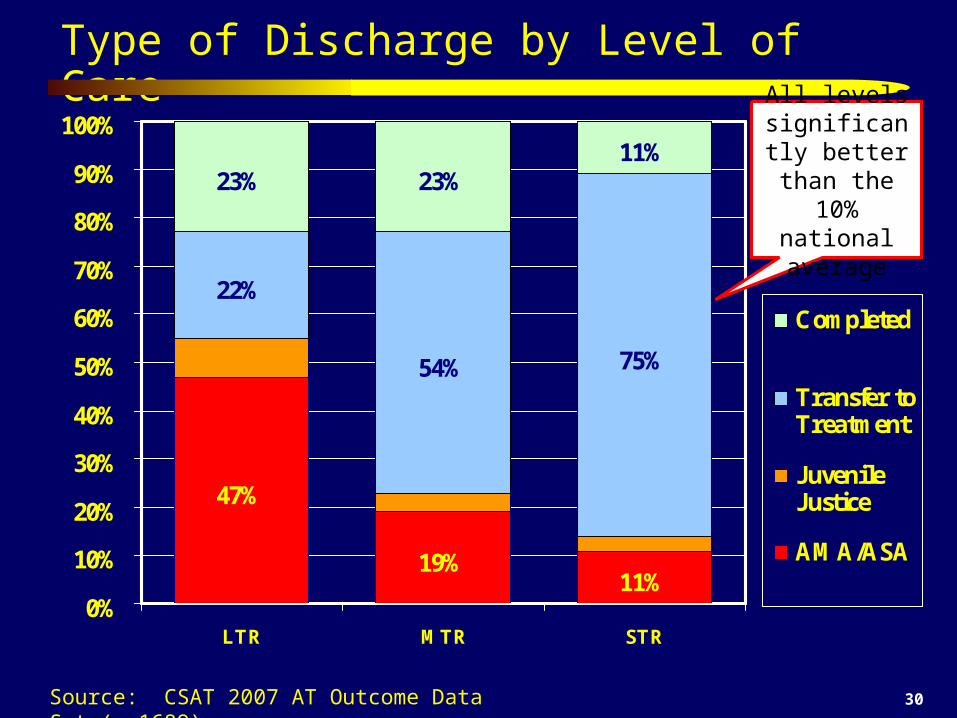
Type of Discharge by Level of Care
47%
19%11%
22%
54% 75%
23% 23%11%
0%
10%
20%
30%
40%
50%
60%
70%
80%
90%
100%
LTR MTR STR
Completed
Transfer toTreatment
JuvenileJustice
AMA/ASA
Source: CSAT 2007 AT Outcome Data Set (n=1689)
All levels significantly
better than the 10% national
average
31
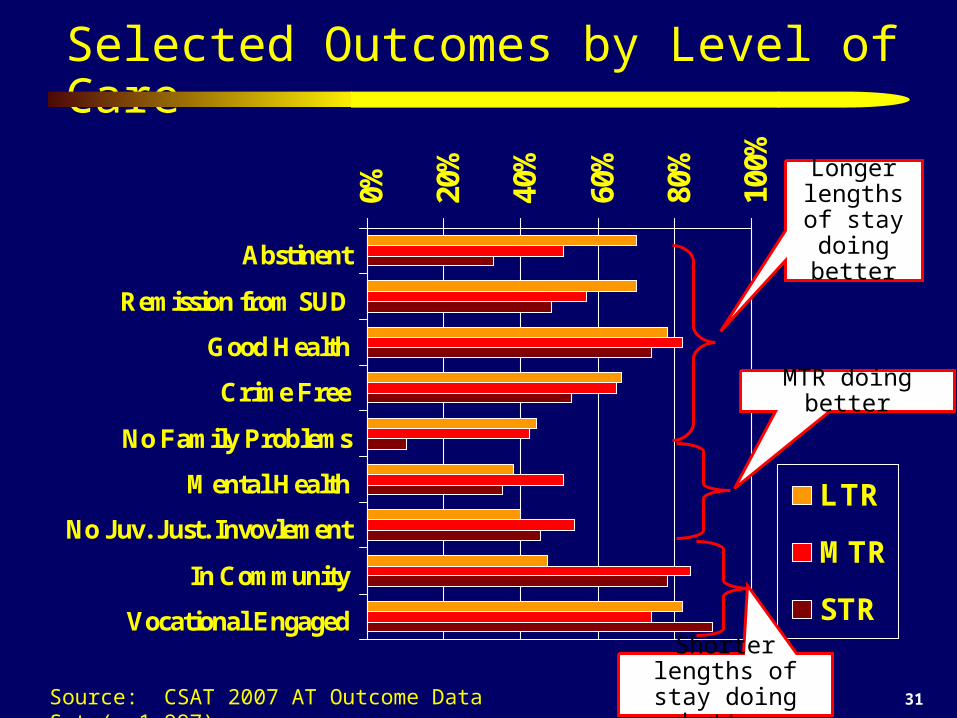
Selected Outcomes by Level of Care
0% 20%
40%
60%
80%
100%
Abstinent
Remission from SUD
Good Health
Crime Free
No Family Problems
Mental Health
No Juv. Just. Invovlement
In Community
Vocational Engaged
LTR
MTR
STR
Source: CSAT 2007 AT Outcome Data Set (n=1,997)
Longer lengths of stay doing
better
Shorter lengths of stay doing better
MTR doing better
32
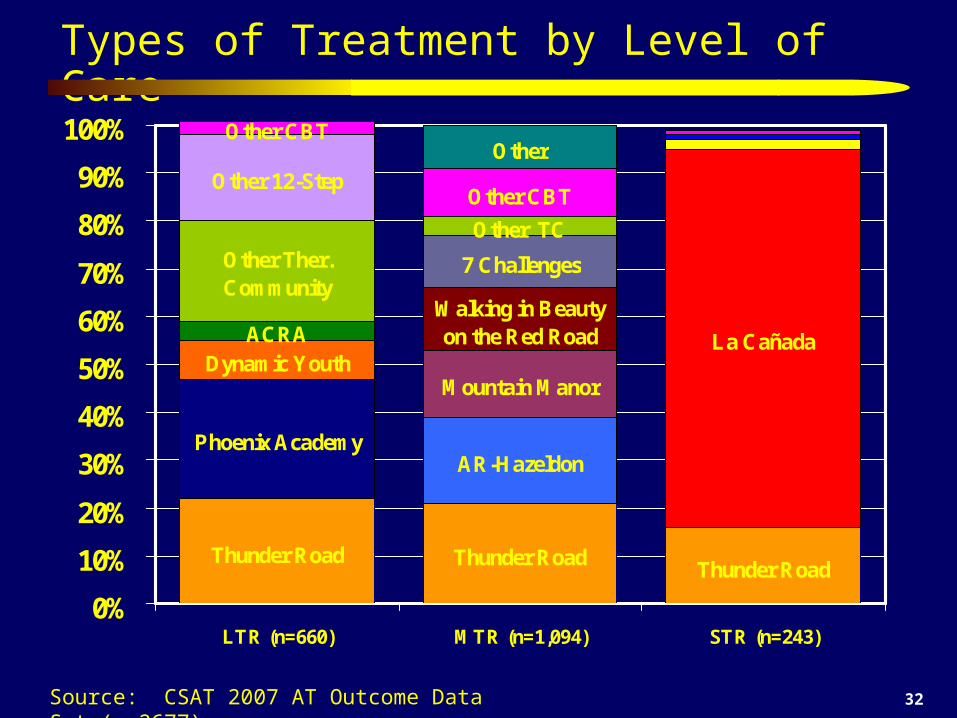
Types of Treatment by Level of Care
Thunder Road Thunder RoadThunder Road
Phoenix Academy
Other CBT
Dynamic YouthACRA
AR-Hazeldon
Mountain Manor
Walking in Beauty on the Red Road
7 Challenges
La Cañada
Other TCOther Ther. Community
Other 12-Step
Other CBTOther
0%
10%
20%
30%
40%
50%
60%
70%
80%
90%
100%
LTR (n=660) MTR (n=1,094) STR (n=243)
Source: CSAT 2007 AT Outcome Data Set (n=2677)
33
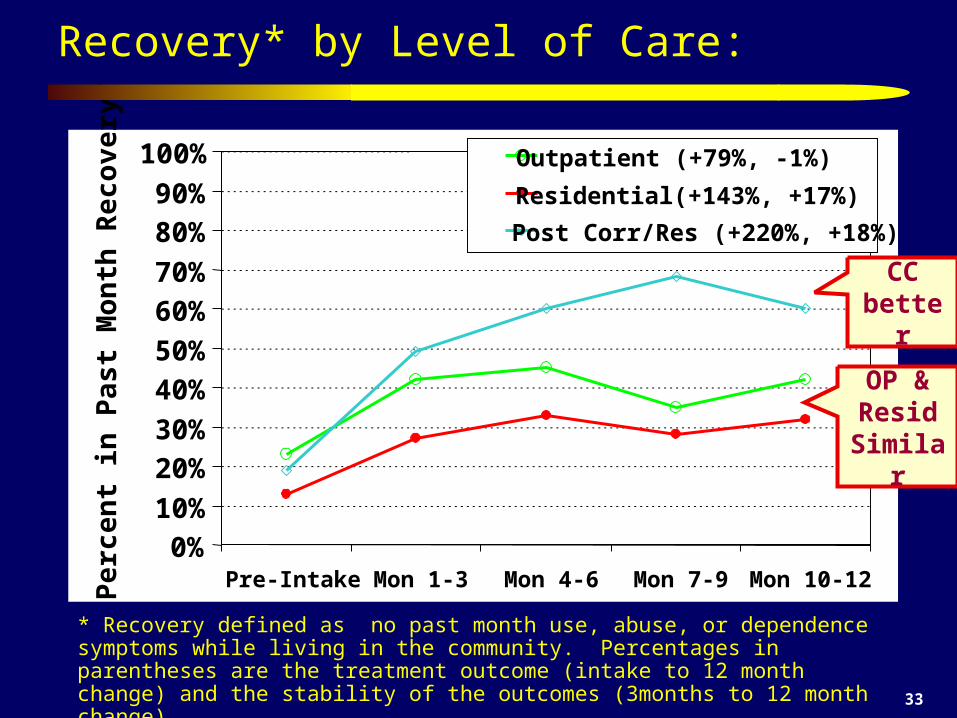
Recovery* by Level of Care:
* Recovery defined as no past month use, abuse, or dependence symptoms while living in the community. Percentages in parentheses are the treatment outcome (intake to 12 month change) and the stability of the outcomes (3months to 12 month change) Source: CSAT 2006 Adolescent Treatment Outcome Data Set (n-9,276)
0%
10%
20%
30%
40%
50%
60%
70%
80%
90%
100%
Pre-Intake Mon 1-3 Mon 4-6 Mon 7-9 Mon 10-12
Per
cent
in P
ast
Mon
th R
ecov
ery* Outpatient (+79%, -1%)
Residential(+143%, +17%)
Post Corr/Res (+220%, +18%)
OP & Resid
Similar
CC better
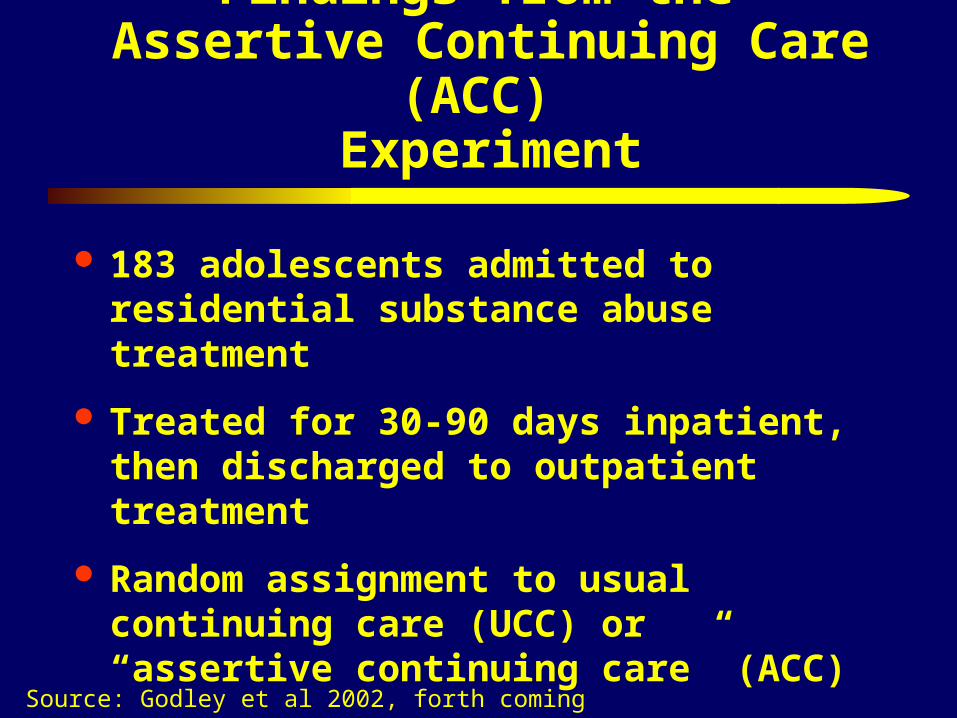
Findings from the Assertive Continuing Care (ACC)
Experiment
183 adolescents admitted to residential substance abuse treatment
Treated for 30-90 days inpatient, then discharged to outpatient treatment
Random assignment to usual continuing care (UCC) or “assertive continuing care” (ACC)
Over 90% follow-up 3, 6, & 9 months post discharge
Source: Godley et al 2002, forth coming
35
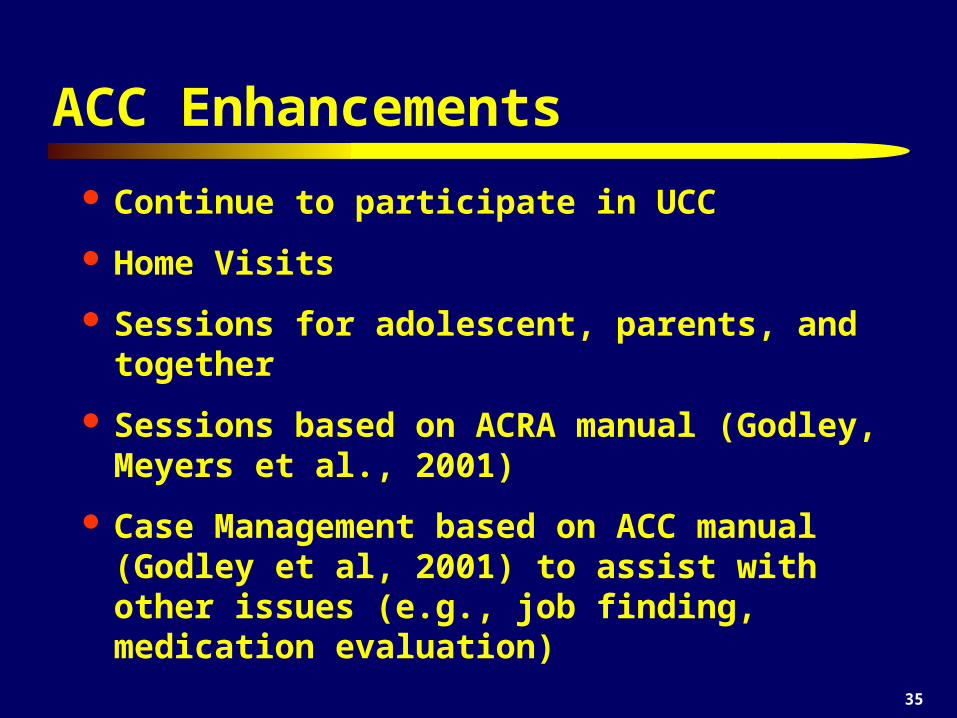
ACC Enhancements
Continue to participate in UCC
Home Visits
Sessions for adolescent, parents, and together
Sessions based on ACRA manual (Godley, Meyers et al., 2001)
Case Management based on ACC manual (Godley et al, 2001) to assist with other issues (e.g., job finding, medication evaluation)

36
Assertive Continuing Care (ACC)Hypotheses
Assertive Continuin
g Care
General Continuin
g Care Adherence
Relative to UCC, ACC will increase General Continuing Care Adherence (GCCA)
Early Abstinence
GCCA (whether due to UCC or ACC) will be associated with higher rates of early abstinence
Sustained Abstinence
Early abstinence will be associated with higher rates of long term abstinence.
37
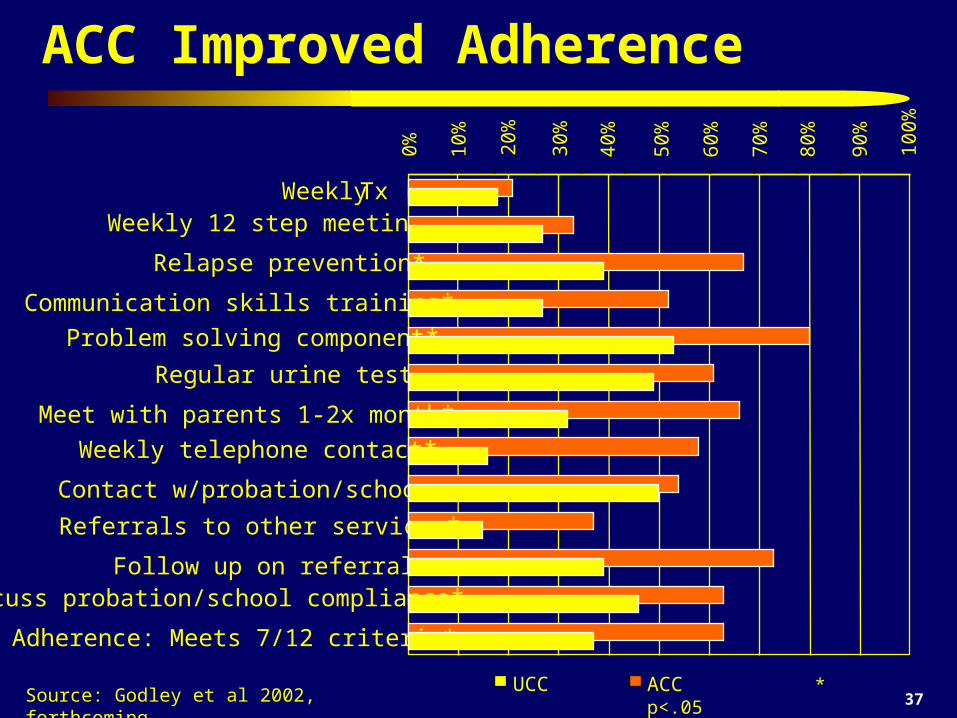
ACC Improved Adherence
Source: Godley et al 2002, forthcoming
0% 10%
20%
30%
40%
50%
60%
70%
80%
Weekly Tx Weekly 12 step meetings
Regular urine tests
Contact w/probation/school
Follow up on referrals*
ACC * p<.05
90%
100%
Relapse prevention*
Communication skills training*
Problem solving component*
Meet with parents 1-2x month*
Weekly telephone contact*
Referrals to other services*
Discuss probation/school compliance*
Adherence: Meets 7/12 criteria*
UCC
38
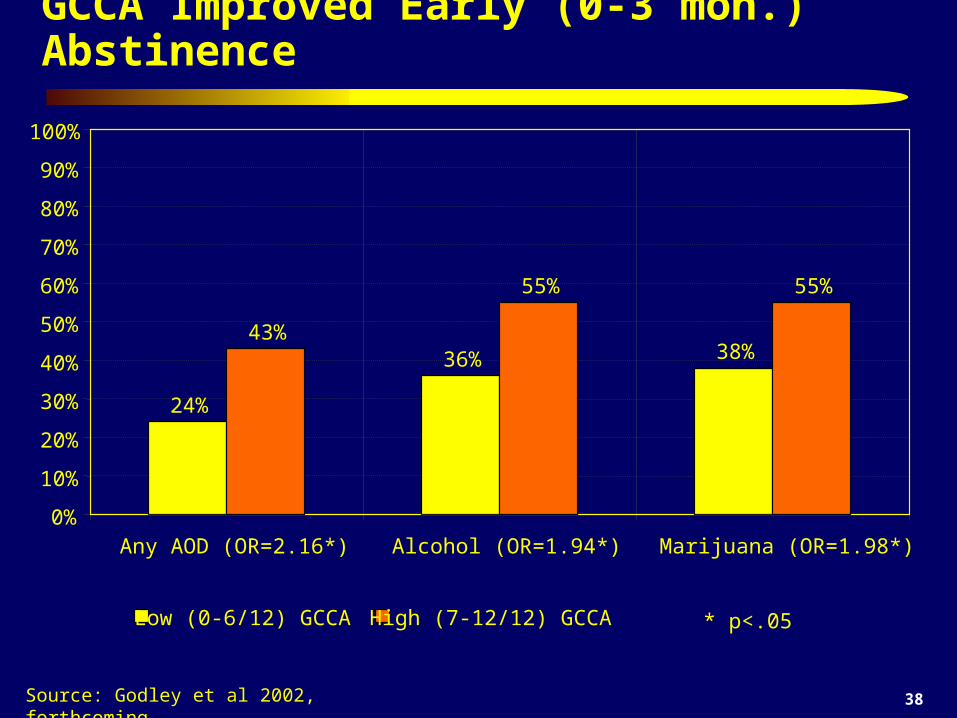
GCCA Improved Early (0-3 mon.) Abstinence
Source: Godley et al 2002, forthcoming
24%
36% 38%
0%
10%
20%
30%
40%
50%
60%
70%
80%
90%
100%
Any AOD (OR=2.16*) Alcohol (OR=1.94*) Marijuana (OR=1.98*)
Low (0-6/12) GCCA
43%
55% 55%
High (7-12/12) GCCA * p<.05
39
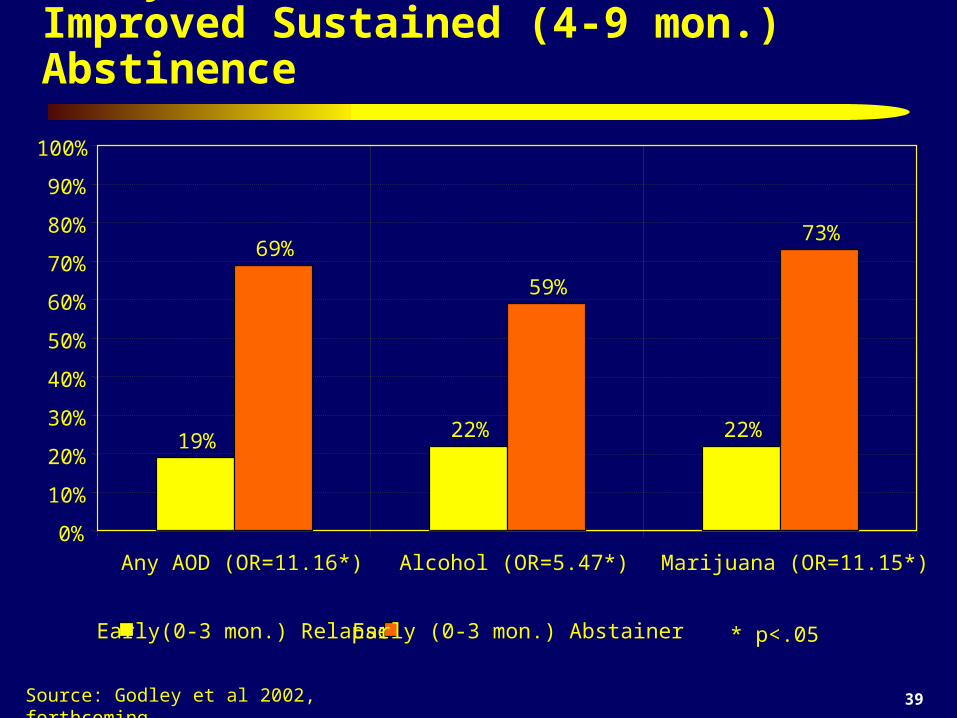
Early (0-3 mon.) Abstinence Improved Sustained (4-9 mon.) Abstinence
Source: Godley et al 2002, forthcoming
19% 22% 22%
0%
10%
20%
30%
40%
50%
60%
70%
80%
90%
100%
Any AOD (OR=11.16*) Alcohol (OR=5.47*) Marijuana (OR=11.15*)
Early(0-3 mon.) Relapse
69%
59%
73%
Early (0-3 mon.) Abstainer * p<.05
40
Some Concluding Thoughts…
Residential Treatment continues to play a critical role by targeting higher severity clients
Evidenced based practices are not panacea, but they pull up the bottom and improve average outcomes
Implementing continuing care improves average outcomes
More work is need on the use of schools and recovery schools as a location for continuing care after residential treatment.

41
Other Assessment and Treatment Resources
Assessment Instruments – GAIN Coordinating Center at www.chestnut.org/li/gain – CSAT TIP 3 at
http://www.athealth.com/practitioner/ceduc/health_tip31k.html – NIAAA Assessment Handbook at
http://www.niaaa.nih.gov/publications/instable.htm Treatment Programs
– CSAT CYT, ATM, ACC and other treatment manuals at www.chestnut.org/li/apss/csat/protocols and on CDs provided
– SAMHSA Knowledge Application Program (KAP) at http://kap.samhsa.gov/products/manuals
– NCADI at www.health.org – National Registry of Effective Prevention Programs
Substance Abuse and Mental Health Services Administration (SAMHSA), Department of Health and Human Services : http://www.modelprograms.samhsa.gov
Society for Adolescent Substance Abuse Treatment Effectiveness (SASATE) www.chestnut.org/li/apss/sasate
Joint Meeting on Adolescent Substance Abuse Treatment Effectiveness http://www.mayatech.com/cti/jmate/
– next meeting March 30-April 2, 2008, Washington, DC