understanding the role of lysine-specific demethylase … · understanding the role of...
TRANSCRIPT
1
UNDERSTANDING THE ROLE OF LYSINE-SPECIFIC
DEMETHYLASE 1 IN EMBRYONIC GENE REGULATION
by
Charles Thomas Foster MSc (Leicester)
Department of Biochemistry
University of Leicester
August 2011
Thesis submitted for the degree of
Doctor of Philosophy
at the University of Leicester
2
Abstract
Understanding the Role of Lysine-Specific Demethylase 1 in Embryonic Gene Regulation
Charles T Foster
Histone proteins provide a means of packaging DNA over 10,000-fold in order to allow
the accommodation of genetic material as chromatin in the nucleus of the cell.
However, the chemical manipulation of histones underpins an array of additional
biological functions of chromatin. The unstructured N-terminal tails of histones are
covalently modified in a variety of fashions, with many of these modifications
implicated in the regulation of gene expression. Lysine specific demethylase 1 (LSD1),
which demethylates mono- and di-methylated histone H3 lysine 4 (H3K4) as part of a
complex including CoREST and histone deacetylases (HDACs), is essential for
embryonic development in the mouse beyond embryonic day (E)6.5. The aim was to
determine the role of LSD1 during this early period of embryogenesis through
generation and analysis of conditional knockout mouse embryonic stem (ES) cells,
which are the in vitro counterpart of the epiblast. Prior analysis of post-implantation
loss-of-function genetrap embryos revealed that LSD1 expression, and therefore
function, is restricted to the epiblast. Conditional deletion of LSD1 in mouse ES cells
revealed a reduction in CoREST protein and associated HDAC activity, resulting in a
global increase in histone H3K9 and H3K56 acetylation, but only minor increases in
global H3K4 methylation. Despite this biochemical perturbation, LSD1 deleted ES cells
proliferate normally and retain stem cell characteristics. However, differentiation of
these ES cells is associated with significant cell death. Loss of LSD1 causes the
aberrant expression of 588 genes, including transcription factors with roles in
anterior/posterior patterning and tissue specification. Brachyury, a key-regulator of
mesodermal differentiation, is a direct target gene of LSD1 and is over-expressed in
E6.5 Lsd1 genetrap embryos. Thus, LSD1 regulates the expression and appropriate
timing of a key developmental regulator, as part of the LSD1/CoREST/HDAC complex,
during early embryonic development. Notably, rescue experiments show that the
catalytic activity of LSD1 is not required for gene repression and it is proposed that the
regulatory role of LSD1/CoREST/HDAC complex is governed by the ability to target
HDACs to genomic regions or to prevent promoter access of gene-activating
complexes with H3K4 tri-methylation catalytic activity.

3
Acknowledgements
Naturally there are many people I wish to thank for their support and guidance during
the course of my PhD. Firstly I would like to thank my supervisor, Dr Shaun Cowley,
who has provided me with this opportunity to contribute to scientific knowledge. I
must convey particular gratitude to Shaun for allowing me independence in exploring
certain avenues of investigation as well as encouraging me to independently attend
international conferences. Shaun has provided some fantastic insight and has always
been available for discussion, being true to his word when insisting that he likes to
keep the office door open. Oliver Dovey has been a pillar of support and inspiration
over the last 4 years. We embarked on our PhD studies around the same time, as the
lab was just establishing itself following Shaun’s arrival in Leicester. Oliver’s thorough
and professional attitude, combined with a realistic view of day to day life, has kept
me motivated throughout. He is beginning this writing up process as I finish and I wish
him all the best. Overall, being a part of this small research team of three (‘The HDAC
Army’) has been a very rewarding experience.
My mum, dad and sister have been unceasingly supportive; so I thank them for
everything they have done. I thank Vidya Ramesh for her love and comfort over last
few years, especially during the writing-up months. Alistair Ray has been a common
fixture in all of my residences in Leicester and provided the comedic antidote to the
occasional struggles in scientific research. Cheers Ali! I must also thank numerous
other friends I have made during the course of my studies; in the workplace, on the
cricket pitch and on the squash courts. I am also very grateful for the academic input
of Professors’ Ian Eperon and John Schwabe, who have seen me through the PhD
process as members of my thesis committee. Jivan Rees provided helped with proof-
reading, for which I am grateful. Finally I must acknowledge the guitar-work of Alexi
Laiho, which has provided the backing soundtrack each day of writing this thesis.

4
Contents
Chapter 1 Introduction .......................................................................................................... 12
1.1 Chromatin ................................................................................................................... 12
1.2 Histone modifications ................................................................................................ 15
1.3 Lysine methylation ..................................................................................................... 19
1.3.1 H3K4 methylation .......................................................................................... 21
1.3.2 H3K27 methylation ........................................................................................ 22
1.3.3 H3K9 methylation .......................................................................................... 25
1.3.4 H3K36 methylation ........................................................................................ 27
1.3.5 H4K20 methylation ........................................................................................ 28
1.4 Lysine demethylases (KDMs) .................................................................................... 29
1.4.1 Identification of KDMs ................................................................................... 29
1.4.2 Lysine-specific demethylase 1 (LSD1/KDM1A) .............................................. 34
1.4.2.1 Discovery .................................................................................................... 34
1.4.2.2 LSD1 knockout studies ............................................................................... 38
1.4.2.3 LSD1/CoREST function in transcriptional regulation ................................. 39
1.4.2.4 LSD1 function in other complexes ............................................................. 41
1.4.2.5 Non-histone targets of LSD1 ...................................................................... 42
1.5 Histone acetylation .................................................................................................... 44
1.5.1 Effects of acetylation ..................................................................................... 44
1.5.2 Histone Deacetylases ..................................................................................... 46
1.6 Class I HDAC repressor complexes ........................................................................... 50
1.6.1 Sin3 complex .................................................................................................. 50
1.6.2 NuRD complexes ............................................................................................ 52
1.6.3 CoREST complex ............................................................................................ 54
1.7 Crosstalk of histone modifications ........................................................................... 57
1.8 Mouse embryonic stem cells .................................................................................... 60
1.8.1 Origins and applications ................................................................................ 60
1.8.2 Maintenance of mouse ES cell pluripotency ................................................. 62
1.8.3 Core pluripotency factor network: Oct4, Nanog and Sox2 ........................... 64
1.8.4 An extended pluripotency regulatory network ............................................. 66
1.8.5 Molecular mechanisms in pre-gastrulation embryonic development .......... 68

5
1.8.6 In vitro differentiation of ES cells .................................................................. 70
1.8.7 Mesoderm development ............................................................................... 74
1.9 Chromatin state of pluripotent and differentiated ES cells .................................... 77
1.9.1 ES cell chromatin state .................................................................................. 77
1.9.2 Bivalent domains ........................................................................................... 78
1.9.3 Histone modification change upon ES cell differentiation ............................ 81
Chapter 2 Materials and Methods......................................................................................... 86
2.1 Chemicals and reagents ............................................................................................ 86
2.2 Generation of LSD1 knock out mouse ...................................................................... 86
2.3 Growth and maintenance of mouse ES cells ........................................................... 87
2.3.1 Culture of ES cells .......................................................................................... 87
2.3.2 Passage of ES cells by trypsinisation .............................................................. 87
2.3.3 Long term storage of ES cells ......................................................................... 88
2.3.3.1 Freezing in cryovials ................................................................................... 88
2.3.3.2 Freezing in 96-well plates .......................................................................... 88
2.3.4 Revival of cells from frozen aliquots ............................................................. 89
2.3.5 Extraction of DNA from ES cells ..................................................................... 89
2.3.5.1 Extraction in from cells in 96-well plates ................................................... 89
2.3.5.2 Extraction from cell pellets ........................................................................ 90
2.3.6 Extraction of RNA from ES cells and Embryoid bodies (EBs) ......................... 90
2.3.7 Media and reagents used for ES cells and EB manipulations ........................ 91
2.4 Polymerase Chain Reaction (PCR) ............................................................................ 94
2.5 Transfection of ES cells .............................................................................................. 95
2.5.1 Transfection of ES cells by electroporation ................................................... 95
2.5.2 Transfection of ES cells by lipofection ........................................................... 95
2.6 Generation of conditional LSD1 knock-out ES cell lines .......................................... 96
2.6.1 pCAGGs-Flpe vector transfection .................................................................. 96
2.6.2 ES cell colony screening ................................................................................. 96
2.6.2.1 Targeted ES cell colony growth and colony picking................................... 96
2.6.2.2 ‘HygTK’ cassette-removed ES cell growth and colony picking ................ 97
2.6.3 Deletion of exon 3 (3) from the targeted allele .......................................... 97
2.6.4 Genotyping of WT, Lox and 3 alleles by PCR ............................................... 98
2.6.5 Southern blotting to identify allelic genotypes ............................................. 98

6
2.6.5.1 Southern Blotting ....................................................................................... 98
2.6.5.2 Strategy for identification of the Lsd1 targeted clones ............................. 99
2.6.5.3 Strategy for identification of ‘HygTK’ cassette-removed clones............. 99
2.6.5.4 Strategy for identification of deletion of exon 3 ..................................... 100
2.6.5.5 Agarose gel electrophoresis for Southern blotting ................................. 100
2.6.5.6 DNA Transfer onto the nylon membrane ................................................ 101
2.6.5.7 DNA Probe labelling ................................................................................. 101
2.6.5.8 Hybridisation, washing and developing of the membrane ..................... 102
2.6.6 Analysis of LSD1 protein deletion ................................................................ 102
2.6.7 Growth curve analysis of ES cells ................................................................ 102
2.7 DNA methylation analysis by Southern Blot .......................................................... 104
2.7.1 Restriction digestion and gel electrophoresis ............................................. 104
2.8 Generation of Lsd1Lox/∆3 Mouse Embryonic Fibroblasts (MEFs) ........................... 105
2.9 ES cell in vitro differentiation analysis.................................................................... 106
2.9.1 Alkaline Phosphatase and Colony Formation Assays .................................. 106
2.9.2 Differentiation of ES cells as Embryoid Bodies ............................................ 107
2.9.3 Differentiation with Retinoic Acid ............................................................... 107
2.9.4 Differentiation in N2B27 media ................................................................... 108
2.10 Flow Cytometry ........................................................................................................ 109
2.10.1 Cell cycle analysis by propidium iodide (PI) staining ................................... 109
2.10.2 GFP analysis ................................................................................................. 109
2.11 Protein and enzymatic analysis............................................................................... 110
2.11.1 Immunoblotting ........................................................................................... 110
2.11.2 Immunoprecipitation ................................................................................... 110
2.11.3 In-House Histone Deacetylase assay ........................................................... 111
2.11.4 Histone extraction and modification analysis ............................................. 112
2.11.5 Protein stability assay .................................................................................. 113
2.11.6 Histone demethylase assay ......................................................................... 113
2.12 Reverse Transcription, Microarray Hybridisation and Quantitative Real-Time PCR
................................................................................................................................... 114
2.12.1 Reverse transcription................................................................................... 114
2.12.2 Illumina Microarray ..................................................................................... 114
2.12.2.1 Array hybridisation ............................................................................... 114

7
2.12.2.2 Illumina microarray quality control ..................................................... 116
2.12.2.3 Analysis of microarray hybridisation ................................................... 116
2.12.3 Quantitative Realtime PCR (qRT-PCR) for gene expression analyses .......... 117
2.13 Chromatin Immunoprecipitation ............................................................................ 118
2.13.1 Crosslinking of cells for chromatin immunoprecipitation ........................... 118
2.13.1.1 Double crosslinking .............................................................................. 118
2.13.1.2 Single crosslinking ................................................................................ 119
2.13.1.3 Cell extract preparation ....................................................................... 119
2.13.2 Sonication of cells using the Diagenode Bioruptor 200 .............................. 119
2.13.3 Immunoprecipitation ................................................................................... 120
2.13.4 Washing and processing of immunoprecipitated material ......................... 121
2.13.4.1 Washing and crosslink reversal ............................................................ 121
2.13.4.2 Digestion of protein and RNA and DNA purification ........................... 121
2.13.5 Buffers used in ChIP ..................................................................................... 122
2.13.6 PCR validation of histone antibodies for ChIP ............................................. 122
2.13.7 Validation of ChIP primers ........................................................................... 123
2.13.8 Quantitative RT-PCR for ChIP ...................................................................... 124
2.14 Molecular Biology and Engineering of DNA constructs ........................................ 126
2.14.1 Bacterial cultures ......................................................................................... 126
2.14.2 Storage and revival of bacterial strains ....................................................... 126
2.14.3 Culturing bacterial cells for miniprep and maxiprep ................................... 127
2.14.4 Plasmid purification from bacteria .............................................................. 127
2.14.5 Generation of EGFP-LSD1 fusions by PROTEX cloning service .................... 127
2.14.6 Amplification of large regions by PCR ......................................................... 128
2.14.7 In-FusionTM advanced PCR cloning .............................................................. 129
2.14.8 Transformation of In-FusionTM cloned plasmid into bacterial cells ............. 130
2.14.9 PCR screening of transformed bacteria ....................................................... 131
Chapter 3 Generation of Conditional LSD1 Knockout Mouse Embryonic Stem Cells and
Examination of Growth and In Vitro Differentiation Potential........................... 132
3.1 Introduction ............................................................................................................. 132
3.2 Results ...................................................................................................................... 138
3.2.1 Generation of conditional LSD1 knockout ES cell lines ............................... 138
3.2.1.1 Removal of the HygTK selection cassette from Lsd1Lox-HygTK/3 ES cells141

8
3.2.1.2 Deletion of exon 3 from Lsd1Lox/3 ES cells .............................................. 144
3.2.1.3 Deletion of LSD1 protein .......................................................................... 147
3.2.2 Generation of LSD1-null MEFs ..................................................................... 150
3.2.3 Analysis of undifferentiated LSD1 knockout ES cells ................................... 153
3.2.4 In vitro differentiation analysis of LSD1 knockout ES cells .......................... 159
3.3 Conclusions .............................................................................................................. 169
Chapter 4 Understanding the role of LSD1 in embryonic gene regulation ......................... 170
4.1 Introduction ............................................................................................................. 170
4.2 Results ...................................................................................................................... 173
4.2.1 Loss of LSD1 causes a reduction in the level of CoREST .............................. 173
4.2.2 Loss of LSD1 results in increased global histone acetylation ...................... 180
4.2.3 LSD1 regulates the embryonic transcriptome ............................................. 183
4.2.4 Chromatin state changes in up-regulated genes......................................... 193
4.2.5 Brachyury is a direct target of LSD1 ............................................................ 197
4.2.6 Brachyury is up-regulated in E6.5 Lsd1-geo/-geo embryos ........................... 205
4.3 Conclusions .............................................................................................................. 207
Chapter 5 Investigating the requirement for the catalytic activity of LSD1 ........................ 208
5.1 Introduction ............................................................................................................. 208
5.2 Results ...................................................................................................................... 210
5.2.1 Generation of LSD1 expression constructs .................................................. 210
5.2.2 Expression of pCAGGS EGFP-LSD1 constructs in ES cells ............................ 216
5.2.3 Analysis of recombinant LSD1 protein interactions .................................... 218
5.2.4 Analysis of the ability for re-expressed wild-type LSD1 to rescue CoREST
levels and gene expression .......................................................................... 220
5.2.5 LSD1 demethylase activity is not required for gene repression .................. 223
5.3 Conclusions .............................................................................................................. 229
Chapter 6 Discussion ........................................................................................................... 230
6.1 An essential role for LSD1 in early embryonic development................................ 230
6.2 LSD1 regulates the transcriptome during embryonic development .................... 236
6.3 LSD1 knockout ES cells have reduced CoREST levels and increased histone
acetylation ................................................................................................................ 243
6.4 Catalytic activity of LSD1 is dispensable for gene regulation ............................... 247
6.5 Concluding Remarks ................................................................................................ 252

9
Appendices .............................................................................................................................. 254
Table A1 List of antibodies used in the study ........................................................................ 254
Table A2 List of primers used quantitative RT-PCR ............................................................... 255
Table A3 List of genes that are de-regulated >1.4-fold in LSD1 knockout ES cells ............. 258
Bibliography............................................................................................................................266
List of Abbreviations
ADP adenosine diphosphate
ATP adenosine triphosphate
bME betamercaptoethanol
bp base pair
BSA bovine serum albumin
cDNA complementary DNA
ChIP chromatin immunoprecipitation
CoREST co-repressor of REST
Ct cycle threshold
°C degrees centigrade
dpc days post conception
dCTP 2’-deoxycytosine 5’-triphosphate
DMSO dimethylsulphoxide
DNA deoxyribose nucleic acid
DNMT DNA methyltransferase
dNTPs 2’-deoxynucleotide 5’-triphosphate
EB embryoid body
EDTA ethylenediaminetetraacetic acid
ES cell (mouse) embryonic stem cell
EtBr ethidium bromide
FCS foetal calf serum

10
G418 geneticin
HAT histone acetyltransferase
HCP high CpG content promoter
HDAC histone deacetylase
hr hours
ICM inner cell mass
IP immunoprecipitation
kb kilobase
KDa kilodalton
KDM lysine demethylase
KMT lysine methyltransferase
KO knockout
LCP low CpG content promoter
LSD1 Lysine-specific demethylase 1
M molar
MEF mouse embryonic fibroblast
mM millimolar
M micromolar
mRNA messenger RNA
ng nanogram
NMD nonsense mediated decay
NPC neural progenitor cells
NRSF neuronal restrictive silencing factor
O/N overnight
PBS phosphate-buffered saline
PcG polycomb group
PCR polymerase chain reaction
pmol picomol
Pol II DNA-dependent RNA polymerase II

11
PRC polycomb repressor complex
PRE polycomb response element
PTM posttranslational modification
qRT-PCR quantitative real-time PCR
REST RE1 silencing transcription factor
RNA ribose nucleic acid
rRNA ribosomal RNA
SAHA suberoylanilade hydroxamic acid
S.E.M standard error of the mean
ssRNA single stranded RNA
TE Tris-EDTA
TRE Trithorax response element
TrxG Trithorax Group
TSA Trichostatin A
TSS transcriptional start site
V volt
v/v volume per volume
w/v weight per volume
WT wild-type
12
1 Introduction
1.1 Chromatin
The function of a cell is defined by its ability to utilise the genetic material within the
nucleus. The genome is the entirety of the DNA sequence and genes within the
genome must be expressed to produce proteins that are crucial for cellular processes.
The regulation of gene expression is highly complex and overall it may be controlled by
many factors, including extracellular stimuli, intracellular signalling, protein access to
DNA and transcriptional mechanisms. Gene expression occurs in a chromatin
environment and therefore the packaging of the genome into chromatin is now known
to be a critical feature of gene regulation mechanisms.
Histones are one of the oldest families of proteins known, first being described by
Albrecht Kossel in 1884 (Kossel 1884). Kossel showed that a substance called nuclein
(which was discovered by the Swiss biochemist Johann Meischer several years earlier
and thought to be a phosphorous-rich protein) was composed of a non-protein and
protein fraction. Ultimately histones were characterised as basic proteins that
combine with nucleic acids to form chromatin. The formation of chromatin is not only
a way to package DNA to form the chromosomes, but it is also fundamental to the
regulation of gene expression (reviewed in Zhang and Reinberg 2001). Cellular state is
therefore closely related to ‘chromatin state’ and this regulation is accomplished by
many interrelated mechanisms including covalent modifications of histone tails, DNA

13
methylation at CpG residues, incorporation of histone variants and chromatin
remodelling events (reviewed in Surani et al., 2007, Kouzarides 2007).
The fundamental subunit of chromatin, the nucleosome, is composed of
approximately 146bp of DNA wrapped 1.75 turns around an octameric complex of four
globular core histones H2A, H2B, H3 and H4 (Kornberg 1974). Original nucleosome
studies identified a (H3)2(H4)2 tetramer with two (H2A) (H2B) hetero-dimers binding
either side (Kornberg 1974). This repeat unit was discovered through micrococcal
nuclease digestion of unwrapped ‘linker’ DNA and electron microscopy (Hewish &
Burgoyne 1973, Noll 1974, Finch et al., 1975, Oudet et al., 1975). Roughly 50bp of
DNA acts as a linker sequence between the core histone octamers to organise
nucleosomes into the polynuclesome 11nm-fibre; or the ‘beads on a string’
architecture (Oudet et al. 1975, Turner 2005). Linker DNA is accessible to ‘non-core’
histones and other proteins, which facilitate further packaging into 30nm-fibres with
six nucleosomes per turn in a spiral or solenoid arrangement (reviewed in Kornberg &
Lorch 1999, Hayes & Hansen 2001). This architecture ultimately lays the foundation
for the formation of chromosomes, resulting in an overall 10,000-fold packaging of
DNA. This packaging is repressive towards processes requiring access of proteins to
the DNA, therefore the unfolding of the 30nm-fibre to the 11nm-fibre and the further
remodelling of polynucleosomes is required to generate templates for transcription
(reviewed in Zhang & Reinberg 2001). As a result, signals that mediate transcriptional
responses must integrate mechanisms to overcome nucleosomal repression before
they can influence the core transcriptional machinery (Wolffe 1998). Seminal studies

14
revealed protein complexes capable of altering chromatin structure either by utilising
the energy derived from ATP hydrolysis to mobilise the nucleosome or by covalently
modifying the histone polypeptides (Pazin & Kadonaga 1997, Hassig et al. 1998,
Kadosh & Struhl 1998, Kuo et al. 1998, Kingston & Narlikar 1999, Sterner & Berger
2000, Viganli et al. 2000, reviewed in Wu & Grunstein 2000, Kuzmichev & Reinberg
2001). These studies collectively demonstrated that gene expression was regulated by
affecting the dynamics of chromatin structure and modulating DNA accessibility. A
variety in the extent of chromatin packaging is therefore observed in interphase cell
nuclei, which is representative of the different functional requirements for regions of
the genome.

15
1.2 Histone modifications
In the mid-1960s, before the fundamental subunit of chromatin was discovered,
histone proteins were shown to be subject to multiple post-translational modifications
(PTMs) (Allfrey et al. 1964). Today, the most important branch of chromatin biology
relates to a striking feature of histones, namely the large number and type of modified
residues found on their N-terminal tails. It is now known that there are at least eight
distinct types of modifications found on histones, including acetylation, methylation,
phosphorylation, ubiquitination, sumoylation, ADP ribosylation, deimination and
proline isomerisation; with all of these modifications regulating transcription in some
way (reviewed in Kouzarides 2007). A vast array of enzymes that catalyse the addition
and removal of these modifications have hence been characterised as regulators of
transcription (reviewed in Grunstein 1997, Cheung et al., 2000, Kouzarides 2007,
Zhang & Reinberg 2001, Turner 2002). The result of these studies provided a new
layer of understanding of gene regulation, especially concerning the role of chromatin
as a regulatory element rather than a passive structural scaffold (Schreiber &
Bernstein 2002). Modified histones behave as regulatory molecules by providing
docking sites for proteins that can initiate molecular processes involving DNA. Histone
modifying enzymes interplay with transcription factors at the pinnacle of signal
transduction pathways, to control the recruitment or exclusion of additional factors to
alter chromatin structure and facilitate the DNA-associated function of transcription
factors (Bannister et al. 2001, Lachner et al. 2001, Carmen et al. 2002, Nishioka et al.
2002, Zeng & Zhou 2002).

16
The unstructured N-terminal tails of histone H3 and H4 tails, which are external to the
core structure of the nucleosome (Luger et al. 1997), are the most extensively
modified region of the core histone octamer (Zhang & Reinberg 2001, Lachner et al.
2003) (Figure 1.1). Residues on the tails of H2A and H2B tails as well as some residues
contained within the structured protein regions can be manipulated too. The
identification of a multitude of histone modifications, led to the proposal that they
constitute a ‘histone code’ that predicts the transcriptional state of a gene (Strahl &
Allis 2000). This stated that “multiple histone modifications, acting in a combinatorial
or sequential fashion on one or multiple histone tails, specify unique downstream
functions”. Recently though, layers of complexity have been added to the
understandings of signalling through chromatin, which has revealed an intriguing
language of histone crosstalk, as opposed to a strict code (Lee et al. 2010). The
functional complexity is increased due to this interplay between various modifications.
Figure 1.1. Post translational modifications of core histone tail. Specific amino acids within
the unstructured N-terminal tails of histone H2A, H2B, H3 and H4 are subject to various
types of post-translational modification. Acetylation, methylation, phosphorylaion and
ubiquitination are the most extensively studied modifications. The globular core of these
histones may also be modified, which is not illustrated in this figure.

17
Covalent modifications to histones have been closely linked to transcriptional
regulation and are required for many biological processes, including the differentiation
of pluripotent stem cells into specific tissue lineages (Dodge et al. 2004, Margueron et
al. 2005, Lin & Dent 2006, Torres-Padilla et al. 2007), which is the process of primary
interest of this thesis. Histone modifications have been implicated in a variety of
cellular process in addition to transcriptional regulation, including splicing (Spies et al.
2009, Luco et al. 2010), DNA replication (Goren et al. 2008, Lande-Diner et al. 2009),
DNA repair (Ikura et al. 2000, Stucki & Jackson 2004), recombination during meiosis
(Borde et al. 2009, Buard et al. 2009) and somatic recombination in lymphocytes
(Giambra et al. 2008). The inability to maintain specific histone modifications has also
been identified as a common hallmark of human cancer (Fraga et al. 2005).
Modifications primarily regulate the recruitment of proteins to genomic sites by
providing docking sites for proteins (Figure 1.2). These proteins will often be
transcriptional co-activators or co-repressors, which themselves can further recruit
factors involved in transcriptional regulation. Thus, histone modifications and the
protein complexes they recruit modulate the accessibility of the genetic information
and therefore the biological role played by the DNA sequence (reviewed in Zhang &
Reinberg 2001, Kouzarides 2007). Notably, there is a correlation between
transcriptionally ‘active’ chromatin marks and CpG islands (CGIs), as well as between
repressive marks and highly conserved non-coding regions of the genome (Bernstein
et al. 2006a, Barski et al. 2007, Tanay et al. 2007). Mutual exclusivity of different
modifications also emphasises their functional importance, where active histone
marks can inhibit the deposition of repressive marks and vice versa (Rea et al. 2000,
Nishioka et al. 2002). Lysine methylation and acetylation will be primarily discussed as

18
the focus of my research is the role of proteins involved in removing these
modifications.
Figure 1.2 Recruitment of
protein domains to histone
tails. The domains used by
various proteins for
recognition of phosphorylated
serines, acetylated lysines, or
methylated lysines present on
the unstructured N-terminal
tails of core histone proteins.

19
1.3 Lysine methylation
Histones can be methylated on lysine and arginine residues of histone tails (Shilatifard
2006, Kouzarides 2007). Lysines can be methylated on lysines 4, 9, 27, 36 and 79 of
histone H3 and lysine 20 of histone H4. Many studies have highlighted the importance
of histone methylation on specific lysines with respect to gene regulation. The
consequence of lysine methylation on gene expression can be either positive or
negative, depending on the context of the particular lysine residue and the number of
methyl moieties added (Jenuwein & Allis 2001, Kouzarides 2007). Importantly,
methylation does not change the charge of the amino acid, and the effects of
methylation state are manifested through recognition of the methyl moieties by other
factors. Thus, four states of lysine residues, unmodified (me0), mono-methylated
(me1), di-methylated (me2) and tri-methylated (me3), are interpreted by subsequent
binding of chromatin-associated proteins with a cognate chromodomain, PHD finger or
TUDOR domain to dictate downstream signalling from chromatin (Ruthenburg et al.
2007, Taverna et al. 2007) (Figure 1.2). For example, the PHD domain of the DNA
methyltransferase, DNMT3L recognises histone H3 tails that are unmethylated at K4
and induces de novo DNA methylation by recruitment of DNMT3A (Ooi et al. 2007). In
this instance, H3K4me0 is a signalling molecule to dictate DNA methylation.
Methylation on a particular residue can stimulate or prevent methylation on other
residues (Nishikawa et al. 1998), with distinct site-specific histone methylation
patterns defining euchromatic and heterochromatic chromosomal domains (Noma et
al. 2001). Studies have also revealed extensive crosstalk with histone acetylation,
phosphorylation and ubiquitination (Noma et al. 2001, Nishioka et al. 2002).

20
Lysine methylation in vivo is controlled by the opposing activities of lysine
methyltransferases (KMTs) and lysine demethylases (KDMs). The machinery and sites
of histone methylation are, for the most part, conserved from yeast to human. Of all
the enzymes that modify histones, KMTs are the most specific. Early biochemical
studies on the H3K4- and H3K9-specific KMTs, SET7 and Su39h1, respectively,
indicated that the SET domain in the SET domain-containing proteins is essential for
methyltransferase activity (Rea et al. 2000, Wang et al. 2001). The SET domain is
found in many proteins demonstrated to mediate lysine methylation (Zhang &
Reinberg 2001, Jenuwein & Allis 2001, Lachner & Jenuwein 2002). Now, three families
of enzymes are known to methylate lysine residues on histones H3 and H4: the PRMT1
family, the SET domain-containing protein family, and the non-SET domain-containing
proteins DOT1 and DOT1L (reviewed in Martin & Zhang 2005).
In vertebrates, the MLL family of proteins (MLL1-5), homologous to the yeast Set1
family and Drosophila trithorax, are present in protein complexes that catalyse H3K4
methylation (Milne et al. 2002, Hughes et al. 2004). These complexes are similar to
Set1-containing COMPASS (COMplex of Protein ASsociated with Set1) (Miller et al.
2001). KMTs specific to H4K9me3 in mammals are Suv39h1, Suv39h2, G9a, GLP, ESET
and RIZ1 (Rea et al. 2000, Tachibana et al. 2001, Shilatifard 2006). These enzymes
catalyse this repression-associated methylation of H3K9 and some interact with other
factors involved in transcriptional repression and silencing such as DNA
methyltransferases and heterochromatin-associated protein 1 (HP1) isoforms (Dong et
al. 2008, Tachibana et al. 2008, Epsztejn-Litman et al. 2008). The SET domain-

21
containing EZH2 protein catalyses H3K27 di- and tri-methylation (O'Carroll et al. 2001),
NSD1 and SMYD2 (homologous to yeast Set2) methylate H3K36 (Brown et al. 2006)
and DOT1 methylates H3K79 (van Leeuwen et al. 2002). PR-Set7 (also known as Set8),
Suv4-20h1 and Suv4-20h2 catalyse histone H4K20 mono-, di- and tri-methylation
respectively (Schotta et al. 2004, Xiao et al. 2005). Crosstalk between
methyltransferases and demethylases also occurs to synchronise the deposition of
active marks with the removal of repressive histone modifications (Issaeva et al. 2007).
One of the MLL enzymes, MLL2, can co-ordinate its activity with a H3K27-specific
demethylase, UTX to reduce the antagonist effects of H3K27 methylation on H3K4
methylation during cell differentiation.
1.3.1 H3K4 methylation
Trimethylation of K4 on histone H3 (H3K4me3) is associated with transcriptionally
active regions (Noma et al. 2001, Litt et al. 2001, Santos-Rosa et al. 2002, Schneider et
al. 2004). H3K4me3 localises primarily to the 5’ end of active genes, correlating with
localisation of the initiated form of RNA polymerase II (phosphorylated at serine 5 of
its C-terminal domain) (Barski et al. 2007). The deposition of H3K4me3 precedes the
establishment of initiated RNA polymerase II machinery though, in yeast,
Set1 interacts with RNA polymerase II and elongation machinery to mediate the
transition between intitiation and elongastion and to maintain H3K4
hypermethylation, in order to provide a molecular memory of recent transcriptional
activity (Ng et al. 2003). The H3K4me2 modification is also considered as an active
mark, correlating positively with gene expression and found to peak just downstream
22
of the TSS (Barski et al. 2007). Di- and tri-methylation are thought to co-exist at
promoters of active genes, though in some cell types a subset of
H3K4me2+/H3K4me3- genes have been identified (Orford et al. 2008). However, ChIP-
on-chip and ChIP-seq datasets from Orford et al. and Meissner et al. indicate that, in
mouse embryonic stem (ES) cells, the vast majority of promoters positive for H3K4me3
are also positive for H3K4me2. Mono-methylation of H3K4 is associated with
enhancer elements of genes and is linked to both transcriptional activation and
repression (Barski et al. 2007, Heintzman et al. 2007, Heintzman et al. 2009). Several
factors involved in active transcription have been reported to interact with di- and tri-
methylated H3K4, including the ATP-dependent chromatin remodelers CHD1 and
NURF, which bind through their chromodomains (Sims & Reinberg 2006, Wysocka et
al. 2006), as well as the H3K9me3/K36me3 demethylase, JMJD2A, which binds through
its tandem TUDOR domains, and removes the repressive H3K9 methylation mark
(Huang et al. 2006, Kim et al. 2006). Crosstalk with histone deacetylation can be co-
ordinated by H3K4me2/me3, as the Sin3A/HDAC-associated protein ING2 can interact
with high affinity to H3K4me3 through its PHD finger (Shi et al. 2006). The association
of HDACs with actively transcribed genes is a phenomenon described by Keji Zhao lab
and will be discussed further in 1.5 (Wang et al. 2009b, Dovey et al. 2010a).
1.3.2 H3K27 methylation
H3K27 methylation is a chromatin mark associated with gene repression and silencing
(Turner 2002, Lachner & Jenuwein 2002, Boyer et al. 2006, Lee et al. 2006, Roh et al.
2006, Barski et al. 2007, Kouzarides 2007). H3K27me2/me3 has similar distributions at

23
silent gene promoters, though H3K27me1 signals have actually been seen higher at
active promoters than silent promoters (Barski et al. 2007). This modification was
originally implicated in silencing of HOX gene expression, X chromosome inactivation
and genomic imprinting (Schuettengruber et al. 2007). Research on HOX genes
ultimately revealed that the H3K4me3 and H3K27me3 states impose an inherited state
of gene regulation that is independent of the genetic information encoded by the DNA
itself. This is achieved through the recruitment of the Trithorax Group (TrxG) and
Polycomb Group (PcG) complexes, which can maintain an active or repressive
expression state of a gene after the initial transcriptional regulators disappear
(originally identified in D. Melanogaster; review in Schuettengruber et al. 2007). The
presence of these modifications is therefore a form of epigenetic cellular memory.
Distinct classes of TrxG and PcG complexes contain KMTs and KDMs specific to H3K4
and H3K27. Work in Drosophila led to the identification of DNA regulatory elements,
known as TrxG and PcG response elements (TREs and PREs), which recruit these TrxG
and PcG factors, respectively, to chromatin. The deposition of histone marks then
mediates recruitment of other TrxG and PcG complexes to their chromatin targets,
which serve as effectors of the transcriptional state (Figure 1.3). In vertebrates, one
class of TrxG complexes includes the SET domain-containing factor MLL, which can
methylate H3K4 (Milne et al. 2002). A second class of TrxG factors includes
components of ATP-dependent chromatin remodelling complexes like SWI/SNF and
NURF, though the chromatin recruitment mechanisms are largely unknown (Hughes et
al. 2004, Wysocka et al. 2006). PcG complexes have been extensively investigated in

24
recent years. Two PcG complexes exist: PRC2 and PRC1; the former being a ‘writer’ of
H3K27 methylation, through the EZH2 KMT, and the latter being a ‘reader’ of this
modification, through specific recognition of H3K27me3 by chromodomain-containing
proteins within the complex (Fischle et al. 2003). The deletion of the EZH2, SUZ12 or
EED component of PRC2 causes embryonic lethality at E7.5 due to defects in
gastrulation (O' Carroll et al. 2001, Pasini et al. 2004, Cao & Zhang 2004, Montgomery
et al. 2005, Boyer et al. 2006). Most notably, the deletion of these components results
in inappropriate expression of PcG target genes and unscheduled differentiation
(Pasini et al. 2004, Boyer et al. 2006, Lee et al. 2006, Azuara et al. 2006, Agger et al.
2007, Shen et al. 2008b); this confirms that H3K27 methylation is essential to repress
developmental regulators in ES cells and maintain the pluriopotent state (Boyer et al.
2006) (1.9). The central components of PRC1 are Cbx, Rnf2 (Ring1) and Bmi1 proteins
(Schuettengruber et al. 2007). PRC1 is thought to be subservient to PRC2, manifested
through chromodomain recognition of H3K27me3. This is supported by the
knockdown of EZH2 resulting in significant mis-localisation of the PRC1 complex
component Bmi1 (Hernandez-Munoz et al. 2005). The chromodomain-containing
protein, Cbx, binds the H3K27me3 modification catalysed by EZH2 (Bernstein et al.
2006b). Rnf2 has a RING motif that ubiquitinates H2A119 to prevent the binding of
the transcription elongation complex, FACT, thus manifesting a state of transcriptional
repression (Stock et al. 2007, Zhou et al. 2008). Balance of H3K4me3 and H3K27me3 is
further regulated by lysine demethylation (1.4). The histone H3K27-specific
demethylases (UTX and JMJD3), which remove H3K27me3, interact with the H3K4-
specific methyltransferase (MLL2) of TrxG complex at the Hoxb1 promoter upon
25
retinoic acid-induced differentiation to synchronise changes in chromatin state (Agger
et al. 2007, Lan et al. 2007, Lee et al. 2007b, De Santa et al. 2007).
1.3.3 H3K9 methylation
Trimethylation of K9 of histone H3 (H3K9me3) is generally associated with the
formation of constitutive or facultative heterochromatin (Rea et al. 2000, Nakayam et
al. 2001, Nakayam et al. 2001, Peters et al. 2002), involving the recruitment of HP1 to
the promoter of repressed genes and subsequent association of co-repressors such as
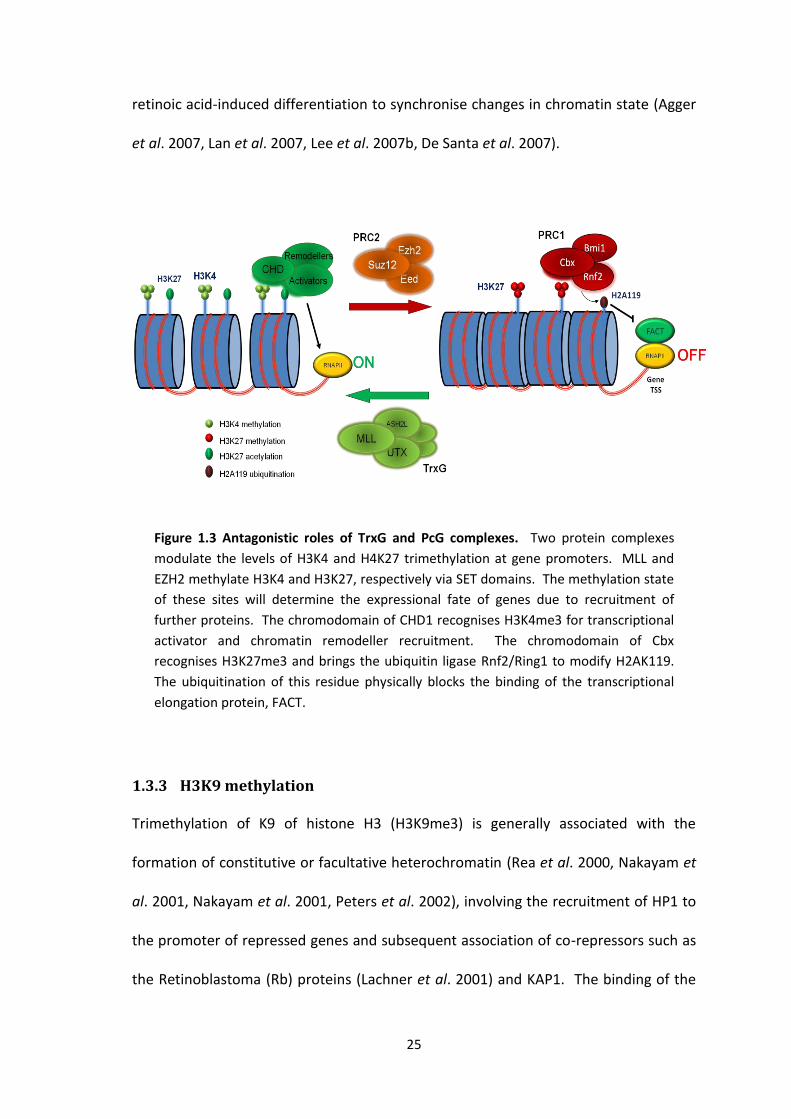
the Retinoblastoma (Rb) proteins (Lachner et al. 2001) and KAP1. The binding of the
Figure 1.3 Antagonistic roles of TrxG and PcG complexes. Two protein complexes
modulate the levels of H3K4 and H4K27 trimethylation at gene promoters. MLL and
EZH2 methylate H3K4 and H3K27, respectively via SET domains. The methylation state
of these sites will determine the expressional fate of genes due to recruitment of
further proteins. The chromodomain of CHD1 recognises H3K4me3 for transcriptional
activator and chromatin remodeller recruitment. The chromodomain of Cbx
recognises H3K27me3 and brings the ubiquitin ligase Rnf2/Ring1 to modify H2AK119.
The ubiquitination of this residue physically blocks the binding of the transcriptional
elongation protein, FACT.
26
HP1 and HP1 protein has a key role in heterochromatinisation (Bannister et al.
2001, Lachner et al. 2001). This processes also involves the docking of de novo
methyltransferases, DNMT3a/3b, via HP1 for effective silencing of genomic regions
(Feldman et al. 2006). This is also important in euchromatic gene repression, for
example E-cadherin and E- and A-type cyclin genes (Shi et al. 2003, Nielsen et al.
2001). Suv39h KMTs, that apply the H3K9me3 modification, contain a chromodomain
that bind this modification and therefore these proteins have the potential to cause
the physical spread of the H3K9me3 modification across chromatin regions through a
self-propagating effect of recognition and catalysis (Lachner et al. 2001). The
H3K9me3 modification is rarely found in ES cell/early embryonic chromatin, but
becomes abundant as cells differentiate, functioning to restrict patterns of gene
expression and reduce the rate of cell division in differentiating embryos (for review
see (Bhaumik et al. 2007). Notably, an accumulation H3K9 methylation and
subsequent de novo DNA methylation at the Oct4 locus is essential for repression of
this pluripotency gene in differentiating ES cells and embryonic development (Feldman
et al. 2006, Epsztejn-Litman et al. 2008). In this situation, an increase in H3K9
methylation is accompanied by loss of H3K4 methylation. This dogma—that H3K9
methylation and HP1 recruitment is always repressive—has been challenged though,
with the identification of HP1association with H3K9me3 at the promoter and body of
actively transcribed genes (Vakoc et al. 2005).

27
1.3.4 H3K36 methylation
H3K36 methylation is catalysed by SET2, NSD1 and SMYD2, which are SET/MYND
domain-containing KMTs and homologous of yeast Set2. This modification is
implicated in repression and activation of transcription as well as linking transcription
with splicing (Carrozza et al. 2005, Brown et al. 2006, Kolasinska-Zwierz et al. 2009,
Luco et al. 2010). The H3K36me3 modification is tightly associated with the serine 2-
phosphorylated elongating form of RNA polymerase II and is highly enriched within
transcribed regions of active genes (Bannister et al. 2005, Barski et al. 2007). Due to
the association of H3K36 methylation with actively transcribed genes, H3K36me3
signals are elevated sharply after TSSs in active genes following the peak of H3K4me3
around the promoter (Barski et al. 2007). This modification is primarily implicated in
recruiting other factors that regulate chromatin structure and is effectively a
repression-inducing modification due to its coupling to histone deacetylation.
H3K36me2/me3 modifications play a key role in suppressing intragenic transcription
initiation through recruitment of Rpd3S complex (a Sin3A-HDAC complex homologue)
via Eaf3 (an MRG15 homologue) in order to deacetylate histones H3 and H4 and re-
compact chromatin in the wake of the elongating polymerase (Carrozza et al. 2005,
Joshi & Struhl 2005, Keogh et al. 2005, Brown et al. 2006, Li et al. 2009). In contrast,
H3K36 methylation in yeast can prevent binding of the Sir2 deacetylase and the
associated formation of heterochromatin, in order to prevent global repression in
regions to be actively transcribed (Brown et al. 2006). H3K36me3 has also been
implicated in regulation of pre-mRNA splicing by recruiting PTB via MRG15 (Luco et al.
2010).

28
1.3.5 H4K20 methylation
The tri-methylation of H4K20 by Suv4-20h2 allows the formation of heterochromatin
at constitutively silenced centromeric DNA, repeat DNA regions and the inactive X
chromosome. The sequential induction of H3K9 and H4K20 trimethylation is thought
to index repressive chromatin domains, with the H4K20 modifications having an
almost identical distribution to H3K9 modifications, respectively (Schotta et al. 2004,
Barski et al. 2007). H4K20me3 and H4K20me2/1, however, have distinct distribution
in the genome. Tri-methylation is enriched at pericentric heterochromatin, whereas
the mono-methyl mark is dispersed in euchromatin, therefore possibly involved in
gene regulation (Schotta et al. 2004, Kohlmaier et al. 2004, Talasz et al. 2005, Vakoc et
al. 2006, Barski et al. 2007).

29
1.4 Lysine demethylases (KDMs)
1.4.1 Identification of KDMs
Following the discovery of KMT involvement in regulation of chromatin in 2000, the
methylation modification was still considered a permanent mark and the existence of
demethylases was contentious (Rea et al. 2000, Bannister et al. 2002, Kouzarides
2007). The dogma that methylation was an irreversible process was supported by
early studies looking at the turnover of methyl groups in bulk histones, where the half-
life of histones and methyl-lysine residues within them were the same (Byvoet et al.
1972, Duerre & Lee 1974). The permanent nature of this mark fitted with an
understanding of the role of methylation in cellular epigenetic inheritance of
transcriptionally silenced states. However, there is evidence from the 1970s that
active turnover of methyl groups does take place at low but detectable levels (Borun
et al. 1972). A hunt for a demethylase was in fact instigated over fourty-five years ago,
where in 1964, Paik and co-workers published the purification of an enzyme from rat
kidney capable of demethylating free mono- and di-N-methyllysine (Kim et al. 1964).
The same group described enzymatic demethyaltion towards histones a few years
later and then partially purified this enzymatic activity (Paik & Kim 1973, Paik & Kim
1974). They ultimately failed to relate this activity to a specific protein due to
limitations of protein characterisation techniques in the 1970s. This early work was
considered with emerging evidence from the Kouzarides lab in 2001, showing that
histone methylation plays a role in dynamic regulation of gene expression, to fuel an
strong arguement that enzymes that actively reverse methylation must exist
(Bannister et al. 2002, Santos-Rosa et al. 2002). Numerous chemical mechanisms for

30
active demethylation were proposed and even monoamine oxidases had been
suggested to be candidate histone demethylases (Bannister et al. 2002).
Eventually, the first lysine demethylase was discovered by Yang Shi and colleagues,
which was named Lysine-specific demethylase 1 (LSD1/KDM1A/AOF2/BHC110) (Shi et
al. 2004). This paved the way for characterisation of many other histone
demethylases over the next few years. KDMs are now known to appear in two
varieties, the amine oxidases (LSD1 and LSD2) and the far more numerous JmjC-
domain (JMJD) containing hydroxylase enzymes (Cloos et al. 2006, Klose et al. 2006,
Tsukada et al. 2006, Whetstine et al. 2006, Yamane et al. 2006; for review see Cloos et
al. 2008). The JmjC domain is conserved from yeast to humans and belongs to the
superfamily of Fe2+-dependent dioxygenases. These enzymes are divided into
subgroups based on their similarities within the JmjC domain. So far, seven subgroups
of lysine demethylase have been shown to have activity towards histone H3 and H4
substrates (Table 1.1).

31
Family Human Genes Substrate
AOF/KDM1 LSD1
LSD2
H3K4me2/1;
H3K9me2/1
JHDM1/KDM2 JHDM1A
JHDM1B
H3K36me2;
H3K4me3
JHDM2/KDM3 JMJD1A
JMJD1B
JMJD1C
H3K9me2
JMJD2/KDM4 JMJD2A
JMJD2B
JMJD2C
JMJD2D
H3K9me3/2;
H3K36me3/2
JARID/KDM5 JARID1A
JARID1B
JARID1C
JARID1D
H3K4me3/2
JMJD3/KDM6 UTX
UTY
JMJD3
H3K27me3/2
LSD1 has been shown to demethylate H3K4 and H3K9 (Shi et al. 2004, Metzger et al.
2005, Shi & Whetstine 2007), but can only demethylate mono- and di-methylated
forms of the substrate due to the requirement of a protonatable methyl ammonium
group (Forneris et al. 2008). Recently, LSD2 (KDM1B) was discovered and
demonstrated to also demethylate H3K4me2/me1 (Karytinos et al. 2009). It was soon
after identified as being important in establishing maternal genomic imprints (Ciccone
et al. 2009). Yi Zhang and co-workers isolated the first JmjC domain protein, JHDM1A
(KDM2A), upon purification of a H3K36 demethylase activity from cells using
formaldehyde release as the readout (Tsukada et al. 2006). Since then, numerous
JmjC enzymes have been identified that have unique histone substrates specificity,
Table 1.1 Lysine demethylases families, their members and substrate specificity

32
with the ability to demethylate distinct moieties of H3K4, H3K9, H3K27 and H3K36.
The JmjC-driven demethylase reaction mechanism is different to the amine oxidase,
with original identification through speculation that hydroxylation of a methylated
lysine residue by a JmjC protein could undergo spontaneous conversion to
unmethylated lysine (Trewick et al. 2005). This mechanism is compatible with
demethylation of mono-, di- and tri-methylated lysines; in most cases favouring a tri-
methylated substrate (Couture et al. 2007, Ng et al. 2007). The reaction mechanisms
of these two classes of enzyme are outlined in Figure 1.4.
As with KMTs, several KDMs appear to have an important function in ES cell self-
renewal and differentiation (1.9). Demethylases specific to H3K9 (JMJD1c/JMJD2a) are
activated by Oct4 expression, in order to prevent the repression of Nanog and Tcl1 in
ES cells (Loh et al. 2007) (section 1.8). Upon ES cell differentiation, the repression of
Oct4 corresponds with loss of expression of JMJD1a/JMJD2c, facilitating rapid
reprogramming of Nanog and Tcl1 to a silent state (Loh et al. 2007). As mentioned,
the H3K27 demethylases, UTX and JMJD3 have been shown to remove the H3K27me3
modification at HOX gene promoters in order to permit their activation upon
differentiation (Agger et al. 2007, Lee et al. 2007b).

33
A Amine Oxidase reaction
Mono-methyl lysine
FADH2 FAD
Di-methyl lysine
Formaldehyde
B JmjC hydroxylation reaction
Di-methyl lysine Tri-methyl lysine
2-oxoglutarate/Fe(II)
Figure 1.4 Two reaction mechanisms of lysine demethylation. (A) The amino group -
carbon bond is oxidised to produce an imine intermediate, which will spontaneously
hydrolyse to form formaldehyde and a corresponding amine reside by a non-enzymatic.
Substrate oxidation leads to the two electron reduction of the FAD cofactor, which is re-
oxidised by molecular oxygen to form hydrogen peroxide (Binda et al. 2002). Protonation of
the nitrogen is essential in this reaction and hence the enzyme can only demethylate mono-
and di-methylated lysines. (B) Conversion of a methyl group to a hydroxyl-methyl by JmjC
domain-containing enzymes occurs using of 2-oxoglutarate and Fe2+ as cofactors, in the
presence of oxygen. Formaldehyde is then released, resulting in demethylation of the lysine.
Imine intermediate Unstable carbinolamine
Unstable carbinolamine

34
1.4.2 Lysine-specific demethylase 1 (LSD1/KDM1A)
1.4.2.1 Discovery
Investigation of the repression of broad neurogenic transcriptional programmes,
mediated by the RE1 silencing transcription factor (REST; also known as NRSF)
(Schoenherr & Anderson 1995, Chong et al. 1995), led to the discovery of the co-
repressor of REST (CoREST; also known as Rcor1), a SANT domain-containing protein
that interacts with specific histone deacetylases (HDACS) (Andres et al. 1999, Ballas et
al. 2001, Lunyak et al. 2002) (1.6.3). CoREST was subsequently found to be a
component of a larger purified complex, which included carboxy-terminal binding
protein (CtBP), HDACs and an uncharacterised 110kDa FAD-binding protein (BHC110),
which was speculated to contribute a novel enzymatic activity (Tong et al. 1998, You et
al. 2001, Humphrey et al. 2001, Hakimi et al. 2002, Shi et al. 2003). An enzymatic
function and direct role in transcriptional repression of this novel protein was however
eventually identified by Yang Shi in 2004, after recognition that the chemistry used by
FAD-dependent polyamine oxidases could be used to catalyse lysine demethylation
within histones (Shi et al. 2004). It has been found to specifically demethylate mono-
and dimethylated H3K4, but not trimethylated H3K4 in vitro (Shi et al. 2004, Lee et al.
2005, Forneris et al. 2007, Rudolph et al. 2007). However, reports of alternative
substrate, H3K9me2/me1, have been been forthcoming (Metzger et al. 2005,
Wissmann et al. 2007, Garcia-Bassets et al. 2007, Wang et al. 2007). Overlall, it has
been demonstrated that the nature of associating proteins dictates the H3K4 or H3K9
substrate preference of LSD1.

35
The dispute in substrate specificity has largely been resolved through structural
studies (Forneris et al. 2006, Yang et al. 2007). Structural data has shown there are
strict steric constraints that support specificity of LSD1 towards the H3K4 residue
(Yang et al. 2007). Structural determination of LSD1 bound to histone H3 peptides
initially proved difficult due to a weak binding affinity (mM range Km) (Forneris et al.
2005b). A mechanism-based approach using peptide inhibitors provided solutions and
ultimately a stable LSD1-H3 peptide complex was produced, in which the substrate
analogue was covalently linked to the FAD cofactor. This led to a crystal structure
which indicated that only residues 1-7 of histone H3 fit into the active-site cavity of
LSD1 (Yang et al. 2007). The extreme N-terminus of H3 is anchored into the catalytic
pocket with no more than three residues permitted on the N-terminal side of the
methyl-lysine, which itself is situated above the isoalloxazine ring of FAD for catalysis.
Consistent with H3K4me2 (an active mark of transcription) as a substrate, LSD1 is
found in cells as part of a core complex with the corepressor CoREST and HDAC 1 and 2
(You et al. 2001, Humphrey et al. 2001, Hakimi et al. 2002). Structural data has shown
that other modifications to the tail of histone H3 must be removed before K4
demethylation can efficiently occur (Forneris et al. 2006). Association with HDAC1/2
creates a ‘double-blade razor’ that first eliminates acetyl groups from lysine residues
and then removes methyl groups from H3K4 (Forneris et al. 2006). The biochemistry
of this complex will be further discussed in 1.6.3.
The interaction with CoREST prevents LSD1 degradation and is essential for the
recognition and demethylation of nucleosomal substrates (Lee et al. 2005, Shi et al.

36
2005). Hence, LSD1 alone can only demethylate H3K4me1/me2 in peptides or bulk
histones, but in order to efficiently demethylate nucleosomes it must be in a complex
with CoREST. Binding to CoREST is mediated through an extended helical region
termed the ‘TOWER’ domain (Chen et al. 2006, Yang et al. 2006, Forneris et al. 2007)
(Figure 1.5A and B). The enzymatic activity of LSD1 is contained within the large amine
oxidase-like (AOL) domain (Chen et al. 2006) (Figure 1.5A and B). The TOWER domain
is an antiparallel coiled-coil, with two extended -helices that pack together in a left-
handed superhelix with a repeating pattern of seven residues (Chen et al. 2006). Not
only does this domain possess the interaction interface between LSD1 and CoREST, but
it is also indispensible for the demethylase activity of LSD1 towards bulk histone
substrates (Chen et al. 2006). LSD1 also contains an N-terminal ‘SWIRM’ (Swi3p, Rsc8p
and Moira) domain, which is a conserved motif that is thought to be important for
protein stability and implicated in histone tail recognition (Qian et al. 2005, Da et al.
2006). The N-terminus of the protein is an unstructured region dispensable for LSD1
demethylase activity in vitro (Forneris et al. 2005b). The related amine oxidase LSD2
notably lacks the TOWER domain essential to bind CoREST (Figure 1.5C); hence there is
no redundancy between these proteins (Ciccone et al. 2009, Karytinos et al. 2009).

37
C
Figure 1.5 Structure of LSD1. (A)
Domain organisation of LSD1. The
flexible N-terminal region and far
C-terminus are shown in grey, the
SWIRM domain is shown in green,
the amine oxidase like (AOL)
domain is shown in blue, with the
substrate binding domain in lighter
blue. The TOWER domain is shown
in yellow (B) Ribbon diagram of
LSD1. The colours are as in (A) and
FAD is the red ball and stick
representation. (C) Structure of the
LSD1-CoREST-H3 tail ternary
complex (PDB code 2UXN). The
CoREST linker is shown in purple
and the SANT2 in yellow. These
domains interact with the TOWER
domain of LSD1 (1.6.3). FAD is
again represented by ball and stick,
and the H3 tail peptide is shown in
light blue associated in the active
site of LSD1. (A-B) taken from
Chen et al. 2006 and (C) taken from
Hou et al. 2010.
38
1.4.2.2 LSD1 knockout studies
The first LSD1 knockout mouse study showed that germline deletion of LSD1 leads to
the developmental block at around embryonic day (E)7.5. In order to circumvent this
early embryonic lethality, a conditional, pituitary-specific LSD1 deletion was generated
to investigate the role of LSD1 during organogenesis. Pituitary development and the
appropriate expression of pituitary-specific hormones were found to be dependent on
LSD1 in the mouse and conclusions of this study work stated that LSD1 is required for
late cell lineage determination and differentiation during pituitary organogenesis
(Wang et al. 2007). This data could not explain death at E7.5 as complete loss of LSD1
was only achieved in the pituitary beyond E9.0-9.5 and the majority of analyses were
performed in pituitaries at E17.5 (Wang et al. 2007). A second publication of an LSD1
knockout mouse also reported an arrest in embryonic development at E6.5 (Wang et
al. 2009). Analysis of knockout ES cells derived from gene targeting identified a
dramatically reduced global DNA methylation. This phenotype was attributed to
decreased levels of the maintenance DNA methyltransferase DNMT1 as a result of
LSD1 loss (Wang et al. 2009). Demethylation of DNMT1 by LSD1 is crucial for protein
stability and hence correct regulation of genomic methylation. The loss of genomic
methylation would likely lead to aberrant activation of silenced genes and repetitive
DNA elements as well as genomic instability (Wang et al. 2009). However, embryonic
lethality observed in the Lsd1 knockout mice is unlikely to be solely caused by loss of
DNMT1, since Dnmt1 mutant embryos survive to mid-gestation, whereas Lsd1 mutants
die at the onset of gastrulation (Li et al. 1992, Wang et al. 2007). Very recently, after
publication of results from our lab, another mouse knockout of Lsd1 showed
embryonic lethality at the onset of gastrulation, however, DNMT1 protein levels and

39
global DNA methylation remained unchanged in the Lsd1 mutant ES cells derived from
the inner cell mass of the embryo (Macfarlan et al. 2011). In order to ensure that
DNMT1 levels had not been restored by a compensatory mutation during ES cell
isolation, the generation of a conditional deletion by ES cell gene targeted was also
performed. These cells also showed stable levels of DNMT1 through multiple passages
(by immunofluorescence-assessment of individual cells); thus, these discrepancies
between two reports are unresolved. Therefore, in this most recent publication, LSD1
was dissociated from DNMT1 and alternatively was characterised in repression of
retrotransposable elements (REs) by controlling histone modifications. The removal of
LSD1 resulted in activation of endogenous retroviral LTRs as well as genes that contain
an LTR in their promoter resulting in developmental arrest at gastrulation (Macfarlan
et al. 2011).
1.4.2.3 LSD1/CoREST function in transcriptional repression
The LSD1 hetero-dimeric partner, CoREST, is a co-repressor for the REST, which
represses neuronal genes in non-neuronal cells (Ballas et al. 2001). Inhibition of LSD1
function causes increased expression of CoREST targets such as acetycholine receptor
(AchR), synapsin and sodium channels (SCNA1A, SCNA2A, SCNA3A) in non-neuronal
cells (Shi et al. 2004, Lee et al. 2005, Shi et al. 2005); therefore identifying them as
LSD1 target genes. Inhibiting the activity of HDACs, by Trichostatin A (TSA) treatment,
results in de-repression of SCNA2 and SCNA3A, suggesting that hyperacetylation of
histone tails constitute an inferior substrate for LSD1 activity (Shi et al. 2005) (1.6.3).
Subsequent studies have shown that these SCNA genes are up-regulated in both
CoREST and LSD1 stable knockdown cells (Hu et al. 2009, Ouyang et al. 2009). The

40
regulation of haematopoietic differentiation by Growth factor independent (Gfi)
transcription factors is also mediated by association with the CoREST complex (Saleque
et al. 2007). The LSD1/CoREST/HDAC complex also regulates transcriptional activities
of the TAL1 transcription factor during haematopoiesis (Hu et al. 2009). Here, LSD1
plays an important role in the repression of the TAL1-target genes in undifferentiated
murine erythroleukemia (MEL) cells by demethylation of H3K4. Erythroid
differentiation is accompanied by a reduction in TAL1-associated LSD1 and HDAC1
activities (Hu et al. 2009). LSD1 is implicated in maintaining neural stem cell
proliferation through interaction with the orphan nuclear receptor, TLX, as well as co-
operation with HDAC5, in order to repress p21 and PTEN expression (Sun et al. 2010).
It has recently been recognised that posttranslational modification of CoREST by the
small ubiquitin-related modifier SUMO regulates LSD1/CoREST/HDAC function in
transcriptional repression (Ouyang et al. 2009). Promoter occupancy, gene repression
and associated histone modification of SCNA1A and SCNA3A, but not SCNA2A,
depends on binding of SUMO-2 to CoREST via a SUMO interaction motif (SIM) present
between amino acids 255 to 275 of CoREST (Ouyang et al. 2009). The binding of
SUMO-2 does not influence the ability of CoREST to bind LSD1, though overall there is
a gene-specific requirement for SUMOylation of COREST protein within the CoREST
complex. In addition to canonical functions of LSD1 in the CoREST complex, it was
recently shown to be recruited to the NuRD complex via interaction with MTA1-3 in
MCF-7 breast cancer cells (Wang Y et al. 2009).

41
1.4.2.4 LSD1 function in gene activation
The association of LSD1 with the androgen receptor (AR) has been reported, which
switches its substrate specificity to H3K9me1/me2, thus, implicating a role in gene
activation (Metzger et al. 2005, Wissmann et al. 2007). LSD1 has also been shown to
co-operate with the H3K9me3 demethylase, JMJD2C, to activate these AR-responsive
gene targets (Wissmann et al. 2007). The inhibition of LSD1 results in an increase in
H3K9 methylation of AR targets and a concomitant decrease in their expression. This
effect is also seen in C2C12 mouse myoblast cells at the myogenin and MCK
promoters, to reveal an activating role for LSD1 in skeletal muscle development (Choi
et al. 2010). Here, LSD1 interaction with myogenic transcription factors (Mef2c and
MyoD) has been reported to induce skeletal muscle differentiation (Choi et al. 2010).
Furthermore, the link of LSD1 to Estrogen Receptor (ER) signalling supports a role for
LSD1 in gene activation, where RNAi-mediated inhibition of LSD1 led to a decrease in
expression of ER targets co-occupied by LSD1, but not those not occupied by LSD1
alone (Garcia-Bassets et al. 2007). Studies performed on LSD1 orthologs in
D.melanogaster and S.pombe have corroborated the notion that LSD1 can act as a
H3K4 or as a H3K9 demethylase, though in each case it is implicated in establishing
euchromatin/heterochromatin boundaries (Nicolas et al. 2006, Lan et al. 2007,
Rudolph et al. 2007). The composition of LSD1 containing complexes therefore has
the ability to alter both target gene recruitment and substrate specificity. In addition
to this, neighbouring histone marks surrounding the substrate are important in
determining specificity (Forneris et al. 2006, Forneris et al. 2005b). The presence of
HDAC1/2 in the CoREST and NuRD complexes suggest a co-ordinate modification of
histone tails, which is supported by evidence that hypoacetylated histone tails are the

42
preferred substrate for LSD1 (Lee et al. 2005, Forneris et al. 2006, Forneris et al.
2005b, Shi et al. 2005). This parallels with the feature of H3K4 methylation often
being associated with increased acetylation of H3 by p300 and other histone
acetyltransferases (HATs). Both features support the notion that H3K4 and H3K9
methylation inhibit each other (Wang et al. 2001). Each of these roles mentioned
above involves direct recruitment to target genes and the manipulation of histone
substrates. Much of the literature reveals that LSD1 is recruited by transcription
factors, such as REST, Gfi1/1b and TAL1, as part of the CoREST complex to repress
differentiation-specific genes in undifferentiated cell types (Ballas et al. 2001, Hu et al.
2009, Saleque et al. 2007).
1.4.2.5 Non-histone targets of LSD1
LSD1 demethylates other proteins in addition to histone H3. DNMT1 was recently
identified as a substrate for LSD1, though non-histone substrates were recognised
before this. The pro-apoptotic tumour suppressor, p53, is known to be regulated by
numerous posttranslational modifications, possessing multiple sites for lysine
methylation (Chuikov et al. 2004, Huang et al. 2007). LSD1 has been implicated in the
DNA damage response by demethylating p53, which restrains the interaction of p53
with its cofactor p53BP1, thereby repressing p53-mediated transcriptional activation
and inhibiting the role of p53 in promoting apoptosis (Huang et al. 2007). LSD1
depletion might be expected to cause accumulation of p53 methylated on K370 and
thereby aberrantly stimulating pro-apoptotic transcriptional events (especially if
histone modifications are affected in concert; see 1.7). LSD1 also functions to regulate

43
p53-independent cell death upon DNA damage by controlling E2F1 stability through
demethylation of K185. LSD1 demethylation prevents ubiquitin-mediated E2F1
degradation, allowing it to activate the expression of pro-apoptotic target genes,
including p73 (Kontaki & Talianidis 2010). Taken together, this suggests that LSD1
demethylation causes commitment to p73- and not p53-mediated apoptosis.
Whereas, Set9 methylation would result in stimulation of p53 function and limited
activation of p73 through E2F1.

44
1.5 Histone acetylation
1.5.1 Effects of acetylation
Acetylation was first identified on histones in 1964 as a potential regulator of RNA
synthesis (Allfrey et al. 1964). A direct link between core histone acetylation and
active genes was identified through studies in chicken erythroid cells (Hebbes et al.
1985). Lysine acetylation, on many residues of the four core histones, is a highly
dynamic process and differs to methylation in its effect, as it is almost invariably
associated with active transcription (Roth et al. 2001, Zhang & Reinberg 2001,
Kouzarides 2007, Mellor et al. 2008). Histone acetyltransferases (HATs) catalyse the
addition of the acetyl group to the -amino group of lysine amino acids (Brownell &
Allis 1996). HATs can be divided into three main groups: GNAT, MYST and CBP/p300,
where each functioning enzyme often modifies more than one lysine (Sterner & Berger
2000). Deacetylation, catalysed by histone deacetylases (HDACs), is the reversal of
acetylation and generally correlates with transcriptional repression. HDACs are found
in numerous co-repressor complexes in the cell (described in greater detail in 1.6).
Many cellular processes are regulated by histone acetylation, including the assembly
of newly synthesised histones into nucleosomes, the spreading of heterochromatic
regions and gene transcription (Shahbazian & Grunstein 2007). Lysine acetylation
regulates local histone-DNA interaction as well as higher order structure of chromatin,
where histone acetylation creates more open chromatin architecture.

45
The effects of acetylation on chromatin are manifested through three processes.
Firstly, lysine acetylation perturbs the electrostatic charge attraction between the
negatively charged DNA backbone and the long, positively charged, basic histone tails
(Clark & Kimura 1990, Sun et al. 2005). This ultimately loosens the association of DNA
with the nucleosome. Secondly, the compaction of the 30nm fibre is prevented by the
presence of acetyl-lysines. A histone octamer with twelve acetylated residues (46%
maximal site occupancy) is completely inhibited from forming a higher-order folded
chromatin structure, and subsequently leads to an enhancement of transcription (Tse
et al. 1998). Specifically, H3K14Ac has been shown to inhibit formation of a
compacted fibre and to inhibit the ability of the ATP-utilising remodelling enzyme ACF
to mobilise the nucleosome, thereby preventing formation of higher order chromatin
(Shogren-Knaak et al. 2006, Robinson et al. 2008). Acetylation also prevents core
histone octamer association with linker histone H1, which stabilises the structure of
the polynucleosome, further hindering intra- and inter-nucleosomal interaction
(Shogren-Knaak et al. 2006, Ridsdale et al. 1990). Thirdly, acetyl-lysines are recognised
by specific proteins with bromodomains (Dhalluin et al. 1999), and these protein
modules are often found in core transcription factors and transcriptional activators
with further acetylating ability (for review see Taverna et al. 2007). For example,
H3K9Ac and H3K14Ac are required for transcription initiation by recruiting the
transcription factor TFIID (Agalioti et al. 2002).

46
1.5.2 Histone Deacetylases
HDACs remove the acetyl moiety from acetyl-lysine residues in histone protein
substrates. The first HDAC (HDAC1) was purified from cow-protein extracts in 1996
using an inhibitor as an affinity tag (Taunton et al. 1996). HDAC1 was discovered to be
an orthologue of yeast Rpd3, which had already been established as a global gene
regulator (Vidal & Gaber 1991). Eleven members of this orthologous family of proteins
have since been identified in mammalian genomes, all containing a conserved
deacetylase domain (Yang & Seto 2008) (Figure 1.6). These enzymes are zinc-
dependent and classified based on their homology to yeast Rpd3/Hda1 deacetylases;
now designated as the ‘classical’ family since the discovery of another family of
proteins known as the Sirtuins, which are not zinc-dependent but have a requirement
for NAD+ (Taunton et al. 1996, De Ruijter et al. 2003). The classical HDAC family is
grouped into classes I, II and IV, with class II being further divided into two subclasses
(IIa and IIb). These HDACs differ in structure, function, sub-cellular localisation and
expression patterns in mammals. Class I HDACs (HDACs 1, 2, 3 and 8) are highly
conserved enzymes present in the nucleus of all cells, which display high enzymatic
activity towards histone substrates (Van der Wyngaert et al. 2000, Bjerling et al. 2002,
De Ruijter et al. 2003). HDAC1 and 2 are nearly identical and are generally found
together in co-repressor complexes such as the Sin3, NuRD, CoREST and PRC2
complexes (Yang & Seto 2008) (1.6). Due to their ability to form multi-protein
complexes, they have been implicated in a variety of cellular process, including: the
regulation of cell cycle progression (Brehm et al. 1998, Luo et al. 1998, Magnaghi-
Jaulin et al. 1998), differentiation (Liu et al. 2009, Montgomery et al. 2009), cellular
ageing (Pegoraro et al. 2009) and cancer (Ropero et al. 2006).
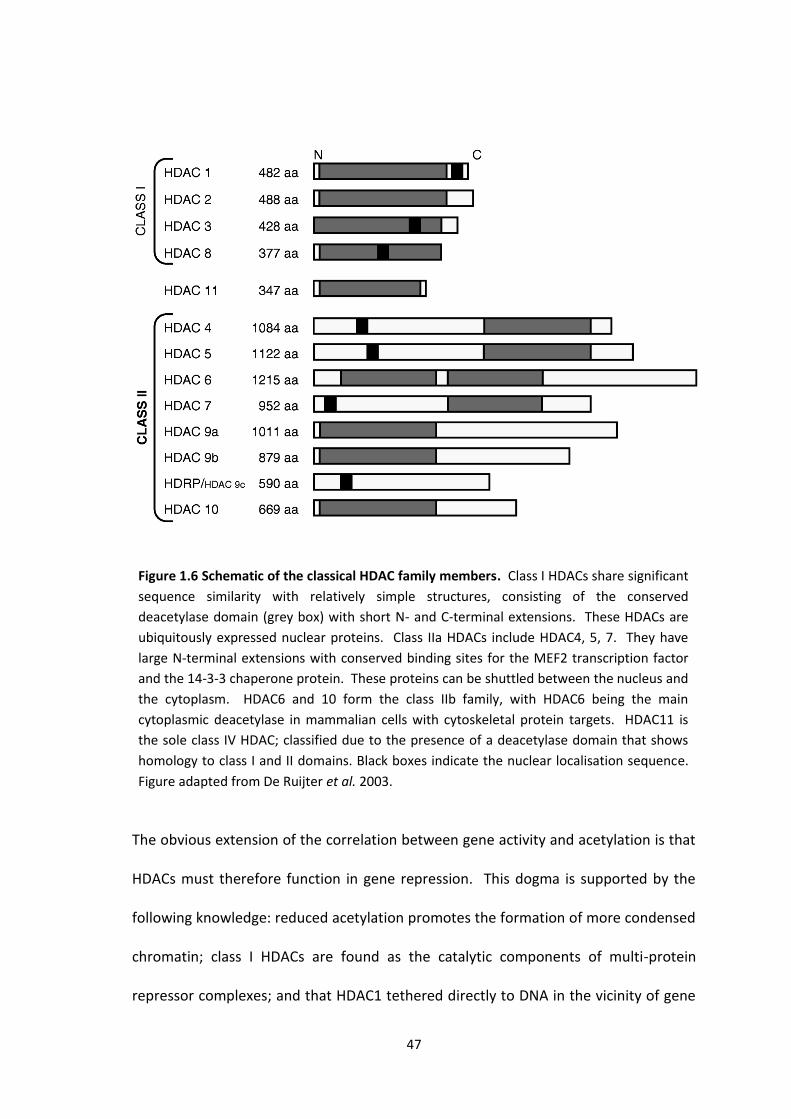
47
The obvious extension of the correlation between gene activity and acetylation is that
HDACs must therefore function in gene repression. This dogma is supported by the
following knowledge: reduced acetylation promotes the formation of more condensed
chromatin; class I HDACs are found as the catalytic components of multi-protein
repressor complexes; and that HDAC1 tethered directly to DNA in the vicinity of gene
Figure 1.6 Schematic of the classical HDAC family members. Class I HDACs share significant
sequence similarity with relatively simple structures, consisting of the conserved
deacetylase domain (grey box) with short N- and C-terminal extensions. These HDACs are
ubiquitously expressed nuclear proteins. Class IIa HDACs include HDAC4, 5, 7. They have
large N-terminal extensions with conserved binding sites for the MEF2 transcription factor
and the 14-3-3 chaperone protein. These proteins can be shuttled between the nucleus and
the cytoplasm. HDAC6 and 10 form the class IIb family, with HDAC6 being the main
cytoplasmic deacetylase in mammalian cells with cytoskeletal protein targets. HDAC11 is
the sole class IV HDAC; classified due to the presence of a deacetylase domain that shows
homology to class I and II domains. Black boxes indicate the nuclear localisation sequence.
Figure adapted from De Ruijter et al. 2003.

48
promoters using heterologous DNA binding domains, results in transcriptional
repression (Ridsdale et al. 1990, Nagy et al. 1997, Shogren-Knaak et al. 2006, Yang &
Seto 2008). However, data on the correlation of HDAC binding and gene expression
insinuates that HDACs can negatively and positively regulate transcription (Kadosh &
Struhl 1997, Xie et al. 1999, Kurdistani et al. 2002, Wang et al. 2002, Robert et al.
2004). This latter observation suggests that a major function of HDACs is to remove
the acetyl group added by HATs at active gene promoters, thereby resetting the
chromatin modifications following transcriptional activation (Wang et al. 2002, Dovey
et al. 2010a). The strongest evidence for a positive role in transcription comes from
two separate studies by the Grunstein and Zhao laboratories in yeast and human cells,
respectively (Kurdistani et al. 2002, Wang et al. 2009b). Genome-wide mapping of
HATs and HDACs in human T cells demonstrated that HDAC1 is predominantly
localised at active gene loci, co-localising with many HATs, including p300/CBP, p/CAF,
GCN5 and MOF (Wang et al. 2009b). Strikingly, the block of HDAC activity with HDAC
inhibitors and the knockdown of mSin3A and HDAC1 and 2 causes a dramatic
reduction in Nanog expression in undifferentiated ES cells (coupled with loss of active
histone marks), indicating that the mSin3A-HDAC complex positively regulates Nanog
expression (Baltus et al. 2009). One potential explanation is that transcriptional
activation involves a ‘cyclical’ utilisation of HATs and then HDACs to initiate and then
reset chromatin state between rounds of RNA polymerase II recruitment (Wang et al.
2009b). HDACs therefore have a role in promoter clearance that necessitates re-
initialisation of RNA polymerase II transcription (Dovey et al. 2010b)

49
HDACs are of significant research interest due to the great therapeutic potential of
HDAC inhibitors (HDACi). Many small molecule HDAC inhibitors exist, with most being
‘pan-HDAC’, that is, they block the activity of all isoforms (except class IIa), but some
being isoform-specific (Haberland et al. 2009). Ongoing human clinical trials are
investigating the use of HDAC inhibitors as treatment for a wide variety of disorders,
including cancer. Notably, suberoylanilade hydroxamic acid (SAHA; marketed as
Vorinostat) has been approved for treatment of cutaneous manifestations of
advanced, refractory T-cell lymphoma (Duvic et al. 2007). Inhibition of HDAC activity
can induce cell cycle arrest, differentiation or apoptosis of cancer cells in vitro and in
vivo. However, normal cells are relatively resistant to HDACi-induced cell death.
Indeed, a number of inhibitors are currently being tested in the clinic as potential
chemotherapeutic agents (for review see Marks & Xu 2009). Considering that histone
acetylation and deacetylation is involved in so many aspects of development and
tissue homeostasis, it is striking that systemic HDAC inhibition with compounds that
broadly inhibit most or all HDACs is well tolerated in vivo, with differing phenotypes to
HDAC gene deletions. An explanation for these discrepancies is that HDACs participate
in multi-protein transcriptional complexes. Genetic deletion of an HDAC perturbs the
complex in which it would normally be associated, whereas inhibitors are believed to
block enzymatic activity without necessarily disrupting the entire complex (Haberland
et al. 2009). The importance of this aspect of HDAC biochemistry is elaborated upon in
the next two sections.

50
1.6 Class I HDAC repressor complexes
With the exception of HDAC8, all class I members have been observed to exist in large
multi-subunit protein complexes, leading to co-operation with other chromatin
modifiers and proteins with chromatin binding domains (Ng et al. 2000). Among the
class I HDACs, HDAC1 and 2 are the most similar (83% sequence identity) and in
mammalian cells, they interact together (Taplick et al. 2001) to form the catalytic core
of a number of these complexes, including Sin3A, NuRD, CoREST and NODE (Figure
1.7). The CoREST complex is a key focus in this thesis. The N-CoR/SMRT complex
contains HDAC3, but will not be discussed in detail.
1.6.1 Sin3 complex
Sin3 repressor complexes were first identified in yeast. S.cerevisiae contains two Sin3
complexes; one deacetylates histones at promoter regions (Rpd3L), and the other
targets transcribed regions to suppress intragenic transcription (Rpd3S). This latter
complex contains the Eaf3 subunit that recognises H3K36me3 via its chromodomain
(1.3.4) (Rundlett et al. 1996, Kasten et al. 1997, Carrozza et al. 2005, Keogh et al.
2005). Mammals have two Sin3 homologues, mSin3A and mSin3B, which show high
sequence similarity and are both essential in mouse development (Cowley et al. 2005,
Dannenberg et al. 2005, David et al. 2008). mSin3A is one of the best characterised
class I HDAC-containing complexes (Figure 1.7).

51
Complex Component Protein domain
Sin3 HDAC1, HDAC2
RbAp46, RbAp48
Sin3A
Sds3
RBP1
SAP30
SAP18
ING1/2
Class I deacetylase
WD40 repeat
PAH motifs, ELM2
Coiled coil
Ubiquitin fold
PHD finger
NuRD HDAC1, HDAC2
RbAp46, RbAp48
Mi-2/
MTA1-3
MBD2, MBD3
p66/
Class I deacetylase
WD40 repeat
Helicase
SANT domain
Methyl CpG binding
CoREST HDAC1, HDAC2
CoREST
LSD1
BHC30
BRAF35
CtBP
Class I deacetylase
SANT domain, ELM2
SWIRM, AOL, Tower
PHD finger
Dehydrogenase
Figure 1.7 Repressor complexes containing HDAC1 and HDAC2. The simple schematic shows
how HDAC1 and 2 are common to these unique complexes with differing functions. Core
components are displayed and different isoforms of each component may also be
incorporated. The detailed list of components and structural motifs present is adapted from
Yang & Seto 2008. The importance of some of these motifs is discussed in the main text.

52
The interaction of Sin3A and HDAC1 and 2 in vivo was originally identified in the
Eisenman lab, where this discovery also elucidated a mechanism of Mad-Max
transcriptional repression through Sin3A association (Laherty et al. 1997). The mSds3
component is critical for maintenance of Sin3-associated HDAC activity (Alland et al.
2002) and the retinoblastoma associated proteins, RbAp46 and -48 are thought to
stabilise the interaction with the nucleosome (Lai et al. 2001). The mSin3A complex
itself lacks any DNA-binding activity; therefore, it must be targeted to genomic regions
by interacting with DNA-binding factors, such as p53, E2F and Ikaros (for a review see
Silverstein & Ekwall 2005). mSin3A has an essential role in early embryonic
development and T cell development (Cowley et al. 2005, Dannenberg et al. 2005).
mSin3A knockout MEFs exhibit de-regulation of genes involved in cell cycle control,
DNA replication, DNA repair, apoptosis, chromatin modification and mitochondria
function as well as mis-localisation of HP1 (Cowley et al. 2005, Dannenberg et al.
2005). mSin3B has a critical role in later stage of development in the mouse, with
depletion causing defective differentiation of multiple lineages due to de-repression of
E2F target genes (David et al. 2008).
1.6.2 NuRD complexes
The nucleosome remodelling and deacetylase (NuRD) complex was first characterised
as a complex containing the ATP-dependent chromatin remodelling protein Mi-2 and
MTA (metastasis associated) proteins (Tong et al. 1998, Zhang et al. 1998). This co-
repressor complex has been shown to be recruited to DNA by transcription factors
such as Ikaros and hunchback (Kim et al. 1999). The catalytic core of NuRD is HDAC1,

53
HDAC2, RbAp46 and RbAp48. Distinct NuRD complexes are formed depending on the
isoforms of the components, including: MTA1-3, Mi-2/p66 proteins and MBD
(methyl CpG-binding domain) 2 and 3. The MTA isoforms contain SANT domains and
are crucial for the integrity and deacetylase activity of NuRD (Denslow & Wade 2007).
The complex is involved with DNA methylation events through the MBD2 component
and complex association with MeCP1 and MeCP2. However, MBD2 and MBD3 are
exclusively associated within NuRD to form distinct complexes and the discovery that
MBD3 is unable to bind methyl-CpGs resulted in a reassessment of the overall
importance of NuRD in targeting methylated cytosines (Hendrich & Bird 1998, Saito &
Ishikawa 2002, Le Guezennec et al. 2006). MBD3 is necessary for MTA and HDAC
association within NuRD and is essential for mouse development, whereas MBD2 is
not (Hendrich et al. 2001); therefore, the importance of MBD3 is conveyed through its
role in protein-protein interactions (Saito & Ishikawa 2002) . It has since been shown
that ES cells lacking MBD3 are unable to differentiate due to inability to repress the
Oct4 gene (Keji et al. 2006).
A variant of the NuRD complex, lacking MBD3, was recently found associated with
Oct4 and Nanog proteins, which mediates repression of Oct4/Nanog target genes to
control ES cell pluripotency (Liang et al. 2008) (1.8 and 1.9). This unique complex was
named NODE (Nanog- and Oct4-associated DEacetylase). MTA1 is the preferred
isoform found within NODE and HDAC activity is comparable to that of the NuRD
complex. Upon knockdown of NODE components, ES cells spontaneously differentiate
into endodermal cell types due to de-repression of development-specific Oct4/Nanog

54
target genes. Therefore the function of NODE, which is to repress developmental
genes in undifferentiated cells, contrasts with the function of the NuRD complex,
which is to mediate Oct4 repression upon ES cell differentiation (Kaji et al. 2006, Liang
et al. 2008).
1.6.3 CoREST complex
The CoREST complex was initially identified as a complex containing HDAC1 and 2 that
was composed of polypeptides distinct from the previously characterised HDAC1/2-
containing complexes, Sin3 and NuRD (You et al. 2001). CoREST was initially cloned as
a co-repressor to REST/NRSF, which represses neuronal specific genes (Andres et al.
1999, Ballas et al. 2001). However, when CoREST and HDAC1/2 were first co-purified,
REST was not detected bound to CoREST (You et al. 2001, Hakimi et al. 2002). A
110kDa protein with homology to polyamine oxidases was, however, identified, which
was later characterised as LSD1 (You et al. 2001, Shi et al. 2004). Other complex
members include the co-repressor, CtBP (C-terminal binding protein) (Shi et al. 2003,
Shi et al. 2005), an HMG domain containing protein, BRAF35 (Hakimi et al. 2002, Lee et
al. 2005) and BHC80, which contains a PHD finger that specifically recognises
unmodified H3K4 (Lan et al. 2007). This binding is a contrast to other PHD fingers,
such as the bromodomain PHD finger transcription factor (BPTF) in the nucleosome
remodelling NURF complex and ING2 in the Sin3a complex, which bind methylated
H3K4 (Shi et al. 2006, Li et al. 2006). Thus, PHD finger-containing proteins are
important effecter molecules that are recruited to various methyl lysine moieties.
CoREST contains two SANT (Swi3, Ada3, NCoR, TFIIB) domains that resemble the DNA-

55
binding domains of Myb-related proteins that are also present in MTA proteins and
the transcription factors from which SANT is named (Aasland et al. 1996). Structural
and biochemical studies have shown that a SANT domain (SANT1) and a linker region
of CoREST interact with the LSD1 TOWER domain (Chen et al. 2006, Lee et al. 2006a).
A C-terminal SANT domain (SANT2) within CoREST facilitates the association with
chromatin by interacting directly with DNA (Shi et al. 2005, Yang et al. 2006). An
ELM2 domain, located N-terminally of the SANT1 domain, is essential for interaction
with HDACs and confers nucleosomal deacetylation within the CoREST complex (Lee et
al. 2006a). This ELM2 domain was previously shown to associate with HDAC1 in other
transcription factors (Solari et al. 1999, Ding et al. 2003).
The main functional interconnection between deacetylation and demethylation
activities was elucidated through two biochemical studies in 2006. One of these
studies showed that inhibition of deacetylase activity with HDACi decreased
nucleosomal demethylation, with similar magnitudes of inhibition of deacetylation and
demethylation observed as the concentration of TSA was increased (Lee et al. 2006a).
This effect was independent of changes in subunit composition in the CoREST
complex. These results implied that deacetylation precedes demethylation and
corroborated earlier suggestions that acetylated histone tails are an inferior substrate
for the activity of LSD1 in the complex (Shi et al. 2005). Subsequent experiments in the
Mattevi lab characterised the substrate specificity and recognition by LSD1, with
biochemical assays on histone peptides showing that essentially all covalent
modifications on the 21 N-terminal amino acids of histone H3 cause a significant

56
reduction in LSD1 enzymatic activity (Forneris et al. 2006). This confirmed that lysines
(notably K9) must be deacetylated by HDACs with the CoREST complex in order to
remove biophysical restraints on the demethylation of H3K4 by LSD1. Thus, a model
of CoREST complex function was proposed: it operates as a "double-blade razor" that
first eliminates the acetyl groups from acetylated lysine residues and then removes
the methyl group from lysine 4 (Forneris et al. 2006).
The complex is targeted to specific gene loci by DNA-binding transcription factors,
such as REST, TAL1 and Gfi proteins (1.4.2.3) that associate with CoREST and LSD1.
CtBP was identified as a 48kDa cellular phospho-protein that binds to the C-terminal
region of the human adenovirus E1A proteins (Boyd et al. 1993, Schaeper et al. 1995).
CtBP also directly interacts with many DNA-binding transcription factors and the
identification of its role as a transcriptional co-repressor was initially through its co-
purification with HDAC1 and 2 (reviewed in Chinnadurai 2002). CtBP can also co-
ordinate histone modification to act as a co-repressor through more than one
mechanism, which is elaborated on in the next section.

57
1.7 Crosstalk of histone modifications
As both methylation and acetylation play important roles in regulating gene
expression, it is no surprise these modifications are often tightly co-ordinated. This
crosstalk is exemplified by the presence of a LSD1 demethylase and deacetylases in the
LSD1/CoREST/HDAC protein complex. Removal of H3K4 methylation and H3K9/K14
acetylation has repressive functions. Evidence strongly indicates that changes in
acetylation states precede changes in methylation: LSD1 is more active towards
hypomethylated H3 (Lee et al. 2005, Shi et al. 2005, Forneris et al. 2006); and the KMT,
MLL, has increased methyltransferase activity towards H3 peptides acetylated at K9
and K14 (Milne et al. 2002). Furthermore, treatment with HDACi increases H3K4
methylation in vivo and decreases demethylation in vitro (Lee et al. 2006a). The
presence of a PHD finger in an LSD1 complex partner, BHC80, which binds
unmethylated H3K4, is an interesting feature that is suggested to be a targeting
system for LSD1 to the propagate H3K4 demethylation (Lan et al. 2007). CtBP also
manifests crosstalk between histone substrates, where HDACs, LSD1 and H3K9 KMTs
are linked through a CtBP supercomplex. Two CtBP subcomplexes have been
identified: one containing LSD1/CoREST/HDAC/BHC80; the other containing
REST/G9a/EuMT (Shi et al. 2003). Therefore, propagation of a repressive state in
euchromatic regions can occur through a stepwise model that synchronises H3K9
deacetylation, H3K4 demethyaltion and H3K9 methylation (see Lan et al. 2008) (Figure
1.8). HDAC1/2-mediated deacetylation of H3K9 is followed by CoREST recruitment to
hypoacetylated histone tails, which targets LSD1 to the H3K4me2/me1 substrate. This
is preceded by BHC80 binding to unmethylated H3K4 and potential stabilisation of

58
additional CtBP supercomplex members in the vicinity of the unmodified H3K9
substrate.
In an analogous fashion, the mSin3A complex will deacetylate histones in a
methylation-dependent manner (Pena et al. 2006, Shi et al. 2006). The ING2
component has a PHD finger domain that recognises H3K4me2/me3, in order to tether
the repressive mSin3A complex to highly active, proliferation-specific genes. This
represents a mechanism of feedback to actively shut-off highly transcribed genes. The
Eaf3/MRG15 chromodomain within the mSin3A-HDAC-Mrg15 complex is recruited to
Figure 1.8 Mechanism of CoREST complex-mediated targeting of LSD1 to H3K4 and
contribution to euchromatic gene repression. This stepwise model shows that HDAC1/2
deacetylates H3K9, which provides a hypoacetylated substrate for CoREST-LSD1 targeting.
LSD1 subsequently demethylates H3K4me2/me1 creating a moiety for BHC80 PHD finger
recognition. This binding maintains repression to prevent re-methylation of H3K4 as well
as crosstalk with H3K9 methylation through KMT activity in the CtBP complex. Figure
adapted from Lan et al. 2008.

59
H3K36me3 to deacetylate histones within the gene body. This occurs to compact
chromatin behind the elongating RNA polymerase complex in order to suppress
intragenic transcription initiation (Brown et al. 2006). This process has been well
characterised in S.cerevisiae, where deletion of Set2 or one of the Rpd3S components
results in spurious transcription from intragenic start sites (Carrozza et al. 2005).

60
1.8 Mouse embryonic stem cells
1.8.1 Origins and applications
Mouse embryonic stem (ES) cells are derived from the inner cell mass (ICM) of the
E3.5 pre-implantation embryo, known as the blastocyst (Figure 1.9). Cells of the ICM
will give rise to the embryo proper. ES cells possess two distinctive properties that
make them unique to any other cell type: they are ‘pluripotent’ as they can
differentiate into all cell types of the adult organism; and they can divide indefinitely
without losing the capacity to self-renew. ES cells were first derived from mouse
embryos in 1981 (Evans & Kaufman 1981, Martin 1981). When maintained in cell
culture, undifferentiated ES cells are thought to generally reflect cells of the epiblast
(E4.5–5.5 stage of development) (Doetschman et al. 1985, Brook & Gardner 1997).
Figure 1.9 Mouse ES cells are derived from the ICM of the E3.5 blastocyst and can be
maintained in cell culture. During mouse gestation, the pre-implantation stage involves
progression from the zygote to the blastocyst. The ICM has formed in the blastocyst at
E3.5 and contains pluripotent cells that will form the embryonic tissue. These cells can
be extracted and maintained in an undifferentiated state either on a feeder layer of
mouse embryonic fibroblasts (MEFs) or on gelatin-coated dishes in serum-containing
media supplemented with LIF (Smith et al. 1988, Williams et al. 1988. Figure adapted
from Boyer et al. 2006.

61
Mouse ES cells came to the fore within scientific research due to their ability to create
knockout mice (Bradley et al. 1984). The marriage of ES cell biology with homologous
recombination techniques, which were pioneered independently by Mario Capecchi
and Oliver Smithies, created a new technology known as gene targeting; this could
ultimately be utilised to knockout gene function the mouse (Folger et al. 1982,
Smithies et al. 1985, Thomas & Capecchi 1987). Gene targeting requires the creation
of a specific vector with DNA sequences homologous to the region in which it is to be
integrated. Ultimately, the method can be used to delete a whole gene, remove
exons, add a gene and introduce point mutations. These methods of altering the
genome of ES cells in culture created the ability to generate mice with targeted
mutations. To target genes in mice, the manipulated ES cells are injected into diploid
blastocysts followed by implantation into a pseudo pregnant surrogate mouse. These
ES cells will follow the course of development that the endogenous pluripotent cells of
the ICM will undertake, with the surrogate mother giving birth to chimeric mice;
representing the two distinct genetic backgrounds present in the blastocyst (see
http://www.eucomm.org/docs/protocols/mouse_protocol_1_Sanger.pdf). The
transmission of the targeted ES cells can be monitored by coat colour, as ES cell lines
used in culture are of a different genetic background (agouti coat colour) to the
common C57BL/6, inbred strain of laboratory mouse (dark brown/black coat colour).
Chimeras will therefore have mixed coat colour, indicative of their genetic mix. The
targeted ES cells can eventually contribute to the germline and therefore the entirety
of animals’ tissue following sufficient breeding of chimeras (Robertson et al. 1986).

62
Another important feature of ES cells is that they epitomise cells found in an early
stage embryo and they have the ability to differentiate into the three primary
embryonic germ layers (Keller 1995). Their differentiation may be viewed as a
counterpart to embryogenesis, making them a potent tool for embryology research
and an ideal in vitro counterpart in which to study loss of gene function in the early
embryo (Doetschman et al. 1985, Brook & Gardner 1997). They are also suitable as
they have a normal karyotype (diploid) and large numbers of homogenous cells can be
generated from a single cell due to their capacity to indefinitely self-renew.
Understanding the nature of ES cell biology has also allowed investigators to gauge the
success of reprogramming somatic cells into pluripotent stem cells (known as induced
pluripotent stem cells, or iPS cells) (Takahashi & Yamanaka 2006, Yu et al. 2007,
Takahashi et al. 2007, Wernig et al. 2007, Okita, Ichisaka & Yamanaka 2007, Meissner
et al. 2007, Maherali et al. 2007, Lowry et al. 2008, Okita et al. 2008, Park et al. 2008,
Stadtfeld et al. 2008). The generation of patient specific iPS cells could potentially be
used for cell replacement therapies. Finally, ES cells are a useful tool for studying
chromatin biology and epigenetics during early embryonic development. ES cell
differentiation is governed by remodelling of the epigenome and chromatin structure,
therefore the ES cell system is ideal for investigating the specific roles of histone-
modifying enzymes.
1.8.2 Maintenance of mouse ES cell pluripotency
Mouse ES cells can be maintained in cell culture by supplementing the culture media
with a cytokine called leukaemia inhibitory factor (LIF) (Smith et al. 1987 and 1988).
LIF is a member of the interleukin 6-family of cytokines that binds to the gp130

63
receptor, resulting in activation of the STAT3 signalling pathway (Ernst et al. 1996,
Niwa et al. 1998). The presence of serum or bone morphogenic protein (BMP4)
suppresses differentiation signals through Smad activation and subsequent induction
of Inhibitor-of-differentiation (Id) proteins (Ying et al. 2003). The MAPK pathway is
proposed to induce differentiation rather than self-renewal in ES cells. FGF4 is
produced by undifferentiated ES cells and autocrine activation of the FGF receptor
stimulates downstream MAPK signalling (Ma et al. 1992, Rathjen et al. 1999). The
importance of MAPK signalling in lineage commitment is highlighted by observations
that FGF4 ablation in ES cells restricts the ability to differentiate (Kunath et al. 2007).
The activation of differentiation-specific factors is, however, overridden by STAT3 and
BMP4 signalling. The requirement for extrinsic LIF and BMP4 stimuli is now known to
be dispensable for maintenance of the stem cell state and the minimal requirements
for self-renewal has been attributed mainly to the elimination of differentiation-
inducing signals emanating from the FGF receptor and MAPK signalling, which requires
neither LIF nor serum/BMP4 (Ying et al. 2008). These experiments showed that the
culture of ES cells with three selective small-molecule inhibitors (3i: SU5402, to inhibit
the FGF receptor; PD184352, to inhibit MEK; and CHIR99021, to inhibit GSK3 kinase)
can maintain the pluripotent state, and that action of these chemical antagonists
occurs upstream of differentiation-counteracting functions of LIF and BMP4.

64
1.8.3 Core pluripotency factor network: Oct4, Nanog and Sox2
The molecular networks that govern this stem cell state have been much scrutinised
within the three decades since mouse ES cells were first described. The expression of
a few key transcription factors are known to maintain pluripotency and self-renewal in
mouse ES cells (for reviews see Smith 2001, Boyer et al. 2006). Oct4 (Pou5f1) is a POU-
family transcription factor that was the first identified master regulator of
pluripotency, which prevents differentiation into the trophectoderm lineage and
thereby ‘locks’ the pluripotent capacity (Niwa et al. 2000). Nanog is a homeodomain
transcription factor identified as essential for maintenance of pluripotency in mouse
epiblast and ES cells (Mitsui et al. 2003). Sox2 is a high mobility group (HMG)-
containing transcription factor that functions in a combinatorial fashion with Oct4 to
maintain pluripotency and self-renewal through control of FGF4 expression
(Ambrosetti et al. 1997, Avilion et al. 2003, Chew et al. 2005).
The original mapping of Oct4, Nanog and Sox2 genome binding sites in human and
mouse ES cells indicated that many of their gene targets overlap and that they formed
the basis for circuitry consisting of auto-regulatory and feed-forward loops (Boyer et
al. 2005b, Loh et al. 2006) (Figure 1.10). In mouse ES cells, a core set of 345 genes are
targeted by both Oct4 and Nanog, with 30 DNA-binding transcriptional regulators
encoded among these genes, Oct4, Nanog and Sox2 included (Loh et al. 2006) (Figure
1.10). Some of these common targets, such as STAT3 and Wnt-responsive genes, are
activated in order to drive self-renewal (Chambers & Smith 2004, Sato et al. 2004,
Anton et al. 2007, Pardo et al. 2010). The other major function of core pluripotency

65
factors is to co-ordinate the repression of differentiation programs (Niwa et al. 2000,
Mitsui et al. 2003, Chambers et al. 2003). This is achieved by directly mediating gene
repression as well as by activating genes encoding transcription factors that can
regulate transcription repression, such as Esrrb, Rif1 and REST and activating genes
encoding components of chromatin remodelling and histone-modifying complexes,
such as ESET and Jarid2, which will mediate gene repression (Loh et al. 2006). Notably,
knockdown of Esrrb, Rif1 and REST causes differentiation of ES cells (Loh et al. 2006).
Differentiation is also suppressed by activation of Tgf-signalling by Nanog (Chambers
& Smith 2004, Boyer et al. 2005a). The core factors also directly repress genes
encoding transcription factors that will drive differentiation, notably homeodomain, T-
box, SRY-box and zinc finger transcription factors (Kim et al. 2008).
Most relevantly, the direct positive and negative regulation of gene targets by the core
factors occurs through the interaction with chromatin remodelling/histone-modifying
proteins. Sox2 interacts with mSin3A-HDAC complex to positively regulate Nanog
expression (Baltus et al. 2009). Oct4 and Nanog are associated with PcG (1.3.2) and
NuRD (1.6.2) repressor complex components, linking them to K27-specific KMTs and
HDAC1/2, respectively, thereby mediating the repression of developmental regulators
in ES cells through H3K27 methylation and histone deacetylation (Boyer et al. 2006,
Wang et al. 2006, Liang et al. 2008, Pardo et al. 2010). LSD1/CoREST/HDAC were
recently recognised as low affinity binding partners of Oct4, suggesting that this
complex has a role in Oct4-directed transcriptional repression (Pardo et al. 2010).
Down-regulation of core pluripotency factors will lead to the removal of repressive

66
complexes from development-specific genes and enable exit from the pluripotent
state. Deletion of these histone-modifying factors that interact with Oct4, Nanog and
Sox2 often results in increased expression of developmental genes and spontaneous
ES cell differentiation (Liang et al. 2008), similar to effects seen upon removal of Oct4,
Sox2 and Nanog (Nichols et al. 1998, Mitsui et al. 2003, Avilion et al. 2003, Chambers
et al. 2003).
1.8.4 An extended pluripotency regulatory network
Pluripotency factors act in a highly combinatorial fashion to hold differentiation-
promoting genes in check, while also driving the expression of genes encoding
Figure 1.10 Oct4, Sox2 and Nanog regulatory network controlling pluripotency in mouse ES cells. The core pluripotency factors are represented by ovals, and the genes (printed in italics) are represented by rectangles. A black arrow indicates a transcription factor binding to a gene and positively regulating that gene with arrows denoting the synthesis of gene products from their respective genes. The core factors can repress tissue-specific transcription factor genes and activate transcription factors involved in repression of differentiation (Esrrb, Rif1 and REST).

67
proteins required for self renewal. Subsequently, ES cell differentiation is a complex
process that requires the simultaneous activation of lineage-specific genes and
repression of self-renewal genes. Recently, a network of nine transcription factors
that controls ES cell state have been described (Kim et al. 2008). This revealed further
intricacy of control of the pluripotent state and extended the network beyond control
by Oct4, Nanog and Sox2. Nine factors (Oct4, Sox2, Nanog, Dax1, Nac1, Klf4, Zfp281,
Rex1 and Myc) occupy one third of mouse ES cell gene promoters in varying
combinations (Kim et al. 2008). Whereas 345 genes were initially found to be co-
occupied by Oct4, Sox2 and Nanog in ES cells (Loh et al. 2006), more than 800
promoters were found to be occupied by at least four out of nine factors examined in
the study from the Orkin lab (Kim et al. 2008). Distinct effects on gene expression and
associated histone modification was ascribed to the specific combination. Single or
dual occupancy is the most prevalent situation (5093 out of 6632 promoters) and Myc
occupies more promoters than any other factor (18% of all promoters). Myc and Rex1
were segregated from the other factors as they mainly occupy active genes implicated
in protein metabolism. The other factors are, however, found mainly at genes
involved in developmental processes, with genes bound by six factors implicated most
frequently in developmental processes. An expanded network recognised
transcriptional interconnectivity of the nine factors as well as other important targets
of these factors, which are involved in the regulation of developmental decisions,
signalling pathways and chromatin remodelling. Important multi-factor target genes
include TclI, Il6st (gp130), and Bmp4. TclI promotes ES cell self-renewal through
participation in the PI3K/Akt cell survival pathway; gp130 is a receptor important in

68
LIF/STAT3 signalling; BMP4 is a critical signalling molecule for inhibition of ES cell
differentiation.
1.8.5 Molecular mechanisms in pre-gastrulation embryonic development
Oct4 is essential for the establishment of the ICM in the early embryo (Rosner et al.
1990). Restriction of Oct4 expression and expression of the caudal-type
homeodomain transcription factor, Cdx2, is required for trophectoderm development,
which becomes the extra-embryonic tissue. This balance of these two factors affects
the first overt lineage differentiation in the embryo (Niwa et al. 2005). Indeed, loss of
Oct4 in ES cells will cause inappropriate differentiation into trophectoderm (Niwa et al.
2005, Strumpf et al. 2005). Over-expression of Oct4, on the other hand, induces
commitment to extra-embryonic endoderm and mesoderm lineages (Niwa et al.
2000). Overall, a strict regulation of Oct4 levels is required in the pre-implantation
embryo. During early gestation, LIF is secreted from the oviduct and the extra-
embryonic primitive endoderm layer forms in the blastocyst (Shen & Leder 1992). A
balance between Nanog and Gata4/Gata6 expression determines commitment to the
primitive endoderm lineage (Fujikura et al. 2002, Mitsui et al. 2003, Capo-chichi et al.
2005). ES cells lacking Nanog will spontaneously differentiate into primitive endoderm
(an effect also seen with forced over-expression of Gata4 or Gata6) (Mitsui et al. 2003,
Chambers et al. 2003, Fujikura et al. 2002) and the over-expression of Nanog can
promote mouse ES cell self-renewal in the absence of LIF (Mitsui et al. 2003). Sox2
plays an important role in early embryonic development through interaction with Oct4

69
at promoters, though expression of this factor is not restricted to pluripotent cells
(Avilion et al. 2003).
Pre-gastrulation events involve rapid proliferation, intense differentiation and specific
migration of cells, which is governed by expression of specific genes. The emergence
of the three primary germ layers occurs at gastrulation. These are the definitive
ectoderm, mesoderm and definitive endoderm. Germ layers eventually give rise to all
an animal’s tissues and organs through the process of organogenesis. The derivatives
of these germ layers are presented in Table 1.3. The formation of primitive ectoderm
and differentiation into the primary germ layers requires the withdrawal of LIF (Shen &
Leder 1992, Murray & Edgar 2001). Repression of Rex1 and the up-regulation of FGF5
are associated with development of the primitive ectoderm (Haub & Goldfarb 1991,
Rogers et al. 1991, Hebert et al. 1991), which will eventually form the epiblast
following mass apoptosis and cavitation (Coucouvanis & Martin 1995). Primitive
ectoderm cells at this point are still pluripotent, but cannot contribute to chimera
formation following injection into blastocysts (Rossant & Ofer 1977, Beddington 1983).
The epiblast responds to extrinsic signals to give rise to the primary germ layers as well
as primordial germ cells (Gardner & Rossant 1979, Ginsburg et al. 1990). The primary
germ layers in the embryo are formed during the onset of gastrulation around E6.5-7.0
(Tam & Behringer 1997). The primitive streak arises upon gastrulation with complete
Oct4 repression being evident at this point. Differentiation into mesoderm and
definitive endoderm occurs by epiblast cell movement through the posterior and
anterior streak respectively, where epithelial-to-mesenchymal transition (EMT) of cells

70
occurs. Cells in the most anterior region of the epiblast do not move through the
primitive streak and will form ectoderm (Tam & Behringer 1997, Kinder et al. 1999).
All these processes are thought to involve interplay of the expression of Tgf family
genes including BMP4 and Nodal, and the Wnt and FGF families. It is important to
note that Oct4 continues to be expressed in the primordial germ cells and maturing
oocytes of the female (Holland & Hogan 1988, Rosner et al. 1990).
ECTODERM MESODERM ENDODERM
Epidermis of the skin
and derivatives (hair,
nails, sweat glands,
sensory receptors)
Nasal, oral epithelium
Nervous system
Cornea and lens of eye
Adrenal medulla
Posterior pituitary
Tooth enamel
Notochord
Skeletal system
Muscular system
Muscle layer of
stomach and intestine
Excretory system
Circulatory and
lymphatic systems
Urogenital system
(except germ cells)
Dermis of skin
Lining of body cavity
Adrenal cortex
Digestive tube (except
for mouth, pharynx,
end of rectum)
Lining of urinary
bladder and urethra
Thymus
Thyroid gland
Anterior pituitary gland
Accessory digestive
organs (pancreas, liver,
gallbladder)
Auditory structures
Epithelial lining of
respiratory system
1.8.6 In vitro differentiation of ES cells
The assays of in vitro differentiation aim to recapitulate early embryogenesis, where
an intricate series of morphological and molecular changes occur. The ability to
differentiate ES cells to generate various lineages under appropriate conditions in
Table 1.3. A list of the tissues in mammals that originate from each primary germ layer
of the early embryo.

71
culture provides a valuable tool to study early precursor populations that are difficult
to access in vivo (Doetschman et al. 1985, Risau et al. 1988, Wiles & Keller 1991,
Millerhance et al. 1993, Rohwedel et al. 1994, Bain et al. 1995). The mechanisms of
emergence of the three embryonic germ layers may be analysed in cell culture by
generation of embryoid bodies (EBs) from ES cells (Doetschman et al. 1985, Keller
1995, Coucouvanis & Martin 1995). In vivo analysis of gene function is complicated if
the gene deletion results in early embryonic lethality, therefore the study of gene
function during these stages may be done in culture.
Three approaches can be used to initiate the formation of the three primary germ
layers in vitro. Aggregation of ES cells as ‘hanging drops’ in the absence of LIF to form
embryoid bodies is the most common method. This involves initial formation of
primitive endoderm as the outer layer of EBs and subsequent differentiation as three-
dimensional structures (Shen & Leder 1992). The second method involves culturing ES
cells on stromal cells, such as the OP9 cell line, where differentiation takes place in
contact with these cells (Nakano et al. 1994). Thirdly, ES cells can be differentiated in
a monolayer on extracellular matrix proteins (Nishikawa et al. 1998). In addition to
this method of in vitro differentiation, other techniques can be used including simple
removal of LIF and serum (BMP4) to induce spontaneous differentiation, as well as the
addition of factors such as retinoic acid, Wnt proteins, PPAR and insulin to stimulate
differentiation towards specific lineages. LIF withdrawal relieves cells of inhibitory
effects of STAT3 on mesoderm differentiation and BMP4 withdrawal reduces
inhibitory effects of Id proteins on neuroectoderm differentiation.

72
ES cell aggregation in the EB simulates early embryonic pre-gastrulation events. The
withdrawal of LIF stimulus is not required here and is supported by the observation
that primitive endoderm can form by ES cell aggregation in the presence of LIF (Shen &
Leder 1992, Murray & Edgar 2001, Hamazaki et al. 2004). EB differentiation in the
absence of LIF allows recapitulation of development from the primitive ectoderm in
the epiblast. Cells with characteristics of primitive ectoderm (FGF5-positive; Rex1-
negative) have in fact been identified in culture by growth in conditioned media from
hepatocellular carcinoma cell lines. These cells, named early primitive ectoderm-like
(EPL) cells, can be differentiated into EBs and have been seen to form mesoderm and
derivative cell populations more efficiently and rapidly than ES cells (Rathjen et al.
1999, Lake et al. 2000). The point of gastrulation in the embryo is thought to be
represented at about day 3 in EB differentiation, even though the development of a
structure comparable to the primitive streak does not occur (Figure 1.11). At this
point, in both systems, Brachyury (T) expression can be observed (section 1.8.7). The
regulation of germ layer induction is now understood to be influenced by the mixture
of growth factors and inhibitors present in serum, as well as additional factors that can
be supplemented in the culture media. Adding BMP4 can induce posterior mesoderm
derivatives; a gradient of activin/Nodal signalling from low to high is implicated in
mesoderm and definitive endoderm induction, respectively; and FGF will drive
neuroectoderm formation, with Wnt, BMP4 and activin inhibiting early stages of this
pathway (for more details see Keller 2005).

73
The examination of lineage differentiation in EBs can be performed using certain well-
established markers. Visceral and parietal endoderm arises from the primitive
endoderm and markers include Gata4, Gata6, hepatocyte nuclear factor (HNF) family
genes, alpha-fetoprotein (AFP) and transthyretin (TTR). Wnt3 and Brachyury are
common markers of mesoderm (Fehling et al. 2003, Liu et al. 1999) and FGF5 is a
strong primitive ectoderm marker (Haub & Goldfarb 1991, Hebert et al. 1991).
Presence of distinct lineages in EBs can be analysed by harvesting RNA and measuring
transcript abundance of these genes. Additional markers are well established, many of
which have been used in this study to test the presence of primary lineages and more
restricted lineages, such as cardiomyocyte, muscular, haematopoietic and neuronal
lineages (Figure 1.12).
Figure 1.11 Comparison of the stages
of early embryonic development and
EB differentiation of ES cells.
Primitive ectoderm forms from ES
cells when LIF exposure is removed
(or when cultured as EPL cells) and
represents accumulation of this cell
type in the embryo and formation of
the epiblast at E6.0. Gastrulation
occurs around E6.5, which indicated
by Brachyury expression in the
primitive streak. Brachyury is
upregulated in EBs at day 3 of culture.
Figure from Keller 2005.

74
1.8.7 Mesoderm development
Mesoderm induction occurs through formation of the primitive streak. It
differentiates to give rise to a number of tissues and structures including bone,
cartilage, muscle, adipose tissue, connective tissue (including that of the dermis),
blood, vascular, reproductive, excretory and urinogenital systems and some glands
Figure 1.12 Markers of lineage differentiation in embryoid bodies. ES cells express Oct4,
Nanog and Rex1. The primitive endoderm and trophectoderm constitute the extra-embryonic
tissues of the late blastocyst and trophectoderm can differentiate into a variety of extra-
embryonic cell types, including placenta. Primitive endodermal cells constitute the surrounding
layer of EBs as Nanog is repressed. AFP, TTR and HNF1b are up-regulated in these cells. Oct4
and FGF5 expression with Rex1 and Gbx2 repression is exhibited in the primitive ectoderm
(which constitutes the pluripotent population of cells derived from the ICM). Definitive
endoderm, mesoderm and ectoderm arise from these cells as gastrulation occurs at E6.5-7.0 in
the embryo. Sox17, Foxa2, Gata4 and Gata6 expression signifies definitive endoderm in EBs.
Early mesoderm markers include Wnt3 and Brachyury (T). Specific mesodermal lineages and
markers are indicated. The neuroectoderm develops from ectoderm, where Nestin and Pou3f2
are expressed. Further neural markers include -III tubulin (Tubb3), NF-M and GFAP.

75
(Table 1.3). The development of the haematopoietic system, derived from mesoderm,
is the most thoroughly analysed developmental program. Mesodermally-derived cell
populations representing the hematopoietic, vascular, cardiac and skeletal muscle, the
osteogenic, the chrondrogenic and adipogenic lineages have been generated from ES
cells differentiated in culture. The hematopoietic, vascular and cardiac lineages have
been among the easiest to generate from ES cells and have been studied in
considerable detail. The first mesodermal cells contribute predominantly to the
haematopoietic and vascular cells of the yolk sack. In fact, hematopoietic progenitors
are found in the developing yolk sac as early as E7.0, approximately 12 hours following
the beginning of gastrulation (Keller 2005).
The embryo and EB systems display an extremely similar sequence of events with
regards to this development, as defined by the onset of expression of specific genes.
The Brachyury (T) gene encodes a transcription factor that is essential for mesoderm
development and correct development of the primitive streak and notochord
morphogenesis in the embryo (Wilkinson et al. 1990, Kispert & Herrmann 1994).
Brachyury mutant mice have defective tail development (Herrmann et al. 1990,
Wilkinson et al. 1990). Brachyury transcript and protein are present in the primitive
streak from the onset of gastrulation (E6.5) and this expression persists in the streak
throughout the period of axis formation and elongation (Kispert & Herrmann 1994).
Brachyury is down-regulated as cells undergo patterning and specification into
derivative tissues including skeletal muscle, cardiac muscle, blood and endothelium.
Brachyury has often been used to track mesoderm induction during ES cell

76
differentiation. Expression is barely detectable in undifferentiated ES cells until
induced at day 5 of differentiation, and is silenced by day 10 (Keller et al. 1993).

77
1.9 Chromatin state of ES cells and changes upon differentiation
1.9.1 ES cell chromatin state
ES cell chromatin displays characteristics of transcriptionally permissive euchromatin,
such as the abundance of acetylated histones and increased accessibility to nucleases
(Boyer et al. 2006). Analysis of global chromatin dynamics, by measuring the exchange
rate of chromatin-associated proteins using fluorescent recovery after photobleaching
(FRAP), has revealed a far more dynamic association of structural chromatin proteins
(core and variant histones, linker histones and HP1) within the chromatin of
pluripotent cells compared to that of differentiated cell types (Phair et al. 2004,
Meshorer et al. 2006). These increased rates reflect loose binding of proteins to
chromatin, rendering it more accessible to transcription factors and histone modifiers.
This study also showed that replacement of histone H1 with a version that binds more
tightly to chromatin inhibited ES cell differentiation, indicating that this feature of ES
cell chromatin enables rapid reorganisation of chromatin structure during
differentiation (Meshorer et al. 2006). Core pluripotency factors induce the
expression of chromatin remodelers (SMARKD1), H3K4 KMTs (MLL) and HATs (MYST)
to maintain a ‘transcriptionally-permissive’ chromatin state (Boyer et al. 2005).
Expressed genes in ES cells (including pluripotency factors and active genes bound by
these factors) expectedly have hyperacetylated histones and are enriched for
H3K4me3 with minimal H3K9me3 modification and less promoter CpG DNA
methylation than somatic cells (Mikkelsen et al. 2007, Kim et al. 2008, Fouse et al.
2008) (Figure 1.13). The identification that lineage-specific genes, which are silent in
undifferentiated ES cells, might be in a semi-permissive transcriptional state was an

78
initial suggestion this ‘open’ chromatin state is not just conveyed by expressed genes,
but it is also a feature of inactive genes (Chambeyron et al. 2005, Szutorisz et al. 2005).
1.9.2 Bivalent domains
Two reports soon revealed the existence of a dual chromatin mark or ‘bivalent’
domain, consisting of the repressive H3K27me3 modification and the active H3K4me3
modification, at a large set of developmentally important genes that are not expressed
in ES cells but activated upon differentiation (Azuara et al. 2006, Bernstein et al. 2006).
At these gene promoters, the active mark is physically present at the same or
adjoining nucleosomes as repressive chromatin marks. This domain is unique to ES
cells in order to maintain lineage-specific genes in a quiescent or ‘poised’ state. It
ensures that no gene is truly off, as ES cells must have the capacity to rapidly induce
the expression of appropriate genes to become any cell type. The chromatin state at
these genes is transcriptionally-permissive, though the genes are not expressed. The
plastic chromatin state reflects that approximately a quarter of all CpG island-
containing promoters in ES cells are poised for activation, through the nature of the
bivalent modification (Mikkelsen et al. 2007, Pan et al. 2007, Ku et al. 2008). In
addition to these histone marks, initiated RNA polymerase II, phosphorylated at serine
5 of its C-terminal domain, is found associated with these bivalent promoters; this is
important in conferring the poised nature of genes (Stock et al. 2007). The presence
of H3K27me3 is important in establishing this state, as this poised RNA polymerase
configuration is enforced by PRC1-mediated ubiquitination of histone H2AK119
(section 1.3.2). As ES cells differentiate, rapid induction of ‘poised’ genes essential for
cell-type specialisation is enabled by resolution into a H3K4me3 univalent chromatin

79
state and thus removal of PcG-imposed restraints on transcriptional elongation (Figure
1.13) (Bernstein et al. 2006a, Mikkelsen et al. 2007, Stock et al. 2007). On the other
hand, tissue-specific genes associated with alternative developmental pathways will
be resolved into a H3K27me3 univalent state and therefore silenced upon
differentiation (Azurara et al. 2006, Bernstein et al. 2006) (Figure 1.13).
The PcG and TrxG proteins have predominantly been implicated in ‘cellular memory’ in
order to maintain repressed or active transcriptional states of developmentally
Figure 1.13 The bivalent chromatin domain in ES cells. In ES cells, the promoters of a
range of repressed developmental genes contain conflicting modifications that are either
associated with active chromatin states (H3K4me2/me3) or inactive chromatin states
(H3K27me3). These genes are poised for expression in response to the appropriate
developmental cue. ES cell differentiation corresponds with resolution of the bivalent
state to a univalent methylation state, leading to either activation of required tissue-
specific genes or silencing of loci associated with alternative developmental pathways.

80
important genes through many rounds of cell division (Ringrose & Paro 2004).
However, over the last five years it has become clear that chromatin state is equally as
important as core pluripotency factor expression in regulating the ES cell
transcriptional profile, where the inability to maintain H3K27me3 results in large
alterations in the ES cell transcriptional profile (Boyer et al. 2006, Lee et al. 2006,
Bracken et al. 2006, Surani et al. 2007). This indicates that the transcriptional switches
required upon ES cell differentiation are governed by histone-modifying enzymes.
Deletions of PRC2 components results in de-repression of developmental transcription
factor genes, including HOX genes, and often lead to spontaneous differentiation of ES
cells, early embryonic lethality and failure to derive ES cells from the ICM (Cao & Zhang
2004, Azuara et al. 2006, Boyer et al. 2006, Lee et al. 2006, Agger et al. 2007).
Moreover, removal of the PRC1 component, RING1B, which restrains RNA polymerase
II in a poised state, results in de-repression of bivalent genes, emphasising the
essential requirement for downstream implementers of the H3K27me3 modification
(Stock et al. 2007). Overall, around 500 transcription factors with roles in a variety of
developmental processes have bivalent genes and are bound by PcG complexes
(Bernstein et al. 2006a, Boyer et al. 2006, Fouse et al. 2008, Ku et al. 2008).
Localisation of PcG complexes to these genes is regulated by pluripotency factors,
Oct4, Nanog and Sox2 (Loh et al. 2006, Boyer et al. 2005a) (section 1.8.3). A recent
study in human ES showed that LSD1 is important in regulating H3K4 methylation
levels at bivalent genes, which is mediated by Oct4 and Nanog association (Adamo et
al. 2011).

81
1.9.3 Chromatin changes upon ES cell differentiation
ES cell differentiation requires a co-ordinated change in gene expression programmes
in order to restrict the new cell type to a particular lineage and diminish the capacity
to self-renew. This restriction in developmental potential is associated with
reorganisation of the transcriptional profile and a marked decrease in genome
plasticity. As chromatin state closely reflects transcriptional state in ES cells, proteins
involved in the chromatin regulation serve an important function in differentiation.
The feature that lineage-specific genes are cued for activation upon differentiation by
chromatin modification also emphasises the importance of histone-modifying
enzymes. Change in chromatin state necessitates the activation of some genes and
repression of others; hence, components of histone modification complexes are often
essential for development with knockout mice displaying embryonic lethality
(Hendrich et al. 2001, O'Carroll et al. 2001, Lagger et al. 2002, Dodge et al. 2004, Pasini
et al. 2004, Cowley et al. 2005, Kaji et al. 2006, Wang et al. 2007, Foster et al. 2010)
The pluripotency genes Oct4 and Nanog are associated with low levels of H3K27me3
in ES cells, consistent with their high expression (Boyer et al. 2006). Although these
genes become silenced upon ES cell differentiation, H3K27me3 levels at these genes
appear not to change significantly (Hattori et al. 2004, Boyer et al. 2006, Feldman et al.
2006). The accumulation of methylation at H3K9 and histone deacetylation underpins
the repression of Oct4, where ChIP analysis of the Oct4 promoter region in ES cells and
P19 embryonic carcinoma cells shows a dramatic increase of H3K9 methylation and a
concomitant decrease of H3K4 methylation and H3K9 acetylation during the first 48
82
hours of differentiation (Lee et al. 2004a, Feldman et al. 2006). The orphan nuclear
receptor GCNF is known to mediate Oct4, Nanog and Sox2 repression through direct
promoter binding, and depletion of GCNF prevents the repression Oct4 upon
differentiation (Fuhrmann et al. 2001, Gu et al. 2005). Ultimately, the critical
mechanism in Oct4 repression was identified in the Bergmann laboratory; which is the
targeting of the H3K9 KMT (G9a) to the Oct4 locus to initiate the facultative
heterochromatinisation via the binding of HP1 and for subsequent de novo
methylation at the promoter by the enzymes Dnmt3a/3b (Feldman et al. 2006).
However, subsequent work from the same lab demonstrated that a point mutation in
the G9a SET domain prevents heterochromatinisation, but still allows de novo
methylation and silencing of Oct4 (Epsztejn-Litman et al. 2008). This is because G9a
itself is capable of bringing about de novo methylation through recruitment of Dnmt3a
and Dnmt3b by its ankyrin domain (Epsztejn-Litman et al. 2008). The accumulation of
H3K9me3 is crucial for the repression of Nanog, where down-regulation of Nanog
expression is facilitated through decrease in expression of H3K9-specific KDMs,
JMJD1a and JMJD2c, which are activated by Oct4 binding (Loh et al. 2007).
Ablation of the HDAC-containing NuRD complex also restricts the ability to repress
Oct4, where Mbd3-/- ES cells fail to differentiate upon removal of LIF (Kaji et al. 2006).
This requirement for HDAC-containing repressor complexes for stem cell factor
repression is also emphasised by the report of prevention of differentiation in ES cells
treated with the an HDAC inhibitor (TSA) and the re-activation of the Oct4 gene in
trophoblast stem cells cultured with TSA (Hattori et al. 2004, Lee et al. 2004a).

83
Conversely, the mSin3A/HDAC complex positive regulates Nanog expression to
maintain Nanog expression in ES cells, where the knockdown of mSin3A, but not
HDAC1 and 2 alone, reduces Nanog expression (Baltus et al. 2009). This shows that
the co-repressor is essential for regulating the dynamics of histone acetylation at the
Nanog locus. Recent data from our lab has shown that HDAC1 is required to restrict
developmental gene expression. The deletion of HDAC1 in ES cells, which results in
reduced deacetylase activity associated with the Sin3A, NuRD and CoREST complexes,
causes precocious differentiation into mesodermal and ectodermal lineages in EBs
(Dovey et al. 2010b). These data underpin the need for further understanding of the
role of LSD1/CoREST/HDAC complex in ES cell gene expression, especially as deletion
of LSD1 in the mouse results in embryonic lethality at a similar time to Oct4, Nanog
and Sox2 (Nichols et al. 1998, Avilion et al. 2003, Mitsui et al. 2003). In fact, LSD1 and
CoREST are known to directly bind Oct4 in P19 embryonic carcinoma cells (derived
from the primitive ectoderm cells of the epiblast) and inhibition of LSD1 demethylase
activity with a non-selective monoamine oxidase inhibitor shows de-repression of
Oct4, accompanied by an increase in H3K4me2 (Lee et al. 2006). This data implies a
potential role for LSD1 in facilitating the repression of Oct4 upon ES cell
differentiation. This justifies an investigation of HDAC-containing complex function in
embryonic gene regulation.
Changes in development-specific gene expression are equally important as changes in
pluripotency factor expression in defining new transcriptional networks upon ES cell
differentiation. Expressional fates of these genes are also mediated through changes

84
in chromatin state and often operate through the bivalent chromatin domain at gene
promoters. The rapid switch of transcriptional states in response to developmental
cues relies on manipulation of H3K4 and H3K27 methylation at the appropriate genes.
HOX genes are well characterised bivalent genes and TrxG and PcG proteins are well-
known regulators of these genes (Ringrose & Paro 2004, Schuettengruber et al. 2007).
A decrease in the H3K27me3 mark during ES cell differentiation is mediated through
down-regulation of pluripotency factors, whose expression is required to recruit PcG
complexes (containing H3K27 KMT activity) to a significant subset of promoters (Lee et
al. 2006). As LSD1 has been identified as a binding protein of Oct4 in ES cells, it would
follow that Oct4 expression can direct LSD1-mediated gene repression to a subset of
developmental gene promoters in pluripotent cells (Pardo et al. 2010). Down-
regulation of Oct4 would facilitate the removal of LSD1/CoREST/HDAC from these
promoters upon differentiation, corresponding with an increase in H3K4 methylation
and gene expression. Thus, the genomic targeting of H3K27- and H3K4-specific
repressor complexes by core pluripotency factors may operate in concert to repress
developmental genes in pluripotent cells. In fact, the recently discovered H3K27me3
KDM (UTX) is found to associate with MLL2/3 complexes, revealing a mechanism for
transcriptional activation of developmental genes involving cycles of H3K4 methylation
by MLL2/3 linked to the demethylation of H3K27me2/me3 (Agger et al. 2007, De Santa
et al. 2007, Lee et al. 2007b). Overall, ES cell and embryonic loss of function analyses
of the H3K27-specific KMT, such as EZH2, may be comparable to loss of function
analyses of LSD1; an early indicator being that EZH2, SUZ12, EED and LSD1 knockout
mice die during the post-implantation period of embryogenesis, displaying severe
developmental defects (Faust et al. 1995, O'Carroll et al. 2001, Pasini et al. 2004, Wang

85
et al. 2007). This knowledge underpins investigation of LSD1 function within ES cells,
which are equivalent to the embryonic epiblast, in order to understand the cause of
developmental arrest in the absence of LSD1. The expectation would be to identify
overlap in genes that are de-repressed in the absence of PRC2 components and LSD1.

86
2 Materials and Methods
2.1 Chemicals and reagents
All commonly used stocks, solutions and buffers were prepared as outlined in Current
Protocols in Molecular Biology, Ausubel et al. 1994-1998 (Wiley). Unless otherwise
stated, all chemicals were supplied by Sigma Aldrich or Fisher Scientific, analytical
grade or higher.
2.2 Generation of LSD1 knock out mouse
The LSD1 knock out mouse was generated by Dr Shaun Cowley in the Bradley lab. An
E14 murine embryonic stem (ES) cell line containing a genetrap construct in the Lsd1
gene locus (clone X102) was obtained from the Sanger Institute Gene Trap Resource
(www.sanger.ac.uk/resources/mouse/sigtr/).

87
2.3 Growth and maintenance of mouse ES cells
The constituents of all reagents used in tissue culture are listed in 2.3.9.
2.3.1 Culture of ES cells
The majority of cellular analysis in this thesis was performed on the E14 mouse ES cell
line (hereby referred to as ES cells), kindly supplied by David Adams. ES cells were
grown on tissue culture grade plates from NUNC. Plates were coated in 0.1% Gelatin
solution in PBS for ES cell adherence. ES cells were maintained in an undifferentiated
state by culture in standard ES cell medium (M15+LIF) and were grown in a 5% CO2
incubator at 37°C. ES cells were monitored daily and media was changed when the
phenol red indicator in the media turned orange (indicating pH change due to build up
of respiration waste products).
2.3.2 Passage of ES cells by trypsinisation
Culture media was aspirated and cells were washed twice with room temperature PBS.
For cells in a 10cm plate, 3ml trypsin solution was added and the cells were incubated
at 37°C for 5min. 3ml of ES cell medium was added to neutralise the trypsin and the
suspension was passed through a pipette several times to disaggregate the cells. The
cells were centrifuged for 5min at 1200rpm, the supernatant aspirated, and the pellet
was re-suspended in an appropriate volume of ES cell medium for splitting into new
gelatinised plates. Newly plated cells were shaken from side-to-side in the plate to
ensure an even dispersal of cells in the dish.

88
For splitting of 96 well plates, 50l of trypsin was used and 150l of ES cell medium
added for inactivation after the 5min incubation at 37°C. 150l fresh media was
added to the wells of the new gelatinised 96-well plates. Cells were disaggregated by
pipette and a 1:4 split of the 200l volume into the new plates was usually employed.
2.3.3 Long term storage of ES cells
2.3.3.1 Freezing in cryovials
ES cells were frozen back when approximately 70% confluent in tissue culture plates.
Roughly 5x10⁶ cells were stored in each freezing vial in order to be revived into 10cm
plates as a 1:3 ratio split. In this instance, cells cultured on 6cm plates were frozen as
individual aliquots for 10cm plate revival (due to a 1:3 surface area ratio between 6cm
and 10cm plates). Cells were trypsinised as described in 2.3.2 and resuspended in
0.5ml ES cell medium and 0.5ml 2X freezing media per freezing aliquot. 1ml aliquots
were transferred to 1.5ml cryovials. Controlled freezing of cells at 1°C/min was
required, therefore vials were inserted into freezing pots filled with iso-propanol and
placed at -80°C. After 24-48hr, cryovials were transferred to liquid nitrogen storage
racks.
2.3.3.2 Freezing in 96-well plates
As with larger plates, ES cells were frozen back when approximately 70-80% confluent.
50l trypsin was added to the wells as in 2.3.2 and 50l 2X freezing media was used to
inactivate the trypsin following incubation. Cells were pipetted up and down, and

89
then the plate and lid were secured with tape and blue roll before freezing at 1°C/min
within a Tupperware in the -80°C freezer.
2.3.4 Revival of cells from frozen aliquots
Cryovials were removed from liquid nitrogen as required and thawed rapidly in a 37°C
water bath (the caps of the vials were loosened upon removal otherwise the vials were
likely to explode). The 1ml of thawed cells was transferred to 5ml of pre-warmed ES
cell medium in a 15ml falcon and centrifuged at 1200rpm for 5min to remove the
DMSO-containing freezing media. The cell pellet was re-suspended in ES cell medium
and plated on gelatine-coated plates as described in 2.3.1.
2.3.5 Extraction of DNA from ES cells
2.3.5.1 Extraction in from cells in 96-well plates
Cells were grown beyond confluency for genomic DNA harvesting in 96 well plates.
DNA was prepared by incubating cells in the wells at 55°C overnight in a humidity
chamber with 50l lysis buffer followed by precipitation with 50l isopropanol and
two washes with 70% ethanol. Precipitation of DNA in the bottom of the well was
achieved by vigorous shaking of the plate and careful decanting of the liquid onto
paper towel.

90
2.3.5.2 Extraction from cell pellets
The cell pellet from a 6-well plate was incubated in 200l cell lysis buffer by rotation in
the 55°C oven overnight. Addition of 200l isopropanol and spooling of DNA was
possible to precipitate DNA, which could be transferred by a pipette tip to new tubes
for washing with 70% ethanol. DNA was air-dried and re-dissolved in 100l TE. 20-
fold dilution was further required for PCR with 1l of DNA.
2.3.6 Extraction of RNA from ES cells and Embryoid bodies (EBs)
All chemicals and equipment used in RNA extraction were RNA grade and kept free of
RNAses by treatment with RNAseZap spray (Ambion). ES cells were harvested in 6-
well plates and EBs were collected in 1.5ml Eppendorf tubes for harvesting. Multiple
samples within a single experiment were routinely collected by harvesting in TRIzol
reagent and stored at -80°C until RNA extraction. For ES cells, 1ml of TRIzol was used
per 1x10⁷ cells. TRIzol was left on the plate for 5min before transfer to a 1.5ml
Eppendorf. The amount of TRIzol used for EBs was more arbitrary as exact cell
numbers were unknown; though 1ml TRIzol was often used per 15cm dish of EBs. Day
12-15 cultured EBs required further disruption with a handheld homogeniser. Three
10sec high speed pulses with 20sec pauses between was often sufficient to break up
the EBs.
Following thawing of -80°C-stored samples, 10min incubation at 37°C was allowed
before addition of chloroform (1/5 volume of the TRIzol reagent used). Samples were

91
inverted 10 times and left to stand at RT for 5min. The samples were then transferred
to Phase Lock Gel Heavy Tubes (5 Prime, Hamburg, GmbH) and centrifuged for 15min
at 13000rpm at 4°C. The top aqueous phase was carefully decanted into a 1.5ml
Eppendorf. An isopropanol volume equal to half that of the starting TRIzol volume
was added and tubes were inverted several times. Samples were left at 4°C for 30min
then centrifuged for 15min at 13000rpm at 4°C. The supernatant was removed, the
RNA pellet washed once in 70% EtOH, and centrifuged again for 10min at 7500rpm at
4°C. The supernatant was removed and the pellet left to air-dry for 10min. DEPC H2O
was used to re-dissolve the RNA, the volume of which depended on the quantity of
RNA. This volume was adjusted to normalise RNA concentrations following
NanodropTM quantification of nucleic acid. 37°C incubation and agitation ensured
complete dissolving of the RNA. Samples were snap-frozen for -80°C storage before
use. Phenol-choroform cleanup of the RNA was often employed.
2.3.7 Media and reagents used for ES cells and EB manipulations
M15+LIF ES cell media
Knockout DMEM + L-Glucose –Pyruvate (GIBCO) 500ml
Fetal Calf Serum (Hyclone) 90ml
100X Glutamine/Penicillin/Streptomycin 6ml
100mM-mercaptoethanol 600l
Leukaemia Inhibitory Factor (Synthesised In House) 50l

92
EB media
Knockout DMEM + L-Glucose –Pyruvate (GIBCO) 500ml
Fetal Calf Serum 90ml
100X Glutamine/Penicillin/Streptomycin 6ml
MEF media (M10)
DMEM + L-Glucose –Pyruvate (GIBCO) 445ml
Fetal Calf Serum 50ml
Glutamine/Penicillin/Streptomycin 100X (GIBCO) 5ml
2.5% trypsin solution
PBS (GIBCO) 500ml
0.5M EDTA 500l
Trypsin solution (Invitrogen) 20ml
Chicken serum (Invitrogen) 5ml
Trypsin was stored in 40ml aliquots at -20°C
2X Freezing Media
Knockout DMEM (GIBCO) 60%
Fetal Calf Serum (Hyclone) 20%
DMSO (Invitrogen) 20%
0.1% Gelatin
PBS (GIBCO) 500ml
2% Bovine gelatin solution 25ml

93
Retinoic acid differentiation media
M15+LIF 600ml
100mM ATRA 60l (10M working concentration)
N2B27 differentiation media
Knockout DMEM/F12 (GIBCO)
N2 supplement (Invitrogen)
B27 supplement (Invitrogen)
Cell lysis buffer
50mM Tris-HCl
100mM NaCl
10mM EDTA
1% SDS
0.2mg/ml Proteinase K

94
2.4 Polymerase Chain Reaction (PCR)
PCR was performed routinely to amplify DNA fragments for a variety of purposes
including genotyping ES cells and mice, cloning, generation of DNA probes, screening
transformed bacteria, gene expression analysis and fragment enrichment in chromatin
immunoprecipitation (ChIP) experiments. Thermo Taq (Thermo Scientific) was often
used for genomic PCR and bacterial screens; High Fidelity Platinum Taq (Invitrogen) or
KOD polymerase (Novagen) was often used in cloning; Universal probe library (Roche)
reagents were used for quantitative real-time PCR in gene expression analysis. A
standard genomic PCR program is shown below:
95°C 2min
95°C 30sec
Annealing temp 30sec 35 cycles
72°C 30sec
72°C 5min
12°C ∞
A typical 25l PCR reaction mix consisted of:
10X Buffer 2.5l
MgCl2 1.5l
dNTPs 0.15l
5’primer 0.25l
3’primer 0.25l
Taq 0.1l
ddH20 21l

95
2.5 Transfection of ES cells
2.5.1 Transfection of ES cells by electroporation
1x10⁷ cells were electroporated in 800l of ES cell media with 10l and 30l of
linearised targeting vector (from 50l elution following gel purification) within a 0.4ml
cuvette (Biorad). Electroporation was performed at 0.23V and 500F with a routinely
recorded time constant of 8.0.
2.5.2 Transfection of ES cells by lipofection
Transfection with Lipofectamine 2000 (Invitrogen) was performed in 6-well plates.
1x10⁶ cells were plated the night before transfection. Media was changed the next
morning and transfection reagents were set up. 6-10l of Lipofectamine was added to
250l of knockout DMEM in an Eppendorf and left for 5min. Meanwhile, 2-2.5g DNA
was added to 250l DMEM in a separate Eppendorf. The two volumes were combined
together and mixed by tapping. Lipofection complexes were left to form over 20min
before the mixture was pipetted drop-wise into the culture media. For transfection in
6cm plates, all the reagents were scale-up 2-fold.

96
2.6 Generation of conditional LSD1 knock-out ES cell lines
Specific details of the Lsd1 gene targeting strategy are described in Chapter 3.
Targeting vector electroporation methodology is described in 2.5.1.
2.6.1 pCAGGS-Flpe vector transfection
Removal of the selection cassette by FRT site recombination required expression of
the FLP recombinase in the cells. A fresh maxiprep of the pCAGGS-FLPe plasmid
(Buchholz et al. 1998) was made as described in section 2.13.6. The plasmid was
verified by HindIII restriction enzyme digestion to produce 6426bp and 1302bp bands.
Transfection of the plasmid was performed on ES cells in a 6-well plate using
Lipofectamine 2000 as described in section 2.5.2. 48hr after transfection the cells
were trypsinised and seeded at two different quantities of 20000 and 5000 cells in
10cm plates in the presence of 1-(2-deoxy-2-fluoro-1-D-arabinofuranosyl)-5-iodouracil
(FIAU).
2.6.2 ES cell colony screening
2.6.2.1 Targeted ES cell colony growth and colony picking
Following electroporation with the targeting vector, 5000 and 20000 ES cells were
plated in M15+LIF. The following day, selection drug was added to the culture media
and colonies were grown over 10-12 days until picking and screening for correct allele
targeting. For Lsd1 gene targeting, hygromycin was added to the media to a
concentration of 100g/ml. When colonies were of sufficient size, 96 were picked in

97
7ml PBS under the phase contrast microscope and transferred into 50l trypsin in
wells of a 96-well round-bottomed plate. Cells were allowed to trypsinise until 50l of
M15+LIF was added to each well and the total volume of each well was transferred to
96-well for culture. Selected ES cells were grown for 3 days until passage into three
96-well plates. Two plates were allowed to grow to high confluence for DNA
preparation, with one plate frozen down in the -80°C freezer at 80% confluence. These
frozen cells would be recovered appropriately once targeted clones had been
identified by Southern blotting.
2.6.2.2 ‘HygTK’ cassette-removed ES cell growth and colony picking
Negative selection of clones containing the cassette was achieved by growing colonies
in the presence FIAU over 10-12 days. This drug selected for cells that did not express
thymidine kinase from the HygTK gene. Surviving colonies were picked as before and
cultured until passage for DNA preparation followed by Southern blotting and freezing
back. Six positive clones were selected for propagation into the Lsd1Lox/∆3 cell lines.
2.6.3 Deletion of exon 3 (3) from the targeted allele
Six targeted clones were revived into wells of 24-well plates and cultured for
generation of stocks of Lsd1Lox/∆3 cell lines. Once sufficient stocks had been generated
for freezing and analysis, specific cell numbers were plated in wells of 6-well plate for
an assessment of the time period for deletion of the LoxP site-flanked (floxed) region.
Induction of LoxP site recombination required the addition of 0.1M 4-OHT to the

98
culture media for 48hr. Genomic DNA was harvested from ES cells at specific time
points after the addition of 4-OHT. Time points and cell numbers plate were as
follows: 0hr, 2x10⁶; 6hr, 2x10⁶; 12hr, 2x10⁶; 24hr, 1x10⁶; 48hr, 0.5x10⁶; 72hr, 0.25x10⁶;
96hr, 0.25x10⁶. Cells were plated the night before the morning that the media was
supplemented with 4-OHT. Lsd1Lox/∆3 cells were harvested before 4-OHT addition as
time-point 0d. DNA was harvested as described (2.3.5) for Southern Blotting.
2.6.4 Genotyping of WT, Lox and 3 alleles by PCR
Genomic PCR was performed as described (2.4) on DNA extracted from ES cells (2.3.5).
Two PCR reactions using 2 combinations of 3 primers could identify WT, Lox and ∆3
alleles. The band sizes produced from PCR are as follows:
Primer 1 and 2: Lox 390bp , WT 280bp
Primer 1 and 3: ∆3 465bp , Lox 1427bp
2.6.5 Southern blotting to identify allelic genotypes
2.6.5.1 Southern Blotting
Southern blotting is a method routinely used in molecular biology for detection of a
specific DNA sequence in DNA samples. Southern Blotting was developed by Edwin
Southern in 1975 (Southern 1975). The method involves the restriction digestion of
DNA, followed by the transfer of electrophoresis-separated DNA to a membrane and
subsequent fragment detection by radiolabelled probe hybridisation. The result
identifies the DNA sequence that is complementary to the probe. With prior
knowledge of restriction enzyme cut sites, the size of the band detected reveals the

99
context of the complementary sequence, therefore allowing genotyping of DNA
sequences. The method is also semi-quantitative, indicating relative amounts of DNA
species that the complementary sequence is present in.
2.6.5.2 Strategy for identification of the Lsd1 targeted clones
A strategy using a 5’ external probe and an EcoRV restriction enzyme digest was used
to distinguish Lsd1+/Lox cells from Lsd1+/+ and LsdLox/∆3 cells from Lsd1+/∆3 in each allele
targeting step. Following DNA preparation, DNA was allowed to dry in a 30°C
incubator prior to EcoRV restriction enzyme (1.5l) digestion in the wells at 37°C
overnight. This digestion was performed in 50l.
2.6.5.3 Strategy for identification of ‘HygTK’ cassette-removed clones
Lsd1Lox/∆3 -Hyg∆TK needed to be distinguished from Lsd1Lox/∆3 cells and some possible
contaminating WT cells in mixed cell population colonies. A strategy involving an
internal 3’ probe and a HindIII restriction digest was developed. Probe hybridisation
would result in bands of the following sizes corresponding to each allelic genotype:
WT, 1.9kb; Lox, 2.6kb; Lox-Hyg∆TK, 5kb; ∆3, 1.9kb. The lack of 5kb band and presence
of a 2.6kb band would indicate ‘HygTK-out’ Lsd1Lox/∆3 cells.
The 380bp probe was synthesised by PCR from the targeting vector in 50l reactions
(2.4). Primers used were: LSD1_3_Int1 and LSD1_3_Int2. The probe was gel extracted
and purified using Qiagen Gel Extraction Kit according to manufacturer’s instructions

100
and quantified by NanodropTM. Genomic DNA was harvested in 96-well plates
(2.3.5.1). HindIII digestion of genomic DNA in 96-well plates and allele
characterisation using an internal probe was performed.
2.6.5.4 Strategy for identification of deletion of exon 3
DNA was prepared by incubating cells at 55°C with lysis buffer (10mM Tris pH 7.5,
10mM EDTA, 10mM NaCl, 0.5% SDS, 200g/ml Proteinase K) followed by precipitation
with isopropanol and two washes with 70% ethanol. For Southern blotting 5g of
genomic DNA was digested overnight with StuI restriction enzyme before hybridisation
using a dCTP32 labelled 3’ internal probe (for details on probe location see Chapter 3,
Figure 3.3).
2.6.5.5 Agarose gel electrophoresis for Southern blotting
Following digestion of DNA in 50l volumes, 10l of 6X DNA loading buffer (60mM Tris
pH7.5, Glycerol, Bromophenol blue) was added and the entire volume loaded onto an
0.8% agarose gel for resolution of digested genomic DNA. The DNA was resolved at
20V overnight. Resolution of larger fragments required the DNA to be
electrophoresed a significant distance. This distance was decided on when
appropriately required. The following day the gel was viewed on the UV
transilluminator to ensure complete digestion of DNA and location of the DNA ladder.
The gel was washed once in distilled water to remove the ethidium bromide (EtBr) and
then twice in alkaline transfer buffer (1M NaCl, 0.4M NaOH). The apparatus for

101
capillary transfer onto Hybond XL membrane in alkaline transfer buffer was
subsequently assembled.
2.6.5.6 DNA Transfer onto the nylon membrane
Hybond XL membrane was equilibriated in alkaline transfer buffer before capillary
transfer apparatus was set up. The transfer was usually performed overnight. The
following day the position of the wells was marked onto the membrane in pencil and
the membrane was neutralised with two 15min washes in neutralisation buffer (1M
NaCl, 0.5M Tris-HCl pH 6.8). The membrane was then dried in the 37°C incubator
before hybridisation. A pre-hybridisation step was required by incubation of the
membrane for 1hr at 65°C in hybridisation buffer (Amersham). Membrane pre-hyb
and hybridisation was carried out in a roller bottle in the hybridisation oven.
2.6.5.7 DNA Probe labelling
The double stranded probe required radiolabelling by the incorporation of dCTP32.
Firstly, 25ng of the probe was diluted in 45l of TE (10mM Tris pH7.5, 1mM EDTA). The
double stranded probe had to first be denatured by boiling at 95°C for 6min. It was
then quenched on ice for 5min before transfer to the radiation area and addition of
1.85Bq (5l) of dCTP32 and random primer, dNTPs and Klenow mix (Amersham
Bioscience). The labelling reaction was allowed to occur for 1hr before purification of
the labelled probe through a sepharose column (Amersham). The purified probe was
then monitored for radiolabel incorporation; at least 30% incorporation was deemed

102
acceptable to proceed with. Finally the probe was boiled at 95°C prior to addition to
the hybridisation buffer in the roller bottle.
2.6.5.8 Hybridisation, washing and developing of the membrane
Hybridisation occurred overnight at 65°C by rotation of the roller bottle in the
hybridisation oven. The following day the buffer was poured away down the
designated sink and the radioactivity of the membrane was monitored. The
membrane was washed twice in 2X SSC/0.2% SDS buffer at RT and then twice in 0.2X
SSC/0.1%SDS buffer at 65°C. The membrane was exposed to X-ray film in a cassette
placed at -80°C overnight, then developed.
2.6.6 Analysis of LSD1 protein deletion
Three independent Lsd1Lox/∆3 cell lines from the six clones recovered were initially
analysed for LSD1 protein deletion and cell growth characteristics. Immunoblot
figures in results chapters show data from a single cell line, which is representative of
the three independent clones. ES cell protein was harvested as described in 2.11.
Antibodies used in Western blotting are indicated in Table A1.
2.6.7 Growth curve analysis of ES cells
Once the protein deletion had been assessed, 5 day frozen cells were recovered for 3
days then plated to analyse the growth rate of Lsd1∆3/∆3 cells compared to controls. To
assess the proliferative potential of ES cell lines 2.5 x 10⁴ cells were seeded in triplicate

103
in 6-well plates 8 days after induction of LSD1 protein deletion and counted each day
over 5 days using a haemocytometer. Two days into the growth rate analysis, cells
were harvested for propidium iodide (PI) staining to assess the cell cycle profile by
FACS, as described in 2.10.

104
2.7 DNA methylation analysis by Southern Blot
2.7.1 Restriction digestion and gel electrophoresis
Genomic DNA was harvested from Lsd1Lox/∆3 and Lsd1∆3 /∆3 cells at the appropriate time
points. 20µg DNA was digested with HpaII and 20µg with Msp1, using 30µl of the
correct NEB buffer, 6µl enzyme, and sufficient dH2O to make a total reaction volume
of 300µl. Samples were incubated at 37°C for 3 hours, before another 3µl enzyme was
added and they were left at 37°C overnight. HpaII and MspI are isoschizomers (cutting
site: C↓CG↑G), but HpaII is methylation-sensitive and will only cut when the
recognition sequence is not methylated. MspI will cut regardless of the presence of
methylation at the recognition sequence. Thus, because the enzymes cut at regular
intervals (roughly every 250bp), the difference in restriction digestion between the
two enzymes is proportional to the amount of CpG methylation in the DNA sample.
After digestion, the samples were precipitated, air-dried, resuspended in 40µl TE. The
DNA concentration was quantified and 5µg of each sample was loaded and run
overnight at 20V on a 1% agarose gel. When the samples had migrated 16-18cm from
the wells, the gel was photographed to check for even loading. The gel was then
washed twice for 10min on the shaker in depurination solution (0.2M HCl, 1M NaCl).
This reduced the molecular weight of any very large fragments so that they could be
transferred more easily onto the membrane. The gel was then washed twice for 10min
in alkaline transfer buffer before capillary transfer and hybridisation (2.6.5.6-2.6.5.8).
The IAP DNA probe used in the hybridisation was kindly provided by Dr Christine
Armstrong.

105
2.8 Generation of Lsd1Lox/∆3 Mouse Embryonic Fibroblasts (MEFs)
Lsd1Lox/∆3; ROSA26CreER-PURO ES cells were tested for Mycoplasma by the Geneta Service
at the University of Leicester before preparation for blastcocyst injection. Chimaeric
animals were born and their embryos were harvested at E14.5 for MEFs by standard
protocols. MEFs were cultured in M10 media with puromycin to select for MEFs
containing puroR gene at the ROSA26 locus. Genomic PCR was performed to identify
successful selection of Lsd1Lox/∆3 MEFs using primers 1 and 2 and primers 1 and 3 as
described in 2.4 and 2.6.5. LoxP recombination and protein deletion timecourse
experiments were carried out as with ES cells (2.6.5 and 2.6.7). Genomic PCR was
performed to assess deletion of exon 3 using primers 1 and 2.

106
2.9 ES cell in vitro differentiation analysis
All three original cell lines were assessed for in vitro differentiation potential. In order
to ensure no residual LIF remained in the culture media when transferring cells to LIF-
free culture conditions, ES cells were trypsinised and washed twice in PBS before
plating at low density or as hanging drops in fresh MI5 without LIF. In all of the
differentiation studies except differentiation in N2B27 media (Ying & Smith 2003), the
media contain 15% FCS. Alkaline phosphatase staining was accessed under the
microscope and methylene blue staining was assessed by eye. EB number at 5 days
could be counted under the microscope at low magnification. EB diameters were
measured using the scale bar in the Leica® microscope software.
2.9.1 Alkaline Phosphatase and Colony Formation Assays
For alkaline phosphatase assays, cells were plated at 7 x 10² cells per well in 6-well
plates in the presence of LIF. After overnight culture, cells were cultured in the
presence or absence of LIF for 6 days. They were fixed with 4% formaldehyde for
2min, washed twice in PBS + 0.1% Tween (T0.1), and stained with 1ml of a commercial
Alkaline Phosphatase Assay Reagent (Millipore) for stem cell colony identification. This
reagent required prior combination of Fast Red Violet, Napthol and water in a ratio of
2:1:1. Cells were incubated at RT in the dark for 15min followed by a final wash in
PBS- T0.1. Undifferentiated and mixed colonies that had strong and intermediate
purple staining, respectively, were counted. Differentiated colonies that were often
totally unstained were difficult to identify; hence colonies were counterstained with

107
methylene blue and counted to calculate the total number of colonies and identify the
number of differentiated colonies.
2.9.2 Differentiation of ES cells as Embryoid Bodies
Embryoid bodies (EBs) were created by suspending 600 cells in 15l hanging drops on
15cm tissue culture dishes for 48 hours. Cell aggregates were washed down and
carefully collected in PBS then transferred to low-adherence 15cm petri dishes. Plates
were maintained in the CO2 incubator on a shaking platform to allow the development
of EBs. RNA was harvested from EBs at specific time points by homogenisation in
TRIzol and chloroform phase separation in phase lock gel tubes as described in 2.3.6.
Cellular RNA was precipitated using isopropanol and glycogen carrier. RNA was
extracted under strict RNase-free conditions and the quantity and quality of RNA
recovered was analysed on the NanodropTM spectrophotometer. Further quality
control was performed by agarose gel electrophoresis; RNA was routinely of a very
good quality. RNA samples were all normalised to 0.5g/l concentrations for cDNA
synthesis (2.12.1). Methods for qRT-PCR using the Roche Universal Probe Library
system of the Roche Light Cyclers are explained in detail in 2.12.3.
2.9.3 Differentiation with Retinoic Acid
For retinoic acid (RA) differentiation, ES cells were seeded in 6cm plates with M15+LIF
the day before commencement of the experiment. Differential cell numbers were
plated as follows: day 0, 1x10⁶; day 1, 0.75x10⁶; day 2, 0.5x10⁶; day 3 0.3x10⁶. The

108
following day, day 0 cells were harvested and 10mMRA was diluted to 10M in fresh
MI5 for addition to the other plates. Cells were harvested for cell cycle analysis as
described in 2.10.1.
2.9.4 Differentiation in N2B27 media
The same numbers of ES cells were plated in 6cm plates as for RA differentiation. On
day 0, fresh N2B27+LIF was replaced with N2B27 without LIF. Cells were harvested for
cell cycle analysis as described in 2.10.1.
109
2.10 Flow Cytometry
2.10.1 Cell cycle analysis by propidium iodide (PI) staining
For FACS analysis of RA and N2B27 differentiation, the media was not changed before
harvesting of cells. The culture media was collected in addition to trypsinised cells in
order to harvest dead cells floating in the media. All cells were centrifuged and fixed
by drop-wise addition of -20°C-stored 70% ethanol under vortex. Cells were washed
twice in PBS at RT and propidium iodide was diluted from a 2.5mg/ml stock in PBS to a
working concentration of 50g/ml. 1mg/ml RNaseA was also diluted in the PI solution
for use at 10g/ml. 500l staining solution was added to each fixed ES cell sample and
incubated at 37°C for 30-60min. FACS analysis was performed on the BD FACSCanto®.
Individual ES cells were identified based on FSC and SSC characteristics and PI staining
measured on the PE-A (FL-2) laser channel to reveal DNA content of cells.
2.10.2 GFP analysis
ES cells were harvested by trypsinisation (2.3.2) and washed twice in PBS at RT. Live
cells were immediately analysed on the BD FACSCanto® where viable ES cells were
gated based on FSC and SSC, followed by measurement of GFP expression in individual
cells by the FITC-A channel.

110
2.11 Protein and enzymatic analysis
2.11.1 Immunoblotting
Nuclear extracts were routinely prepared from ES cells for Western blotting. 3 x 10⁷ ES
cells were washed twice in PBS at RT before scraping in ice cold PBS. Cells were
washed twice more in cold PBS then resuspended in 1ml hypotonic buffer (10mM KCl,
20mM Hepes pH7.9, 1mM EDTA, protease inhibitor cocktail (Sigma #P8340) and 1mM
DTT) and incubated on ice for 20min. Extracts were then vortexed for 10sec with 50l
10% NP-40 and nuclei spun down at 1500rpm for 5min at 4°C. Supernatant was
removed and nuclei were resuspended in 200l of hypertonic lysis buffer (400mM
NaCl, 20mM Hepes pH7.9, 10mM EDTA, 25% glycerol, 1mM DTT and protease inhibitor
cocktail) for direct immunoblotting. Nuclear debris was spun down at 13000rpm for
10min at 4°C. Protein concentrations were quantified using Bradford reagent in a
spectrophotometer. Immunoblots were performed on 20g of nuclear extract
resolved by 4-12% gradient SDS-PAGE. A list of antibodies used for immunoblotting is
presented in Table A1.
2.11.2 Immunoprecipitation
For immunoprecipitation, ES cells were cultured in 10cm plates until 80% confluent,
washed twice in PBS at RT, scraped in 5ml cold PBS, pelleted at 1200rpm, washed
again in cold PBS and then 500l ‘IP buffer’ was used to extract whole cell protein
(250mM NaCl, 10mM Hepes pH7.9, 1mM EDTA, 0.5% NP-40 and protease inhibitors).
Protein was extract with rotation at 4C for 1hr. Extracts were then cleared of cell
debris by centrifugation at 13000rpm for 15min. Protein concentration was then

111
quantified using Bradford reagent on a spectrophotometer. 100g of extract was
incubated overnight at 4˚C with 1g antibody. 50l of Protein-G sepharose beads (GE
Life Sciences) were washed twice in cold PBS then blocked with 1% BSA in PBS at 4°C
overnight. The following day the beads and immune complexes were combined for
4hr at 4˚C. After 3 washes in IP buffer, beads were split into two aliquots. One aliquot
was used to assess the enzymatic activity of the immunoprecipitates using a
commercially available deacetylase assay (Active Motif, Rixensart, Belgium); 20l
taken from 80l bead suspension in HDAC assay buffer was used for each reaction in
25l reactions using 5M assay substrate. Colorimetric reactions were performed in
96-well plates and analysed on a plate reader in the Toxicology Unit. The remaining
aliquot was resolved by SDS-PAGE and probed with antibodies raised against known
components of the immunoprecipitated complexes. A list of antibodies used for
immunoblotting of immunoprecipitates is presented in Appendix Table A1.
2.11.3 In-House Histone Deacetylase assay
Following three washes of immunoprecipitations, the beads were resuspended in
10mM Tris, 1mM EDTA, 50mM NaCl and split in two. One half of the beads was then
resuspended in 130l deacetylase buffer (20mM Tris pH8, 0.25mM EDTA, 250mM
NaCl) and this suspension was aliquoted into three 40l quantities in wells of 96-well
plate reader plate. Once all of the samples were applied to the 96-well plate, 30mM
BOC acetyl-lysine substrate was dilute to 500M (1:60) in deacetylase buffer. 10l of
the substrate was simultaneously added, using a multichannel pipette, to the wells;
making a final substrate concentration of 100M. The plate was incubated in the dark

112
at 37°C for 90min. Quenching of the deacetylase activity and trypsin cleavage of the
substrate was then performed by adding 50l of 2M Trichostatin A (TSA; 200M
stock) in 10g/l trypsin solution (made up in 50mM Tris pH7.5, 100mM NaCl). The
samples were left to develop at room temperature for 15min before measuring the
fluorescence with an excitation wavelength of 360nm and an emission wavelength of
470nm on a plate reader.
2.11.4 Histone extraction and modification analysis
Acid extraction of histones was performed to assess global histone modification levels
on denatured acid soluble histones. Cells were harvested by scraping in 5ml of ice cold
PBS from 10cm plates and nuclei were harvested as described (2.11.1). Acid extraction
was performed according to the method described by Shechter et al. 2007 and all
steps were carried out at 4°C. Nuclei were resuspended in 400l of 0.2M H2SO4 and
incubated by rotation overnight. The following day the samples were centrifuged at
13000rpm for 10min, supernatant removed and 132l TCA added drop-wise to the
pellets. This suspension was incubated on ice for 30min and the chromatin
centrifuged at 13000rpm for 10min. Chromatin was washed twice with ice-cold
acetone and resuspended in ddH2O. This extract could be flash-frozen and -80°C
stored. 5g of extract was loaded in each lane and membranes probed using a panel
of antibodies raised against a number of histone modifications (Table A1).
Membranes were scanned using the Odyssey Infrared Imaging System and
quantification of proteins achieved using the appropriate IRDye conjugated secondary
antibodies (LiCOR Biosciences, Cambridge, UK). Histone modification bands were

113
normalised to the total histone H3 loading and analysis was done using three
biological replicates grown from single cell cloned colonies.
2.11.5 Protein stability assay
2x10⁶ cells were plated in 6cm plates overnight. The following day, MG132 was added
to the culture media at a concentration of 30M. Control plates with no inhibitor
were also used. Cells were harvested after 4hr for Western blotting as described
(2.11.1)
2.11.6 Histone demethylase assay
Measurement of the demethylase activity of ES cell extracts was performed in 50l
reaction volumes with 5l of extract (10g) using a fluorescent histone demethylase
assay kit (Active Motif). 4X assay buffer was diluted to 1X and 12.5l was used in each
reaction. A recombinant histone H3K4me2 substrate used in the assay mimics a
native histone substrate. This peptide was reconstituted in 500l 1X assay buffer and
5l was used in each reaction. Reactions were made up to 50l with ddH2O with the
substrate added last. Reactions were incubated at 37°C for 1hr. 50ml fluorescent
detection reagent was then added and incubated for 30-60min. The Detection
Reagent reacted with each formaldeyde molecule to generate a fluorescent signal
equivalent to the overall production of formaldehyde. The fluorescent signal was
measured using a fluorescent microplate reader with an excitation wavelength of 410
nm and an emission wavelength of 480 nm.

114
2.12 Reverse Transcription, Microarray Hybridisation and
Quantitative Real-Time PCR.
2.12.1 Reverse transcription
Total RNA was isolated from ES cells and embryos using a standard TRIzol (Invitrogen)
protocol and Phase Lock Gel Heavy Tubes as described (2.3.6). Total RNA was reverse
transcribed using Q-Script one step Supermix (Quanta Biosciences, Gaithersburg, MD,
USA). All RNA samples were quantified and assessed for purity using the NanodropTM
spectrophotometer then normalised to a concentration of 0.5g/l. 2g was also run
on an agarose gel to assess the integrity of the RNA prep. 2g total RNA was used in a
40l Q-Script cDNA synthesis reaction. This reaction consisted of 5X reaction buffer,
the appropriate volume of RNA and DEPC H2O. cDNA synthesis was carried out in the
thermocycler with the following conditions:
25°C 5 minutes
42°C 30 minutes
85°C 5 minutes
4°C Hold
2.12.2 Illumina Microarray
2.12.2.1 Array hybridisation
RNA preparation was performed according to manufacturer’s instructions using the
Illumina TotalPrep® RNA amplification kit which ultimately generated hundreds to
thousands of biotinylated, antisense RNA copies of each mRNA in a sample for
hybridisation with the Illumina Bead Array. The kit is based on the RNA amplification
protocol developed in the laboratory of James Eberwine (Vangelder et al. 1990) . The

115
procedure consists of reverse transcription with an oligo(dT) primer bearing a T7
promoter using a reverse transcriptase enzyme engineered to produce higher yields of
first strand cDNA than wild type enzymes. This enzyme catalyzes the synthesis of
virtually full-length cDNA, which is the best way to ensure production of reproducible
microarray samples. The cDNA then undergoes second strand synthesis and clean-up
to become a template for in vitro transcription (IVT) with T7 RNA Polymerase. Biotin
UTP is included to generate labelled cRNA from the IVT.
Microarray gene expression profiling in Lsd1Lox/∆3 cells and Lsd1∆3/∆3 cells 10 days after
induction of LSD1 deletion was performed using the Illumina MouseWG-6 v2
Expression BeadChip platform. The hybridisation was performed in triplicate using
three biological clones A6, B12 and C10. The MouseWG-6 v2.0 BeadChip platform
covers 45,200 different mouse transcripts. The probe content is derived from the
NCBI RefSeq database, supplemented with probes from Mouse Exonic Evidence Based
Oligonucleotide (MEEBO) set a well as examplar protein-coding sequence described in
the RIKEN FANTOM2 database. Six samples in total were prepared and these were
hybridised simultaneously to each of the six identical bead arrays present on the
BeadChip. The probe design consists of nanoscopic beads tiled on the array, which are
attached with a short address sequence with a 50bp gene-specific probe linked.
Labelled nucleic acid prepared from the total RNA were hybridised to the probes on
the Chip at 65°C. The amount of hybridised cRNAs is detected using the biotin label
and corresponds to original transcript abundance. The Sentrix Barcodes of the Chips
used were 4769263016A—F.

116
2.12.2.2 Illumina microarray quality control
Illumina quality control was performed by Cambridge Genomics Services. The
hybridisation controls showed an increasing intensity from low to high of at least 3
fold at each step; therefore the hybridization performed well. The stringency of the
hybridisation was also shown to be good through comparing mismatch probes to
perfect match probes. The biotin labelled showed a good level of intensity and the
background to noise ratio was very acceptable. Regarding the efficacy of the samples,
small variations in degradation and signals of the samples was reported, confirming
that the assay was a success.
2.12.2.3 Analysis of microarray hybridisation
Raw expression data was managed in Illumina BeadStudio and statistical and analyses
were performed by Dr Jinli Luo (MRC Toxicology Unit) using ArrayTrack bioinformatics
software, developed by USFDA (http://www.fda.gov/ScienceResearch/Bioinformatics
Tools/Arraytrack/default.htm). Data was normalised using a median scaling
normalisation method and then the triplicate Lsd1Lox/∆3 versus Lsd1∆3/∆3 datasets were
compared using a Welch T-test. Significant differentially expressed genes were
selected using p<0.05 and 1.4-fold change cut-offs. A gene ontology analysis of
PANTHER terms for biological processes was performed using DAVID bioinformatics
software (Huang et al. 2009).

117
2.12.3 Quantitative Realtime PCR (qRT-PCR) for gene expression analyses
For the relative quantification of gene expression, primers were designed using the
Roche-applied-science assay design centre online. GAPDH was used as an endogenous
control gene in the single-well multiplex PCR with which to normalise target gene Ct
values to. All primer sequences are displayed in the appendix along with the specific
hydrolysis probe from a set of 110, which was used in the reaction (Appendix Table
A2). Probes consisted of Lock Nucleic Acid technology, which upon binding of the
reaction amplicon, released a HEX or FAM fluorophore. This also provided an
additional level of specificity to the gene of interest in the qRT-PCR. 2l of diluted
cDNA was used in all subsequent multiplex qRT-PCR reactions using the Light Cycler
Probes Master Mix (Roche) as per the manufacturer’s instructions. All reactions were
performed in wells of 96-well PCR plates on the Roche Light Cycler 480 under the
following conditions: initial denaturation for 10min at 94°C followed by 40 cycles of
10sec at 94°C, 20sec at 55°C and 5sec at 72°C. Advanced relative quantification
analysis using the Roche LightCycler software generated a relative expression value
based on the comparative Ct calculations ([delta][delta]Ct = [delta]Ct,sample -
[delta]Ct,reference).

118
2.13 Chromatin Immunoprecipitation
For ChIP assays, many features of experimentation had to be optimised. These
included cell number used per IP, method and time period of crosslinking, chromatin
extraction, chromatin sonication procedure and purification of DNA. Additionally PCR
primers had to be tested before use on the immunoprecipitated DNA. Varying cell
numbers (ranging from 0.5x10⁶ to 1.5x10⁶) were originally tested for length of time
required to shear chromatin to enrich for 300-500bp fragments. Ultimately 1x10⁶ cells
were used and sonication times for single crosslinking (10min formaldehyde) and
double crosslinking (10min EGS + 10min formaldehyde) were evaluated. 15min
sonication using the Diagenode Bioruptor on setting ‘HIGH’ (2.13.2) was seen to be
optimum for single crosslinking and 20 minutes was needed for double crosslinking
(Chapter 4; Figure 4.15).
2.13.1 Crosslinking of cells for chromatin immunoprecipitation
2.13.1.1 Double crosslinking
For LSD1 and CoREST ChIP, double crosslinking was performed as described by (Zeng
et al. 2006). Approximately 1x10⁷ ES cells were used for each IP (half of 80%
confluent 10cm plate) and cells were crosslinked as a monolayer in a 10cm plate. For
double crosslinking a 20mM EGS stock (Thermo #21565) was prepared in DMSO on the
day of use (0.0913g in 10ml). The culture media was aspirated and 6.5ml PBS added to
the 10cm plate. 0.5ml EGS (20mM→1.5mM) was added to the PBS and incubated at
RT for 10min. 1/16 volume fresh 16% formaldehyde (1% final) was then added
directly to the plate and incubated with intermittent swirling at RT for 10min. 1/10

119
volume 1.25M glycine was added to quench crosslinking (0.125M final concentration).
The plate was aspirated and washed twice in PBS at RT. Cells were then scraped in
5ml cold PBS and spun down at 1200rpm before either snap-freezing on liquid
nitrogen and -80°C storage or proceeding immediately to chromatin extraction.
2.13.1.2 Single crosslinking
Single crosslinking with formaldehyde only was performed for histone modification
immunoprecipitation. Single crosslinking required 1/16 dilution of 16% formaldehyde
directly in culture media and incubation with swirling for 10min. Quenching, washing
and scraping were performed as described (2.13.1.1).
2.13.1.3 Cell extract preparation
Protease inhibitor cocktail (Sigma) was added to all lysis buffers immediately before
use (333X dilution). Cell pellets for individual IPs were resuspended in 500l of LB1.
Cells were lysed by rotation at 4°C for 10min and nuclei were spun down at 1,350xg for
5min at 4°C. Nuclear pellets were resuspended in 500l of LB2 and rotated gently at
RT for 10min. Insoluble chromatin was isolated by spinning at 1,350xg for 5min at 4°C.
This was resuspended in 300l LB3, which was the sonication buffer.
2.13.2 Sonication of cells using the Diagenode Bioruptor 200
300l volumes of chromatin extracts were transferred to pre-chilled 1.5ml
polycarbonate tubes prior to sonication. The Diagenode Bioruptor 200 water bath was

120
pre-chilled with ice up to an hour before use. This ice was allowed to melt to ice slush,
and topped up with cold water just prior to sonication. Six tubes could be sonicated
simultaneously; therefore three Lsd1Lox/∆3 samples and three Lsd1∆3/∆3 samples were
sonicated in the same run. The Bioruptor setting was on HIGH for all sonications.
20min with 30sec on-off intermittency was required for ideal chromatin shearing in
double crosslinked samples, with 15min adequate for single crosslinked samples. This
procedure was optimised by testing different times and cell numbers for each
crosslinking method. Following sonication, 30l 10% triton was added to sonicated
lysate and briefly vortexed. Samples were then centrifuged at 20,000xg for 10min at
4°C to pellet unsheared debris. Lsd1Lox/∆3 and Lsd1∆3/∆3 samples were combined and
50l of sonicated material was removed for input DNA (stored at -20°C). Equal
volumes were then removed for individual IPs.
2.13.3 Immunoprecipitation
20l protein G-conjugated Dynabeads were used for each IP. Beads were washed
twice with 1ml block solution (0.5% BSA in PBS) and collected each time using the
Dynal magnetic stand. Supernatant was aspirated once the beads had been collected
to the side of the tube. The beads were resuspended in 250l block solution and 2g
of appropriate antibody was added (Appendix Table A1). For histone modification
ChIP, 2l of unmodified histone H3 peptide (Abcam) was also added to the bead
suspension. Antibody was linked to protein G by overnight incubation on the rotating
wheel at 4°C. The following day, blocked beads were collected and resuspended in
100l of block buffer, before being combined with sonicated chromatin.

121
Immunoprecipitation of chromatin was allowed to occur over overnight at 4°C on the
rotating wheel.
2.13.4 Washing and processing of immunoprecipitated material
2.13.4.1 Washing and crosslink reversal
The following day all apparatus was taken into the cold room for washing of the IPs.
Each sample was washed with 1ml RIPA buffer 3 times, each time rotating the tubes,
collecting the beads and aspirating. A final wash with 1ml TE + 50mM NaCl was
performed before centrifuging the samples at 960xg for 3min at 4°C. TE/NaCl buffer
was carefully removed and 210l of elution buffer was added. Chromatin was eluted
from the antibody by 15min incubation at 65°C; with brief vortexing to resuspend the
beads every 2min. Centrifugation at 16,000xg for 1min at RT pelleted the beads in
order to remove 200l of the supernatant to a new labelled tube. The input sample
reserved after sonication were thawed and 150l (3 volumes) of elution buffer added.
Crosslinking was reversed by adding 8l 5M NaCl (200mM final) and incubating O/N at
65°C.
2.13.4.2 Digestion of protein and RNA and DNA purification
200l of TE was added to each tube the following day to dilute the SDS in the elution
buffer. RNAseA was added to each sample to a final concentration of 0.2mg/ml and
incubated for 2hr at 37°C. Proteinase K was then added to each sample to a final
concentration of 0.2mg/ml and incubated for 2hr at 55°C. DNA was column purified

122
through Qiagen PCR purification columns and eluted in 50l TE. The input samples
were diluted 10-fold.
2.13.5 Buffers used in ChIP
Block solution
PBS, 0.5% (w/v) IgG-free BSA (Sigma)
LB1
50mM Hepes-KOH pH7.5, 140mM NaCl, 1mM EDTA, 10% Glycerol, 0.5% NP-40, 0.25%
Triton X-100
LB2
10mM Tris-HCl pH8, 200mM NaCl, 1mM EDTA, 0.5mM EGTA
LB3
10mM Tris-HCl pH8, 100mM NaCl, 1mM EDTA, 0.5mM EGTA, 0.1% Na-deoxycholate,
0.5% N-lauroylsarcosine
RIPA buffer
50mM Hepes-KOH pH7.5, 500mM LiCl, 1mM EDTA, 1% NP-40, 0.7% Sodium
Deoxycholate
TE + NaCl buffer
10mM Tris-HCl pH8.0, 1mM EDTA, 50mM NaCl
Elution Buffer
50mM Tris-HCl pH8.0, 10mM EDTA, 1% SDS
2.13.6 Testing of histone antibodies for ChIP
In order to test the quality of histone modification antibodies in immunoprecipitation,
ChIP was performed using H3K4me2 (Sigma D5692) and H3K4me3 (Millipore 07-473)

123
antibodies and PCR was performed using primers to genomic regions with known
levels of H3K4 methylation (Table 2.1). Purified DNA was quantified by NanodropTM in
order to use equal input and IP DNA amounts in qRT-PCR. 40 cycle amplification was
performed using the Corbett 6000 machine with Rotor-Gene 6000 series software
analysis. Histone modification IP “cycle threshold” (Ct) values were subtracted from
the input Ct values and this figure was converted into the fold enrichment by 2(input Ct –IP
Ct).
Name Genomic locus Forward Reverse Reference
K4me3–
#1 Chr17:14505850
-145506450
AAGCTGAGTGAGCCTGTGCT AAGGGTATTTGCTGCCACTG Mikkelsen et al. 2006
K4me3–
#2 Chr19:6212200
-6212800
TACCCTGTGGATTAGGCACC ATGGGTATCTGGCACTGAGC Mikkelsen et al. 2006
K4me3+
#1 Chr9:110150000
-110150600
CTGAGAGCAGCACAATGGTC ACTCGAGTCAGCCAATCAGG Mikkelsen et al. 2006
K4me3+
#2 Oct4 promoter GGCTCTCCAGAGGATGGCTGAG TCGGATGCCCCATCGCA Stock et al. 2008
Table 2.1 Details of primers used for validation of histone modification antibodies
2.13.7 Validation of ChIP primers
Having examined the quality of antibodies to be used in ChIP, primers for the DNA
fragment enrichment of candidate genes also had to be tested. Primers used to
identify regions at the Brachyury locus were tested at two concentrations (700nM and
350nM) on input DNA (undiluted and 1:10 dilution). The dilution of input DNA was
required to imitate the speculated potential yields of immunoprecipitated DNA. The
observation of a single peak upon melt curve analysis was indicative of amplification of
a single PCR product and the height peaks was indicative of the amount of product

124
produced. Six primer pairs were tests between -600bp and +400bp of the TSS, with
two pairs identified as being appropriate for PCR analysis (Table 2.2). A number of
primer pairs between -3000bp and -4500bp were also assessed, with one chosen to be
used in PCR analysis of a region remote to the Brachyury TSS (Table 2.2).
2.13.8 Quantitative RT-PCR for ChIP
PCR was performed in triplicate with 1l DNA using Dynamo SYBR Green (Finnzymes)
in the Corbett 6000 machine. Reactions were assembled in 20l volumes (10l SYBR
Green mix, 1l 14M/7M primer mix, 8ml PCR grade H2O, 1l DNA). Primers were
initially tested using input DNA (undiluted and 1/10 diluted) to assess the number and
amount of products amplified (melt curve/gel electrophoresis) using 700nM and
350nM working concentrations.
PCR amplification cycle was as follows:
95°C 2min
95°C 20sec
58°C* 20sec 40 cycles
72°C 25sec
4°C ∞
(*4°C touchdown to 58°C @ 1°C/min first 4 cycles of annealing)

125
Region Forward Reverse Conc.
Brachyury -4500 gcttgctcagtggttaaggc gaggtggagttacaggcagc 350nM
Brachyury -600 agggtcgctatctgttcgtct actgccactaactcccacctc 350nM
Brachyury +400 gagcatcttttcttcccaacc gaaagttcccgagaaaccaag 700nM
Hoxd8 -4000 tcctccccatatccttctcc agtccccctctttcatcagg 700nM
Hoxd8 -400 catttacccttgacgcactg tctcagcgacactcatgtcc 350nM
RASGRP3 -3700 tgctgtgaagggattgtcac gaggaaggggaggatgtagc 700nM
RASGRP3 -150 ggttccgttttcttgctgac gccacttgattagcatgcag 350nM
RASGRP3 +400 tgtggtcttcttagccacactg ccatcagctcctatccactg 700nM
Table 2.2 Details of primers used in ChIP qRT-PCR

126
2.14 Molecular Biology and Engineering of DNA constructs
2.14.1 Bacterial cultures
Lucigen E.cloni® 10G chemically competent cells were used for transformation and
propagation of plasmids. 2YT media was routinely used to grow bacterial cultures.
2YT:
Bacto-tryptone 16g
Bacto-yeast 10g
NaCl 5g
H2O 1000ml
Where appropriate:
Ampicillin 100g/ml
Kanamycin 100g/ml
2.14.2 Storage and revival of bacterial strains
Transformed bacterial strains were prepared as glycerol stocks for long-term storage
at -80°C. 500l of bacteria grown overnight in 2TY media with the appropriate
antibiotic was added to 500l sterile 50% glycerol in a screw-top 1.5ml cryovial. This
was vortexed briefly to ensure mixing, then stored at -80°C. Revival of bacterial strains
was achieved by picking a small quantity of the glycerol stock with a pipette tip and
inoculating an agar plate or 5ml 2YT starter culture for overnight incubation at 37°C.

127
2.14.3 Culturing bacterial cells for miniprep and maxiprep
Bacterial colonies were picked from agar plates with a sterile pipette tip and used to
inoculate 5ml of 2YT media containing an appropriate antibiotic. These were
incubated overnight in a 37°C shaker before either eing used to harvest plasmids by
miniprep or to inoculate a larger culture volume for plasmid maxipreps. 100l from
the starter culture was diluted in 100ml of 2YT with antibiotic for overnight incubation
for maxiprep.
2.14.4 Plasmid purification from bacteria
All extraction methods are adapted from the original alkaline lysis plasmid purification
method described in (Birnboim et al. 1979) , followed by binding of plasmid DNA to an
anion-exchange resin under appropriate salt and pH conditions and subsequent
elution in elution buffer or TE. Minipreps were prepared using Qiagen Plasmid
Miniprep kits as per manufacturer’s instructions. Endotoxin-free maxipreps were
prepared using NucleoBond® EF kits (Macherey-Nagel GmbH) according to
manufacturer’s instructions. Eluted maxiprep plasmid DNA was further purified by
isopropanol precipitation, ethanol wash and re-dissolving in endotoxin-free H2O
(2.3.5).
2.14.5 Generation of EGFP-LSD1 fusions by PROTEX cloning service
Full length LSD1 and all mutants required fusion to EGFP by cloning into pLEIC21. PCR
primers were designed with arms of homology to amplify various forms of LSD1 from
an IMAGe cDNA clone for insertion into pLEIC21 (family D homology vector with

128
Kanamycin resistance gene). Mutagenesis to make the demethylase dead LSD1 was
also performed by the PROTEX service, thought mutagenesis to create the TOWER
domain mutation was performed by 2-step PCR in house once the LSD1FL was cloned
into pLEIC21. Plasmids were purified from bacterial clones as described (2.14.4) and
DNA sequencing of the EGFP-LSD1 fusion inserts was performed by the PNACL service
using pLEIC21-Seq-F and pLEIC21-Seq-R primers to ensure of no mutations. Glycerol
stocks were subsequently made as described (2.14.2).
2.14.6 Amplification of large regions by PCR
The pCAGGS vector backbone was linearised by PCR amplification using KOD Hot Start
Polymerase (Novagen). The EGFP-LSD1 fusions were also amplified with arms of
homology to the pCAGGS vectors in order to insert the fusion into this vector using the
In-FusionTM Advantage PCR cloning kit (Clontech) for CAG promoter-driven expression
in ES cells. 50l PCR reaction contained: 5l 10X KOD buffer, 2l 25mM MgSO4, 5l
dNTPs (2mM each), 2.5l DMSO, 1.5l 5’primer (125ng), 1.5l 3’ primer (125ng), 1l
KOD Hot Start DNA polymerase (1U/l), 1ml DNA template (20ng) and 31.5l PCR
grade H2O. A typical PCR cycle for amplification of large templates with KOD is shown
below:
95°C 2min
95°C 20sec
Annealing temp 10sec 30 cycles
70°C 25sec/kb
70°C 10min
12°C ∞

129
5l of vector PCR product was analysed by agarose gel electrophoresis and the
remainder was purified with QIAGEN PCR purification columns and quantified by
NanodropTM.
Table 2.3 Primers used in generation of LSD1 rescue constructs
2.14.7 In-FusionTM advanced PCR cloning
5l of EGFP-LSD1 PCR product was also analysed by gel electrophoresis and then 5l of
unpurified PCR product was treated with 2l of Cloning Enhancer. This mix was
incubated at 37°C for 15min, then at 80°C for 15min in the thermocycler. Cloning
Enhancer treated PCR product was either stored at -20°C or used immediately in the
In-Fusion Cloning procedure. The pCAGGs vector backbone was 5.1kb therefore 150ng
of vector was used in the reaction.

130
The In-Fusion reaction was set up in 10l as follows:
5X In-Fusion Reaction Buffer 2l
In-Fusion Enzyme 1l
Vector 2l (70ng/l)
PCR insert 2l
ddH2O 3l
Total volume 10l
Positive and negative control reactions were also set up utilising a 2kb control insert
(40ng/l) and a linearised pUC19 control vector (50ng/l) supplied with the Clontech
reagents. The reactions were incubated for 15min at 37°C, followed by 15min at 50°C,
then placed on ice. The reaction volume was then made up to 50l with TE buffer and
mixed well.
2.14.8 Transformation of In-FusionTM cloned plasmid into bacterial cells
Nutrients agar plates were prepared by microwave heating Agar + Ampicillin sachets ()
in 200ml of ddH2O to dissolve. Agar was then poured into 10cm bacterial petri dishes
under the Bunsen flame and allowed to set. E. cloni® chemically competent cells
(Lucigen) were removed from the -80°C freezer and allowed to thaw completely on
wet ice for 10min. One Eppendorf per transformation was pre-chilled on ice and 40l
of cells were added to each. 2.5l of the diluted In Fusion reactions and 1ml of a pUC
plasmid as a transformation positive control were added to the cells on stirred briefly
with the pipette tip. Cells were incubated for 30min on ice. Following this, they were

131
heat-shocked for 45sec at 42°C then returned to ice for 2min. 960l of RT Recovery
Medium (Lucigen) was added and the cells in medium transferred to 10ml miniculture
tubes to shake at 200rpm for 1hr at 37°C. Transformed cells were spread on agar
plates and incubated overnight at 37°C. 100l were plated with the remainder
centrifuged and re-suspended in another 100l of Recovery Medium and also plated.
2.14.9 PCR screening of transformed bacteria
Colony PCR was performed using primers spanning between the vector backbone and
the insert to identify bacterial colonies successfully transformed with plasmids.

132
3 Generation of Conditional LSD1 Knockout Mouse Embryonic
Stem Cells and Examination of Growth and In Vitro
Differentiation Potential
3.1 Introduction
LSD1 knockout mice were originally generated by Shaun Cowley in the laboratory of
Allan Bradley. The initial embryos analyses were also performed by Shaun Cowley
(Figure 3.1). The rationale for creating a mouse embryonic stem (ES) cell line where
LSD1 can be conditionally inactivated was underpinned by the failure for LSD1
knockout embryos to develop beyond embryonic day (E)6.5. This block in
development suggested that is would not be possible to derive viable ES cells from the
inner cells mass. Notably, conditional knockout mice are create to circumvent
embryonic lethality. Working with cells in culture is more feasible than early stage
embryo analyses and because ES cells represent cells in the embryonic epiblast and
differentiation of ES cells into embryoid bodies (EBs) is comparable to events in early
embryogenesis, this in vitro approach was pursued. Two LSD1 knockout mice have
been previously published: the first knockout was generated in the Rosenfeld lab,
using gene targeting in mouse ES cells, however the embryonic phenotype was not
studied, and rather a pituitary-specific gene deletion was generated for investigation
(Wang et al. 2007). The second knockout was published from the lab of Taipeng Chen
in early 2009 along with conditional LSD1 knockout ES cells (Wang et al. 2009). In this
study, ES cells were used to investigate causes of early embryonic lethality; however in
vitro differentiation assays and transcriptional analyses were not pursued in this study.
Reduced Dnmt1 protein levels and subsequent genomic DNA hypomethylation

133
accounted for the essential requirement for LSD1 during embryogenesis (Wang et al.
2009). However, disparities between the time of embryonic lethality in LSD1 knockout
and Dnmt1 knockout mice raised questions about additional functions of LSD1 in the
early embryo, specifically as a transcription regulator (Li et al. 1992, Wang et al. 2009).
The ability to induce the deletion of LSD1 in ES cells would allow a more accurate
evaluation of resulting transcriptional changes and would provide a way to remove
LSD1 at stages of various differentiation assays to understand the role of LSD1 during
specific lineage commitment programs.
The LSD1 knockout mouse was created using a genetrap insertion into the 3rd exon of
the Lsd1 gene (Figure 3.1A). This genetrap truncates the open reading frame within
the SWIRM domain (Figure 3.1B), prior to the amine oxidase-like (AOL) domain, which
is essential for the catalytic activity of LSD1, as described in the Chapter 1 (Shi et al.
2004, Forneris et al. 2005b). Intercrosses between Lsd1+/-geo mice produced only
wild-type and heterozygous animals, with no Lsd1-geo/-geo pups, indicating an
embryonic lethal phenotype and consistent with previous reports of LSD1 knockout
mice (Fig 3.1C) (Wang et al. 2007, Wang et al. 2009). The latest point at which Lsd1-
geo/-geo embryos were observed was at E6.5 (Figure 3.1C). At E6.5, Lsd1-geo/-geo
embryos were much reduced in size compared to Lsd1+/-geo controls, which suggested
a developmental block around this stage (Figure 3.1G). Published histological analysis
of sagittal sections has demonstrated that these embryos blocked in development are
resorbed by E7.5 (Wang et al. 2009). The introduction of the -galactosidase open
reading frame into the endogenous Lsd1 locus allowed an approximation of LSD1

134
protein expression patterns in cells and embryos using X-gal staining. The expression
of LSD1 at E8.5 and E10.5 was essentially ubiquitous (Figure 3.1D and E). Interestingly,
X-gal staining of the early post-implantation embryo revealed that LSD1 expression
was restricted to the embryonic portion of the embryo, with little or no expression in
the extra-embryonic tissue (Figure 3.1F and G). Based on the expression pattern of
LSD1 and the developmental block at or before E6.5, it seems that the essential
embryonic role of LSD1 is restricted to the developing epiblast. LSD1 is expressed in
the inner cell mass (ICM) at the blastocyst stage (Figure 3.1I and J); supporting a role in
epiblast cell development. This is also consistent with the genetrap selection in ES
cells, as they are derived from the ICM (Chapter 1). It is possible however that lack of
LSD1 expression may perturb the development of the extra-embryonic
trophectoderm, as this region is clearly underdeveloped at E6.5.
At the E3.5-6.5 stage of development, the epiblast consists of primitive ectoderm cells
that are rapidly proliferating before the onset of intense differentiation at gastrulation
(Snow 1977). The restriction of expression to this region, the reduced size of E6.5
Lsd1-geo/-geo embryos and reports from Wang et al. that LSD1 knockout ES cells have
reduced proliferation in culture, suggested that cells lacking LSD1 may have reduced
proliferative potential (Wang et al. 2009). Proliferative capacity of inner cell mass
(ICM) cells was therefore tested by performing blastocyst outgrowth assays. This
involved isolating WT, Lsd1+/-geo and Lsd1-geo/-geo blastocysts, plating them on gelatin-
coated plates and culturing them under standard ES cell conditions for 6 days. Similar
expansion of the ICM cells was observed (Figure 3.1K, L and M), thus implying that loss

135
of LSD1 does not cause significant reduction in proliferation. Embryonic lethality was
therefore likely not resultant of a general defect in cell cycle progression. Importantly,
this assay indicated that ES cells could be derived from the ICM and cultured as cells
that retain pluripotent capacity. However, very few X-gal negative trophoblast cells
appear as giant cells surrounding the ICM outgrowth (Figure 3.1M), confirming a
defect in extra-embryonic tissue development in Lsd1-geo/-geo embryos (Figure 3.1G).
As a consequence of these results, further investigation into the developmental role of
LSD1 in the embryonic epiblast was proposed.
ES cells are the in vitro counterpart of epiblast cells and their differentiation mimics
many of the processes and changes in gene expression associated with embryonic
development (Doetschman et al. 1985). The conditional deletion of LSD1 allows
temporal control of removal of a functioning gene in ES cells and conditional knockout
mouse embryonic fibroblasts (MEFs) were also generated using the established
Lsd1Lox/∆3 ES cell lines. ES cell culture and differentiation provides a platform to
investigate the role of a gene in cellular proliferation, differentiation and death and
gene expression. EB differentiation is a well established system of differentiation that
was primarily utilised in this investigation. Interestingly, Wang et al. reported that
LSD1 knockout ES cells failed to form EBs and instead underwent massive cell death
upon differentiation. Our analyses, before these observations were published,
indicated that EBs could form, providing reasons to follow this route of investigation.
The ability to form EBs confirms the potential to construct primitive endoderm
through molecular mechanisms discussed in Chapter 1.7. The successful formation of

136
EBs would also lead to questions of the role of LSD1 in processes of primitive ectoderm
development or possibly at the onset of gastrulation. To answer these questions, gene
expression throughout differentiation was analysed to understand which cell types
could develop in the absence of LSD1. Gene expression data could potentially reveal
involvement of LSD1 within transcriptional networks in the early embryo.

137
Figure 3.1 A genetrap insertion inactivates Lsd1 and reveals embryo-specific expression.
(A) A mouse ES cell line containing a genetrap vector in the Lsd1 gene locus (clone X102)
was used to generate Lsd1+/-geo mice. The genetrap vector, which consists of a splice
acceptor site linked to a -geo selectable marker, was found to be inserted into the 3rd
intron of the Lsd1 gene on chromosome 4. (B) Schematic representation of the LSD1.
The position of the genetrap insertion (STOP), downstream of exon 3, truncates the LSD1
open reading frame within the SWIRM domain. This is prior to the amine oxidase-like
(AOL) domain, which is essential for the catalytic activity of LSD1 (C) Table shows that
LSD1 KO embryos are not viable beyond E6.5 with empty deciduas being prevalent from
e6.5 to e10.5. At E6.5. Lsd1-geo/-geo pups are born at numbers below Mendelian ratios.
(D), Wild-type and Lsd1+/-geo embryos isolated at E10.5 (Theiler Stage (TS) 17) were
stained with X-gal to detect -galactodase reporter gene activity approximating to Lsd1
expression patterns. Similar X-gal staining experiments were performed using embryos
isolated at, (E), E8.5 (TS 12), (F), E8.0 dpc (TS 11), (G), E6.5 (TS 8) and (H-J), E3.5 (TS 5).
The genotype of individual embryos is indicated (K-M) X-gal staining of blastocyst out-
growth cultures shows WT, Lsd1+/-geo and Lsd1-geo/-geo that were isolated at E3.5 and
cultured on gelatinized plates for 6 days. On day 6 blastocyst outgrowth cultures were
stained with X-gal to determine -galactosidase expression and then genotyped.
138
3.2 Results
3.2.1 Generation of conditional LSD1 knockout ES cell lines
An E14 embryonic stem (ES) cell line expressing a Cre/Estrogen Receptor fusion
protein from the ROSA26 locus was used to generate Lsd1Lox/∆3; ROSA26CreER-Puro cells.
E14 ES cells and the ROSA26-CreER targeting vector were kindly provided by David
Adams. Sequential gene targeting using an Lsd1cKO-HygTK targeting vector, which
conferred Hygromycin resistance, was performed (Figure 3.2). This targeting vector
was created by Dr Shaun Cowley in the lab of Alan Bradley. CreER-puroR expressing ES
cells were used for targeting of the endogenous LSD1 locus with the vector, which was
linearised by Ahd1 restriction enzyme digestion for genomic integration by
homologous recombination. The 5’ arm of homology was 4.4kb and the 3’ arm of
homology was 4.6kb. Following electroporation, all cells were added to 10cm plates
with fresh M15+LIF. The following day the media was supplemented with hygromycin,
to select for integration of the vector containing the HygTK gene, and puromycin, to
maintain selection for CreER-puroR cells. The first allele was targeted to create
Lsd1+/Lox cells, in which exon 3 was flanked by LoxP sites. This allele was deleted by
addition of 4-hydroxytamoxifen (4-OHT) to the cells to activate the Cre, generating
Lsd1+/∆3 cells (lacking exon 3) before targeting of the second allele with the Lsd1cKO-
HygTK vector to create Lsd1Lox/∆3 cells. This generated ES cells where one allele has
exon 3 flanked by two LoxP sites and the second allele has exon 3 deleted (Figure 3.2).
Correct gene targeting (verified by Southern blotting as described in Chapter 2.5.6.4)
resulted in a modified locus in which exon 3 of the endogenous LSD1 gene was flanked
by 34bp LoxP sites. Deletion of exon 3 from the second allele was achieved using the

139
same Cre-Lox method as when deleting exon 3 from the first allele. The knockout was
designed so that removal of exon 3 would disrupt the open reading frame of LSD1, and
hense a premature stop codon is introduced into exon 4. Transcription from the LSD1
promoter can occur, though synthesis of full length protein is impeded. This truncated
protein was expected to be degraded though, due to proteolytic mechanisms that
function to remove incorrectly synthesised or folded protein. Regardless of these
mechanisms, any protein synthesised would be non-functional due to lack of the
enzymatic amine oxidase like (AOL) domain and most significantly, the catalytically
essential lysine 661 residue, encoded by exon 15 (Lee et al. 2005).

140
Figure 3.2 Generation of the conditional LSD1 knockout ES cell line (A)E14 mouse ES cells expressing a Cre/ER fusion protein from the ROSA26locus were used to produce a 4-OHT inducible conditional knockout system.Exon 3 of the Lsd1 gene was flanked by LoxP sites (floxed) using an‘Lsd1cKO-Hyg∆TK’ gene targeting vector. The size of the arms of homologyand postion of the LoxP and FRT sites is indicated. Correct gene targetingwas assessed by Southern blotting using a 5’ external probe following anEcoRV restriction digest of genomic DNA. Targeted Lsd1+/Lox-Hyg∆TK, cells weretreated with 4-OHT for 24 hours to induce LoxP site recombination andgenerate Lsd1+/∆3 cells. Successfully recombined cells were identified bySouthern blotting using an internal probe and StuI digest. The second WTallele of the Lsd1+/∆3 cells was targeted with the same targeting vector toproduce Lsd1Lox-Hyg∆TK/∆3 cells. Transient transfection of the Lsd1Lox-Hyg∆TK/∆3
cells with the FLPe recombinase was used to remove the selection cassetteand produce Lsd1Lox/∆3 cells used in the study.

141
3.2.1.1 Removal of the HygTK selection cassette from Lsd1Lox-HygTK/3 ES cells
Before the targeted ES cells could be used for deletion of the floxed region, a clone of
Lsd1Lox-HygTK/3 ES cells was transfected with the FLPe recombinase to remove the FRT
site-flanked selection cassette from the Lox-HygTK allele (Figure 3.3A). FRT site
recombination is known to be less efficient than LoxP site recombination and
therefore following transfection, single cell plating and colony growth, 96 colonies
were picked and screened. Generation of pure Lsd1Lox/∆3 ES cell clones depended on
the efficiency of plasmid transfection, the level of FLPe expression in individual cells,
the efficiency of recombination, efficacy of drug selection and preventing
contamination between ES cell colonies during colony picking. Colonies were grown
under the selection of 1-(2-deoxy-2-fluoro-1-D-arabinofuranosyl)-5-iodouracil (FIAU)
and puromycin, which would kill cells expressing thymidine kinase (TK) and cells no
longer expressing puroR from the ROSA26 locus, respectively. As expected, many cells
were killed as they retained the HygTK cassette, which indicated that either
transfection efficiency was much less than 100% and/or FRT site recombination was
inefficient.
Following screening of surviving colonies by Southern blotting using an internal probe
(Figure 3.3A), 100% of targeted cells lacked the HygTK cassette. This was no surprise,
as FIAU selection had killed thymidine kinase-expressing cells (Figure 3.3B lane 1, 6,7
and 9). However, the Southern blotting result identified the WT allele in addition to
Lox and 3 alleles, which had an identical size to the ∆3 allele (1.9kb) (Figure 3.3B
lanes 2, 3, 4, 5 and 8). This contamination occurred as some Lsd1+/3 cells, which had
142
not been effectively targeted with the Lsd1cKO-HygTK vector in the second round of
targeting and had survived hygromycin selection, remained in the population of ES
cells. Six Lsd1Lox/∆3 clones were analysed by genomic PCR to ensure no confirm these
cells possessed the targeted Lsd1Lox allele (Figure 3.3C). These six Lsd1Lox/3 clones
were chosen for further experimentation and established in cell culture from which to
induce recombination in the floxed allele (to generate Lsd13/3 cells); these clones
were A6, B12, C10, E5, F4 and G9.

143
CGCATGTTTACTTTCTAGGCCCCGCTTCTTTAATTTGGTTACTAGGTTGTACAACCACTGCTAAATTTGTATTACAAAATACTATATATAGTTAAGATGACAGGTCAGTTATACTGGAATTTTGAAACACAGGAAATTTGGGCTAAAGTAAGTGAACGGAAATGTCTTGTTTTATAAATTGTGAAGTTTCTCTGGCTAGTGATTGCTTTTTTCTGCAGTGATGGTGTCTGTTCCCTGATTCAGTTAGGTCTTAGCCTTGTGACTTGAGCACAACTGAAATAAAACCGTGACTGAGTTTTATTTCCTAGGATGGAAAGAGAAAGCAGCTGTGAGGAGGTTGAAGGGCTTGAGCCATGGCTGTGGGAGA
6
5
4
3
2
1.5
1
Lsd1Lox-HygTK
Lsd1Lox
Lsd13 and Lsd1WT
Figure 3.3 Identification of Lsd1Lox/3 ES cell clones by Southern blotting.(A) Identification of Lsd1Lox/∆3 clones with successfully removed HygTKselection cassette was achieved by Southern blotting using digestion withHindIII and hybridisation with an 367bp internal probe (B) A representationof the screen of 96 clones shows that the original cell used for transfectionof FLPe were a mix of Lsd1+/3 and Lsd1Lox-HygTK/3 cells and that deletion ofthe selection cassette from Lsd1Lox-HygTK allele was very efficient (4 out of 4clones; lanes 1, 6, 7 and 9). (C) PCR was performed on six Lsd1Lox/3 clonesused in the study to confirm the genotype.
C
B
A
Internal probe
1 2 3 4 5 6 7 8 9
Lsd1Lox
Lsd1WT
307bp
239bp
1 2 3 4 5 6 ‒
100
200
300400500600
bp
kb

144
3.2.1.2 Deletion of exon 3 from Lsd1Lox/3 ES cells
Cre-Lox recombination is a special type of site-specific recombination developed by
Brian Sauer, commonly used to spatially and temporally control the deletion of a gene
in animals and cells (Sauer 1987, Sauer & Henderson 1988). Cre (Causes
recombination) is a 343 amino acid protein with a C-terminus similar in structure to
the domain in the Integrase family of enzymes isolated from lamba () phage. The
LoxP (locus of X over P1) site is a 34bp DNA sequence from the Bacteriophage P1. An
8bp sequence exists between two 13bp palindromic sequences. The result of
recombination depends on the orientation of the LoxP sites. Inverted LoxP sites will
cause an inversion of a DNA sequence, while direct repeats of LoxP sites cause a
deletion event. The latter mechanism is employed in these experiments. The CreERT
system was pioneered by Pierre Chambon in the 1990s (Metzger et al. 1995, Feil et al.
1996). Cre fused to the Estrogen Receptor (ER) renders it inactive in the cytoplasm of
these ES cells (Figure 3.4A). It is sequestered by the Hsp70 chaperone protein until the
activation of this nuclear receptor by ligand binding allows release from Hsp70 and
translocation into the nucleus. The ER ligand-binding domain contains a mutation
(glutamic acid 521→arginine) however, which renders it unresponsive to the
endogenous 17-estrodial (estrogen) ligand. It can only be activated by 4-hydroxy
tamoxifen (4-OHT), an analogue of estrogen. Translocation of Cre into the nucleus will
permit access to the LoxP sites within the genomic sequence (Figure 3.4A). Addition
of 0.1M 4-OHT to the culture media for 48hr caused translocation of the Cre/ER
fusion protein (Figure 3.4A) and subsequent Cre-mediated recombination of the LoxP
sites within 6 hours of addition of 4-OHT (Figure 3.4B). Genomic DNA was harvested
for Southern blotting as described in Chapter 2. The generation of Lsd1∆3/∆3cells could

145
also be recognised by PCR (Figure 3.4C) though this method would not allow
quantification of the amount of a DNA species. However, PCR was used to confirm
future generation of Lsd1∆3/∆3 cells, as it was a more convenient procedure.

146
Figure 3.4 Full recombination of LoxP sites occurs within 6 hours of addition of4-OHT. (A) A schematic to show ligand-activation of CreER, which results intranslocation of Cre to the nucleus for catalysis of LoxP site recombination.Tandem LoxP site recombination causes removal of the floxed genomic DNAsequence, which contains exon 3 of LSD1. (B) LoxP site recombination wasidentified by Southern blotting. Hybridisation of an internal probe revealedshortening of DNA sequence following recombination to create the ∆3 allelefrom the Lox allele. Complete conversion of Lox into ∆3 is observed at 6 hours.(C) PCR to identify LoxP site recombination. Lane 1-4 shows PCR to genotypeLsd1Lox/∆3 and Lsd1∆3/∆3 cells. The Lox PCR generates a band of 390bp and the ∆3PCR generates a band of 500bp. The absence of 390bp band in Lox PCRindicates recombination. Lane 5 and 6 shows PCR on Lsd1Lox/∆3 control cells toensure both PCR reactions from master-mixes were successful in the genotyping.
B
Exon3LoxP LoxP
Exon4Exon2
LoxPExon2 Exon4
CreER
4-OHT
A
C L Lox/3 3/3
1 2 3 4 5 6
500bp
390bp
Lox/3

147
3.2.1.3 Deletion of LSD1 protein
Following confirmation that the genetic alteration of the Lox allele occurred by 6
hours, the half-life of LSD1 protein following exon deletion was analysed by harvesting
cellular protein from Lsd1Lox/∆3 cells + 4-OHT over a 10 day timecourse. This timescale
used was based on previous experience with conditional deletion of HDAC1, 2 and 8 in
the laboratory (Dovey et al. 2010a). LSD1 forms a stable protein complex with HDACs
(You et al. 2001, Shi et al. 2004); therefore a similar time period for complete
depletion of LSD1 was expected. Protein depletion relied on the inability to synthesise
full length protein from the mRNA as well as protein complex turnover to remove the
functioning cellular protein.
Progressive loss of LSD1 protein was observed over 4 days (Figure 3.5A). When
creating a knockout through single exon deletion, there is always the chance that exon
skipping mechanisms may allow production of a shortened, functional protein by
alternative splicing back into frame using a downstream exon. The frame of exon 5
starts with the same phase as the end of exon 2 (phase 1), therefore just one exon
could be skipped to splice exon 2 to exon 5 and resume the correct reading frame. As
well as this, the use of an alternative start codon, in the correct frame, downstream of
exon 3 could be utilised to produce a functional protein with an AOL domain. To
ensure that a shortened, possibly functional protein did not arise following exon 3
deletion, an antibody specific to an epitope at the C-terminus of LSD1 was used in
addition to an N-terminal antibody. This would recognise the possible accumulation of
a smaller protein throughout the timecourse of deletion. The C-terminal antibody was

148
used to assess the deletion over the timecourse and LSD1 protein appears to be
completely removed at 4 days post induction with no smaller protein observed (Figure
3.5A). The reduction in the level of LSD1 transcript (Figure 3.5B) is validation that a
successful nonsense mutation was created. This depletion of transcript is indicative of
nonsense mediated decay (NMD) as the 5’ and 3’ primers used in the qRT-PCR anneal
in exon 4 and 5 respectively, downstream of the exon deletion and the premature stop
codon, which is 14 codons into exon 4. The presence of a premature stop codon in
exon 4 before the final exon would be detected by mRNA surveillance mechanisms to
trigger the degradation of aberrant mRNA species and prevent the expression of
truncated proteins (Hentze & Kulozik 1999). However, the occurrence of exon 4
skipping would remove the 5’ primer binding site and may account for this result. This
was ruled out due to the lack of any smaller protein products in western blots and
microarray-identified reduction of LSD1 transcripts in Lsd1∆3/∆3 cells (Chapter 4).
Lsd1Lox/∆3 ES cells were used as control cells for much of the functional analysis. These
cells are heterozygous for Lsd1 and were considered an appropriate control genotype
to compare Lsd1∆3/∆3 cells to; as they showed identical levels of LSD1 protein
expression to WT cells (Figure 3.5C). Given the kinetics of exon 3 deletion and protein
half-life, in subsequent experiments Lsd1Lox/∆3 cells were compared to Lsd1 ∆3/∆3 cells at
7-15 days after 4-OHT treatment.

149
Figure 3.5 Induction of the conditional deletion results in loss
of LSD1 protein after 4 days. (A) Western blot shows ligand-
inducible deletion of LSD1 protein in nuclear extracts of
Lsd1Lox/3 ES cells. Cells were cultured for up to 10 days to
assess the timescale of protein depletion (0-2 days in the
presence of 4-OHT). The signal at 110kDa is lost over time with
no evidence of the appearance of a slightly smaller protein that
would result from alternative splicing from exon 2 to exon 5. -
actin was used to normalise for protein loading. (B)
Quantitative RT-PCT reveals a decrease in LSD1 mRNA levels due
to nonsense mediated decay following exon 3 deletion. (C)
Western blot shows that LSD1 protein levels are equivalent in
WT and Lsd1Lox/3 ES cells. Lsd1Lox/3 cells are used as a control
through the study of LSD1 function.
A
B
CWT Lox/∆3 ∆3/∆3
LSD1
-actin

150
3.2.2 Generation of LSD1-null MEFs
The question of whether ES cells that had undergone numerous rounds of targeting
and selection are still functionally pluripotent can be resolved by observing their ability
to contribute to the germ line of a mouse following blastocyst injection. In addition to
this, teratoma formation assays can be implemented to test if all three primary
lineages could develop from the pluripotent state. Mouse embryonic fibroblasts
(MEFs) can be harvested from chimeric embryos that develop from injected
blastocysts. Lsd1Lox/∆3; ROSA26CreER-Puro ES cells were injected into blastocysts by the
Geneta Gene Targeting and Transgenic Service at the University of Leicester. MEFs
were harvested from E14.5 chimaeras and cells were cultured in the presence of
puromycin to select for Lsd1Lox/∆3 cells over 4 days. Genomic PCR identified the
presence of a small amount of contaminating WT cells (Figure 3.6A), we therefore
continued to supplement the culture media with puromycin. Deletion of exon 3 within
the Lsd1Lox allele by 0.1M 4-OHT treatment was analysed over a 5 day timecourse.
PCR was used to assess the temporal nature of LoxP site recombination, which showed
that full recombination occurred by 3 days (Figure 3.6B). This method is not
quantitative; however the lack of any detectable amplified band at 3 days post 4-OHT
treatment suggested complete recombination of LoxP sites. The kinetics of LSD1
protein depletion in MEFs was similar to that observed in the Lsd1∆3/∆3 ES cells, where
LSD1 protein was lost by 4 days (Figure 3.6C). Lsd1∆3/∆3 MEFs were frozen back at day
5 after induction of deletion. These cells were not used further in functional analyses
due to time limitations; though they would provide a useful tool for study, as the

151
aspects of chromatin and histone modifications are different in MEFs to mouse ES
cells. Notably, these results validated that MEFs could be generated from ES cells used
in this investigation.
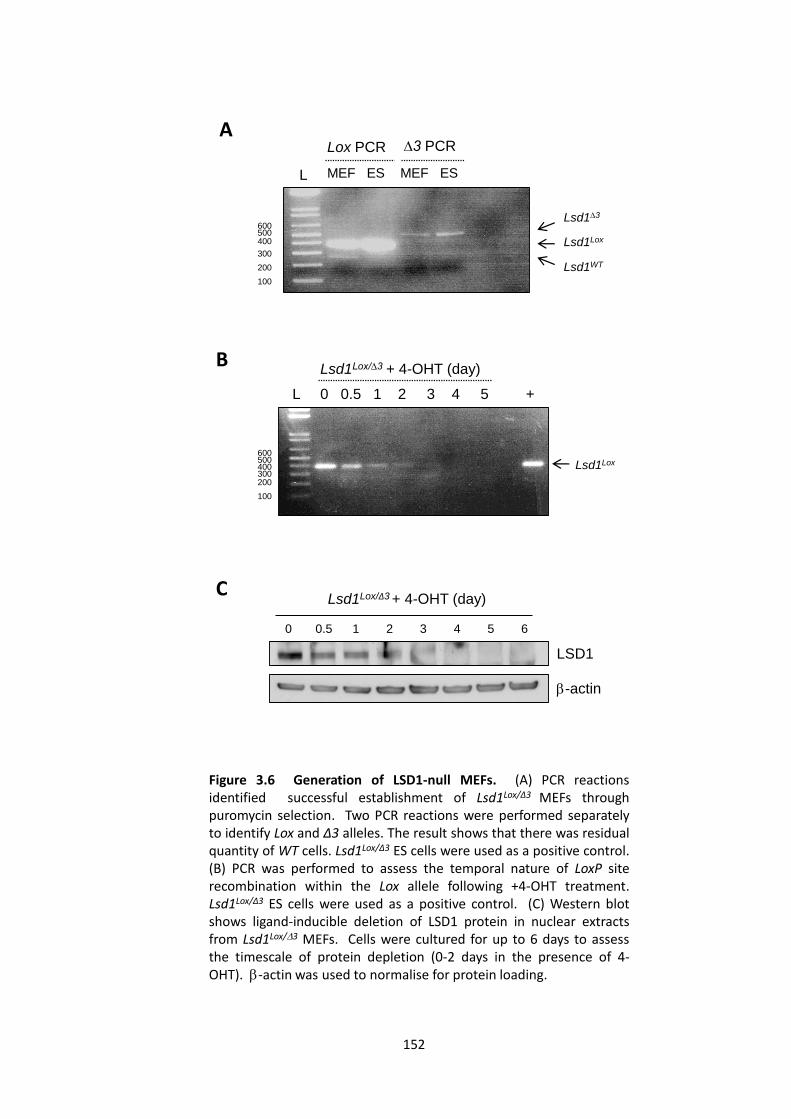
152
Figure 3.6 Generation of LSD1-null MEFs. (A) PCR reactionsidentified successful establishment of Lsd1Lox/∆3 MEFs throughpuromycin selection. Two PCR reactions were performed separatelyto identify Lox and ∆3 alleles. The result shows that there was residualquantity of WT cells. Lsd1Lox/∆3 ES cells were used as a positive control.(B) PCR was performed to assess the temporal nature of LoxP siterecombination within the Lox allele following +4-OHT treatment.Lsd1Lox/∆3 ES cells were used as a positive control. (C) Western blotshows ligand-inducible deletion of LSD1 protein in nuclear extractsfrom Lsd1Lox/3 MEFs. Cells were cultured for up to 6 days to assessthe timescale of protein depletion (0-2 days in the presence of 4-OHT). -actin was used to normalise for protein loading.
LSD1
-actin
0 0.5 1 2 3 4 5 6
Lsd1Lox/∆3 + 4-OHT (day)C
B
ALox PCR ∆3 PCR
MEF ES MEF ES
Lsd1Lox
Lsd1WT
Lsd1∆3
100
200
300
400500600
100
200300400500600
Lsd1Lox
0 0.5 1 2 3 4 5 +L
L
Lsd1Lox/∆3 + 4-OHT (day)

153
3.2.3 Analysis of undifferentiated LSD1 knockout ES cells
Analysis of the growth rate (Figure 3.7A) and cell cycle profile (Figure 3.7B) of Lsd1∆3/∆3
cells revealed that the deletion of LSD1 had little effect on the proliferative potential
of undifferentiated ES cells, consistent with the embryo outgrowth phenotype (Figure
3.1K-M). Over a 5 day period the rate of ES cell growth were very similar, which was
supported by similar numbers of cells identified in each stage of the cell cycle. Very
similar percentages of cells were undergoing cell death (6% v 7% cells with sub-G1
DNA content); 3% more Lsd1∆3/∆3 cells were in the G1 stage of the cell cycle; 28% and
30% of control and knockout cells, respectively, were within the period of DNA
replication (S-phase); and 6% less Lsd1∆3/∆3 cells were in mitosis (G2/M) (Figure 3.7B).
Discrepancies in the cell cycle percentages overall had little effect on rate of growth
(Figure 3.7A). The generation of LSD1 knockout MEFs (Figure 3.6) was performed with
the intention of investigating these results further.

154
Figure 3.7 Deletion of LSD1 has no effect on the growthrate and cell cycle profile. (A) The growth rate of theindicated cells was assessed by counting cells over a 5 dayperiod from initial plating of 2.5 x 10⁴ cells in 6cm plates.Lsd13/3 cells were plated at day 10 after induction of thedeletion. (B) Propidium iodide (PI) staining and FACSanalysis reveals similar cell cycle profiles of Lsd1Lox/3 andLsd13/3 ES cells. The percentage of cells with a sub-G1,G1 (2n), S-phase or G2/M) (4n) content is indicated.
A
B

155
Dnmt1 levels were assessed by Western blot due to the previous suggestion that LSD1
regulates Dnmt1 levels in ES cells (Wang et al. 2009). Dnmt1 is a key enzyme that
maintains DNA methylation patterns following DNA replication due to specificity to
hemi-methylated CpG dinucleotides (Li et al. 1992, Bird 2002, Goll & Bestor 2005).
Reduced Dnmt1 is translated into defects in maintenance of global DNA methylation
(Wang et al. 2009). Loss of global DNA methylation may result in the expression of
genomic regions that are usually silenced (reviewed in Bird 2000). It was important to
know the state of global DNA methylation following LSD1 deletion in order to rule out
effects of DNA hypo-methylation on transcriptional changes. The continued culture of
ES cells lacking LSD1 for up to 25 days results in a progressive decrease in Dnmt1 levels
(Figure 3.8A and B). The onset of this progressive reduction in Dnmt1 correlates with
the point of complete LSD1 protein deletion (compare Figure 3.5A with 3.8B).
However, a substantial reduction in protein levels is not observed in Lsd1∆3/∆3 ES cells
until beyond 10 days after induction of LSD1 deletion (Figure 3.8B). This result
supports the published role of LSD1 in regulating the stability of Dnmt1 by
demethylation of K1096 in mouse ES cells (Wang et al. 2009). Importantly, global DNA
methylation levels in Lsd1∆3/∆3 cells were comparable to control cells at 10 days after
induction of LSD1 deletion, as measured by incomplete digestion of endogenous
retroviral elements (IAP) using a methylation-sensitive restriction enzyme, HpaII
(Figure 3.9A). This repetitive DNA sequence is heavily methylated at CpG
dinucleotides within the ES cell-represented developmental stage (Mayshoopes, et al.
1983). The presence of methylation can be identified by digestion of genomic DNA
with an enzyme that only cuts at the unmethylated form of the CC↓GG restriction site
(HpaII), and comparing it to digestion with an isoschizomer that cuts regardless of

156
methylation state (MspI) (Mcclelland et al. 1981). At day 10, this site is clearly still
methylated, based on the inability for HpaII to recognise and cut this site (Figure 3.9A,
lane 3). Complete digestion of this site by MspI results in a hybridisation of the IAP
probe to approximately 0.5kb fragments (Figure 3.9A, lanes 2 and 4; Mcclelland et al.
1981). The continued culture of these ES cells lacking LSD1 (up to 25 days post 4-OHT
addition) results in decreased global DNA methylation (Figure 3.9B, lane 7, arrow),
consistent with the results of Taipeng Chen and colleagues (Wang et al. 2009). This is
identified by the appearance of smaller fragments of DNA in the HpaII digested DNA
(Figure 3.9B, arrow), indicative of loss of cytosine methylation on the second C of the
CC↓GG site. This data provided assurance that analysis of ES cell differentiation from
day 7 onwards following LSD1 deletion could reveal insights into the role of LSD1 in ES
cell differentiation through direct gene regulation.

157
Figure 3.8 Loss of LSD1 causes a reduction in Dnmt1 protein levels. (A) AWestern blot shows that after 25 days (7-8 passages) following induction ofLSD1 deletion, protein levels of Dnmt1 are decreased, as previouslyreported (Wang et al. 2009) . (B) Western blotting over the 25 day periodindicates that there is a progressive reduction in Dnmt1, clearly in responseto LSD1 deletion. -actin was used to normalise for protein loading.
Dnmt1
-actin
LSD1
Lox/∆3 ∆3/∆3
A
B
Dnmt1
- actin
0 4 7 10 15 20 25
Lsd1Lox/∆3 +4-OHT (day)

158
Figu
re3
.9D
ele
tio
no
fLS
D1
resu
lts
inlo
sso
fge
no
mic
met
hyl
atio
naf
ter
mu
ltip
lep
assa
ges.
Sou
ther
nb
lott
ing
was
use
dto
asse
ssth
ele
vel
of
gen
om
icm
eth
ylat
ion
atth
ein
trac
iste
rnal
A-p
arti
cle
(IA
P)
LTR
retr
otr
ansp
oso
nel
em
ents
at,
(A)
10
day
s,an
d(B
)2
5d
ays
afte
rth
ein
du
ctio
no
fLS
D1
del
etio
n.
Gen
om
icD
NA
was
dig
este
dw
ith
eith
erH
pa
II(m
eth
ylat
ion
sen
siti
ve)
or
Msp
I(m
eth
ylat
ion
resi
stan
t)re
stri
ctio
nen
zym
esan
dth
enh
ybri
dis
edw
ith
anIA
PD
NA
pro
be
.
HpaII
MspI
∆3/∆
3Lox /∆
3
L
∆3/∆
3Lox /∆
3
HpaII
MspI
HpaII
MspI
LH
paII
MspI
BA
12
34
56
78

159
3.2.4 In vitro differentiation analysis of LSD1 knockout ES cells
As the LSD1 knockout embryos die just before the onset of gastrulation and the
proliferative capacity of undifferentiated ES cells is unperturbed by loss of LSD1,
Lsd1Lox/∆3 and Lsd1∆3/∆3 cells were compared for their ability to differentiate. The first
differentiation assay involved plating ES cells at clonal density (700 cells/6-well) and
culturing them for a further 5 days in the presence, or absence of LIF. Subsequent
staining of cells with alkaline phosphatase (AP), a marker of pluripotency, tested the
ability of cells to retain pluripotency in the presence of LIF and the potential to
differentiate without it. Lsd1∆3/∆3 cells could retain pluripotency in the presence of LIF
as well as spontaneously differentiate over the course of 5 days in the absence of LIF
(Figure 3.10A). Lsd1∆3/∆3 cells also showed a similar percentage of differentiated
colonies to Lsd1Lox/∆3 controls in the presence of LIF, though the proportion of
differentiated cells was less in the absence of LIF (Figure 3.10B). Interestingly, the
overall number of Lsd1∆3/∆3 colonies observed, by methylene blue staining, in the
absence of LIF was reduced by approximately 60% (Figure 3.10C). This result, along
with a lower proportion of differentiated colonies surviving 5 days in the absence of
LIF, suggests that Lsd1∆3/∆3 cells can differentiate, but differentiation is associated with
increased cell death. Another observation was that LSD1-deficient ES cells, when
plated at low density, generated more colonies in the presence of LIF (Figure 3.10C);
supporting a slightly increased growth rate of Lsd1∆3/∆3 cells (Figure 3.7A). The
observation that Lsd1∆3/∆3 cells can also survive upon differentiation, meant that some
developmental lineages can propagate in the absence of LSD1. Further differentiation
experiments were required to understand which lineages could develop and if the
phenotype was reproducible in other assays of in vitro differentiation.

160
Figure 3.10 ES cells lacking LSD1 are allowed to differentiate upon LIFwithdrawal, however with reduced survival of colonies. (A-B)Differentiation potential; ES cells of the indicated genotype were plated atlow density in the presence or absence of LIF and cultured for 5 daysbefore being stained for the presence of alkaline phosphatase (a marker ofpluripotency) and imaged under the microscope to record a representativeimage and to be scored as undifferentiated (intense purple), mixed (weakpurple), or differentiated (no staining). Scale bar = 200Meter. (C)Colonies were subsequently stained with methylene blue and totalnumbers were counted to calculate colony numbers and percentages forthe bar graph in (B). Mean values were plotted (n=3) +/- S.E.M .
+LIF
day 5
-LIF
day 5
Lox/∆3 ∆3/∆3A
B
C

161
The generation of embryoid bodies (EBs) by hanging drop culture in the absence of LIF
demonstrated that Lsd1∆3/∆3 cells had the ability to aggregate to form embryoid bodies
(Figure 3.11A). However, fewer Lsd1∆3/∆3 cells formed aggregates effectively by day 1,
as shown in the representative image (Figure 3.11A, top panel). By day 5, 50-60% less
Lsd1∆3/∆3 EBs compared to controls was observed (Figure 3.11B); a similar figure to the
reduction in Lsd1∆3/∆3 cell survival after 5 days in the absence of LIF (Figure 3.10C). In
addition, the surviving EBs were reduced in size by roughly a third at day 5 (Figure
3.11C). These data suggest that ES cell aggregation can occur to form the outer layer
of primitive endoderm, though further differentiation may be perturbed, either
resulting in death of the EB or reduced capacity to differentiate and grow.

162
Figure 3.11 ES cells depleted in LSD1 have defects indifferentiation as embryoid bodies. (A) Images representative ofEBs at 1 and 5 days of culture shows that some EBs Lsd1∆3/∆3 EBs failto aggregate as expected as well as reduced size at day 5. Bargraphs show (B) the number of EBs and (C) the average size of EBsof the indicated genotype obtained after 5 days of culture.
A
B C
Day 1
Day 5
Lox/∆3 ∆3/∆3

163
To confirm whether increased cell death is associated with differentiation in the
absence of LSD1, Lsd1Lox/∆3 and Lsd1∆3/∆3 cells were cultured in the presence of retinoic
acid (RA) to stimulate differentiation and measure the accumulation of cells with sub-
G1 DNA content. Prior to RA treatment, both sets of cells display small populations of
dead cells (Figure 3.12A, day 0). In contrast, after 3 days of RA treatment, 58% of
Lsd1∆3/∆3 cells showed a sub-G1 DNA content, over 2-fold more than controls (Figure
3.12A, day 3). As RA addition is a powerful driver of differentiation, a more subtle
differentiation assay was subsequently employed by removing LIF in neuronal
differentiation serum-free media (N2B27). Even before the withdrawal of LIF, 4-fold
more Lsd1∆3/∆3 cells possessed sub-G1 DNA content, most likely accounted for by the
lack of differentiation-inhibiting serum in media (Figure 3.12B day 0), as serum/BMP4-
inhibits differentiation through induction of Id proteins (Ying et al. 2003). Loss of
BMP4 signalling may therefore account for increased cell death. Notably though, an
almost 4-fold larger percentage of dead cells was observed upon the withdrawal of LIF
in this media (Figure 3.12B, day 3). Overall, these data suggest that ES cells lacking
LSD1 are far more susceptible to cell death in differentiation-inducing conditions, and
that much of this death occurs within 3 days of exit from the pluripotent state, which
is consistent with a 50-60% reduction in the number of EBs over a similar time period.

164
Figure 3.12 Differentiation of ES cells lacking LSD1 isassociated with apoptotic cell death. (A) The percentage ofdead cells was determined by propidium iodide staining andFACS analysis after treatment of cells with 1mM retinoic acidover 3 days . (B) The same analysis was done after culture inN2B27 media with removal of LIF over 3 days. In each case thepercentage of cells with a sub-G1 DNA content is indicated.
B
A

165
Gene expression analysis of EBs was performed in order to reveal molecular
mechanisms that might underpin the observed cell death. Firstly, as expected
following observations of AP down-regulation in the absence of LIF, EBs lacking LSD1
retained the ability to switch off the pluripotent factor genes Oct4, Nanog and Rex1
(Figure 3.13A). This signifies that LSD1 is not involved in repression of these genes
upon exit from the pluripotent state. The formation of primitive ectoderm (indicative
of the embryonic epiblast cells before E6.5) was unaffected, since activation of FGF5
was observed at day 2 (Figure 3.13B, left panel). At day 5, endoderm lineages
appeared to develop to a similar extent in EBs derived from Lsd1Lox/∆3 and Lsd1∆3/∆3
cells, as indicated by GATA6 activation (Figure 3.13B, right panel). This agrees with the
ES cell aggregation and down-regulation of Nanog expression at day 5 to form
primitive endoderm (Chambers et al. 2003, Mitsui et al. 2003, Hamazaki et al. 2004).
However, defects in mesoderm development were apparent. The level of Brachyury
mRNA was notably higher in both undifferentiated ES cells and day 2 EBs lacking LSD1
(Figure 3.13B, middle panel), indicating an altered pattern of gene expression that
could potentially perturb differentiation. Classically, induction of Brachyury is not
observed upon differentiation in the presence of serum until day 3 (Fehling et al. 2003,
Keller 2005). The significant reduction of Brachyury expression in LSD1-deleted cells
between day 2 and 5 suggests that cell types over-expressing this gene may have died.
This idea was supported by the observation of 12%→58% sub-G1 cells between day 2
and 3 of RA-induced differentiation (Figure 3.12A). It is also noteworthy that day 2 of
EB differentiation corresponds to E6.5 of the developing embryo (Keller 2005; see
Chapter 1.8.6), suggesting that Brachyury over-expression, large differentiation-
associated cell death and a block in embryonic development may be linked. The

166
survival however of some Lsd1∆3/∆3 EBs suggested that some early stage EBs withstood
the de-regulation of mesodermal gene expression due to a redundancy in gene
expression control.
Figure 3.13 Differentiation of ES cells lacking LSD1 is associated withrepression of pluripotency factors but perturbed transcriptionalregulation in mesoderm development. (A) Quantitative RT-PCR datafor genes characteristic of undifferentiated ES cells (Oct4, Nanog, Rex1)was performed on mRNA extracted at 0, 2 and 5 days during EBdifferentiation.. (B) The same data is displayed for genes indicative ofprimitive ectoderm (Fgf5), mesoderm (Brachyury) and primitiveendoderm (Gata6). Expression of the Gata6 and Fgf5 is unaffected,but precocious expression of Brachyury is observed. One cDNA samplewas amplified in three parallel PCR reactions and mean values +/-S.E.M are plotted. Values indicate expression of the specific generelative to the GAPDH control gene, measured using Roche UPLhydrolysis probes
A
B

167
Extended culture of surviving EBs beyond 12 days revealed that that EBs consisting of
LSD1 knockout cells were less than half the size of controls (Figure 3.14A and B). This
comparative size to controls is less than at day 5, suggesting that differentiation and
growth is restricted over a further 7 days of EB culture. Also, clumps of dead cells
were apparent (Figure 3.14A, arrow), which was further evidence of significant cell
death throughout this differentiation assay. At day 15, qRT-PCR revealed a lack of
mesodermal cell types in LSD1-deleted EBs and significantly increased levels of genes
characteristic of extra-embryonic endoderm, which is derived from primitive
endoderm (Figure 3.14C). These results corroborated gene expression observations in
5 day-developed EBs (Figure 3.13B; loss of Brachyury expression and maintenance of
Gata6 expression). Notably, Tal1 and CD34 expression was non-existent compared to
controls at day 12 (data not shown) and day 15 (Figure 3.14C), suggesting that
haematopoietic cell types did not develop at all in Lsd1∆3/∆3 EBs. Much higher
expression of genes indicative of parietal and visceral endoderm lineage (TTR, AFP and
HNF-1suggested that embryonic cell types died, supporting a developmental block
of epiblast-derived lineages in the post-implantation embryo. The absence of
mesodermally-derived cells may be due to death due to earlier over-expression of
Brachyury, which could also emphasise the enrichment of endodermal markers,
especially considering the abnormal size and morphology of LSD1-deleted EBs at this
later stage (Figure 3.14A and B). This expression data in day 15 EBs was corroborated
recently by a report showing that teratomas derived from LSD1 knockout ES cells have
enrichment for extra-embryonic endodermal cell types and a similar lack of mesoderm
cells types (Macfarlan et al. 2011). These observations were explained by an
expanded fate potential of LSD1 knockout ES cells, where ES cells derived from the

168
ICM acquire the ability to develop into embryonic and extra-embryonic derivatives
(Macfarlan et al. 2011).
Figure 3.14 Extended culture of EBs reveals an absence of mesodermalcell types and enrichment for endodermal cell types. (A) Representativebright field image of EBs after 12 days of culture. Arrows indicate clumpsof dead cells that accumulate in Lsd1∆3/∆3 cultures. Scale bar = 300M. (B)Diameter of EBs of the indicated genotype observed after 12 days ofculture. (C) Quantitiative RT-PCR was performed for a range of markers ofpluripotent cells and primary lineages. Pluripot. = pluripotency factors;Ecto = definitive ectodern; mesoderm; Endo = endoderm; PE/VE =parietal/ visceral endoderm. One cDNA sample was amplified in threeparallel PCR reactions and mean values +/- S.E.M are plotted. Valuesindicate expression of the specific gene relative to GAPDH.
day 1
2
A
B
C
Lox/∆3 ∆3/∆3

169
3.3 Conclusions
ES cells lacking LSD1 proliferate normally under standard ES cell culture conditions and
retain stem cell characteristics (AP, Oct4, Nanog and Rex1 expression), but display
increased levels of cell death upon differentiation, accompanying an aberrant
mesoderm transcriptional programme and defects in full embryonic lineage
development in EBs. Differentiation-associated cell death and restriction of embryonic
lineage propagation correlate with a similar temporal impairment of embryonic
development, suggesting that LSD1 is required to control the onset of lineage
development from the primitive ectoderm cells of the epiblast. This developmental
block may however be due to de-regulation of further genes in the epiblast, yet to be
revealed, due to limited gene expression analysis. As well as this, the association with
HDAC1 and 2 in a multi-protein co-repressor complex is likely to be critical for the role
played by LSD1.

170
4 Understanding the role of LSD1 in embryonic gene regulation
4.1 Introduction
The previous chapter reported a number of observations seen upon conditional
deletion of LSD1 in ES cells; results suggested that an underlying cause of the
differentiation-associated cell death phenotype in Lsd1∆3/∆3 ES cells was transcriptional
de-regulation. This was explored further by biochemical analysis of the CoREST
complex in the absence of LSD1, as well as assessment of the effect of LSD1 depletion
on histone methylation and acetylation. These experiments were instigated by prior
knowledge of LSD1-associated proteins and the known enzymatic redundancy towards
H3K4me2/me1. As LSD1 is involved in the removal of a modification that marks
actively transcribed genes, to understand how LSD1 regulates epiblast development
through control of transcriptional networks, global comparative gene expression
analysis was performed in ES cells.
LSD1 can form a complex with different CoREST family corepressors (CoREST1-3) in
different cell types. It remained unknown if different CoREST proteins functioned
specifically in ES cells until a report in May 2011 showed that CoREST2 is
predominantly expressed in ES cells and forms a complex with LSD1, facilitating its
nucleosomal demethylation activity (Yang et al. 2011). These data were published
after work documented in this thesis had been completed. The interaction and
functionality of LSD1 with CoREST1 (Rcor1/mKIAA0071/CoREST) was originally

171
identified and had therefore been much scrutinised in previous publications, though
these studies were performed using HEK293 and HeLa cells (Lee et al. 2005, Shi et al.
2005). The knockdown of CoREST2 in ES cells inhibited proliferation and severely
impaired pluripotency, which contrasts with LSD1 knockout ES cell data in Chapter 3,
suggesting CoREST2 may have additional functions outside the LSD1/CoREST/HDAC
complex (Yang et al. 2011). Experiments in this Chapter were performed using an
antibody specific to CoREST1 (anti-CoREST Millipore 07-455), thereby restricting the
analysis to the effects of LSD1 deletion on CoREST1.
The interaction of LSD1 with CoREST1 (hereby refered to as CoREST) is known to be
critical for the recognition and demethylation of nucleosomal substrates (Lee et al.
2005, Shi et al. 2005). This suggests that the association with CoREST would endow
some substrate specificity to LSD1, and underpins the essential requirement for LSD1
over other H3K4me2 demethylases such as JARID1A and LSD2 (Klose et al. 2007,
Ciccone et al. 2009). The stability of LSD1 is dependent on CoREST and the binding
affinity of LSD1 and CoREST is high, implying that the function of LSD1 relies on ability
to form a multi-protein complex (Shi et al. 2005, Hwang et al. 2011). In addition, the
ability to associate with HDACs is important for LSD1 activity, as hypoacetylated
histone tails serve as a more effective substrate for demethylation (Shi et al. 2005, Lee
et al. 2006). A previous study has demonstrated the interplay between LSD1 and
deacetylase activities; where the only detectable global change upon LSD1 deletion
was in H3K9 acetylation, with H3K4 methylation being unaffected (Wang et al. 2009).
This implies that the requirement for LSD1 might be manifested though deacetylases.

172
As direct and indirect gene de-regulation is likely to be identified in microarray
analyses, and ultimately ascertaining direct LSD1 targets in ES cells is an aim in this
investigation, information from previously published data from large-scale ChIP
studies in other cell types may be informative. LSD1 gene targets in MEL cells (Saleque
et al. 2007) and MCF-7 cells (Garcia-Bassets et al. 2007, Wang et al. 2009a) have been
previously reported. Notably, in one of these reports, the Brachyury promoter was
identified as a target of LSD1, through association with the NuRD complex (Wang et al.
2009a). This observation was in a somatic cell system, in which the chromatin state of
genes is different compared to ES cells. However, the preliminary identification of
Brachyury de-regulation suggests that this gene may be under direct control by LSD1 in
ES cells (Chapter 3, Figure 3.13B).

173
4.2 Results
4.2.1 Loss of LSD1 causes a reduction in the level of CoREST
The co-repressor, CoREST is a central binding partner of LSD1 in cells and together
with HDAC1 and 2, forms a core repressor complex (You et al. 2001, Hakimi et al.
2002, Lee et al. 2005, Shi et al. 2005, Yang et al. 2006, Lee et al. 2006b). The first
experiment performed was to assess the effect of LSD1 deletion on members of this
complex by a comparative western blot. The results here gave an initial indication that
the levels of CoREST were reduced in Lsd1∆3/∆3 ES cells though the levels of HDAC1 and
2 were unchanged (Figure 4.1). The direct binding of CoREST with LSD1 and the fact
that CoREST is only found in this protein complex (as opposed to HDAC1 and 2 that
are present in diverse repressor complexes) supported the notion that removal of
LSD1 would affect CoREST. Since LSD1 stability is reduced in the absence of CoREST, a
reciprocal dependence for stability appears to occur (Shi et al. 2005).
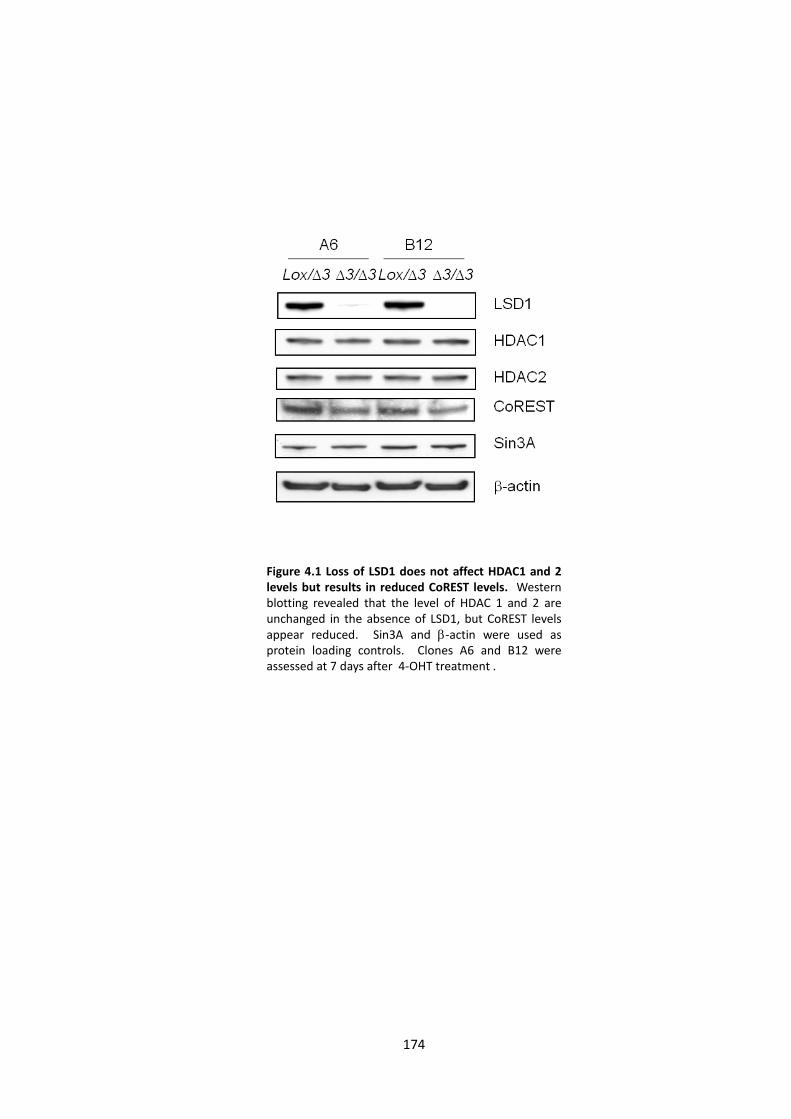
174
Figure 4.1 Loss of LSD1 does not affect HDAC1 and 2levels but results in reduced CoREST levels. Westernblotting revealed that the level of HDAC 1 and 2 areunchanged in the absence of LSD1, but CoREST levelsappear reduced. Sin3A and -actin were used asprotein loading controls. Clones A6 and B12 wereassessed at 7 days after 4-OHT treatment .

175
The reduced levels of CoREST were verified further by western blotting titration using
four varying amounts of cell extract (Figure 4.2A). The lane with 10g of whole cell
extract revealed significantly less CoREST in Lsd1∆3/∆3 ES cells compared to controls. A
reduction in protein stability was implicated since CoREST mRNA was unaffected
(Figure 4.2B). Revovery of the levels of CoREST protein through inhibition of the
proteasome was attempted, though 4 hour treatment of ES cells with MG132 did not
seem to result in a quantifiable increase in CoREST protein (Figure 4.2C). This was
unsurprising as the half-life of CoREST following synthesis is estimated to be
considerably more that 4 hours. MG132 inhibition of the proteasome proved to be a
difficult assay to perform, as a vast amount of cell death occurred within a couple of
hours of treatment. A longer inhibition time may well be required for more evident
rescue of CoREST protein levels, where 24 hours treatment with proteasome inhibitor
rescues LSD1 protein expression in cells expressing CoREST shRNA (Shi et al. 2005).
To test the integrity of the remaining complex in the absence of LSD1, CoREST was
purified from Lsd1∆3/∆3 cells and tested for ability to interact with HDAC1 and 2. In
control cells, CoREST co-precipitated with LSD1, HDAC1 and HDAC2 (Figure 4.3A lane
5). In the absence of LSD1, a decrease in the level of CoREST protein was again
observed (Figure 4.3A compare lane 1 with 6). The reduction in CoREST correlated
with a decrease in the association of HDAC1 and 2 (Figure 4.3A compare lane 5 with 10
in rows 3 and 4) and associated deacetylase activity (Figure 4.3B; p<0.05). However,
although the association was reduced, as CoREST levels were lower, a physical and
biochemical association of CoREST with HDACs could still be monitored, suggesting

176
that this portion of the complex was still intact. Whether this portion of the complex
was still functioning in gene regulation remained to be seen. As a control, the
association of HDAC1 with a distinct co-repressor protein, Sin3A, was tested and found
to be unaffected by loss of LSD1 (Figure 4.3A compare lane 4 with 9 in row 5). Full
complex assembly, including LSD1, is likely to be essential for CoREST complex
function, and depletion of LSD1 was expected to hinder HDAC function in gene
regulation based on this result. The natural progression was therefore to analyse
effects on global histone acetylation in addition to methylation. Importantly, there
was no change in overall deacetylase activity of HDAC1 in Lsd1∆3/∆3 cells (Figure 4.3B),
implying that any possible changes in histone acetylation levels in the cell would be
attributed to LSD1/CoREST/HDAC-target loci. These results (Figure 4.3) were
generated from analysis of clone A6; identical results were observed in clone B12
analysis (Figure 4.4A and B), which ruled out any false positive results occurring
through grossly unequal loading of purified proteins onto the gel or into the
deacetylase assays.

177
Figure 4.2 Loss of LSD1 results in reduced CoREST protein stability. (A)Western blot using a titration of nuclear extract quantities from Lsd1Lox/∆3
and Lsd1∆3/∆3 ES cells revealed a reduction in CoREST protein in theabsence of LSD1. This is most noticeable at 10g. -actin was used as aloading control. (B) Quantitative RT-PCR revealed that CoREST is notregulated by LSD1 through transcriptional control. CoREST mRNA levels,normalised to GAPDH, are similar in Lsd1Lox/∆3 and Lsd1∆3/∆3 ES cells. (C)Treatment of ES cells for 4 hours with a proteasome inhibitor, MG132,showed a modest increase in CoREST levels in Lsd1∆3/∆3 ES cells, confirmingthat in the absence of LSD1, CoREST protein is unstable and degraded.
A
B
C

178
Figure 4.3 Loss of LSD1 results in decreased CoREST protein levels and areduction in HDAC association within the CoREST complex. (A) Specificantibodies to the indicated proteins were used to immunoprecipitate LSD1,HDAC1 and CoREST from Lsd1Lox/∆3 and Lsd1∆3/∆3 ES cells (clone A6). Normalrabbit IgG was used as a non-specific antibody control. Co-immunoprecipitating proteins were assessed by immunoblot (indicated onthe left of the figure). (B) The amount of deacetylase activity associated witheach immunoprecipitation was measured using a commercially available kit.The amount of deacetylase activity co-immunoprecipitated with CoREST inLsd1∆3/∆3 cells was less than half that of Lsd1Lox/∆3 cells (p<0.05).
p = 0.0129
B

179
Figure 4.4 Loss of LSD1 results in decrease CoREST protein levels and areduction in HDAC association within the CoREST complex. (A) Specificantibodies to the indicated proteins were used to immunoprecipitate LSD1,HDAC1 and CoREST from Lsd1Lox/∆3 and Lsd1∆3/∆3 ES cells (clone B12). Normalrabbit IgG was used as a non-specific antibody control. Co-immunoprecipitating proteins were assessed by immunoblot (indicated onthe left of the figure). (B) The amount of deacetylase activity associated witheach immunoprecipitation was measured using a commercially available kit.The amount of deacetylase activity co-immunoprecipitated with CoREST inLsd1∆3/∆3 cells was less than half that of Lsd1Lox/∆3 cells (p<0.01).
A
B

180
4.2.2 Loss of LSD1 results in increased global histone acetylation
Knowledge of the catalytic activity of LSD1 towards mono- and di-methylated histone
H3K4 (Shi et al. 2005, Forneris et al. 2005a, Forneris et al. 2006) as well as the
observed reduction in the deacetylase activity of the LSD1-deficient CoREST complex,
prompted the comparative examination of post-translational modification of histone
H3. Loss of LSD1 produced only a small increase in the global levels of the substrates
of the enzyme, H3K4me1 and H3K4me2, suggesting that locus-specific changes in
methylation may occur (Figure 4.5A). These differences were statistically significant,
with very similar results recapitulated in all three biological replicates (p<0.01). A
modest H3K4me3 increase was also seen, implying that removal of LSD1 allows the
accumulation of this mark. More extensive changes were observed in lysine
acetylation. A 1.3-fold increase in H3K9 acetylation and a 2-fold increase in H3K56
acetylation were observed in Lsd1∆3/∆3 cells (Figure 4.5A and B), consistent with a
decrease in the HDAC activity associated with CoREST (Figure 4.3B). The larger
increase in acetylation than methylation suggests that there is more redundancy
among demethylases towards H3K4me2/me1 than among HDACs to H3K9ac and
H3K56ac. It may also reflect the observation that LSD1 enzymatic activity can regulate
deacetylation by HDAC1, where purified complexes containing catalytically inactive
LSD1 display decrease deacetylase activity (Lee et al. 2006a). However the similarities
in levels of HDAC1 protein to the deacetylase activity purified with CoREST suggest this
is not the case in vivo (Figure 4.3 and 4.4). However, these two sites may be
considered as substrates for the CoREST complex and it appears that LSD1 can
regulate global histone modifications through stabilisation of the CoREST complex in
ES cells.

181
Histone H3K56 acetylation is a modification associated with DNA damage (Das et al.
2009, Tjeertes et al. 2009), nucleosome assembly (Das et al. 2009) and the activity of
stem cell factors (Xie et al. 2009). This large change in H3K56ac is in agreement with
Dovey et al. 2010, where changes in acetylation could be dependent on the relative
abundances of different acetyl-lysines in ES cells. Histone tails appear to be
hyperacetyated on H3K9/K14 in ES cells, as the deletion of HDAC1 or treatment with
TSA results in smaller increases in H3K9/K14ac in ES cells compared to MEFs (Dovey et
al. 2010b). In contrast, acetylated H3K56 is a relatively rare modification in
mammalian cells and deletion of HDAC1 or TSA treatment results in larger H3K56ac
increases in ES cells (Das et al. 2009, Xie et al. 2009, Dovey et al. 2010b). The 2-fold
increase in H3K56ac in the absence of LSD1 may occur due to this situation with the
relative hyperacetylation of H3K9/K14 in ES cells perhaps masking the detection of
increased H3K9/K14 acetylation due to loss of LSD1 and reduced complex-associated
HDAC activity.

182
Figure 4.5 Loss of LSD1 results in an increase in global histone H3acetylation (A) The methylation and acetylation status of histoneH3 was detected using quantitative western blotting. Histoneswere acid extracted from three different clone (A6, B12 and C10).LiCOR fluorescent secondary antibodies were used (480 and560nm) and the signal of the specific modification was normalisedto the total amount of histone H3 using the LiCOR Odyssey Scanner(**p<0.01, *p<0.05 students t-test). (B) Three representative blotsagainst specific acetyl modifications are shown.
A
B
** **

183
4.2.3 LSD1 regulates the embryonic transcriptome
Global changes in histone acetylation in Lsd1∆3/∆3 ES cells prompted examination of the
ES cell transcriptome. RNA was isolated from Lsd1Lox/∆3 and Lsd1∆3/∆3 cells to perform a
comparative microarray analysis using an Illumina Whole-Genome Expression
BeadChip platform that covers 45,200 different mouse transcripts. RNA was
harvested from Lsd1Lox/∆3 cells and Lsd1∆3/∆3 cells 10 days after addition of 4-OHT and
impurities were removed by a further round of phenol-chloroform extraction. Various
assessments of RNA quality were performed before proceeding to the microarray
protocols. The RNA was analysed with the NanodropTM spectrophotometer, by
agorose gel electrophoresis and on the Agilent Bioanlyser. The RNA was of good
quality judging by integrity of the 26S and 18s ribosomal RNA bands and the smaller
RNA species on the gel (Figure 4.6). This was confirmed by the Bioanalyser in the
Genomics Core Facility, with robust rRNA peaks.
Figure 4.6 RNA sample quality used in microarrayhybridisation. The agarose gel image confirms thatRNA used in the array had not degraded. Highabundance rRNA (28S, 18S and 5S) and tRNA areeasily seen; mRNA species are of varying sizes and inlow abundance produce no clear band on the gel.
A6 A6 A6B12 B12 B12C10 C10 C10
Day 0 Day 7 Day 10
28S
18S
5S and
tRNA

184
Transcripts that were up- or down-regulated by greater than 1.4-fold (p-value<0.05),
across three independent experiments involving different biological clones, were
identified using ArrayTrack analysis software. In total, 588 transcripts were
differentially regulated, with considerably more up-regulated than down-regulated
(362 up compared to 226 down; Figure 4.7 and Appendix Table A3). This data gave no
indication of the direct role LSD1 could play in both transcriptional repression and
activation at specific genes, though the large number of down-regulated genes
suggested LSD1 could play a role as a transcriptional activator at targets. However,
the larger number of up-regulated genes observed was still consistent with a role for
LSD1 transcriptional repression. The raw data files of the analysis have been
deposited at the Gene Expression Omnibus database at NCBI (GEO Accession number
GSE21131). Lsd1 (AOF2) itself was the transcript down-regulated most (3-fold down),
as show previously through qRT-PCR (Figure 3.5B). This result served as a useful
internal control for the experimental system. The LSD1 Illumina probe was specific to
a region within exon 19 (the final exon), confirming the occurrence of nonsense
mediated decay (NMD) of the LSD1 mRNA and ruling out exon 4 skipping and splicing
into exon 5 for production of a functional transcript. This 3-fold lower transcript
abundance on the microarray was comparable to a 10-fold decrease revealed through
qRT-PCR (Figure 3.5B), which was an initial indication that expression changes revealed
through the array were lower than those in qRT-PCR analysis. This was a perhaps an
artefact of higher background or weaker label detection in the microarray platform.
Another immediate observation was that Brachyury, which was identified previously
as being up-regulated in undifferentiated LSD1-deleted cells (Figure 3.13B), was
increased 1.47-fold in the array (p =0.0007).
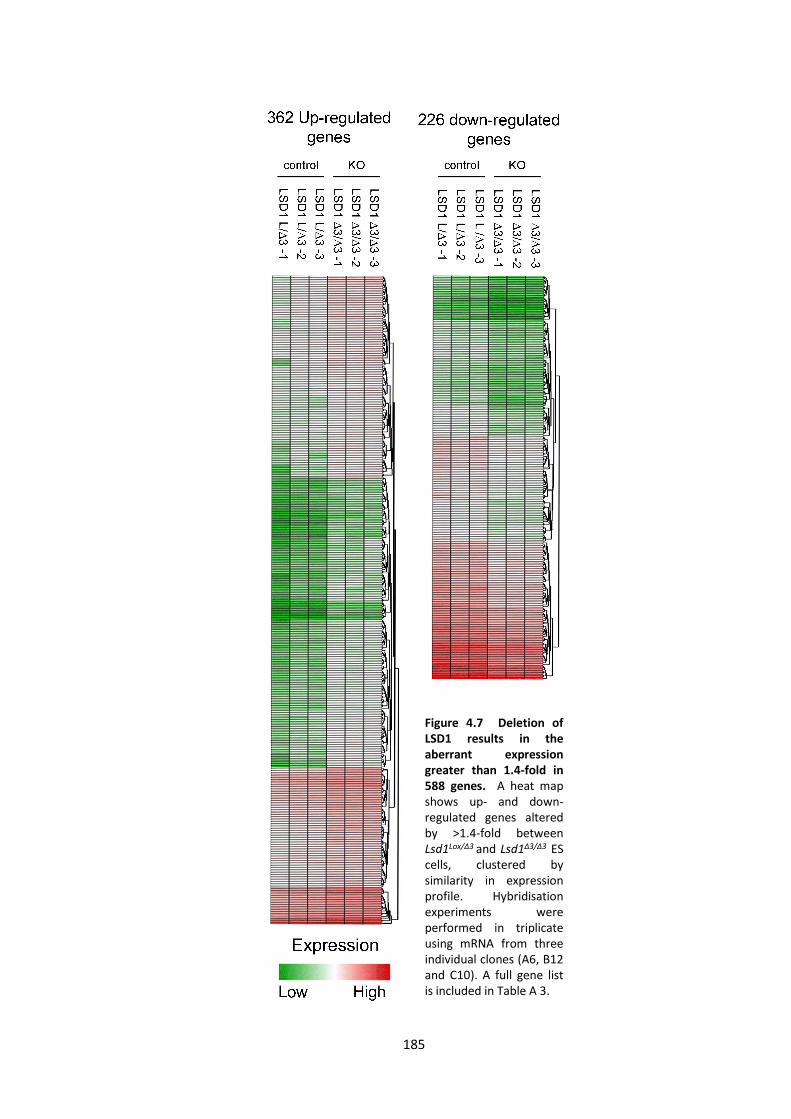
185
Figure 4.7 Deletion ofLSD1 results in theaberrant expressiongreater than 1.4-fold in588 genes. A heat mapshows up- and down-regulated genes alteredby >1.4-fold betweenLsd1Lox/∆3 and Lsd1∆3/∆3 EScells, clustered bysimilarity in expressionprofile. Hybridisationexperiments wereperformed in triplicateusing mRNA from threeindividual clones (A6, B12and C10). A full gene listis included in Table A 3.

186
To verify the microarray results, the levels of 8 up-regulated, 5 down-regulated and 4
unchanged transcripts were quantified by qRT-PCR using the same three RNA samples
(Figure 4.8A). All 17 transcripts corroborated the microarray result, though for many
genes a more robust change in transcript levels, as expected judging from the LSD1
transcript data, was observed (for example BRDT was 1.9-fold up-regulated by
microarray compared to 5.5-fold using qRT-PCR). The over-expression of Brachyury
(2.5-fold) was also reported through qRT-PCR analysis on these samples. The
comparison of expression levels was performed using Lsd1∆3/∆3 cells 10 days after 4-
OHT treatment against Lsd1Lox/∆3 ES cells in order for expression data to be comparable
to the in vitro differentiation assay data, as well as to rule out effects of genomic
hypomethylation on transcriptional changes. Gene expression analysis at four time
points over the 10 days was performed to assess the temporal nature of gene de-
regulation following 4-OHT addition. Brachyury, Hoxb7 and Rasgrp3 all showed
significant up-regulation beyond the 7 day point (Figure 4.8B), suggesting that a
complete deletion of LSD1 protein was only achieved at 7 days (beyond detection by
Western blotting in Figure 3.5A). This justified the choice of the 10 day stage of
comparative analysis; with the trend of up-regulation also suggesting these genes are
under the direct control of LSD1.
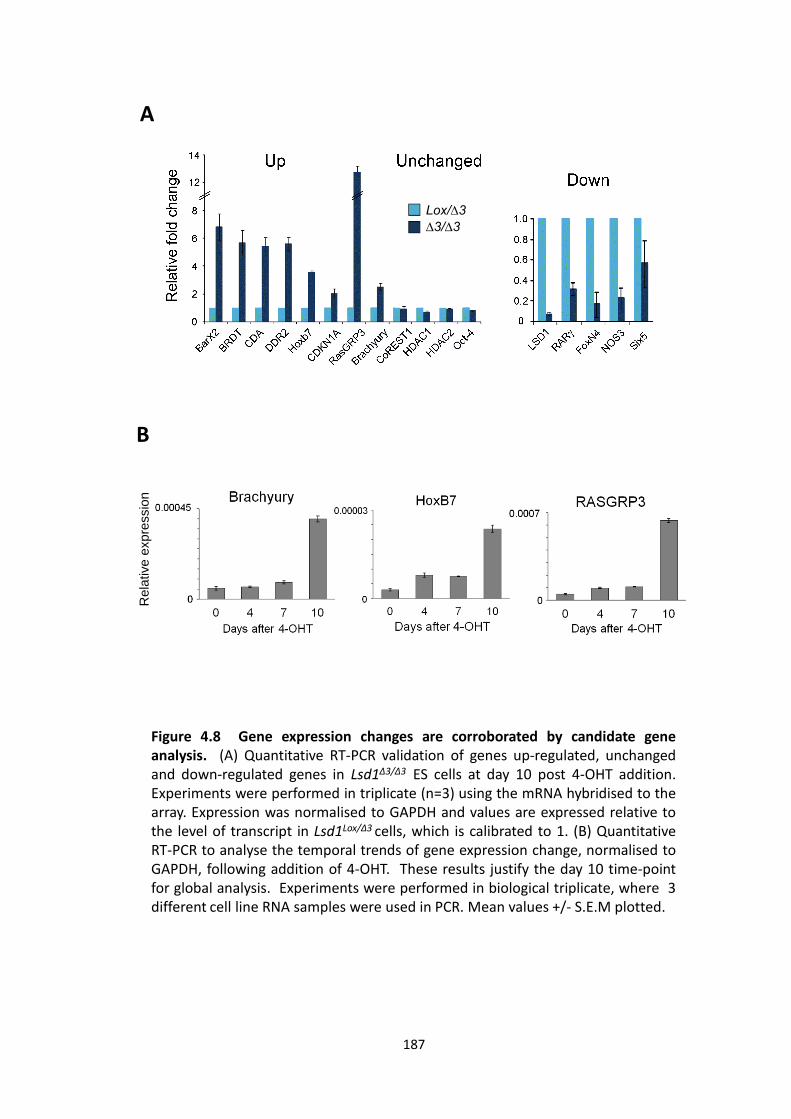
187
Figure 4.8 Gene expression changes are corroborated by candidate geneanalysis. (A) Quantitative RT-PCR validation of genes up-regulated, unchangedand down-regulated genes in Lsd1∆3/∆3 ES cells at day 10 post 4-OHT addition.Experiments were performed in triplicate (n=3) using the mRNA hybridised to thearray. Expression was normalised to GAPDH and values are expressed relative tothe level of transcript in Lsd1Lox/∆3 cells, which is calibrated to 1. (B) QuantitativeRT-PCR to analyse the temporal trends of gene expression change, normalised toGAPDH, following addition of 4-OHT. These results justify the day 10 time-pointfor global analysis. Experiments were performed in biological triplicate, where 3different cell line RNA samples were used in PCR. Mean values +/- S.E.M plotted.
Lox/∆3
∆3/∆3
B
AR
ela
tive e
xpre
ssio
n

188
A survey of the functional annotations of genes de-regulated in the absence of LSD1 by
gene ontology revealed a wide spectrum of biological activities (Figure 4.9). A number
of genes with a role in embryonic development were identified. These were of
particular interest as their aberrant expression might relate to the embryonic lethal
phenotype of the Lsd1-geo/-geo embryos. Thirteen transcription factors were de-
regulated (Figure 4.9; GO: 0045893, positive regulation of transcription), of which
some, including Brachyury, Gli2 and RAR, have functions in tissue specification and
notochord/neural tube development (GO: 0030903).In addition, a number of
homeobox containing proteins were up-regulated, including Hoxb7, Hoxd8 and Barx2,
which are involved in early embryo patterning. This implied that multiple
developmental programs might be regulated by LSD1 in ES cells.
An analysis of functionally related gene groups among the up-regulated gene list using
DAVID (Huang et al. 2009) revealed enrichment for genes involved in processes related
to cardiac and striated muscle (Figure 4.10). A number of these genes in fact encode
muscle protein; with four genes involved in most of the processes within the muscular
and circulatory systems (Gm4392, Ankyrin, Troponin I and Troponin TI). These systems
are derivatives of the mesoderm, of which Brachyury is a master regulator in the
developing embryo. Up-regulation of Brachyury in undifferentiated ES cells might
cause increased expression of muscle-specific genes. Thus, an altered transcriptional
program, including aberrant expression of a mesoderm-specification factor and
derivatives may contribute to the impaired developmental phenotype of LSD1
knockout ES cells and embryos.

189
Figu
re4
.9A
mu
ltit
ud
eo
fb
iolo
gica
lp
roce
sse
sar
eaf
fect
ed
by
the
de
leti
on
of
LSD
1.
Enri
chm
ent
of
gen
eo
nto
logy
bio
logi
cal
pro
cess
term
sin
Lsd
1∆
3/∆
3ES
cells
isp
lott
ed..
Enri
chm
ent
was
calc
ula
ted
fro
mth
en
um
ber
of
de
-reg
ula
ted
gen
esw
ith
inth
ep
roce
ssco
mp
ared
toth
eto
tal
nu
mb
ero
fge
nes
on
the
arra
yw
ith
inth
ep
roce
ss.
The
nu
mb
ero
fd
e-re
gula
ted
gen
esin
each
cate
gory
issh
ow
nn
ext
toth
eb
ars
and
colo
urs
rep
rese
nt
pva
lues
acco
rdin
gto
the
key

190
Figure 4.10 Loss of LSD1 results in up-regulation of a cluster ofgenes with a muscle-specific function. Functional annotationclustering of up-regulated genes using DAVID identifies anenrichment for genes with a muscle-specific function. Genenames and associated gene ontology (GO) terms for PANTHERbiological processes are listed. A green block indicates acorresponding gene-term association positively reported.

191
Since LSD1 controls gene expression via regulation of H3K4 methylation, and with the
knowledge that many genes with lineage-specific function are bivalent in ES cells
(Azuara et al. 2006, Bernstein et al. 2006a, Mikkelsen et al. 2007) (Chapter 1.9), it was
decided to determine the initial chromatin state of genes altered by loss of LSD1.
Using available histone modification datasets for mouse ES cells (Mikkelsen et al. 2007,
Ku et al. 2008), genes up-regulated in the absence of LSD1 were sub-divided into four
classes based on their methylation status at H3K4 and H3K27 (Figure 4.11). Among
the up-regulated transcripts, a significant enrichment for genes that possess the
bivalent modification was observed (p = 0.0145), with an even higher association of
gene up-regulation with the possession of neither modification (p = 2.34 x 10⁷).
Notably, Brachyury and other developmental genes, such as Barx2, Hoxb7 and Reln are
bivalent; therefore LSD1 could play a role in the maintenance of the transcriptionally
primed state of bivalently modified genes through removal of the H3K4me2
modification. At unmodified genes, LSD1 may function to maintain unmethylated
H3K4 in order to contribute to gene repression. Only two bivalent genes are down-
regulated upon removal of LSD1; this result is a useful control, as by definition, down-
regulated genes must be initially active. Unsurprisingly, of the down-regulated genes,
there was a very high enrichment for genes possessing only the H3K4me3
modification, which marks a transcriptionally active state.

192
Figu
re4
.11
LSD
1p
refe
ren
tial
lyre
gula
tes
biv
alen
to
rK
4/K
27
un
mo
dif
ied
gen
es.
Up
-re
gula
ted
gen
es
we
resu
bd
ivid
edb
yth
eir
ori
gin
alch
rom
atin
stat
ein
mo
use
ESce
lls(B
ern
stei
net
al.
20
05
).G
en
es
we
recl
assi
fie
db
yth
ep
rese
nce
of
eit
he
rH
3K
4m
e3
,H
3K
27
me
3,
bo
thm
od
ific
atio
ns,
or
no
mo
dif
icat
ion
.Th
en
um
be
ro
fu
p-r
egu
late
dge
ne
sw
ith
the
sech
rom
atin
stat
es,
the
nu
mb
ero
fge
ne
sp
rese
nt
on
the
WG
-2-v
2ar
ray
wit
hth
ep
arti
cula
rm
od
ific
atio
nan
dth
een
rich
me
nt
of
gen
es
wit
ho
ne
of
the
fou
rp
ote
nti
alst
ate
sis
ind
icat
ed
(p-v
alu
eca
lcu
late
du
sin
ga
hyp
er-
geo
met
ric
test
).

193
4.2.4 Chromatin state changes in up-regulated genes
To further understand how the initial chromatin state of genes relates to up-regulation
in gene expression upon removal of an H3K4me1/me2 demethylase, ChIP was
performed using antibodies against H3K4me1, H3K4me2, H3K4me3 and H3K27me3
modifications to analyse three gene promoters with different initial chromatin states.
The H3K4me2 and H3K4me3 antibodies were tested for specificity using primers at
genomic regions classified as either H3K4me3-positive or negative (Table 2.1 and
Figure 4.12A and B). This would determine the efficacy of the antibodies in
precipitating genomic regions possessing this histone modification and therefore was
a crude test of their specificity. This method is often used to test the quality of an
antibody for use in ChIP. The H3K4me3 antibody appeared highly specific and
effective at recognising high leveles of H3K4me3. Regions classified as positive for this
modification were highly enriched over histone input DNA, whereas regions classified
as lacking this modification are less enriched (Figure 4.12A). The H3K4me2 antibody
was also validated using these regions, as H3K4me2 is known to be concordant with
H3K4me3 in ES cells (Orford et al. 2008). The PCR results showed that H3K4me2 was
specific, though variations in enrichment compared to the H3K4me3 data indicated
that either the antibody was not as specific as the H3K4me3 antibody, or that
H3K4me3-positive regions have differential levels of the H4K4me2 mark (Figure 4.12).
Notably, at the Oct4 promoter (which is highly active in ES cells), very high enrichment
of H3K4me2 is seen (50-fold over input), which meant that H3K4me2 persists at higher
levels in this region in ES cells, or that this antibody is more effective at precipitating
chromatin. Overall, these tests justified the use of these antibodies in ChIP assays.

194
Figure 4.12 Testing the specificity of commercially available histone modificationantibodies. Two genomic regions classified to be lacking the H3K4me3 modification(K4me3-) or possessing the modification (K4me3+) based on ChIP-seq data(Mikkelsen et al. 2007, Stock et al. 2008) were used to validate the affinity of (A) anH3K4me3 antibody (Sigma D5692) and (B) an H3K4me2 antibody (Millipore 07-473)for their specified epitopes.
A B

195
The promoters of three genes, with either bivalent, H3K27me3 alone or H3K4/K27
unmodified initial chromatin state, were examined. The bivalent gene, Brachyury,
showed increases in all three methylation states of H3K4 upon removal of LSD1, fitting
with increase in gene transcription (Figure 4.13A). An increase in mono- and
dimethyation was not unsurprising as these are the substrates for LSD1. However, the
increase in tri-methylation, a modification that is already present, suggested a role for
LSD1 in the acute regulation of methylation levels. Hoxd8, a gene with H3K27me3 but
without H3K4me2/me3, showed an increase in the H3K4me mark and a decrease in
the repressive H3K27me3 mark upon LSD1 deletion (Figure 4.13B), with the later
change most likely linked to an increase in gene expression, suggesting an indirect of
LSD1 removal on the change in expression of Hoxd8. An increase in H3K4me2/me3
levels at the H3K4/K27 unmodified promoter was observed, correlating with increased
expression as well as the removal of an enzyme that demethylates H3K4me2 (Figure
4.13C). Regardless of confirmation of LSD1 binding, it was interesting to understand
how these chromatin states might change upon up-regulation.

196
Figure 4.13 Up-regulation of genes in the absence of LSD1 isassociated with initial chromatin state-dependent changes inhistone methylation at the promoter,. ChIP was performed to identifychanges in enrichment of methylation states of histone H3 atpromoter regions of three up-regulated genes in LSD1-deleted EScells, including (A) Brachyury, a gene that initially possesses bothH3K4me3 and H3K27me3 in Lsd1Lox/∆3 ES cells; (B) HOXD8, a gene thatpossesses only H3K27me3 in Lsd1Lox/∆3 ES cells; (C) RASGRP3, a genethat is unmodified at both H3K4 and H3K27 in Lsd1Lox/∆3 ES cells.
B
A
C
Lox/∆3
∆3/∆3
Lox/∆3
∆3/∆3
Lox/∆3
∆3/∆3

197
4.2.5 Brachyury is a direct target of LSD1
A correlation between LSD1 loss, increased Brachyury expression and the activation of
mesodermal, notably muscle-specific genes, prompted the investigation of the
relationship between LSD1 and Brachyury further. Examination of Brachyury
transcript and protein levels was performed in Lsd1Lox/∆3 and Lsd1∆3/∆3 cells that were
either cultured in the presence of LIF, or absence of LIF to stimulate ES cell
differentiation as a monolayer. LIF withdrawal led to an increase in mRNA levels in
both control and LSD1-deleted cells, although expression was still considerably higher
in the absence of LSD1 (Figure 4.14A). This result recapitulated the previously
observed over-expression in undifferentiated ES cells (Figure 3.13B and 4.8A) and
supported the expression data recorded at day 2 of EB differentiation (Figure 3.13B).
Over-expression of Brachyury in undifferentiated ES cells was consistently recorded at
2 to 5-fold. Brachyury protein levels were similarly increased in the absence of LSD1 in
undifferentiated (3.3-fold) and differentiated (2.24-fold) ES cells (Figure 4.14B). All
results have confirmed that LSD1 negatively regulates Brachyury expression.

198
Figure 4.14 Brachyury is over-expressed inundifferentiated and 3 day differentiated Lsd1∆3/∆3 EScells. (A) Quantitative RT-PCR shows up-regulation ofBrachyury mRNA in Lsd1∆3/∆3 ES cells with (day 0) andwithout LIF (day 3). mRNA levels are normalised toGAPDH and values are represented relative to the level oftranscript in Lsd1Lox/∆3 cells with LIF, calibrated to 1.Triplicates represent one cDNA sample amplified in 3parallel reactions. (B) Western blot shows an increase inBrachyury protein levels in Lsd1∆3/∆3 ES cells with (day 0)and without LIF (day 3). The fold induction of Brachyuryprotein was calculated relative to the Sin3A control.
A
B

199
The next experimental direction was therefore to test if this regulation was a
consequence of direct recruitment of LSD1 to the Brachyury gene. Chromatin
immunoprecipitation (ChIP) was performed to look for enrichment of DNA fragments
representing the promoter region of the Brachyury gene. The region 600bp upstream
of the transcriptional start site (TSS) was technically easier to amplify in PCR as regions
closer to the TSS are very GC-rich, making specific amplification difficult. The
resolution of ChIP analysis was approximately 200-400bp, based on the average size of
sonicated chromatin fragments (Figure 4.15), which meant that -600bp was a
reasonable reflection of LSD1 association with the proximal promoter region. PCR
primers were designed to detect DNA representing regions downstream of the TSS
(+400bp), the proximal promoter (-600bp) and a site remote from the TSS as a
negative control (-4500bp) (Figure 4.16A). It was shown that LSD1 was associated
with the promoter region; with a maximal enrichment (2.5-fold) approximately 600bp
upstream of the transcriptional start site (Figure 4.16B). Reduced LSD1 binding was
detected downstream of the first exon, with no association detected with a more
distal 5’ region of the Brachyury locus. The enrichment reflected the ability of the
LSD1 antibody to specifically IP from the crosslinked material and the Lsd1∆3/∆3 cells
were effectively a negative control as no LSD1 protein was present in these cells. ChIP
was also performed using antibodies to histone modifications. In the absence of LSD1,
an increase in the level of H3K4me2 (2.5-fold) was detected at the -600pb region
(Figure 4.16C), indicative of increased transcription and the loss of LSD1 enzymatic
activity. Indeed, the trend of LSD1 binding and H3K4me2 levels overlapped well at all
regions. The level of H3K4me3 was also increased at -600bp (2-fold) in Lsd1∆3/∆3 cells
(Figure 4.16D), correlating with increased transcription from this promoter but also

200
suggesting that LSD1 may hinder the accumulation of this mark, even though
H3K4me3 is not an LSD1 substrate. As global H3K9 acetylation was increased in
Lsd1∆3/∆3 cells (Figure 4.5A and B), this mark was also assessed by ChIP. An increase in
H3K9ac (4-fold) was observed at -600pb (Figure 4.16E), again indicative of increased
transcription, but also suggesting that gene-specific function of HDACs could be
perturbed in the absence of LSD1. This reflects the earlier identification of reduced
HDAC association within the CoREST complex in the absence of LSD1 (Figure 4.3 and
4.4). It therefore seemed likely that LSD1 regulated Brachyury expression as part of an
HDAC-containing repressor.

201
Figure 4.15 Sonication of crosslinked chromatingenerates enrichment for 200-400pb DNA fragments Insingle crosslinked samples 15 minutes sonication wasrequired on the HIGH setting with 30 second on/off cycles.For double crosslinked samples, 20 minutes sonication wasrequired using the same Bioruptor settings
Formaldehyde only
1.5mM EGS + Formaldehyde
200-400bp
enrichment
L

202
Figure 4.16 Brachyury is a direct target gene of LSD1 (A)Schematic ofthe Brachyury gene shows the relative position of the primers used forthe quantitative PCR following chromatin immunoprecipitation. (B)The region -600bp from the transcriptional start site (TSS) is enrichedin LSD1 ChIP from Lsd1Lox/∆3 cells but not Lsd1∆3/∆3 cells. Lessenrichment is seen at +400bp with no enrichment at -4500bp,indicating that LSD1 associates with the gene just upstream of theTSS. Loss of LSD1 results in (C) increased H3K4me2, (D) increasedH3K4me3 and (E) increased in H3K9ac at -600bp and +400bp sites.Increased enrichment of these modifications at the Brachyurypromoter supports activation of transcription.
A
B
C
D
E
Lox/∆3
∆3/∆3
Lox/∆3
∆3/∆3
Lox/∆3
∆3/∆3
Lox/∆3
∆3/∆3

203
To further investigate whether LSD1 is recruited to the Brachyury promoter as part of
the CoREST complex, ChIP using an antibody to CoREST was performed. LSD1 ChIP
was performed simultaneously in this assay, with a recapitulation of LSD1 binding at -
600bp (Figure 4.17B). Interestingly, relative DNA enrichment of the -600bp region was
also seen in CoREST ChIP from Lsd1Lox/∆3 cells to a similar extent as LSD1 ChIP (Figure
4.17C). This suggested that loss of LSD1 resulted in loss of association of CoREST
protein with the Brachyury promoter; and therefore presumably also HDAC1 and 2,
which is reflected by increased H3K9 acetylation at this gene (Figure 4.16E). The
similar levels of enrichment across the three amplified regions could reflect the very
similar abilities of LSD1 and CoREST antibodies to immunoprecipitate the specific
protein (see Figure 4.3A lanes 3 and 5). Overall, these data support biochemical
observations of the integrity of the CoREST complex in LSD1-depleted ES cells and
confirm that the CoREST repressor complex regulates Brachyury in ES cells by way of
possession of H3K4me1/me2 demethylase and deacetylase activities.

204
Figure 4.17 Loss of LSD1 results in a similar loss ofCoREST from the Brachyury promoter (A) A repeat LSD1ChIP assay was performed, which result in arecapitulation of the previous data (with slightly less -600bp enrichment in Lsd1Lox/∆3 cells LSD1 ChIP. (B)CoREST ChIP was performed simultaneously and revealeda similar pattern of enrichment in Lsd1Lox/∆3 cells overLsd1∆3/∆3 cells at -600bp and +400bp from the TSS.
B
C
A
Lox/∆3
∆3/∆3
Lox/∆3
∆3/∆3

205
4.2.6 Brachyury is up-regulated in E6.5 Lsd1-geo/-geo embryos
Due to observations of differentiation-associated cell death in Lsd1∆3/∆3 ES cells and
the early embryonic lethality of LSD1 knockout embryos (Chapter 3), it was a now an
aim to relate the increase in Brachyury expression observed in Lsd1∆3/∆3 ES cells back
to the in vivo Lsd1-geo/-geo embryo model. Timed mates were set up with Lsd1/- geo
heterozygous mice, and vaginal plugs were monitored and reported in order to isolate
embryos at the appropriate time. WT, Lsd1/- geo and Lsd1-geo/-geo E6.5 embryos were
harvested from euthanized pregnant females by Dr Shaun Cowley. The whole embryo
was used for RNA extraction, followed by cDNA synthesis and qRT-PCR. Brachyury
expression was increased significantly (almost 20-fold) in Lsd1-geo/-geo embryos
compared to Lsd1/-geo heterozygous controls (Figure 4.18). RASGRP3 and CDA, two
genes up-regulated in Lsd1∆3/∆3 ES cells, were also up-regulated in Lsd1-geo/-geo
embryos, though to a lesser extent. As a control, the expression of HDAC1 and HDAC2,
whose protein and mRNA levels were unchanged by loss of LSD1 in ES cells (Figure 4.1
and 4.8A) was found to be unaltered between all embryonic genotypes (Figure 4.18),
demonstrating a consistent relationship between the in vitro and in vivo systems.
Overall these data infer that LSD1 is recruited directly to the Brachyury locus in order
to restrict expression prior to differentiation in ES cells and gastrulation in the
developing embryo.

206
Figure 4.18 Brachyury is de-repressed in Lsd1-geo/geo genetrap embryos.Quantitative RT-PCR analysis of E6.5 embryos revealed that homozygous(Lsd1-geo/geo) embryos have a 20-fold increase in Brachyury mRNAcompared to wild-type and heterozygous (Lsd1-geo/) embryos. Additionally,RASGRP3 and CDA mRNAs were increased 5-fold and 10-fodld, respectively inLsd1-geo/geo embryos, where HDAC1 and 2 levels remained unchanged.Assays were performed in biological triplicate, using RNA samples from threedifferent embryos of each genotype in PCR. Expression was normalised toGAPDH and values are represented relative to the level of transcript in WTembryos, which is calibrated to 1. Mean values (n=3) +/- S.E.M are plotted.

207
4.3 Conclusions
In conclusion, biochemical and transcriptional analyses in LSD1-deleted ES cells
indicate a role for LSD1 in transcriptional contol through regulation of histone
modification. Comparative microarray analysis of Lsd1Lox/∆3 and Lsd1∆3/∆3 ES cells
revealed that 62% more genes were up-regulated (362) than down-regulated (226).
Transcriptional up-regulation of 362 genes was consistent with a reduction in levels of
the co-repressor, CoREST, reduced deacetylase activity associated with the CoREST
complex, and global increase in H3K9 and H3K56 acetylation. The down-regulation of
genes in the absence of LSD1 either represents off-target effects or suggests LSD1 acts
as an activator of transcription at around 40% of its targets. These possibilities have
yet to be questioned in any detail. The de-regulation of number of genes with a role in
embryonic development appeared to be of significance, considering that LSD1 loss
results in early embryonic lethality. Moreover, upon functional analysis of up-
regulated genes, the identification of enrichment for genes involved in processes
related to cardiac and striated muscle function indicated that up-regulation of the
mesoderm lineage master-regulator, Brachyury, was informative. Subsequently, the
confirmation that Brachyury was a direct target of LSD1 and CoREST and that deletion
of LSD1 resulted in the increase in marks of gene activation (H3K4me2/me3 and
H3K9ac), provided insight into in vivo functionality of LSD1/CoREST/HDAC gene
control. The acknowledgement that Brachyury contains the bivalent chromatin
domain, poising it for activation in ES cells, in addition to an identification of bivalent
gene up-regulation in Lsd1∆3/∆3 ES cells, broadened the scope of understanding of LSD1
function.

208
5 Investigating the requirement for the catalytic activity of LSD1
5.1 Introduction
Rescue of LSD1 knockout ES cells by re-expressing LSD1 was planned in order to
confirm the specificity of the phenotype resulting from LSD1 deletion. Three
phenotypes of LSD1-deleted ES cells could be analysed in rescued cells, including the
reduction in CoREST protein levels, increased expression of Brachyury and
differentiation-associated cell death. The up-regulation of a directly targeted bivalent
gene in the absence of LSD1 and detected increases in H3K4me2 and H3K4me3
indicated that association of an H3K4me2 demethylase is required to prevent
modification overbalance towards H3K4me2/me3 at the bivalent domain, which
would cause inappropriate expression of the gene. Increase in the H3K9ac mark was
also reported upon up-regulation of Brachyury, suggesting that less CoREST-associated
deacetylase activity in the absence of LSD1 causes hyper-acetylation of histones
around the promoter, which could underpin gene over-expression. The aims were to
determine whether active demethylase activity is required for gene regulation, or
whether CoREST interaction and HDAC association is of more importance. The
precedence of this investigation is the report that the H3K9 methyltransferase, G9a,
can still repress Oct4 expression through recruitment of de novo DNA
methyltransferases independent of its histone KMT activity (Epsztejn-Litman et al.
2008). Here, SET-domain mutated G9a can recruit Dnmt3a through an ankyrin
domain, with the catalysis of H3K9me3 and subsequent HP1 recruitment dispensible
for DNA methylation of the promoter. As the biochemical environment of LSD1 is

209
analogous with that of G9a, in that they both have protein interaction domains with
which to harness further catalytic functions, similar questions about the primary
molecular function of LSD1 were asked. To determine whether the demethylase
activity is essential for gene repression and hence co-ordination of embryonic
development, re-expression of a catalytically inactive form of LSD1 (lysine
661→alanine; Lee et al. 2005) in Lsd1∆3/∆3 cells was performed. The importance of the
interaction with CoREST was also investigated by re-expressing a mutated form of
LSD1 that would not be able to associate with CoREST through its TOWER domain.

210
5.2 Results
5.2.1 Generation of LSD1 expression constructs
Five forms of LSD1 were generated by PCR with primers containing tails of ‘family D
vector homology’ for cloning into pLEIC21 expression vectors provided by the PROTEX
service at the University of Leicester. Insertion into this vector would endow an EGFP
(enhanced green fluorescent protein) tag to the N-terminus of the LSD1 protein. The
creation of EGFP fusion proteins was designed to enable assessment of recombinant
protein transfection efficiency by FACS and selection of EGFP-positive ES cells through
cell sorting if transfection efficiencies were low. GFP is a protein produced by the
jellyfish Aequorea victoria which fluoresces in the lower green portion of the visible
spectrum (Prasher et al. 1992, Chalfie et al. 1994, Inouye & Tsuji 1994). The gene for
GFP is often used in molecular biology as a tool to fluorescently label expressed
recombinant protein in order to monitor its expression levels or track its localisation
within a cell. Wild-type GFP has two excitation peaks at 395nm and 475nm and an
emission peak at 509nm (green). Problems with rapid quenching of WT GFP
fluorescense instigated the generation of several mutants of GFP, which have
increased fluorescence and red-shifted the major excitation peak to 490nm. This
excitation peak shift is better for FITC filtersets in fluorescence microscopy and FACS
as the main laserline for FITC excitation is from the argon laser at 488nm. EGFP has a
double mutation of phenylalanine 64 to leucine and serine 65 to threonine, which has
been optimised for brighter fluroscence (Cormack et al. 1996).

211
Full-length LSD1 (Figure 5.1A) and LSD1 with an N-terminal deletion (Figure 5.1B) were
designed to behave like wild-type protein. The N-terminal region has been shown to
be dispensable for LSD1 activity and is an unstructured region (Forneris et al. 2005a),
with the removal of this region also possibly aiding the toleration of the 27kDa EGFP
tag N-terminally of the functional domains of the protein. A further truncated protein
without residue 1-277 was also created to further investigate the requirement of the
SWIRM domain of LSD1 (Figure 5.1C). A catalytically inactive form of LSD1 with a
lysine to alanine mutation introduced at residue 661 (K661A, referred to from here on
as KA), was created by site-directed mutagenesis (Figure 5.1D). This conserved lysine
is known to be essential for flavin cofactor interactions in monoamine oxidases and its
mutation to alanine abrogates demethylation activity of LSD1 (Binda et al. 1999, Binda
et al. 2003, Lee et al. 2005). Two mutations were introduced to full-length LSD1 in
order to create a protein that would fail to bind CoREST (Figure 5.1E). The
hydrophobic residues mutated (valine and leucine) are within the TOWER domain and
assessment of the Protein Data Bank deposits of LSD1-CoREST using the 3D-Mol
viewer suggested they would be essential in creating an interface for CoREST
association. Expression of this mutant aimed to analyse the requirement for CoREST
binding by LSD1 and the role of HDACs in gene expression regulation as part of the
CoREST complex.

212
Demethylase
mutant
TOWER mutant
FL
166-853
277-853
277
Lysine661→Alanine
Hydrophobic →Polar residues
Figure 5.1 LSD1 rescue and mutant schematics for cloning intopLEIC21 vectors. (A) Full length and (B) N-terminal truncatedLSD1 used as WT forms of LSD1 to rescue the knockout ES cells.(C) SWIRM domain truncated LSD1. (D) Catalytically inactiveLSD1 with lysine 661 mutated to alanine (Lee et al. 2005) withsequencing alignment confirming mutagenesis of twonucleotides to alter the amino acid. (E) Mutated TOWER domainto disrupt the interaction with CoREST, with sequencingalignment confirming mutagenesis of leucine 446 to apartic acidand valine 450 to glutamic acid.
A
B
D
C
E
L→D V→E

213
An initial expression trial of EGFP-LSD1166-853 (here on referred to as EGFP-LSD1166) in
the pLEIC21 vector was performed. FACS analysis showed that GFP expression in ES
cells was less than 2% after 48 hours of transfection with pLEIC EGFP-LSD1166-853, and
western blots proved that LSD1 protein was barely detectable compared to control
Lsd1Lox/∆3 cells (Figure 5.2). The pLEIC vectors are derived from the pcDNA family of
vectors and contain a cytomegalovirus (CMV) promoter. Recombinant protein
expression from this vector was foreseen to be difficult as low constitutive activity and
even inactivation of the CMV promoter has been previously observed in mouse ES cells
(Chung et al. 2002, Barrow et al. 2006). ES cells can also be difficult to transfect;
therefore these two features were ultimately manifested in poor recombinant protein
expression. The EGFP-LSD1 fusions were subsequently shuttled into a pCAGGS vector
containing a chicken -globin promoter (Figure 5.3A). pCAGGS-Flpe had previously
been utilised for expressing Flpe in ES cells, with reasonable expression observed. A
linearised vector backbone was generated from the pCAGGS-Flpe construct using PCR
with a high-fidelity KOD polymerase (Figure 5.3B). This removed the Flpe ORF and also
omitted the puromycin resistance gene, as the ES cells already contained this gene at
the ROSA26 locus, rendering puromycin expression from this construct redundant. All
E-LSD1 ORFs were amplified by PCR from the appropriate pLEIC21 constructs using
primers with 15bp tails of homology to the ends of the linear pCAGGS vector (Chapter
2; Table 2.3). The PCR reactions were assessed for presence of a single specific DNA
species (Figure 5.3C) and inserts were then cloned into the pCAGGS vector by
annealing the tails of homology to the 5’ and 3’ ends of the linear backbone using an
In-Fusion® enzyme. New pCAGGS constructs were identified by colony PCR and newly

214
inserted ORFs were sequenced before endotoxin-free preparations of plasmids was
performed for transfection into ES cells.
EGFP-LSD1166
(-GFP )
-actin
EGFP-LSD1166
(-LSD1 C-term)
Figure 5.2. Expressed of EGFP-LSD1166-853 from the pLEIC21vector is very low in ES cells A GFP antibody reveals that 48hrtransient transfection of pLEIC12 EGFP–LSD1166 results inrecombinant protein expression in Lsd1Δ3/Δ3 ES cells (toppanel) . However, use of the LSD1 antibody shows that thisprotein is expressed at very low levels compared toendogenous LSD1 in Lsd1Lox/Δ3 cells (middle panel). -actinwas used as a protein loading control. Plasmids from threedifferent transformed bacterial clones were tested.

215
EGFP-LSD1
Figure 5.3 Generation of the pCAGGS-EGFP-LSD1 constructs by PCR andInFusion cloning. (A) Schematic of the convesion of pCAGGS-Flpe to pCAGGS-EGFP-LSD1. (B-C) The cloning strategy involved KOD PCR amplification ofEGFP-LSD1 inserts from pLEIC21 construct with 15bp arms of homology to thepCAGGS backbone, which itself was generated by KOD PCR. PCR productswere verified by agarose gel electrophoresis and then treated appropriatelybefore use in the InFusion cloning procedure (2.14). Sizes of PCR products areindicated. All primers used in cloning procedures are listed in Table 2.3.
A
B
3360bp
2580bp
5134bp
L
L
2859bp
C

216
5.2.2 Expression of pCAGGS EGFP-LSD1 constructs in ES cells
The EGFP N-terminal tag could be used to assess the success of recombinant protein
expression following transfection by FACS analysis. Excitation of EGFP is achieved
using the FITC excitation wavelength (488nm) in FACS. The analysis of EGFP-LSD1
expression from the pLEIC21 vector by western blot had revealed very low expression
levels that were not adequate for a rescue of the LSD1-null ES cell phenotype (Figure
5.2). FACS analysis indicated that the percentage of cells expressing EGFP 24 hours
after transfection with pCAGGS constructs was only between 12 and 21% (Figure
5.4A). However, upon analysis of fusion protein expression by Western blot using the
LSD1 C-terminal antibody, high protein expression was observed at this time of cell
harvesting (Figure 5.4B). This expression was in fact higher than endogenous LSD1
levels. The combined results indicated that under a quarter of the cell population was
expressing recombinant protein at extremely high levels, which was not a
recapitulation of the cellular state of Lsd1Lox/∆3 ES cells. This was an early indication
that selection or sorting of recombinant protein-expressing cells was necessary.
Notably, at 24 hours after transfection, no obvious increase in CoREST levels was
observed in LSD1 rescued cells (Figure 5.4B middle panel). This suggested that the
next essential experiment was to assess the ability for recombinant LSD1 to associate
with the CoREST complex and that longer transient re-expression of LSD1 might be
required to rescue CoREST levels. This strong expression of LSD1 could be harnessed
nonetheless for LSD1 immunoprecipitation and co-purification of CoREST and HDAC1.

217
<1%
Untransfected
12%
pCAGGS EGFP-LSD1FL
21%
pCAGGS EGFP-LSD1166-853
18%
pCAGGS EGFP-LSD1277-853
17%
pCAGGS EGFP-LSD1KA
15%
pCAGGS EGFP-LSD1TOWER
Figure 5.4 Transfection efficiency and expression of all rescueconstructs 24 hours after transfection (A) FACS analysis to identifyGFP-positive cell populations identified a transfection efficiencybetween 12-21% with pCAGGS rescue constructs. (B) Western blottingrevealed high expression of rescue constructs at 24 hours posttransfection. The size of EGFP is 27KDa, therefore this tag increasesthe sizes of detectable LSD1. -tubulin was used as a protein loadingcontrol. Note the unequal loading of protein in the first lane.
B
A

218
5.2.3 Analysis of recombinant LSD1 protein interactions
Preliminary analysis of recombinant protein expression levels showed that expression
was highest at 24 hours after transfection and then decreased, either due to exclusion
of the expression vector from ES cells or diminishing promoter function. Therefore,
protein was harvested at 24 hours to test the ability of all forms of recombinant LSD1
to contribute to reformation of the CoREST complex. LSD1 was purified from ES cell
extracts using the C-terminal LSD1 antibody and the co-purification of CoREST and
HDAC1 was assessed. LSD1 was successfully immunoprecipitated from Lsd1Lox/∆3 ES
cells but no LSD1 was immunoprecipitated from Lsd1∆3/∆3 ES cells transfected with
pEGFP-C1 which expressed EGFP alone (Figure 5.5A, top panel lanes 3 and 5). This
data was in accordance with immunoprecipitation experiments documented in
Chapter 4. All recombinant proteins could be immunoprecipitated with the LSD1
antibody (Figure 5.4A, top panel). Importantly, whereas CoREST could not be co-
purified with LSD1 in Lsd1∆3/∆3 ES cells (lane 5), CoREST protein was co-purified with
recombinant WT LSD1 (FL and 166), as well as 277, KA and surprisingly TOWER
mutants (lanes 7, 9, 11, 13, 15). Deacetylase assays of LSD1 immunoprecipitates
showed that all recombinant LSD1 proteins could also co-purify deacetylase activity
(Figure 5.4B), even though HDAC1 co-purification could not be easily identified
through western blotting (Figure 5.4A). This biochemical data suggested that the
TOWER mutant did not function as intended as it could co-purify CoREST (Figure 5.4A
lane 15) and deacetylase activity (Figure 5.4B). Overall, all forms of re-expressed LSD1
could bind within the CoREST complex and therefore presumably rescue reduced
CoREST levels if expressed for longer than 24 hours. The TOWER mutant was
discarded from analysis at this point due to wild-type biochemical behaviour.

219
Figure 5.5 Recombinant LSD1 is incorporated into an HDAC-containing complex. (A) Immunoprecipitation of LSD1 in Lsd1Lox/∆3,Lsd1∆3/∆3 and Lsd1 ∆3/∆3 ES cells re-expressing recombinant LSD1shows that LSD1 can be purified and CoREST co-purified in all cells,including the TOWER domain mutant. Sin3A was used as a negativecontrol, which does not bind LSD1. HDAC1 co-immunoprecipitationwas inconclusive through Western blotting however (B) shows thatdeacetylase activity is co-purified with all forms of recombinant LSD1,including the TOWER domain mutant.
B
A
1 2 3 4 5 6 7 8 9 10 11 12 13 14 15

220
5.2.4 Analysis of the ability for re-expressed wild-type LSD1 to rescue
CoREST levels and gene expression
EGFP-LSD1166 could bind CoREST/HDAC1, with FACS and western blot data indicating
that it was the most highly expressed recombinant protein. It was therefore used to
see if phenotypes of Lsd1∆3/∆3 ES cells could be rescued following a longer period of
transient re-expression, as there was no obvious effect on CoREST protein levels at 24
hours. A titration of Lipofectamine 2000 (6l, 8l and 10l) was used in transfections
to increase the expression level of EGFP-LSD1166 and assess corresponding levels of
CoREST. Two different quantities of plasmid were also used in transfection (1g and
2g). ES cells were harvested 48 hours after transfection in order to allow more time
for recovery of CoREST protein levels, as CoREST protein stability had previously be
shown to be dependent on the ability to bind LSD1. An increase in the quantity of
Lipofectamine 2000 resulted in an increase in EGFP-LSD1166 protein level (Figure 5.6A
and B), which correlated with an increase in CoREST protein level (Figure 5.6A and C).
This data confirmed that EGFP-LSD1166 rescued CoREST protein levels by allowing re-
formation of the CoREST complex. This effect consequently resulted in the rescue of
expression of three genes that were de-regulated in Lsd1∆3/∆3 ES cells (Figure 5.7A-C).
The unchanged levels of HDAC2 (Figure 5.7D) confirmed that the trend in rescue of
Brachyury, DDR2 and RASGRP3 was specific to expression of EGFP-LSD1166. The rescue
of Brachyury expression is also further confirmation that LSD1 represses Brachyury as
part of the CoREST complex (Chapter 4).

221
Figure 5.6 Titration of WT rescue construct expression identifies arecovery of CoREST levels in Lsd1Lox/∆3 ES cells. (A) IncreasingLipofectamine 2000 reagent quantities with 1g and 2g of pCAGGS-EGFP-LSD1166 plasmid correlates with an increase in transient expression ofrecombinant protein. Protein extracts were harvested at 48 hours aftertransfection. (B) Quantification of EGFP-LSD1166 protein expression from(A). (C) Quantification of CoREST protein levels from (A). Protein levelswere calculated relative to the protein loading control, -tubulin.
A
B
C

222
Figure 5.7 Expression of EGFP-LSD1166 rescues the expression of genes up-regulated in Lsd1Lox/∆3 ES cells. Increasing expression of EGFP-LSD1166 asrepresented in Figure 5.6A and B (2g plasmid quantity) causes acorrelative re-repression of (A) Brachyury, (B) DDR2 and (C) RASGRP3, butno change in (D) HDAC2, a gene unaffected by loss of LSD1.
A B
C D

223
5.2.5 LSD1 demethylase activity is not required for gene repression
The observation that less than 20% of ES cells were over-expressing exogenous LSD1 at
above physiological levels (Figure 5.4) prompted the move to sort or select plasmid-
expressing cells. This could also be combined with longer culture of cells following
transfection in attempt to rescue gene expression to original levels. FACS sorting of
GFP-positive cells was unsuccessful as most of the cells died during the sorting
processes and therefore there were insufficient cells to harvest or even establish
further cell cultures with. It appeared that the expression plasmids were being
rejected from cells beyond 24 hours after transfection, therefore selection of cells that
retained the plasmid was performed. This involved co-transfecting ES cells with the
pCAGGS construct and a plasmid containing a Hygromycin resistance gene (HygR). The
culture of ES cells in the presence of 50M hygromycin would kill untransfected and
plasmid-excluding cells over a 5 day period, to allow the propagation of Lsd1∆3/∆3 ES
cells expressing recombinant LSD1. Previous analysis of ES cell kill curves using 50M
hygromycin had been assessed by the Geneta laboratory, concluding that this drug
concentration killed all non-resistant ES cells within 5 days of drug exposure.
To investigate the effects of the catalytically inactive LSD1 mutant, EGFP-LSD1KA was
compared to the EGFP-LSD1FL. The mutation was introduced into full-length LSD1 and
therefore the most reliable comparison was with wild-type FL protein. Firstly, the
EGFP-LSD1KA mutant was confirmed to be catalytically impaired as the demethylase
activity in EGFP-LSD1KA-transfected cells was comparable to LSD1 knockout cells
(Figure 5.8). In addition to this, the significant difference in detectable demethylase

224
activity towards a recombinant H3K4me2 substrate in the Lsd1Lox/∆3 to Lsd1∆3/∆3 cells
confirmed the assay was sensitive to demethylase activity associated with LSD1
(p<0.05).
Figure 5.8 The EGFP-LSD1KA construct expressedcatalytically inactive protein. ES cells extracts wereharvested and protein concentrations wereequalised before catalytic activity was measured byformaldehyde production from a demethylationreaction with a recombinant H3K4me2 substrate(Active Motif). n=3 +/- S.E.M. * p<0.05
*

225
Assessment of co-transfected cells after 5 days showed enrichment for recombinant
LSD1 in cells grown under hygromycin selection (Figure 5.9A). This selected
population also showed a significant increase in CoREST levels (Figure 5.9A and B).
This result suggested that even though recombinant LSD1 expression was not identical
to Lsd1Lox/∆3 expression, the 5 day period of expression within a more homogenously
behaving population of cells could more effectively rescue phenotypes. Moreover,
gene expression analysis showed that selection resulted in complete rescue of DDR
mRNA levels in both EGFP-LSD1FL and EGFP-LSD1KA-transfected ES cells (Figure 5.9C).
This suggested demethylase activity was not required for repression of DDR2. This
observation in EGFP-LSD1KA-transfected ES cells prompted more extensive analyses of
gene expression between ES cells transfected with EGFP-LSD1FL and EGFP-LSD1KA.
Quantitative RT-PCR analysis demonstrated that 5 day expression of EGFP-LSD1FL
rescued expression in seven out of seven over-expressed genes, with the HDAC1
control gene unchanged (Figure 5.10). Notably though, expression of the catalytic
mutant form of LSD1 also rescued expression of all these genes (Figure 5.10).
Therefore the demethylase activity of LSD1 was dispensible in the rescue of de-
regulated genes, implying demethylase activity is not essential for gene repression.
However, slightly higher expression of all genes in EGFP-LSD1KA transfected cells (most
recognisable in BARX2) suggests that demethylase activity may be required to
maintain repression. Further culture of ES cells expressing the mutated LSD1 might
have revealed release of repression of these genes in the absence of an active
demethylase. The presence of the bivalent modification at the Brachyury promoter
suggests that active demethylation by LSD1 would not govern gene regulation.
Increases in H3K4me2 and H3K4me3 at the Brachyury promoter following LSD1

226
deletion may simply be a by-product of increased transcription, and changes in
acetylation state possibly dictate an increase in expression. An alternative thought is
that the LSD1/HDAC/CoREST repressor complex serves as an obstruction to TrxG
complexes that can apply the H3K4me3 modification and facilitate gene activation.
Other bivalent genes (Barx2, Spink2 and Thy1), not yet confirmed as direct targets of
LSD1, may be responding through similar mechanisms. The analysis of the TOWER
mutant in these experiments would have been very useful in determining whether the
ability of LSD1 to re-associate with HDACs (via CoREST) was sufficient to re-repress
genes at this 5 day time point. Ultimately, stable transfection of rescue constructs and
analysis of gene expression over an extended period of time would provide more
explicit data on the biological interplay of LSD1 catalytic activity and HDACs in target
gene repression.

227
Figure 5.9 Five-day selection of transfected FL and KA constructsshows more effective rescue of CoREST levels and geneexpression. (A) Western blotting shows selection for plasmidexpression ES cells, following co-transfection of FL and KA rescueconstructs with a HygR plasmid. This results in enrichment forrecombinant protein expression in Lsd1∆3/∆3 ES cells. Theenrichment for FL and KA protein correlates with enhanced rescueof (B) CoREST protein levels and (C) DDR2 gene expression levels.DDR expression was normalised to GAPDH. n=3 +/- S.E.M.
A
B
C

228
Figure 5.10 Catalytically inactive LSD1 can rescue gene expression inLsd1∆3/∆3 ES cells. Gene expression analysis of 7 up-regulated genesin Lsd1∆3/∆3 ES cells, cultured for 5 days under hygromycin selection,shows that catalytically inactive LSD1 (KA) re-represses geneexpression to a similar extent as the fully-functional demethylase (FL).HDAC1, a gene unaffected by loss of LSD1 was used as a control,which remains unchanged following FL and KA transfection. Geneexpression levels were normalised to GAPDH and represented as afold change relative to Lsd1Lox/∆3 expression. n=3 +/- S.E.M.

229
5.3 Conclusions
The results reported in this chapter constitute attempts to rescue Lsd1∆3/∆3 ES cells.
Importantly, the re-expression of WT LSD1 increased CoREST levels and re-repressed
genes that are up-regulated in LSD1 knockout ES cells. These results proved that
observations in Lsd1∆3/∆3 ES cells were specific to the deletion of the protein of
interest. However, there are further assays that were planned to test the specificity of
phenotypes in Lsd1∆3/∆3 ES cells. These included assessment of the ability to rescue
differentiated-associated cell death, global H3K56 acetylation levels and histone
modifications at the Brachyury locus. Ultimately a stable transfection of WT and KA
LSD1 is most likely required for these experiments. However, the ability to remove
one of the catalytic components of the CoREST complex by re-expressing a
‘demethylase-dead’ form of LSD1, allowed insights into the mechanisms of LSD1
functions. Incorporation of a catalytically inactive form of LSD1 into the CoREST
complex had the ability to not only recover CoREST levels, as expected, but also cause
re-repression of genes over-expressed in LSD1 knockout ES cells. The deacetylase
activity of this reconstituted complex can explain re-repression of genes; though there
was an indication that demethylation of H3K4me2 might be required to maintain
repression. However, the presence of a repressor complex at target genes is
postulated to be sufficient to prevent association of activating complexes which
contain methyltransferases to catalyse addition of the H3K4me3.

230
6 Discussion
6.1 An essential role for LSD1 in early embryonic development
LSD1 was initially identified as an FAD-binding protein found in a complex containing
the co-repressor of REST, CoREST, the carboxy-terminal binding protein, CtBP, and
specific histone deacetylases, HDAC1 and 2 (Humphrey et al. 2001, You et al. 2001,
Hakimi et al. 2002, Shi et al. 2003). It can function as a histone H3K4me1/me2 and
H3K9me1/me2 demethylase (Shi et al. 2004, Metzger et al. 2005). LSD1 is known to
mediate the regulation of genes involved in cell-specific proliferation and
differentiation through LSD1/CoREST/HDAC association with a number of transcription
factors, including REST, Gfi, TAL1, TLX, Mef2c and MyoD (Shi et al. 2004, Shi et al.
2005, Saleque et al. 2007, Hu et al. 2009, Ouyang et al. 2009, Sun et al. 2010, Choi et
al. 2010).
Before the publication of data contained in this thesis, reporting an explanation for the
essential role of LSD1 in embryonic development, two other germline LSD1 knockout
mouse studies had been published. The timing of death in the LSD1 knockout embryos
is consistent with these previous reports (Wang et al. 2007, Wang et al. 2009).
However, neither of these reports provided embryonic analyses that could
convincingly explain pre-gastrulation embryonic lethality. The study in 2007
demonstrated that LSD1 is required for late cell-type differentiation in the pituitary
through activation of Pit1-dependent target genes (Gh, Prl and Tshb) at E16.5-17.5.

231
These analyses of a conditional LSD1 deletion failed to provide reasoning for a much
earlier developmental block within the embryo (Wang et al. 2007). The phenotype of
the LSD1 knockout published in 2009 was attributed to increased cell death and
impaired cell cycle progression of LSD1 deleted ES cells, which resulted from
decreased levels of the maintenance DNA methyltranferase DNMT1 and subsequent
hypomethylation of DNA (Wang et al. 2009). However, embryonic lethality is unlikely
to be solely caused by reduced DNMT1, since Dnmt1 mutant embryos survive to mid-
gestation, whereas Lsd1 mutants die at the onset of gastrulation (Wang et al. 2007, Li
et al. 1992).
The previously reported non-viability of embryos with a germline deletion for LSD1 as
well as our Lsd1-geo/-geo genetrap embryo data prompted the generation of ES cells
where LSD1 may be conditionally deleted. The indication from one publication that
LSD1-deleted ES cells might not be viable also instigated a conditional deletion
strategy (Wang et al. 2009). Control of protein deletion would enable assessment of
the impacts of LSD1 removal in cells that are equivalent to those of the embryonic
epiblast. If the viability of undifferentiated ES cells was unaffected then the impact of
LSD1 loss on early differentiation events in the post-implantation embryo could be
analysed through in vitro differentiation assays, which recapitulate this period of
development. Data from our Lsd1-geo/-geo genetrap embryos and Lsd1∆3/∆3 ES cells has
provided a better understanding of the essential role of LSD1 in the survival of the
post-implantation embryo. Prior to implantation, Lsd1-geo/-geo blastocysts occur at
expected Mendelian ratios and appear morphologically normal. In vitro cultured of

232
Lsd1-geo/-geo blastocysts show robust outgrowth of the ICM (Figure 3.1K-M) and
Lsd1∆3/∆3 ES cells show no reduction in proliferative potential (Figure 3.7A and B),
suggesting that embryonic lethality does not occur due to impaired cell cycle
progression within the epiblast, as stated by Wang et al. 2009, but a developmental
block shortly after implantation. The conditional deletion of LSD1 in ES cells allowed
assessment of the DNA hypomethylation phenotype previously reported (Wang et al.
2009). The observation that DNA methylation was unaffected at 6 days after the
complete loss of LSD1 protein (Figure 3.5A and Figure 3.9A lane 3) suggested there
would be no defects in maintenance methylation in E6.5 embryos. Ultimately, if
defects in maintenance DNA methylation were solely causal of embryonic death in
Lsd1-geo/-geo embryos, reduced Dnmt1 at 11 days (4 to 15 days) after loss of LSD1
protein (Figure 3.8B compare day 4 to 15) should correlate with a mid-gestation time
of embryonic death, which is the case in Dnmt1-/- embryos (Li et al. 1992). At this
stage of the research, it was proposed that death of the Lsd1-geo/-geo genetrap embryo
was likely due to a developmental block, underpinned by mechanisms independent of
Dnmt1 and DNA methylation. A recent publication in fact corroborated this
dissociation of LSD1 from Dnmt1 in the early embryo and ES cells (Macfarlan et al.
2011).
Unlike the ubiquitous expression pattern involved in the head-fold stage and beyond
(Figure 3.1D and E), LSD1 expression in the post-implantation embryo is restricted to
the embryonic portion of the embryo (Figure 3.1F and G). Based on the expression
pattern, it appears that Lsd1-geo/-geo embryos lack extra-embryonic tissue, indicating

233
developmental stall before the elongation of the epiblast and an inability to form
extra-embryonic tissue. However, the ability for Lsd1∆3/∆3 ES cells to repress Oct4
suggests that trophectoderm development might not be perturbed (Figure 3.13A).
Outgrowth of the ICM in blastocyst outgrowth assays indicated that pluripotent ES
cells could be derived from the ICM in the absence of LSD1 (Figure3.1K-M). This
further suggests that LSD1-deficient cells of the ICM maintain normal levels of Oct4
and Nanog, as lack of these factors results in failure to maintain the epiblast and
pluripotency in ES cells (Nichols et al. 1998, Mitsui et al. 2003). This was confirmed
through the ES cells generated from gene targeting, which maintained self-renewal
capacity and normal expression of Oct4 and Nanog (Figure 3.7, 3.10A and B, Figure
3.13A).
The Oct4 promoter shows progressive decrease in H3K4 methylation during
differentiation of ES cells in the absence of LIF and retinoic acid-mediated
differentiation of embryonic carcinoma cells, implicating a potential role for LSD1 (Lee
et al. 2004b, Feldman et al. 2006). However, Oct4 is successfully repressed in absence
of LSD1, which would suggest that LSD1 is not required for repression of Oct4 upon ES
cell differentiation, and hence the involvement of an alternative H3K4-specific lysine
demethylase (KDM). This was interesting because LSD1 and CoREST localise to the
CR4 region of Oct4 in P19 embryonic carcinoma cells to repress Oct4, with inhibition of
LSD1 causing Oct4 de-repression (Lee et al. 2006b). P19 cells represent those of the
primitive ectoderm where as ES cells are derived from the pluripotent ICM. The
contrasting observations between the two cell types may reflect enzymatic

234
redundancy for the removal of H3K4 methylation in ES cells, which is not a feature of
P19 cells. Additionally, the report that Oct4 protein associates with LSD1 in ES cells
suggests that LSD1 would not have an essential role in the repression of Oct4 gene
itself (Pardo et al. 2010). The related amine oxidase, LSD2 can demethylate mono-
and di-methylated H3K4 (Karytinos et al. 2009) and several JmjC domain containing
enzymes also contain specificity to H3K4me2, including JARID1A, JARID1B, JARID1C,
JARID1D, with all but JARID1D expressed in ES cells (Su et al. 2004, Christensen et al.
2007, Iwase et al. 2007, Klose et al. 2007, Lee et al. 2007a). Knockout mice have been
generated for LSD2 (Ciccone et al. 2009) and JARID1A (Klose et al. 2007), but neither is
essential for embryonic development. Therefore possibly JARID1B, JARID1C may have
a role in demethylation of H3K4 at the Oct4 promoter upon ES cell differentiation. A
developmental block was also not attributed to the inability to differentiate through
repression of other pluripotent factors. LSD1-deleted ES cells were still able to down-
regulate alkaline phosphatase (AP) upon LIF withdrawal and repress transcription of
Nanog and Rex1 upon EB differentiation (Figure 3.10A and Figure 3.13A). The inability
to repress Nanog in particular is known to cause resistance to retinoic acid-induced
differentiation, which was not the case here. ES cell aggregation as EBs, which
requires Nanog repression, could also be achieved in the absence of LSD1, albeit with
increased levels of cell death (Figure 3.11).
LSD1 has been identified as one of a number of co-repressor proteins that bind Oct4 in
ES cells (Pardo et al. 2010, van den Berg et al. 2010). LSD1 may therefore play a direct
role in mediating transcriptional regulation by Oct4. A key role of Oct4 is to control

235
repression of developmental genes in order to maintain stem cell pluripotency and
self-renewal (Boyer et al. 2006, Loh et al. 2006). This indicates that repression of some
developmental genes is controlled by co-occupancy of Oct4, LSD1 and associated
repressors. Many repressed targets of Oct4 are co-occupied by PcG repressor proteins
(Lee et al. 2006), where deletion of PRC2 components also results in post-implantation
embryonic lethality (O'Carroll et al. 2001, Pasini et al. 2004). The loss of LSD1 does
not diminish the ability for Oct4 to maintain pluripotency and self-renewal, since
Lsd1∆3/∆3 ES cells do not spontaneously differentiate in culture (Figure 3.10A and B).
This is comparable to reports that PRC2 activity is not necessary for the maintenance
of the pluripotent state in ES cells, where even though developmental regulators are
over-expressed in EED-null ES cells, the positive regulation of pluripotency factors is
sufficient for functional pluripotency (Chamberlain et al. 2008). This all suggests that
LSD1 could be repressing developmental genes, though it would be unsurprising if
these LSD1 and PRC2-proteins were found to have different gene specificities.

236
6.2 LSD1 regulates the transcriptome during embryonic development
Comparative microarray analysis of Lsd1Lox/∆3 versus Lsd1∆3/∆3 ES cells revealed that
60% more genes were up-regulated (362) than down-regulated (226), supporting the
loss of a direct repressive factor (Figure 4.7). This is consistent with the global increase
in H3K9 and H3K56 acetylation (Figure 4.5). However, the down-regulation of a
considerable number of genes in the absence of LSD1 makes it is clear that either
there are off-target effects or that Lsd1 also acts as an activator on 40% of the targets.
These transcriptional changes occur independently of the reduced genomic
methylation, since levels of DNA methylation was unchanged 10 days after induction
of LSD1 deletion, when ES cells were analysed. Furthermore, recent genome-wide
methylation analysis in human ES cells has shown that nearly one-quarter of all
methylation identified is in a non-CpG context, suggesting there is lower correlation
between CpG methylation and gene expression in ES cells (Lister et al. 2009). Results
in this thesis therefore identify a correlation between LSD1-dependent gene regulation
and histone modifications, rather than DNA methylation.
The figure of 588 transcripts is relatively small in comparison to the number of
potential LSD1 gene targets identified in three global ChIP studies in MEL and MCF7
cells (5191 and 4212/1913, respectively; Garcia-Bassets et al. 2007, Saleque et al.
2007, Wang et al. 2009a). These global ChIP studies were performed in somatic cells,
though the data infers that LSD1 activity may not be essential for the repression (or
potentially activation) of all targets in ES cells. It is noteworthy that Gfi-1/1b and the
oestrogen receptor, factors which determine LSD1 recruitment to target promoters in

237
these studies, are not expressed in ES cells. A very recent report that LSD1 binds 2144
genes in human ES cells also supports the idea that not all LSD1 targets are affected by
LSD1 deletion (Adamo et al. 2011). A complete list of genomic binding sites of LSD1 in
mouse ES cells has not yet been compiled and ultimately global ChIP analysis would
reveal which of these 588 genes are direct targets as well as identify additional targets
that are not de-regulated upon LSD1 deletion.
Altered transcripts encompassed a wide range of biological processes and molecular
functions (Figure 4.9). This was expected due to the nature of LSD1 as a chromatin
modifier in a repressor complex, as opposed to being a direct DNA binding protein
downstream of a specific intracellular signalling pathway. Gene ontology analyses of
de-regulated genes reveals enrichment for genes involved in various metabolic
processes and developmental processes (Figure 4.9). Notably, notochord
development and spinal cord patterning are developmental processes and include
genes encoding the transcription factors Brachyury, Gli2 and Reelin (Figure 4.9 and
Appendix Table A3). Considering the perturbation of ES cell differentiation and
embryogenesis, the de-regulation of other transcription factors with roles in
anterior/posterior patterning and tissue specific development (Hoxb7, Hoxd8, Barx2,
RAR) appears noteworthy. Interestingly, the recent findings in human ES cells
demonstrated that LSD1 directly controls developmental regulators (including
Brachyury, FOXA2, EOMES and BMP2) and knockdown of LSD1 causes up-regulation of
these genes and spontaneous ES cells differentiation (Adamo et al. 2011). However,
the up-regulation of many developmental factors and the significant enrichment for

238
genes with a muscle-specific function (Figure 4.9 and 4.10) does not cause loss of
pluripotency in ES cells (Figure 3.10), indicating differing tolerance to aberrant
expression of developmental genes in human and mouse ES cells. It is important to
note that our identification of LSD1 as a direct regulator of Brachyury in ES cells pre-
dates this publication.
LSD1 appears to function crucially by controlling the expression of lineage-specific
genes, for example Brachyury. Altered expression of this key developmental regulator
as well as Hoxb7, Hoxd8, Barx2 and RAR in undifferentiated Lsd1∆3/∆3 ES cells supports
the hypothesis that embryonic lethality is caused by multiple aberrant and conflicting
developmental signals. Brachyury expression should be barely detectable in
undifferentiated ES cells, with induction of this gene expected at day 3 of ES cell
differentiation (Keller et al. 1993). In the embryo, Brachyury expression is equivalently
up-regulated at the onset of gastrulation in the primitive streak and axial mesoderm
(Kispert & Herrmann 1994). EB differentiation assays demonstrate that this dramatic
over-expression of Brachyury at day 2 is followed by loss of expression at day 5 (Figure
3.13B); this precocious expression pattern correlates with a period of significant
differentiation-associated cell death induced by RA and LIF withdrawal in serum-free
media (Figure 3.12A and B). Subsequent experiments showed a striking over-
expression of Brachyury in Lsd1-geo/-geo embryos at E6.5, just before embryonic death
(Figure 4.18). This was an important in vivo corroboration of ES cell based results,
which justified use of the ES cell system to interpret an early embryonic phenotype.

239
The loss of LSD1 causes a 3- to 5-fold increase in Brachyury mRNA, whereas induction
of differentiation results in a 20-30 fold increase in transcript abundance (Figure 3.13B
and 4.14A). The removal of repressive factors (LSD1 and HDAC1/2) causes a modest
increase in gene expression (approximately 3-fold; Figure 3.13B, 4.8A, 4.14A), which is
amplified upon differentiation (approximately 25-fold; Figure 3.13B, 4.14A). Even
though Brachyury is up-regulated in undifferentiated ES cells, the onset of
differentiation appears to cause cell death. This effect supports the recent report
from the Ramanathan lab that only at 48 hours after removal of pluripotency-
promoting conditions (LIF and serum) do ES cells become competent to respond to
differentiation-inducing signals, such as over-expression of developmental genes
(Thomson et al. 2011). The molecular basis of this ES cell differentiation-responsive
state was found to be down-regulation of Nanog levels at 48 hours after LIF and serum
removal. This was backed-up by the observation that addition of a Wnt agonist, to
stimulate mesoendodermal differentiation, could only activate Brachyury expression,
in pluripotent-promoting conditions, when Nanog was depleted by siRNA (Thomson et
al. 2011). The observation of down-regulation of Nanog at 2 days of EB differentiation
and correlation with an amplified increase in Brachyury expression are corroborated
by these recent findings (Figure 3.13A and B). Data in Thomson et al. and in this thesis
also verifies the prior indication that over-expression of Brachyury and other
developmental regulators in undifferentiated LSD1 knockout cells does not override
the ability for stem cell factors such as Nanog to maintain the pluripotent state
(Chamberlain et al. 2008). It has also been shown that ES cells overespressing Nanog
are resistant to differentiation induced by retinoic acid (Chambers et al. 2003, Loh et
al. 2006). It is therefore presumable that repression of Nanog allows cells to respond

240
to developmental gene expression patterns, which is defective in LSD1 deleted cells,
consequently resulting in cellular crisis and cell death. To test this hypothesis, an
interesting further experiment would have been to attempt to maintain the expression
of Nanog during the induction of differentiation, to see if this prevents the onset of a
differentiation-responsive state and subsequent cell death in Brachyury over-
expressing, Lsd1∆3/∆3 cells.
As Brachyury should not be expressed in ES cells or cells of the embryonic epiblast, an
RNAi-mediated knock-down of this gene in LSD1-depleted ES cells could have been
implemented to assess the significance of the over-expression of this key
developmental regulator at the onset of differentiation. If aberrant over-expression of
Brachyury was the main contributer to differentiation-associated cell death, reduction
of its expression might alleviate this phenotype. It was also assumed that over-
expression of Brachyury at day 2 of EB differentiation and in embryos is restricted to
appropriately fated cell-types (axial mesoderm and primitive streak). However
analysis of day 15 EBs revealed that ectoderm cell-types die as well (Figure 3.14),
suggesting that inappropriate ectopic expression of Brachyury might occur in regions
fated to give rise to ectoderm. These events have been previously observed with
Brachyury transcripts in the early embryo (Faust et al. 1995). In situ hybridisation of
Brachyury mRNA in Lsd1-geo/-geo embryos at E6.5 would have been a key experiment
to address this hypothesis. However, difficulties in harvesting knockout embryos at
this stage made this assay unfeasible. Alternatively, defects in ectoderm
development may arise through other mechanisms.

241
ES cell differentiation assays can illustrate which lineages have the potential to
develop in the absence of certain factors. ES cell differentiation in EBs occurs in a
disorganised fashion (Murry & Keller 2008), therefore to understand more precisely
which lineages are development impeded in the absence of LSD1, refined EB
formation techniques or more specific types of differentiation assay using defined
growth factors could be implemented. In vitro differentiation assays that actively
inhibit development of primitive ectoderm could be performed. The formation of the
primitive ectoderm (FGF5 up-regulation; Rex1 repression) and differentiation into
ectoderm, mesoderm and definitive endoderm requires the withdrawal of LIF (Shen &
Leder 1992, Murray & Edgar 2001). Aggregation of EBs in the presence of LIF would
only permit the formation of primitive endoderm (Hamazaki et al. 2004), a lineage that
survives in Lsd1∆3/∆3 EBs. Therefore, this technique could be implemented to prevent
the onset of primitive ectoderm development; potentially rescuing the cell death
phenotype of Lsd1∆3/∆3 EBs. On the other hand, mesoderm-inducing conditions could
be used to corroborate the link between cell death and mesoderm development. The
induction of a primitive streak-like region and differentiation in mesendodermal
progenitors can be achieved in EBs through activation of the Wnt pathway by
exogenous Wnt3a (ten Berge et al. 2008). This assay in fact mediates the local
execution of a gastrulation-like process, therefore would be an effective way to verify
the requirement for LSD1 at the onset of gastrulation in the developing embryo.
Alternatively, differentiation of ES cells into haemangioblasts would substantiate the
correlation of precocious Brachyury activation and differentiation-associated cell
death. This assay induces the formation of Brachyury- and Flk1-positive cell types,
which act as haematogenic precursors (Fraser et al. 2003). The inability for Tal1 and

242
CD34 expressing cells to develop in Lsd1∆3/∆3 EBs suggests that these precursors cannot
be generated in the absence of LSD1 (Figure 3.14C). The depletion of LSD1 and
CoREST has also been shown to impair haematopoietic differentiation in studies
performed in MEL, megakaryoblastic and myeloid cell lines, as well as primary
haematopoietic cells (Saleque et al. 2007). This is due to up-regulation of Gfi-1/1b
target gene expression upon LSD1 deletion. The Gfi-1/LSD1/CoREST/HDAC complex
represses target genes in order to control differentiation of several haematopoietic
lineages via regulation of the H3K4 methylation state. These reports are supporting of
a situation whereby LSD1 and CoREST regulate mesoderm development in ES cells and
the embryo.

243
6.3 LSD1 knockout ES cells have reduced CoREST levels and increased
histone acetylation
Conditional deletion of LSD1 in ES cells results in a reduction of CoREST protein,
consistent with previous demonstration that knockdown of CoREST reduces LSD1
levels (Shi et al. 2005). This suggests a co-dependence on protein stability. The levels
of HDAC1 and HDAC2 were unaffected, most likely due to their occurrence in multiple
complexes (Yang & Seto 2008). In the absence of LSD1, CoREST, although reduced, still
has the ability to interact with HDAC1/2 via an N-terminal ELM2 domain in an LSD1-
independent manner (Lee et al. 2005, Lee et al. 2006a).
Perturbation of the LSD1/CoREST/HDAC complex encouraged examination of the
effects on global histone methylation and acetylation levels. Deletion of LSD1 causes a
number of small, but reproducible changes in global histone methylation (Figure 4.5A).
The levels of the LSD1 substrates, H3K4me1/me2, are increased only slightly, in
accordance with the results of Wang and colleagues, who state that 4% of promoters
gain H3K4me2 in LSD1-deleted cells (Wang et al. 2009, Baltus and Kadam
unpublished). The androgen and estrogen receptors, factors reported to switch the
LSD1 substrate specificity from H3K4me1/me2 to H3K9me1/me2 (Metzger et al. 2005,
Garcia-Bassets et al. 2007, Wissmann et al. 2007), are absent in ES cells. Therefore,
this modification was not scrutinised in detail, with the methylation status of H3K4 the
focus. ChIP-on-chip data in MCF7 and MEL cells suggests that LSD1 is associated with a
large number of gene promoters (Garcia-Bassets et al. 2007, Saleque et al. 2007,
Wang et al. 2009a), and that many of these genes are active (74% expressed in MCF7)
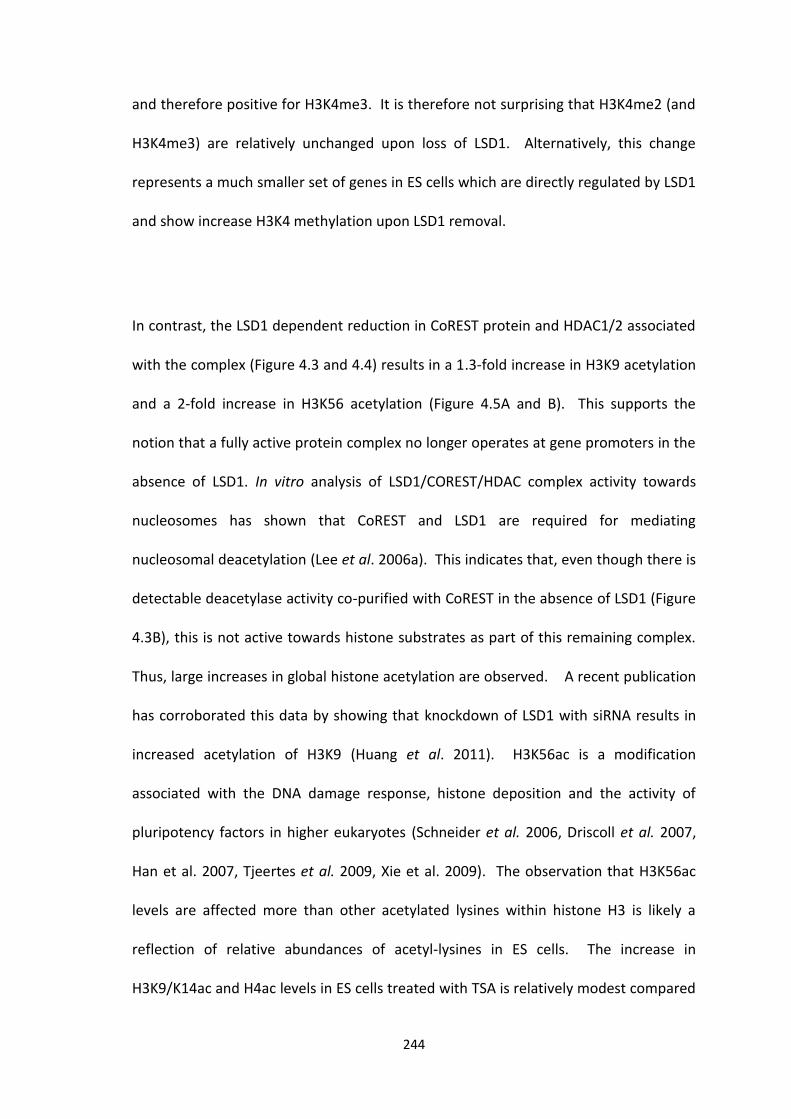
244
and therefore positive for H3K4me3. It is therefore not surprising that H3K4me2 (and
H3K4me3) are relatively unchanged upon loss of LSD1. Alternatively, this change
represents a much smaller set of genes in ES cells which are directly regulated by LSD1
and show increase H3K4 methylation upon LSD1 removal.
In contrast, the LSD1 dependent reduction in CoREST protein and HDAC1/2 associated
with the complex (Figure 4.3 and 4.4) results in a 1.3-fold increase in H3K9 acetylation
and a 2-fold increase in H3K56 acetylation (Figure 4.5A and B). This supports the
notion that a fully active protein complex no longer operates at gene promoters in the
absence of LSD1. In vitro analysis of LSD1/COREST/HDAC complex activity towards
nucleosomes has shown that CoREST and LSD1 are required for mediating
nucleosomal deacetylation (Lee et al. 2006a). This indicates that, even though there is
detectable deacetylase activity co-purified with CoREST in the absence of LSD1 (Figure
4.3B), this is not active towards histone substrates as part of this remaining complex.
Thus, large increases in global histone acetylation are observed. A recent publication
has corroborated this data by showing that knockdown of LSD1 with siRNA results in
increased acetylation of H3K9 (Huang et al. 2011). H3K56ac is a modification
associated with the DNA damage response, histone deposition and the activity of
pluripotency factors in higher eukaryotes (Schneider et al. 2006, Driscoll et al. 2007,
Han et al. 2007, Tjeertes et al. 2009, Xie et al. 2009). The observation that H3K56ac
levels are affected more than other acetylated lysines within histone H3 is likely a
reflection of relative abundances of acetyl-lysines in ES cells. The increase in
H3K9/K14ac and H4ac levels in ES cells treated with TSA is relatively modest compared
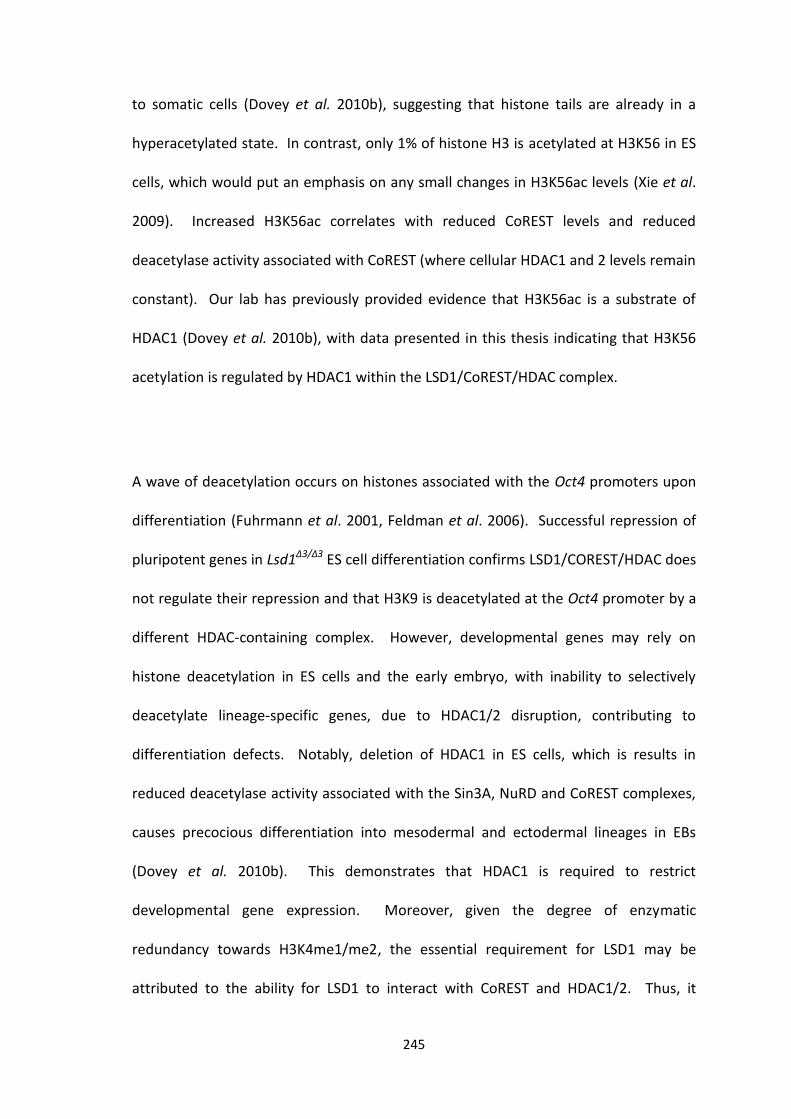
245
to somatic cells (Dovey et al. 2010b), suggesting that histone tails are already in a
hyperacetylated state. In contrast, only 1% of histone H3 is acetylated at H3K56 in ES
cells, which would put an emphasis on any small changes in H3K56ac levels (Xie et al.
2009). Increased H3K56ac correlates with reduced CoREST levels and reduced
deacetylase activity associated with CoREST (where cellular HDAC1 and 2 levels remain
constant). Our lab has previously provided evidence that H3K56ac is a substrate of
HDAC1 (Dovey et al. 2010b), with data presented in this thesis indicating that H3K56
acetylation is regulated by HDAC1 within the LSD1/CoREST/HDAC complex.
A wave of deacetylation occurs on histones associated with the Oct4 promoters upon
differentiation (Fuhrmann et al. 2001, Feldman et al. 2006). Successful repression of
pluripotent genes in Lsd1∆3/∆3 ES cell differentiation confirms LSD1/COREST/HDAC does
not regulate their repression and that H3K9 is deacetylated at the Oct4 promoter by a
different HDAC-containing complex. However, developmental genes may rely on
histone deacetylation in ES cells and the early embryo, with inability to selectively
deacetylate lineage-specific genes, due to HDAC1/2 disruption, contributing to
differentiation defects. Notably, deletion of HDAC1 in ES cells, which is results in
reduced deacetylase activity associated with the Sin3A, NuRD and CoREST complexes,
causes precocious differentiation into mesodermal and ectodermal lineages in EBs
(Dovey et al. 2010b). This demonstrates that HDAC1 is required to restrict
developmental gene expression. Moreover, given the degree of enzymatic
redundancy towards H3K4me1/me2, the essential requirement for LSD1 may be
attributed to the ability for LSD1 to interact with CoREST and HDAC1/2. Thus, it

246
appears that LSD1, a lysine demethylase, functions in part by regulating the lysine
acetylation status of chromatin by enabling HDACs to function at genomic loci as part
of a core complex. The ternary complex, which is enzymatically more active than
individual components (Lee et al. 2005, Lee et al. 2006a) is then capable of function
independently (You et al. 2001, Saleque et al. 2007) or as a module of broader super-
complexes containing multiple chromatin-associated factors (Hakimi et al. 2002, Shi et
al. 2003, , Lee et al. 2005, Shi et al. 2005).

247
6.4 Catalytic activity of LSD1 is dispensable for gene regulation
LSD1/CoREST/HDAC has so been shown here to directly repress a key developmental
gene in pluripotent ES cells. It is possible that this may be through association with
Oct4, based on the report that Oct4-LSD1 proteins interact and Oct4 binds the
Brachyury promoter in ES cells (Loh et al. 2006, Kim et al. 2008, Pardo et al. 2010). The
ablation of a Nanog- and Oct4-associated HDAC complex has previously been shown to
cause the inappropriate activation of numerous developmental genes in ES cells (Liang
et al. 2008). Here we show that a distinct HDAC complex, which may be directed to
targets by Oct4, is involved in developmental gene repression, though its disruption
does not cause loss of pluripotency of ES cells due to activation of developmental
genes; rather differentiation-associated cell death.
Within the set of genes up-regulated by loss of LSD1 there is enrichment of bivalent
genes, which possess the H3K4me2/me3 modification. This includes Brachyury
(Bernstein et al. 2006a), confirmed as a direct LSD1/CoREST/HDAC target (Figure 4.16).
As LSD1 is an H3K4me2 demethylase, this observation invites much discussion of
possible molecular mechanisms of LSD1 function at bivalent target genes. Individual
gene analysis prior to these reports, indicated that the Brachyury gene promoter
possesses H3K4me2 modification in undifferentiated ES cells, with a specific increase
in H3K4me3 at day 5 of EB differentiation, coinciding with the time of highest
Brachyury induction (Lee et al. 2004a). Removal of LSD1 from this locus in
undifferentiated ES cells causes the accumulation of the H3K4me3 state that is

248
proposed to coincide with Brachyury activation during differentiation (Figure 4.16). As
results in this thesis have demonstrated that LSD1 catalytic activity is dispensable for
gene repression (Figure 5.10), the LSD1/CoREST/HDAC complex is suggested to have a
role in preventing the accumulation of H3K4me3 at H3K4me2-positive promoters,
possibly through preventing the association TrxG complexes that contain H3K4me3-
specific KMTs, such as MLL2. The fact that LSD1 is not serving as an active
demethylase at bivalent genes that already possess H3K4me2 (the LSD1 substrate) is
further evidence that LSD1-containing complexes play an obstructive role at bivalent
genes. Interestingly, MLL2 knockout ES cells display a delay in the development of
germ layers upon in vitro differentiation, including a slight delay in Brachyury
expression (Lubitz et al. 2007). This suggests that LSD1- and MLL2-complexes act
antagonistically at common genes. Data in this thesis shows analogy with the
H3K4me2/me3 demethylase JARID1 (RBP2), which resides on a number of bivalent
Hox genes (Hoxa1, Hoxa5, and Hoxa7) in undifferentiated ES cells to prevent the
accumulation of H3K4me3 and hence their expression (Bernstein et al. 2006a,
Christensen et al. 2007). RBP2 is displaced from Hox genes upon ES cell
differentiation, correlating with their activation (Christensen et al. 2007).
A recent analysis of LSD1 in human ES cells, found that LSD1 regulates bivalent genes
in human ES cells through direct association. However, the knockdown of LSD1 results
in spontaneous differentiation of human ES cells, suggesting a different tolerance to
developmental gene de-regulation in the absence of LSD1 between mouse and human
ES cells (Adamo et al. 2011). Importantly, this study has shown that 17% of genes de-

249
regulated upon LSD1 deletion can be rescued by catalytically inactive LSD1 (K661A),
corroborating data in this thesis (Figure 5.10).
As the CoREST complex contains two enzymatic activities, with synergistic effects, it
may be expected that chromatin modification regulation beyond control of H3K4 and
H3K27 methylation level is required for activation of genes bound by
LSD1/CoREST/HDAC. A persuasive argument for this is that the deletion of the PRC2
components, EZH2, SUZ12 and EED, and a consequent decrease in H3K27me3 level, do
not reveal up-regulation of Brachyury (Boyer et al. 2006, Lee et al. 2006, Chamberlain
et al. 2008, Shen et al. 2008a). Data has revealed that reconstitution of the
LSD1/CoREST association and re-association of deacetylase activity with LSD1 (Figure
5.5), is sufficient to rescue gene expression in LSD1 knockout ES cells (Figure 5.10).
The identification of deacetylase activity co-purifying with recombinant LSD1 confirms
that the substantial increase in global histone acetylation observed in LSD1-depleted
cells is specific to disruption of the LSD1/CoREST/HDAC complex (Figure 4.3 and 4.4).
Since biochemical experiments have shown that histone tail deacetylation by the
CoREST complex occurs before H3K4 demethylation (Forneris et al. 2006, Lee et al.
2006a), it seems likely that deacetylation could prime gene repression and the
localisation of the reformed CoREST complex can mediate gene expression regardless
of demethylase activity. In addition, the reformed complex could displace H3K4me3-
specific KMTs (such as MLL2), which maintain the H3K4me3 modification in activated
genes; hence directly rescuing acetylation levels and indirectly rescuing H3K4
methylation state. Alternatively, the regulation of histone acetylation may simply be

250
more influential in the control of expression of genes bound by LSD1/CoREST/HDAC.
This is supported by the ability to rescue the expression of genes initially unmodified
at H3K4, which would presumably require active LSD1 demethylation to enforce this
chromatin state (Figure 5.10; DDR2, RASGRP3 and Omt2a). Failure for the TOWER
mutant to function as intended prevented complete confirmation that deacetylase
activity is solely sufficient. The identification of up-regulation of bivalent genes and
rescue with catalytically inactive LSD1 gives significance to a previous report showing
that the Rpd3 histone deacetylase interacts with the PRC2 complex and enhances PcG
complex-mediated gene repression through histone deacetylation (van der Vlag &
Otte 1999, Tie et al. 2003). Furthermore, in Drosophila, the mediation of
transcriptional activation by TrxG complexes, which antagonise PcG complex function,
is endowed by the ability to inhibit histone deacetylation (Lee et al. 2009). This
supports a crucial accompanying role of HDACs with LSD1 in gene repression.
It has been suggested that around 4% of promoters gain H3K4me2 in LSD1 deleted
cells, which was proposed to underpin the gene-specific regulation of H3K4me2
methylation (Wang et al. 2009). The figure of 4% figure might represent a small
proportion of genes bound by LSD1/CoREST/HDAC that require the demethylase or it
may be representative of H3K4me2 increase as a by-product of transcriptional
activation, which is mainly instigated by an increase in local histone acetylation.
However, further ChIP experiments are required to investigate the effect of re-
expressing WT and catalytically inactive LSD1 on the levels of H3K4me2, H4K4me3 and
H3K9ac at gene loci. ChIP followed by next generation sequencing (ChIP-seq)

251
experiments have recently been performed in collaboration with Ana Pombo, in order
to compare locus-specific H3K4me2 levels in Lsd1Lox/∆3 and Lsd1∆3/∆3 ES cells. This data
is still being analysed and has not been presented in this thesis. In addition to these
experiments, devising a new strategy to create an LSD1 mutant that cannot associate
with CoREST should be pursued to examine the requirement for CoREST complex
deacetylase activity at target genes. The expectation is that perturbation of this
interaction will produce analogous results to the full LSD1 protein deletion, as the
decrease in CoREST levels in the absence of LSD1 seems to be a poignant phenotype of
the knockout. This is the most feasible way of assessing HDAC involvement, as the use
of class I HDAC inhibitors will affect deacetylase activity in multiple repressor
complexes. Finally, to further investigate the proposed obstructive mechanism of an
LSD1-contained complex in controlling H3K4me3 levels, supported by the seemingly
opposite effects of LSD1 and MLL2 deletion on differentiation events (Lubitz et al.
2007), a combined conditional deletion of LSD1 and MLL2, or a knockdown of MLL2 in
LSD1 knockout ES cells should be pursued. The combinational ablation of the catalysis
of H3K4me3 may reveal reversion of gene up-regulation that relies on an increase in
this chromatin modification.
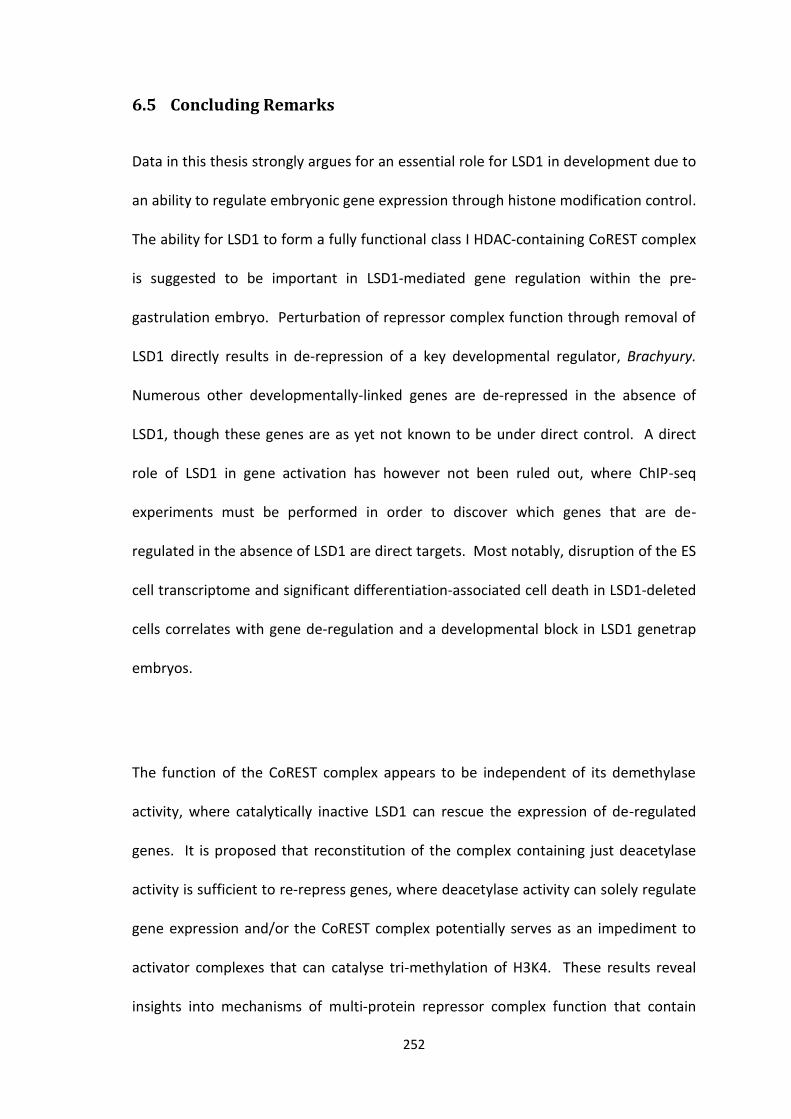
252
6.5 Concluding Remarks
Data in this thesis strongly argues for an essential role for LSD1 in development due to
an ability to regulate embryonic gene expression through histone modification control.
The ability for LSD1 to form a fully functional class I HDAC-containing CoREST complex
is suggested to be important in LSD1-mediated gene regulation within the pre-
gastrulation embryo. Perturbation of repressor complex function through removal of
LSD1 directly results in de-repression of a key developmental regulator, Brachyury.
Numerous other developmentally-linked genes are de-repressed in the absence of
LSD1, though these genes are as yet not known to be under direct control. A direct
role of LSD1 in gene activation has however not been ruled out, where ChIP-seq
experiments must be performed in order to discover which genes that are de-
regulated in the absence of LSD1 are direct targets. Most notably, disruption of the ES
cell transcriptome and significant differentiation-associated cell death in LSD1-deleted
cells correlates with gene de-regulation and a developmental block in LSD1 genetrap
embryos.
The function of the CoREST complex appears to be independent of its demethylase
activity, where catalytically inactive LSD1 can rescue the expression of de-regulated
genes. It is proposed that reconstitution of the complex containing just deacetylase
activity is sufficient to re-repress genes, where deacetylase activity can solely regulate
gene expression and/or the CoREST complex potentially serves as an impediment to
activator complexes that can catalyse tri-methylation of H3K4. These results reveal
insights into mechanisms of multi-protein repressor complex function that contain

253
multiple enzymatic activities towards histone substrates. Data also raises questions
about the relative importance of two synergistic enzymatic activities with a common
complex. It elucidates how an acetylation state might be sufficient to establish
transcriptional states, though the methylation state is secondary to this and fulfils a
purpose in epigenetic memory of transcriptional states.

254
Appendices
Table A1 List of antibodies used in the study
Antibody Clonality Source Dilution Company Catalogue # Application
hdac1 polyclonal rabbit 1:2000 Santa Cruz sc-7872 WB
hdac1 monoclonal mouse 1:2000 Abcam ab46985 IP
hdac2 polyclonal rabbit 1:2000 Santa Cruz sc-7899 IP
hdac2 monoclonal mouse 1:2000 Millipore 05-814 WB
CoREST polyclonal rabbit 1:500 Millipore 07-455 WB/IP
LSD1 polyclonal rabbit 1:1000 Sigma L4418 WB
LSD1 polyclonal rabbit 1:2000 Abcam ab37165 WB/IP/ChIP
mSin3a polyclonal rabbit 1:1000 Santa Cruz sc-767 IP
mSin3a monoclonal mouse 1:2000 In house - WB
Brachyury polyclonal rabbit 1:500 Sigma B8436 WB
Dnmt1 monoclonal mouse 1:500 Abcam ab92453 WB
Oct4 polyclonal rabbit 1:1000 Sigma P0056 WB
-actin monoclonal mouse 1:5000 Sigma ac-74 WB
tubulin monoclonal mouse 1:5000 Sigma T6199 WB
H3 monoclonal mouse 1:2000 Millipore 05-499 WB/ChIP
H3K4me1 polyclonal rabbit 1:1000 Sigma M4819 WB
H3K4me2 polyclonal rabbit 1:1000 Sigma D5692 WB/ChIP
H3K4me3 polyclonal rabbit 1:1000 Millipore 07-473 WB/ChIP
H3K27me3 polyclonal rabbit 1:1000 Millipore 07-499 WB/ChIP
H3K9/14ac polyclonal rabbit 1:1000 Millipore 06-599 WB
H3K9ac polyclonal Rabbit 1:1000 Millipore 06-942 WB/ChIP
H3K18ac polyclonal rabbit 1:1000 Millipore 07-354 WB
H3K27ac polyclonal rabbit 1:1000 Active Motif 39132 WB
H3K36ac polyclonal rabbit 1:1000 Millipore 07-540 WB
H3K56ac polyclonal rabbit 1:1000 Active Motif 39281 WB

255
Table A2 List of primers used quantitative RT-PCR
Gene UPL Probe # Primers Amplicon (nt)
Pou5fl 82 cacgagtggaaagcaactca 125
cttctgcagggctttcatgt
Nanog 25 agcctccagcagatgcaa 76
ggttttgaaaccaggtcttaacc
Sox2 70 ggacttctttttgggggact 86
cagatctatacatggtccgattcc
Rex1 33 tcgctgtgggcattagaga 94
gctgcactgcacactcactc
FGF5 89 gagccctgaaggaaactcg 76
gcgaaacaaaatgacctgact
Wnt3 48 gccaagagtgtattcgcatcta 86
gatccagccgcacaatctac
Brachyury 88 cgagatgattgtgaccaagaac 65
ggcctgacacatttaccttca
Nkx2.5 53 gacgtagcctggtgtctcg 70
gtgtggaatccgtcgaaagt
MEF2c 77 tctgccctcagtcagttgg 63
cgtggtgtgttgtgggtatc
MyoD 52 ccaggacacgactgctttct 76
cacaccggctgtcctctac
Gata4 13 ggaagacaccccaatctcg 75
catggccccacaattgac
Gata6 40 ggtctctacagcaagatgaatgg 94
tggcacaggacagtccaag
Sox17 52 ggtctgaagtgcggttgg 109
tgtcttccctgtcttggttga
Foxa2 77 gagcagcaacatcaccacag 64
cgtaggccttgaggtccat
Flk1 (VEGFR2) 18 ccccaaattccattatgacaa 69
cggctctttcgcttactgtt
CD34 2 ttgggcaccactggttattt 96
ttttcttcccaacagccatc
Tal1 60 cgcctcactaggcagtgg 75
ctcttcacccggttgttgtt
Tie2 110 gaggacgcttccacattcc 75
gacccaaggatggctatgag
FABP-4 31 gaaaacgagatggtgacaagc 76
gccctttcataaactcttgtgg
Tubb3 (beta III Tubulin) 78 ggcaactatgtaggggactcag 87
cctgggcacatacttgtgag
Nestin 2 tgcaggccactgaaaagtt 89
ttccaggatctgagcgatct

256
Brn2 (Pou3f2) 1 gacacgccgacctcagac 60
gatccgcctctgcttgaat
HNF1b 109 atccccagcaatctcagaac 82
gcttgggaggtgttgagg
AFP 63 catgctgcaaagctgacaa 62
ctttgcaatggatgctctctt
TTR 76 catgaattcgcggatgtg 60
gatggtgtagtggcgatgg
LSD1 67 atccagctgacgtttgaagc 74
cggtggacaagcacagtatc
CoREST 69 aagtccccagaaagctccat 75
tgcgtatcttacgtcgagga
Hdac1 89 gagtacctggagaagatcaagca 121
cttcatccccactctcttcg
Hdac2 45 ctccacgggtggttcagt 71
cccaattgacagccatatca
DDR2 63 cgaaagcttccagagtttgc 61
gcttcacaacaccactgcac
HoxB7 1 ctggatgcgaagctcagg 109
ccgagtcaggtagcgattgta
OMT2a 106 cttgcaatctccggacca 87
tgaagtacctccggttccac
RARG 17 ggcttactacgcagagccact 104
ctggtgctctgtgtctccac
RASGRP3 91 cacatcagcctcatggacata 92
gcctttccccttttggatac
Cdkn1a 21 tccacagcgatatccagaca 90
ggcacactttgctcctgtg
TRIM46 33 aagagaccatcaggcacactg 89
ttccagcacagcccctagt
BARX2 17 aagatgaacagccaggctca 70
ggggttcagaggaagcttgt
BRDT 68 ggatgaacgagtgcagcat 69
acttgcagctgctgatgaac
CDA 17 ctgccgacaagtcatgagag 122
ggtcttcaggtccaaacgag
FOXN4 103 agcatcatggacttcgctct 64
ggctgaagctgtcctcctt
NOS3 5 gaccctcaccgctacaacat 62
gtcctggtgtccagatccat
SIX5 69 aacttccctcgtccactgc 71
agtgacaatggggctaccag
RELN 100 gcatggcaatgctgtcac 72
gttgtgttcaggcatgtggt
Dusp26 45 ggagggaaaggatgggtct 60
ctccgtcaccaggtaggtgt

257
SNCA 102 ggaaggagtggttcatggag 73
tgctcctccaacatttgtca
Spink2 4 tgttcgctgcacaggaga 130
tgagaatcggaagagtcgaga
Thy1 63 gaaaactgcgggcttcag 102
ccaagagttccgacttggat
Tspan8 40 gctgtggagctgtgaaagaaa 112
ggtttgaaagcggctccta
Krt23 25 tcatgaagaaacgccatgag 60
ccttgaagtcactcggcaag
Them5 95 accgtctatgccaagtcctc 96
gtggccactgagtcatcaag

258
Table A3 List of genes that are de-regulated >1.4-fold in LSD1
knockout ES cells
Up-regulated Genes Fold Change Down-regulated Genes Fold Change
Echdc2 Tmem62 1700003M02Rik Slc16a9 9130230L23Rik Myom3 Tnfrsf17 A330049M08Rik
Sftpd Hoxb7 Zc4h2 Impdh1
Taf1d Gm766 Dync1i1 2410078J06Rik Cyp2j9 Zfp521 Map1lc3a Oc90
Klk10 Cpne2 Atg10 Nrg4 Gpha2 AU022751 2810025M15Rik Mogat2 Rnf182 2810439F02Rik Hsh2d AI317395
Fhl1 Rnf170 Mtap2 Crabp1 Gstm6 Ppp2r2c LOC634731 Elovl4 Plxdc1
1.4003 1.4007 1.4009 1.4012 1.4023 1.4024 1.4034 1.4036
1.404 1.4042 1.4057 1.4063
1.4104 1.4124 1.4125 1.4128 1.4132 1.4135 1.4137 1.4138
1.4152 1.416 1.4161 1.4168 1.4179 1.4204 1.421 1.421 1.4241 1.425 1.4254 1.4263
1.4272 1.4274 1.43 1.4301 1.4307 1.4318 1.432 1.4335 1.4358
Aof2 Atp2a3 C330036H15Rik Atp2a3 Gli2 Naprt1 Metrn Tgm2
Tgm1 Wdr90 Adap1 Lrfn3
Bdh2 Cplx1 Naprt1 Cotl1 Ccdc28b Arg2 Gm129 Cox6a2
1700029P11Rik Gng13 Ift172 Itgb4 3230401M21Rik 2310022B05Rik Akap9 Dis3l Btbd1 Rarg Itgb4 Cotl1
Akap9 Eno3 Gfpt2 BC003993 Nos3 Plcd1 Ddit3 Gna11 Ddx25
0.3241 0.384 0.4425 0.465 0.4686 0.4717 0.4899 0.4947
0.5004 0.5029 0.5044 0.5057
0.5084 0.5138 0.5162 0.5198 0.5213 0.5246 0.5351 0.5448
0.5449 0.5453 0.554 0.5568 0.5599 0.5642 0.5688 0.569 0.5701 0.5706 0.574 0.5766
0.5777 0.5799 0.5812 0.5828 0.5829 0.5836 0.5876 0.5886 0.5891

259
Prx
Fmr1nb LOC382001 B230358A15Rik Ank2 Trpv2 Mdfic Ccl25 Mup2 Klf17 Cda Tph2 Tmem159
Ccbl1 LOC100045780 Klk13 BC018465 Bahd1 Ly6e Actn2 Bbs7 H6pd Clic6 Gpr143 Gca
T Abcc5 Gstm5 Cdkn1a Tm7sf4 Edg2 Lmo7 Nlrp4c Epb4.1l4b LOC382264 Gmpr LOC381471
ORF9 EG368203 Defcr3 Gjb4 Cdc42ep5 Lgals3bp Padi6 Ebi3 Cyp2c44
1.4366
1.4369 1.4375 1.4377 1.4386 1.4455 1.4479 1.4482 1.4483 1.4508 1.4512 1.4521 1.4531
1.4534 1.4544 1.4546 1.4558 1.4573 1.4613 1.4627 1.4641 1.4642 1.4658 1.468 1.4704
1.4713 1.4714 1.4748 1.475 1.4752 1.4768 1.4768 1.4771 1.4776 1.4782 1.4797 1.48
1.4822 1.4823 1.4848 1.4854 1.4872 1.4876 1.4876 1.4892 1.49
Arpp19
Gm129 Cul7 Bcam Nme3 Ndst2 Aplp1 Nisch Pgls LOC626152 Celsr3 Tia1 Jmjd2b
Snai3 C030046I01Rik B3gnt1 Grasp LOC673578 LOC100044468 Grasp Cxxc6 Otub2 Tk1 Cpe Pex11a
Tbc1d2 Bcam Naprt1 Sec14l1 Foxn4 Gna11 5133400G04Rik 5133400G04Rik Rarres2 Ldoc1l D430042O09Rik Mslnl
Zfp579 Sec14l1 Npepl1 E030007N04Rik 2310045N01Rik Fkbp6 1190005N23Rik Evc Lrrc40
0.5892
0.5898 0.5903 0.5954 0.5983 0.6008 0.6041 0.6081 0.6083 0.6094 0.6104 0.6116 0.6134
0.6145 0.6154 0.6162 0.6162 0.6167 0.6187 0.6197 0.6215 0.6218 0.6228 0.6267 0.6287
0.629 0.6291 0.6301 0.6301 0.6309 0.6313 0.6342 0.6351 0.636 0.6363 0.6365 0.6366
0.6384 0.6392 0.6393 0.6394 0.6404 0.6416 0.6423 0.6425 0.6427

260
Nin
Tekt1 Best1 LOC245892 Gtsf1l Itgae Selplg Cxcl14 Abca14 Alg14 4933412E12Rik AW551984 Taf9b
Col2a1 App 5930412G12Rik Mt1 Clcnkb Aox3 Prickle1 EG638695 Slc26a4 Smtnl1 Fgl1 LOC100046049
Pdlim4 Xk D12Ertd647e Agrp Cyp2c55 BC026585 Lyzl4 LOC224532 Mx2 Sh3rf2 Pof1b Aim2
Ptpn22 Clca3 Npw Pla1a Tuba3a Acot1 Gpr137b LOC100039227 Cox7a1
1.5004
1.5019 1.5026 1.5031 1.5032 1.5035 1.5052 1.5053 1.511 1.5145 1.5148 1.516 1.518
1.5192 1.521 1.5223 1.5234 1.5248 1.527 1.5291 1.53 1.5319 1.5319 1.532 1.5342
1.5363 1.5364 1.5386 1.5403 1.5423 1.5431 1.544 1.5488 1.5525 1.5543 1.5562 1.5564
1.5567 1.5569 1.5587 1.559 1.5594 1.5632 1.5684 1.5704 1.574
Krt7
Diras1 Wipi2 2410018G20Rik Elac1 Myd88 Adap1 F2r Vrk1 Zfp810 Dnajc7 Suclg2 1190003J15Rik
Mrpl10 1810014F10Rik Ltbp3 Dhodh Bckdha Sox15 Irf2bp1 Rassf1 Ykt6 Dgkq Il11ra1 Coro1a
Riok3 Slc25a44 Ciz1 BC003993 Haghl Pias3 Zcwpw1 Rbks Drg2 Fam110a Tia1 Mthfd2
Itga3 Rac3 Slc6a9 Ube2e1 Ap1b1 Dnd1 9930033H14Rik Tmem141 Mrpl35
0.6429
0.6441 0.6446 0.646 0.6467 0.6472 0.6492 0.6493 0.65 0.6502 0.6505 0.6525 0.6535
0.656 0.6579 0.6606 0.6612 0.6621 0.6637 0.6647 0.6649 0.6666 0.6669 0.6672 0.6682
0.6684 0.67 0.6701 0.6714 0.6714 0.672 0.6721 0.6722 0.6725 0.6733 0.6743 0.6756
0.6763 0.6763 0.6771 0.6772 0.6775 0.6781 0.6785 0.6785 0.6786

261
Fam154a
Magea4 Rbm47 L3mbtl3 Reln C430014G13Rik Defcr6 4921531P07Rik Mansc1 Mycl1 2410164B09Rik Htatip2 4932431H17Rik
Ctsa 620807 Gpr113 Slc6a13 Popdc3 Hoxd8 1520401A03Rik Cdh3 Idh1 2310039L15Rik 3110049J23Rik Srd5a2
Myom2 Snca Mllt3 LOC385274 OTTMUSG00000019001 4930550L24Rik Bfsp2 Chi3l1 Hspb8 Pld1 LOC385368 EG546250
Ela1 Lama3 Hebp2 1600013E24Rik Pnlip Timm8a2 Omt2b Uroc1 Kiss1
1.5761
1.5765 1.5767 1.577 1.5792 1.5833 1.5836 1.5879 1.5885 1.5918 1.5922 1.5933 1.5935
1.594 1.5957 1.5965 1.5991 1.601 1.6022 1.6034 1.6038 1.6044 1.6059 1.6081 1.6087
1.6088 1.6091 1.6094 1.6104 1.6109 1.6115 1.6131 1.6138 1.6153 1.6169 1.6201 1.6217
1.6229 1.6246 1.6316 1.6325 1.6378 1.6395 1.6419 1.6451 1.6499
Ankra2
4833442J19Rik Pard6a Echs1 Ap2b1 Gm129 C330024D21Rik Ppp1r14d Ankrd13a Lrch4 Ubr7 Rccd1 Nt5c3l
scl0001379.1_70 6330569M22Rik 5133400G04Rik Agxt2l2 1190005F20Rik Pola2 Cdc20 Rars2 Coro1a 2310022K01Rik Idh3a Cpsf3l
Snx17 Chkb Lztr1 H3f3a Tmem131 Ankmy2 Wipi2 Rps6ka4 Dusp11 Otub2 9830002L24Rik Bub1b
LOC100040799 Tubgcp2 Eif3s8 Pou2f1 Suclg2 Nat6 Ctbp2 Npepl1 Pik3r2
0.6788
0.6791 0.6794 0.6806 0.6808 0.6808 0.6809 0.6814 0.6828 0.6834 0.6838 0.6844 0.6845
0.6847 0.6859 0.6861 0.6863 0.6866 0.6867 0.687 0.6872 0.6873 0.6876 0.6877 0.6881
0.6883 0.6884 0.6887 0.6889 0.6893 0.6899 0.6899 0.6901 0.6904 0.6905 0.6908 0.6908
0.6913 0.6919 0.692 0.6924 0.6924 0.6925 0.6926 0.6928 0.6929

262
Fxyd5
C8b Ube2l6 Nat2 Sult2b1 LOC272693 Stk32a Gm44 LOC382163 Usp29 Copz2 Magea10 H2-Ab1
Oas1g BC049762 Syt5 Sytl3 Si 1700020N15Rik Kcnu1 Bcas1 OTTMUSG00000010552 Pga5 Aass C130073F10Rik
Diras2 Lst1 4930583H14Rik LOC100046087 Pde6a LOC674912 Tnnt1 Sepp1 Xpnpep2 Gm1679 Dpysl3 Ddr2
Mboat1 Gsta3 Spnb3 Defb30 Mlana Adh4 Igh-VJ558 Barx2 Ntrk2
1.651
1.6512 1.6519 1.6544 1.6545 1.6551 1.6578 1.6579 1.659 1.6633 1.664 1.6672 1.6675
1.6699 1.6709 1.6726 1.6743 1.6811 1.682 1.6858 1.6862 1.6875 1.6921 1.6987 1.6992
1.6998 1.7061 1.7065 1.7087 1.7112 1.7195 1.7227 1.7229 1.7235 1.7239 1.7254 1.7266
1.7273 1.728 1.7313 1.7326 1.7402 1.7405 1.7411 1.7447 1.7448
Gprk6
Blcap Ift172 Crip2 0610010E21Rik Triobp LOC100045019 Nos3 Slc28a1 Tcea3 Rdm1 Shc1 Ddx27
Dcxr scl0002368.1_75 Spryd4 Wars Cml1 Ankzf1 LOC675567 Acot8 Sap30 1110014J17Rik EG434402 6530415H11Rik
Gtpbp2 Vps45 Ppp2r4 3830406C13Rik Scly 2810432D09Rik Trabd Atp11b Tmem186 2310014L17Rik Gcat Cc2d2a
Mthfd2 Rapgef3 Tfdp1 Ube2d3 LOC435145 Rnmt Taf5 Tk1 Echs1
0.6942
0.6945 0.6946 0.6957 0.6963 0.6964 0.6966 0.6971 0.6971 0.6988 0.6992 0.6993 0.6997
0.7003 0.7004 0.7004 0.7006 0.7009 0.7015 0.7017 0.7019 0.7022 0.7032 0.7037 0.7038
0.7038 0.7041 0.7054 0.7055 0.7064 0.7068 0.707 0.7078 0.708 0.7089 0.709 0.7098
0.7102 0.7103 0.7105 0.7106 0.711 0.712 0.7126 0.7126 0.7127

263
1700022P22Rik
4930486L24Rik C330016K18Rik Slc5a4a OTTMUSG00000010438 Slc36a3 Cpn1 LOC385256 LOC380655 Rbms2 Gm566 Mmp2 Fetub
Mgst2 Aqp9 Akr1c18 Pcolce2 Rasgrp3 Crygs Zfp393 Brdt Tspan2 Cd74 Hecw2 Igl-5
Tst Lpl Ott Clps Dusp26 C030033M19Rik Krt23 Mbl2 4930502E18Rik Omt2a 1700011F14Rik Gm773
Stx11 Tulp4 Xlr5a Xlr4a 4930591A17Rik Slc15a2 LOC630179 Scml2 4931407G18Rik
1.7452
1.751 1.7553 1.7568 1.7614 1.7617 1.7801 1.7811 1.785 1.7862 1.7883 1.7982 1.8034
1.8087 1.8122 1.8178 1.8231 1.8246 1.8317 1.8369 1.8381 1.8421 1.8434 1.8454 1.8465
1.8475 1.8508 1.855 1.8694 1.8715 1.8728 1.8734 1.8795 1.8874 1.8899 1.8903 1.891
1.8916 1.8956 1.8983 1.8998 1.9034 1.9064 1.9079 1.9082 1.9085
Plod1
A930009M04Rik E130014J05Rik A230070D14Rik
0.7129
0.713 0.7132 0.7138

264
Dmrtc1c
Myl4 Tpbg Tnni2 Myl2 LOC383642 Agmat LOC383368 Spic Tex19.2 Rragd Igbp1b Dnajc5g
A730037C10Rik 2010204K13Rik Rhox4d Crxos1 Tex13 Tsx Ela2a Liph Magea8 LOC270344 Gm41 2200001I15Rik
Ifitm1 9530077C05Rik Cd3d Klk1b4 1700011M02Rik Slc5a4b Acss1 4930524B15Rik Aim1 Cpne9 Ndp52 Cntnap2
Klk1b27 Plac8 Them5 Alox5ap OTTMUSG00000017677 Qpct Tspan8 Acpp Boll
1.9089
1.9128 1.9131 1.9176 1.9194 1.9204 1.9286 1.9305 1.9309 1.9316 1.9326 1.9329 1.9387
1.9393 1.9405 1.9496 1.9543 1.9551 1.9574 1.9684 1.969 1.9713 1.9837 1.9844 1.9908
1.9948 2.0012 2.0129 2.0283 2.0308 2.0309 2.0317 2.0337 2.0353 2.0581 2.0597 2.066
2.0724 2.0847 2.0921 2.0929 2.1193 2.1195 2.1341 2.1354 2.1474

265
Slamf9
Klk1b5 Ly6g6e 1700006H03Rik Ng23 Itsn1 Nckap1l 2410088K16Rik Klk1b26 C230070D10Rik LOC100045342 Cd200 Tmem40
Ly6a 4933408N05Rik LOC641366 Otog Cct6b Klk1 LOC385308 Crygd Slc30a3 Ovol2 Magea2 LOC100040016
Defb42 Thy1 LOC98434 Magea5 LOC100040479 Pramel7 Obox6 Rcsd1 A730017C20Rik Zscan5b Mt3 1700080O16Rik
4921521F21Rik H2-Eb1 Spink2 Reg1 Ybx3 Pkd2l1
2.1506
2.1585 2.1603 2.1607 2.1837 2.19 2.1917 2.2373 2.2414 2.2499 2.2517 2.254 2.2835
2.2977 2.2996 2.319 2.3531 2.3756 2.3871 2.3976 2.4702 2.4942 2.5243 2.5497 2.591
2.6075 2.6288 2.6335 2.6651 2.6676 2.6879 2.6962 2.701 2.7211 2.7235 2.7717 2.9609
3.0268 3.1767 3.193 3.2291 3.3365 3.3582 3.3582

266
Bibliography
Aasland, R., Stewart, A.F. & Gibson, T. 1996, "The SANT domain: A putative DNA-binding domain in the SWI-SNF and ADA complexes, the transcriptional corepressor N-CoR and TFIIIB", Trends in biochemical sciences, vol. 21, no. 3, pp. 87-88.
Adamo, A., Sesé, B., Boue, S., Castaño, J., Paramonov, I., Barrero, M.J. & Izpisua Belmonte, J.C. 2011, "LSD1 regulates the balance between self-renewal and differentiation in human embryonic stem cells.", Nature Cell Biology, vol. 13, no. 6, pp. 652-660.
Agalioti, T., Chen, G.Y. & Thanos, D. 2002, "Deciphering the transcriptional histone acetylation code for a human gene", Cell, vol. 111, no. 3, pp. 381-392.
Agger, K., Cloos, P.A.C., Christensen, J., Pasini, D., Rose, S., Rappsilber, J., Issaeva, I., Canaani, E., Salcini, A.E. & Helin, K. 2007, "UTX and JMJD3 are histone H3K27 demethylases involved in HOX gene regulation and development", Nature, vol. 449, no. 7163, pp. 731-U10.
Alland, L., David, G., Hong, S.L., Potes, J., Muhle, R., Lee, H.C., Hou, H., Chen, K. & DePinho, R.A. 2002, "Identification of mammalian Sds3 as an integral component of the Sin3/histone deacetylase corepressor complex", Molecular and cellular biology, vol. 22, no. 8, pp. 2743-2750.
Allfrey, V.G., Faulkner, R. & Mirsky, A.E. 1964, "Acetylation and Methylation of Histones and their Possible Role in the Regulation of Rna Synthesis.", Proc Natl Acad Sci U S A, vol. 51, pp. 786-794.
Ambrosetti, D.C., Basilico, C. & Dailey, L. 1997, "Synergistic activation of the fibroblast growth factor 4 enhancer by Sox2 and Oct-3 depends on protein-protein interactions facilitated by a specific spatial arrangement of factor binding sites", Molecular and cellular biology, vol. 17, no. 11, pp. 6321-6329.
Andres, M.E., Burger, C., Peral-Rubio, M.J., Battaglioli, E., Anderson, M.E., Grimes, J., Dallman, J., Ballas, N. & Mandel, G. 1999, " CoREST: a functional corepressor required for regulation of neural-specific gene expression", Proceedings of the National Academy of Sciences USA, vol. 96, no. 17, pp. 9873-9678.
Anton, R., Kestler, H.A. & Kuehl, M. 2007, "beta-Catenin signaling contributes to stemness and regulates early differentiation in murine embryonic stem cells", FEBS letters, vol. 581, no. 27, pp. 5247-5254.
Avilion, A.A., Nicolis, S.K., Pevny, L.H., Perez, L., Vivian, N. & Lovell-Badge, R. 2003, "Multipotent cell lineages in early mouse development depend on SOX2 function", Genes & development, vol. 17, no. 1, pp. 126-140.
Azuara, V., Perry, P., Sauer, S., Spivakov, M., Jorgensen, H.F., John, R.M., Gouti, M., Casanova, M., Warnes, G., Merkenschlager, M. & Fisher, A.G. 2006, "Chromatin signatures of pluripotent cell lines", Nature cell biology, vol. 8, no. 5, pp. 532-U189.

267
Bain, G., Kitchens, D., Yao, M., Huettner, J.E. & Gottlieb, D.I. 1995, "Embryonic Stem-Cells Express Neuronal Properties In-Vitro", Developmental biology, vol. 168, no. 2, pp. 342-357.
Ballas, N., Battaglioli, E., Atouf, F., Andres, M.E., Chenoweth, J., Anderson, M.E., Burger, C., Moniwa, M., Davie, J.R., Bowers, W.J., Federoff, H.J., Rose, D.W., Rosenfeld, M.G., Brehm, P. & Mandel, G. 2001, "Regulation of neuronal traits by a novel transcriptional complex", Neuron, vol. 31, no. 3, pp. 353-365.
Baltus, G.A., Kowalski, M.P., Tutter, A.V. & Kadam, S. 2009, "A positive regulatory role for the mSin3A-HDAC complex in pluripotency through Nanog and Sox2", Journal of Biological Chemistry, vol. 284, no. 11, pp. 6998-7006.
Bannister, A.J., Schneider, R. & Kouzarides, T. 2002, "Histone modification: dynamic or static?", Cell, vol. 109, pp. 801-806.
Bannister, A.J., Schneider, R., Myers, F.A., Thorne, A.W., Crane-Robinson, C. & Kouzarides, T. 2005, "Spatial distribution of di- and tri-methyl lysine 36 of histone H3 at active genes", Journal of Biological Chemistry, vol. 280, no. 18, pp. 17732-17736.
Bannister, A.J., Zegerman, P., Partridge, J.F., Miska, E.A., Thomas, J.O., Allshire, R.C. & Kouzarides, T. 2001, "Selective recognition of methylated lysine 9 on histone H3 by the HP1 chromo domain", Nature, vol. 410, no. 6824, pp. 120-124.
Barrow, K.M., Perez-Campo, F.M. & Ward, C.M. 2006, "Use of the cytomegalovirus promoter for transient and stable transgene expression in mouse embryonic stem cells.", Methods in Molecular Biology, vol. 329, pp. 283-294.
Barski, A., Cuddapah, S., Cui, K., Roh, T., Schones, D.E., Wang, Z., Wei, G., Chepelev, I. & Zhao, K. 2007, "High-resolution profiling of histone methylations in the human genome", Cell, vol. 129, no. 4, pp. 823-837.
Beddington, R.S.P. 1983, "Histogenetic and Neoplastic Potential of Different Regions of the Mouse Embryonic Egg Cylinder", Journal of embryology and experimental morphology, vol. 75, no. JUN, pp. 189-204.
Bernstein, B.E., Mikkelsen, T.S., Xie, X.H., Kamal, M., Huebert, D.J., Cuff, J., Fry, B., Meissner, A., Wernig, M., Plath, K., Jaenisch, R., Wagschal, A., Feil, R., Schreiber, S.L. & Lander, E.S. 2006a, "A bivalent chromatin structure marks key developmental genes in embryonic stem cells", Cell, vol. 125, no. 2, pp. 315-326.
Bernstein, E., Duncan, E.M., Masui, O., Gil, J., Heard, E. & Allis, C.D. 2006b, "Mouse polycomb proteins bind differentially to methylated histone H3 and RNA and are enriched in facultative heterochromatin", Molecular and cellular biology, vol. 26, no. 7, pp. 2560-2569.
Bhaumik, S.R., Smith, E. & Shilatifard, A. 2007, "Covalent modifications of histones during development and disease pathogenesis", Nature Structural & Molecular Biology, vol. 14, no. 11, pp. 1008-1016.
Binda, C., Coda, A., Angelini, R., Federico, R., Ascenzi, P. & Mattevi, A. 1999, "A 30 angstrom long U-shaped catalytic tunnel in the crystal structure of polyamine oxidase", Structure with Folding & design, vol. 7, no. 3, pp. 265-276.

268
Binda, C., Li, M., Hubalek, F., Restelli, N., Edmondson, D.E. & Mattevi, A. 2003, "Insights into the mode of inhibition of human mitochondrial monoamine oxidase B from high-resolution crystal structures", Proceedings of the National Academy of Sciences of the United States of America, vol. 100, no. 17, pp. 9750-9755.
Bird, A. 2002, "DNA methylation patterns and epigentic memory", Genes and Development, vol 16, pp. 6-21.
Birnboim, H. & Doly, J. 1979, "Rapid Alkaline Extraction Procedure for Screening Recombinant Plasmid DNA", Nucleic acids research, vol. 7, no. 6, pp. 1513-1523.
Borde, V., Robine, N., Lin, W., Bonfils, S., Geli, V. & Nicolas, A. 2009, "Histone H3 lysine 4 trimethylation marks meiotic recombination initiation sites", Embo Journal, vol. 28, no. 2, pp. 99-111.
Borun, T.W., Pearson, D., & Paik, W.K. 1972, "Studies of histone methylation during the HeLa S-3 cell cycle. J. Biol. Chem. vol. 247, pp. 4288-4298.
Boyd, J.M., Subramanian, T., Schaeper, U., Laregina, M., Bayley, S. & Chinnadurai, G. 1993, "A Region in the C-Terminus of Adenovirus-2/5 E1a Protein is Required for Association with a Cellular Phosphoprotein and Important for the Negative Modulation of T24-Ras Mediated Transformation, Tumorigenesis and Metastasis", Embo Journal, vol. 12, no. 2, pp. 469-478.
Boyer, L.A., Lee, T.I., Cole, M.F., Johnstone, S.E., Levine, S.S., Zucker, J.R., Guenther, M.G., Kumar, R.M., Murray, H.L., Jenner, R.G., Gifford, D.K., Melton, D.A., Jaenisch, R. & Young, R.A. 2005a, "Core transcriptional regulatory circuitry in human embryonic stem cells", Cell, vol. 122, no. 6, pp. 947-956.
Boyer, L.A., Plath, K., Zeitlinger, J., Brambrink, T., Medeiros, L.A., Lee, T.I., Levine, S.S., Wernig, M., Tajonar, A., Ray, M.K., Bell, G.W., Otte, A.P., Vidal, M., Gifford, D.K., Young, R.A. & Jaenisch, R. 2006, "Polycomb complexes repress developmental regulators in murine embryonic stem cells", Nature, vol. 441, no. 7091, pp. 349-353.
Boyer, L.A., Mathur, D. & Jaenisch, R. 2006, "Molecular control of pluripotency", Current opinion in genetics & development, vol. 16, no. 5, pp. 455-462.
Bracken, A.P., Dietrich, N., Pasini, D., Hansen, K.H. & Helin, K. 2006, "Genome-wide mapping of Polycomb target genes unravels their roles in cell fate transitions", Genes & development, vol. 20, no. 9, pp. 1123-1136.
Bradley, A., Evans, M., Kaufman, M.H. & Robertson, E. 1984, "Formation of Germ-Line Chimeras from Embryo-Derived Teratocarcinoma Cell-Lines", Nature, vol. 309, no. 5965, pp. 255-256.
Brehm, A., Miska, E.A., McCance, D.J., Reid, J.L., Bannister, A.J. & Kouzarides, T. 1998, "Retinoblastoma protein recruits histone deacetylase to repress transcription", Nature, vol. 391, no. 6667, pp. 597-601.
Brook, F.A. & Gardner, R.L. 1997, "The origin and efficient derivation of embryonic stem cells in the mouse.", Proceedings of the National Academy of Sciences of the United States of America, vol. 94, no. 11, pp. 5709-5712.

269
Brown, M.A., Sims,Robert J.,,III, Gottlieb, P.D. & Tucker, P.W. 2006, "Identification and characterization of Smyd2: a split SET/MYND domain-containing histone H3 lysine 36-specific methyltransferase that interacts with the Sin3 histone deacetylase complex", Molecular Cancer, vol. 5, pp. 26.
Brownell, J.E. & Allis, C.D. 1996, "Special HATs for special occasions: Linking histone acetylation to chromatin assembly and gene activation", Current opinion in genetics & development, vol. 6, no. 2, pp. 176-184.
Buard, J., Barthes, P., Grey, C. & de Massy, B. 2009, "Distinct histone modifications define initiation and repair of meiotic recombination in the mouse", Embo Journal, vol. 28, no. 17, pp. 2616-2624.
Buchholz, F., Angrand, P.O. & Stewart, A.F. 1998, "Improved properties of FLP recombinase evolved by cycling mutagenesis", Nature biotechnology, vol. 16, no. 7, pp. 657-662.
Byvoet, P., Shepherd, G.R., Hardin, J.M. & Noland, B.J. 1972, " The distribution and turnover of labelled methyl groups in histone fractions of cultured mammalian cells", Arch. Biochem. Biophys. vol. 148, pp. 558-567.
Cao, R. & Zhang, Y. 2004, "SUZ12 is required for both the histone methyltransferase activity and the silencing function of the EED-EZH2 complex", Molecular cell, vol. 15, no. 1, pp. 57-67.
Capo-chichi, C.D., Rula, M.E., Smedberg, J.L., Vanderveer, L., Parmacek, M.S., Morrisey, E.E., Godwin, A.K. & Xu, X.X. 2005, "Perception of differentiation cues by GATA factors in primitive endoderm lineage determination of mouse embryonic stem cells", Developmental biology, vol. 286, no. 2, pp. 574-586.
Carmen, A.A., Milne, L. & Grunstein, M. 2002, "Acetylation of the yeast histone H4N terminus regulates its binding to heterochromatin protein SIR3", Journal of Biological Chemistry, vol. 277, no. 7, pp. 4778-4781.
Carrozza, M.J., Li, B., Florens, L., Suganuma, T., Swanson, S.K., Lee, K.K., Shia, W.J., Anderson, S., Yates, J., Washburn, M.P. & Workman, J.L. 2005, "Histone H3 methylation by Set2 directs deacetylation of coding regions by Rpd3S to suppress spurious intragenic transcription", Cell, vol. 123, no. 4, pp. 581-592.
Chalfie, M., Tu, Y., Euskirchen, G., Ward, W.W. & Prasher, D.C. 1994, "Green Fluorescent Protein as a Marker for Gene-Expression", Science, vol. 263, no. 5148, pp. 802-805.
Chamberlain, S.J., Yee, D. & Magnuson, T. 2008, "Polycomb repressive complex 2 is dispensable for maintenance of embryonic stem cell pluripotency", Stem cells, vol. 26, no. 6, pp. 1496-1505.
Chambers, I., Colby, D., Robertson, M., Nichols, J., Lee, S., Tweedie, S. & Smith, A. 2003, "Functional expression cloning of Nanog, a pluripotency sustaining factor in embryonic stem cells", Cell, vol. 113, no. 5, pp. 643-655.
Chambers, I. & Smith, A. 2004, "Self-renewal of teratocarcinoma and embryonic stem cells", Oncogene, vol. 23, no. 43, pp. 7150-7160.

270
Chambeyron, S., Da Silva, N.R., Lawson, K.A. & Bickmore, W.A. 2005, "Nuclear re-organisation of the Hoxb complex during mouse embryonic development", Development, vol. 132, no. 9, pp. 2215-2223.
Chen, Y., Yang, Y., Wang, F., Wan, K., Yarnane, K., Zhang, Y. & Lei, M. 2006, "Crystal structure of human histone lysine-specific demethylase 1 (LSD1)", Proceedings of the National Academy of Sciences of the United States of America, vol. 103, no. 38, pp. 13956-13961.
Cheung, P., Allis, C.D. & Sassone-Corsi, P. 2000, "Signaling to chromatin through histone modifications", Cell, vol. 103, no. 2, pp. 263-271.
Chew, J.L., Loh, Y.H., Zhang, W.S., Chen, X., Tam, W.L., Yeap, L.S., Li, P., Ang, Y.S., Lim, B., Robson, P. & Ng, H.H. 2005, "Reciprocal transcriptional regulation of Pou5f1 and Sox2 via the Oct4/Sox2 complex in embryonic stem cells", Molecular and cellular biology, vol. 25, no. 14, pp. 6031-6046.
Chinnadurai, G. 2002, "CtBP, an unconventional transcriptional corepressor in development and oncogenesis", Molecular cell, vol. 9, no. 2, pp. 213-224.
Choi, J., Jang, H., Kim, H., Kim, S., Cho, E. & Youn, H. 2010, "Histone demethylase LSD1 is required to induce skeletal muscle differentiation by regulating myogenic factors", Biochemical and biophysical research communications, vol. 401, no. 3, pp. 327-332.
Chong, J.A., Tapia-Ramírez, J., Kim, S., Toledo-Aral, J.J., Zheng, Y., Boutros, M.C., Altshuller, Y.M., Frohman, M.A., Kraner, S.D. & Mandel, G. 1995, "REST: a mammalian silencer protein that restricts sodium channel gene expression to neurons.", Cell, vol. 80, no. 6, pp. 949-957.
Christensen, J., Agger, K., Cloos, P.A.C., Pasini, D., Rose, S., Sennels, L., Rappsilber, J., Hansen, K.H., Salcini, A.E. & Helin, K. 2007, "RBP2 belongs to a family of demethylases, specific for tri- and dimethylated lysine 4 on histone 3", Cell, vol. 128, no. 6, pp. 1063-1076.
Chuikov, S., Kurash, J.K., Wilson, J.R., Xiao, B., Justin, N., Ivanov, G.S., McKinney, K., Tempst, P., Prives, C., Gamblin, S.J., Barlev, N.A. & Reinberg, D. 2004, "Regulation of p53 activity through lysine methylation", Nature, vol. 432, no. 7015, pp. 353-360.
Chung, S., Andersson, T., Sonntag, K.C., Björklund, L., Isacson, O. & Kim, K.S. 2002, "Analysis of Different Promoter Systems for Efficient Transgene Expression in Mouse Embryonic Stem Cell Lines", Stem Cells, vol. 20, no. 2, pp. 139-145.
Ciccone, D.N., Su, H., Hevi, S., Gay, F., Lei, H., Bajko, J., Xu, G., Li, E. & Chen, T. 2009, "KDM1B is a histone H3K4 demethylase required to establish maternal genomic imprints", Nature, vol. 461, no. 7262, pp. 415-U115.
Clark, D.J. & Kimura, T. 1990, "Electrostatic Mechanism of Chromatin Folding", Journal of Molecular Biology, vol. 211, no. 4, pp. 883-896.
Cloos, P.A.C., Christensen, J., Agger, K. & Helin, K. 2008, "Erasing the methyl mark: histone demethylases at the center of cellular differentiation and disease", Genes & development, vol. 22, no. 9, pp. 1115-1140.

271
Cloos, P.A.C., Christensen, J., Agger, K., Maiolica, A., Rappsilber, J., Antal, T., Hansen, K.H. & Helin, K. 2006, "The putative oncogene GASC1 demethylates tri- and dimethylated lysine 9 on histone H3", Nature, vol. 442, no. 7100, pp. 307-311.
Cormack, B.P., Valdivia, R.H. & Falkow, S. 1996, "FACS-optimized mutants of the green fluorescent protein (GFP)", Gene, vol. 173, no. 1, pp. 33-38.
Coucouvanis, E. & Martin, G.R. 1995, "Signals for Death and Survival - a 2-Step Mechanism for Cavitation in the Vertebrate Embryo", Cell, vol. 83, no. 2, pp. 279-287.
Couture, J., Collazo, E., Ortiz-Tello, P.A., Brunzelle, J.S. & Trievel, R.C. 2007, "Specificity and mechanism of JMJD2A, a trimethyllysine-specific histone demethylase", Nature Structural & Molecular Biology, vol. 14, no. 8, pp. 689-695.
Cowley, S.M., Iritani, B.M., Mendrysa, S.M., Xu, T., Cheng, P.F., Yada, J., Liggitt, H.D. & Eisenman, R.N. 2005, "The mSin3A chromatin-modifying complex is essential for embryogenesis and T-cell development", Molecular and cellular biology, vol. 25, no. 16, pp. 6990-7004.
Da, G.P., Lenkart, J., Zhao, K.H., Shiekhattar, R., Cairns, B.R. & Marmorstein, R. 2006, "Structure and function of the SWIRM domain, a conserved protein module found in chromatin regulatory complexes", Proceedings of the National Academy of Sciences of the United States of America, vol. 103, no. 7, pp. 2057-2062.
Dannenberg, J.H., David, G., Zhong, S., van der Torre, J., Wong, W.H. & DePinho, R.A. 2005, "mSin3A corepressor regulates diverse transcriptional networks governing normal and neoplastic growth and survival", Genes & development, vol. 19, no. 13, pp. 1581-1595.
Das, C., Lucia, M.S., Hansen, K.C. & Tyler, J.K. 2009, "CBP/p300-mediated acetylation of histone H3 on lysine 56", Nature, vol. 459, no. 7243, pp. 113-U123.
David, G., Grandinetti, K.B., Finnerty, P.M., Simpson, N., Chu, G.C. & DePinho, R.A. 2008, "Specific requirement of the chromatin modifier mSin3B in cell cycle exit and cellular differentiation", Proceedings of the National Academy of Sciences of the United States of America, vol. 105, no. 11, pp. 4168-4172.
De Ruijter, A.J.M., Van Gennip, A.H., Caron, H.N., Kemp, S. & Van Kuilenburg, A.B.P. 2003, "Histone deacetylases (HDACs): characterization of the classical HDAC family", Biochemical Journal, vol. 370, pp. 737-749.
De Santa, F., Totaro, M.G., Prosperini, E., Notarbartolo, S., Testa, G. & Natoli, G. 2007, "The histone H3 lysine-27 demethylase Jmjd3 links inflammation to inhibition of polycomb-mediated gene silencing", Cell, vol. 130, no. 6, pp. 1083-1094.
Denslow, S.S. & Wade, P.A. 2007, " "The human Mi-2/NuRD complex and gene regulation.", Oncogene, vol. 26, no. 37, pp. 5433-5438.
Dhalluin, C., Carlson, J.E., Zeng, L., He, C., Aggarwal, A.K. & Zhou, M.M. 1999, "Structure and ligand of a histone acetyltransferase bromodomain", Nature, vol. 399, no. 6735, pp. 491-496.

272
Ding, Z., Gillespie, L. & Paterno, G. 2003, "Human MI-ER1 alpha and beta function as transcriptional repressors by recruitment of histone deacetylase 1 to their conserved ELM2 domain", Molecular and cellular biology, vol. 23, no. 1, pp. 250-258.
Dodge, J.E., Kang, Y.K., Beppu, H., Lei, H. & Li, E. 2004, "Histone H3-K9 methyltransferase ESET is essential for early development", Molecular and cellular biology, vol. 24, no. 6, pp. 2478-2486.
Doetschman, T.C., Eistetter, H., Katz, M., Schmidt, W. & Kemler, R. 1985, "The Invitro Development of Blastocyst-Derived Embryonic Stem-Cell Lines - Formation of Visceral Yolk-Sac, Blood Islands and Myocardium", Journal of embryology and experimental morphology, vol. 87, no. JUN, pp. 27-&.
Dong, K.B., Maksakova, I.A., Mohn, F., Leung, D., Appanah, R., Lee, S., Yang, H.W., Lam, L.L., Mager, D.L., Schuebeler, D., Tachibana, M., Shinkai, Y. & Lorincz, M.C. 2008, "DNA methylation in ES cells requires the lysine methyltransferase G9a but not its catalytic activity", Embo Journal, vol. 27, no. 20, pp. 2691-2701.
Dovey, O.M., Foster, C.T. & Cowley, S.M. 2010a, "Emphasizing the positive: A role for histone deacetylases in transcriptional activation", Cell Cycle, vol. 9, no. 14, pp. 2700-2701.
Dovey, O.M., Foster, C.T. & Cowley, S.M. 2010b, "Histone deacetylase 1 (HDAC1), but not HDAC2, controls embryonic stem cell differentiation", Proceedings of the National Academy of Sciences of the United States of America, vol. 107, no. 18, pp. 8242-8247.
Driscoll, R., Hudson, A. & Jackson, S.P. 2007, "Yeast Rtt109 promotes genome stability by acetylating histone H3 on lysine 56", Science, vol. 315, no. 5812, pp. 649-652.
Duerre, J.A. & Lee, C.T. 1974, "In vivo methylation and turnover of rat brain histones", Journal of Neurochemistry, vol. 23, pp. 541–547
Duvic, M., Talpur, R., Ni, X., Zhang, C., Hazarika, P., Kelly, C., Chiao, J.H., Reilly, J.F., Ricker, J.L., Richon, V.M. & Frankel, S.R. 2007, "Phase 2 trial of oral vorinostat (suberoylanilide hydroxamic acid, SAHA) for refractory cutaneous T-cell lymphoma, (CTCL)", Blood, vol. 109, no. 1, pp. 31-39.
Epsztejn-Litman, S., Feldman, N., Abu-Remaileh, M., Shufaro, Y., Gerson, A., Ueda, J., Deplus, R., Fuks, F., Shinkai, Y., Cedar, H. & Bergman, Y. 2008, "De novo DNA methylation promoted by G9a prevents reprogramming of embryonically silenced genes", Nature Structural & Molecular Biology, vol. 15, no. 11, pp. 1176-1183.
Ernst, M., Oates, A. & Dunn, A.R. 1996, "gp130-mediated signal transduction in embryonic stem cells involves activation of Jak and Ras/mitogen-activated protein kinase pathways", Journal of Biological Chemistry, vol. 271, no. 47, pp. 30136-30143.
Evans, M.J. & Kaufman, M.H. 1981, "Establishment in Culture of Pluripotential Cells from Mouse Embryos", Nature, vol. 292, no. 5819, pp. 154-156.
Faust, C., Schmacher, A., Holdener, B. & Magnuson, T. 1995, "The Eed Mutation Disrupts Anterior Mesoderm Production in Mice", Development, vol. 121, no. 2, pp. 273-285.

273
Fehling, H.J., Lacaud, G., Kubo, A., Kennedy, M., Robertson, S., Keller, G. & Kouskoff, V. 2003, "Tracking mesoderm induction and its specification to the hemangioblast during embryonic stem cell differentiation", Development, vol. 130, no. 17, pp. 4217-4227.
Feil, R., Brocard, J., Mascrez, B., LeMeur, M., Metzger, D. & Chambon, P. 1996, "Ligand-activated site-specific recombination in mice", Proceedings of the National Academy of Sciences of the United States of America, vol. 93, no. 20, pp. 10887-10890.
Feldman, N., Gerson, A., Fang, J., Li, E., Zhang, Y., Shinkai, Y., Cedar, H. & Bergman, Y. 2006, "G9a-mediated irreversible epigenetic inactivation of Oct-3/4 during early embryogenesis.", Nature cell biology, vol. 8, no. 2, pp. 188-194.
Finch, J.T., Noll, M. & Kornberg, R.D. 1975, "Electron microscopy of defined lengths of chromatin.", Proceedings of the National Academy of Sciences of the United States of America, vol. 72, no. 9, pp. 3320-3322.
Fischle, W., Wang, Y., Jacobs, S., Kim, Y., Allis, C. & Khorasanizadeh, S. 2003, "Molecular basis for the discrimination of repressive methyl-lysine marks in histone H3 bv Polvcomb and HP1 chromodomains", Genes & development, vol. 17, no. 15, pp. 1870-1881.
Folger, K.R., Wong, E.A., Wahl, G. & Capecchi, M.R. 1982, "Patterns of Integration of Dna Micro-Injected into Cultured Mammalian-Cells - Evidence for Homologous Recombination between Injected Plasmid Dna-Molecules", Molecular and cellular biology, vol. 2, no. 11, pp. 1372-1387.
Forneris, F., Binda, C., Vanoni, M.A., Battaglioli, E. & Mattevi, A. 2005a, "Human histone demethylase LSD1 reads the histone code", Journal of Biological Chemistry, vol. 280, no. 50, pp. 41360-41365.
Forneris, F., Binda, C., Vanoni, M.A., Mattevi, A. & Battaglioli, E. 2005b, "Histone demethylation catalysed by LSD1 is a flavin-dependent oxidative process", FEBS letters, vol. 579, no. 10, pp. 2203-2207.
Forneris, F., Binda, C., Adamo, A., Battaglioli, E. & Mattevi, A. 2007, "Structural basis of LSD1-CoREST selectivity in histone H3 recognition", Journal of Biological Chemistry, vol. 282, no. 28, pp. 20070-20074.
Forneris, F., Binda, C., Battaglioli, E. & Mattevi, A. 2008, "LSD1: oxidative chemistry for multifaceted functions in chromatin regulation", Trends in biochemical sciences, vol. 33, no. 4, pp. 181-189.
Forneris, F., Binda, C., Dall'Aglio, A., Fraaije, M.W., Battaglioli, E. & Mattevi, A. 2006, "A highly specific mechanism of histone H3-K4 recognition by histone demethylase LSD1", Journal of Biological Chemistry, vol. 281, no. 46, pp. 35289-35295.
Foster, C.T., Dovey, O.M., Lezina, L., Luo, J.L., Gant, T.W., Barlev, N., Bradley, A. & Cowley, S.M. 2010, "Lysine-Specific Demethylase 1 Regulates the Embryonic Transcriptome and CoREST Stability", Molecular and cellular biology, vol. 30, no. 20, pp. 4851-4863.
Fouse, S.D., Shen, Y., Pellegrini, M., Cole, S., Meissner, A., Van Neste, L., Jaenisch, R. & Fan, G. 2008, "Promoter CpG methylation contributes to ES cell gene regulation in parallel with

274
Oct4/Nanog, PcG complex, and histone H3K4/K27 trimethylation", Cell Stem Cell, vol. 2, no. 2, pp. 160-169.
Fraga, M.F., Ballestar, E., Villar-Garea, A., Boix-Chornet, M., Espada, J., Schotta, G., Bonaldi, T., Haydon, C., Ropero, S., Petrie, K., Iyer, N.G., Perez-Rosado, A., Calvo, E., Lopez, J.A., Cano, A., Calasanz, M.J., Colomer, D., Piris, M.A., Ahn, N., Imhof, A., Caldas, C., Jenuwein, T. & Esteller, M. 2005, "Loss of acetylation at Lys16 and trimethylation at Lys20 of histone H4 is a common hallmark of human cancer", Nature genetics, vol. 37, no. 4, pp. 391-400.
Fraser, S.T., Yamashita, J., Jakt, L.M., Okada, M., Ogawa, M., Nishikawa, S. & Nishikawa, S.I. 2003, "In vitro differentiation of mouse embryonic stem cells: Hematopoietic and vascular cell types", Differentiation of Embryonic Stem Cells, vol. 365, pp. 59-72.
Fuhrmann, G., Chung, A.C., Jackson, K.J., Hummelke, G., Baniahmad, A., Sutter, J., Sylvester, I., Scholer, H.R. & Cooney, A.J. 2001, "Mouse germline restriction of Oct4 expression by germ cell nuclear factor.", Developmental Cell, vol. 1, no. 3, pp. 377-387.
Fujikura, J., Yamato, E., Yonemura, S., Hosoda, K., Masui, S., Nakao, K., Miyazaki, J. & Niwa, H. 2002, "Differentiation of embryonic stem cells is induced by GATA factors", Genes & development, vol. 16, no. 7, pp. 784-789.
Garcia-Bassets, I., Kwon, Y., Telese, F., Prefontaine, G.G., Hutt, K.R., Cheng, C.S., Ju, B., Ohgi, K.A., Wang, J., Escoubet-Lozach, L., Rose, D.W., Glass, C.K., Fu, X. & Rosenfeld, M.G. 2007, "Histone methylation-dependent mechanisms impose ligand dependency for gene activation by nuclear receptors", Cell, vol. 128, no. 3, pp. 505-518.
Gardner, R.L. & Rossant, J. 1979, "Investigation of the Fate of 4.5 Day Post-Coitum Mouse Inner Cell Mass Cells by Blastocyst Injection", Journal of embryology and experimental morphology, vol. 52, no. AUG, pp. 141-152.
Giambra, V., Volpi, S., Emelyanov, A.V., Pflugh, D., Bothwell, A.L.M., Norio, P., Fan, Y., Ju, Z., Skoultchi, A.I., Hardy, R.R., Frezza, D. & Birshtein, B.K. 2008, "Pax5 and linker histone H1 coordinate DNA methylation and histone modifications in the 3 ' regulatory region of the immunoglobulin heavy chain locus", Molecular and cellular biology, vol. 28, no. 19, pp. 6123-6133.
Ginsburg, M., Snow, M.H.L. & Mclaren, A. 1990, "Primordial Germ-Cells in the Mouse Embryo during Gastrulation", Development, vol. 110, no. 2, pp. 521-&.
Goll, M.G. % Bestor, T.H. 2005, "Eukaryotic Cytosine Methyltransferases". Annual Review in Biochemistry, vol. 74, pp. 481-514.
Goren, A., Tabib, A., Hecht, M. & Cedar, H. 2008, "DNA replication timing of the human beta-globin domain is controlled by histone modification at the origin", Genes & development, vol. 22, no. 10, pp. 1319-1324.
Grunstein, M. 1997, "Histone acetylation in chromatin structure and transcription", Nature, vol. 389, no. 6649, pp. 349-352.
Gu, P., LeMenuet, D., Chung, A.C., Mancini, M., Wheeler, D.A. & Cooney, A.J. 2005, "Orphan nuclear receptor GCNF is required for the repression of pluripotency genes during retinoic

275
acid-induced embryonic stem cell differentiation.", Molecular & Cellular Biology, vol. 25, no. 19, pp. 8507-8519.
Haberland, M., Montgomery, R.L. & Olson, E.N. 2009, " The many roles of histone deacetylases in development and physiology: implications for disease and therapy.”, Nature Reviews Genetics, vol. 10, no.1, pp.32-42.
Hakimi, M.A., Bochar, D.A., Chenoweth, J., Lane, W.S., Mandel, G. & Shiekhattar, R. 2002, "A core-BRAF35 complex containing histone deacetylase mediates repression of neuronal-specific genes", Proceedings of the National Academy of Sciences of the United States of America, vol. 99, no. 11, pp. 7420-7425.
Hamazaki, T., Oka, M., Yamanaka, S. & Terada, N. 2004, "Aggregation of embryonic stem cells induces Nanog repression and primitive endoderm differentiation", Journal of cell science, vol. 117, no. 23, pp. 5681-5686.
Han, J., Zhou, H., Horazdovsky, B., Zhang, K., Xu, R. & Zhang, Z. 2007, "Rtt109 acetylates histone H3 lysine 56 and functions in DNA replication", Science, vol. 315, no. 5812, pp. 653-655.
Hassig, C.A., Tong, J.K., Fleischer, T.C., Owa, T., Grable, P.G., Ayer, D.E., & Schreiber, S.L. 1998, "A role for histone deacetylase activity in HDAC1-mediated transcriptional repression", Proc. Natl. Acad. Sci. vol. 95, pp. 3519–3524.
Hattori, N., Nishino, K., Ko, Y.G., Hattori, N., Ohgane, J., Tanaka, S. & Shiota, K. 2004, "Epigenetic control of mouse Oct-4 gene expression in embryonic stem cells and trophoblast stem cells", Journal of Biological Chemistry, vol. 279, no. 17, pp. 17063-17069.
Haub, O. & Goldfarb, M. 1991, "Expression of the Fibroblast Growth Factor-5 Gene in the Mouse Embryo", Development, vol. 112, no. 2, pp. 397.
Hayes, J.J. & Hansen, J.C. 2001. "Nucleosomes and the chromatin fibre" Curr. Opin. Genet. Dev. vol. 11, pp. 124–129
Hebbes, T.R., Thorne, A.W. & Crane-Robinson. C. 1988, "A Direct Link between Core Histone Acetylation and Transcriptionally Active Chromatin", EMBO Journal, vol 7, no. 5, pp. 1395-1402
Hebert, J.M., Boyle, M. & Martin, G.R. 1991, "Messenger-RNA Localization Studies Suggest that Murine Fgf-5 Plays a Role in Gastrulation", Development, vol. 112, no. 2, pp. 407-415.
Heintzman, N.D., Hon, G.C., Hawkins, R.D., Kheradpour, P., Stark, A., Harp, L.F., Ye, Z., Lee, L.K., Stuart, R.K., Ching, C.W., Ching, K.A., Antosiewicz-Bourget, J.E., Liu, H., Zhang, X., Green, R.D., Lobanenkov, V.V., Stewart, R., Thomson, J.A., Crawford, G.E., Kellis, M. & Ren, B. 2009, "Histone modifications at human enhancers reflect global cell-type-specific gene expression", Nature, vol. 459, no. 7243, pp. 108-112.
Heintzman, N.D., Stuart, R.K., Hon, G., Fu, Y., Ching, C.W., Hawkins, R.D., Barrera, L.O., Van Calcar, S., Qu, C., Ching, K.A., Wang, W., Weng, Z., Green, R.D., Crawford, G.E. & Ren, B. 2007, "Distinct and predictive chromatin signatures of transcriptional promoters and enhancers in the human genome", Nature genetics, vol. 39, no. 3, pp. 311-318.

276
Hendrich, B. & Bird, A. 1998, "Identification and characterization of a family of mammalian methyl-CpG binding proteins", Molecular and cellular biology, vol. 18, no. 11, pp. 6538-6547.
Hendrich, B., Guy, J., Ramsahoye, B., Wilson, V.A. & Bird, A. 2001, "Closely related proteins MBD2 and MBD3 play distinctive but interacting roles in mouse development", Genes & development, vol. 15, no. 6, pp. 710-723.
Hernandez-Munoz, I., Taghavi, P., Kuijl, C., Neefjes, J. & van Lohuizen, M. 2005, "Association of BMI1 with polycomb bodies is dynamic and requires PRC2/EZH2 and the maintenance DNA methyltransferase DNMT1", Molecular and cellular biology, vol. 25, no. 24, pp. 11047-11058.
Herrmann, B.G., Labeit, S., Poustka, A., King, T.R. & Lehrach, H. 1990, "Cloning of the T-Gene Required in Mesoderm Formation in the Mouse", Nature, vol. 343, no. 6259, pp. 617-622.
Hewish, D.R. & Burgoyne, L.A. 1973, "Chromatin sub-structure. The digestion of chromatin DNA at regularly spaced sites by a nuclear deoxyribonuclease.", Biochemical & Biophysical Research Communications, vol. 52, no. 2, pp. 504-510.
Holland, P.W.H. & Hogan, B.L.M. 1988, "Expression of Homeo Box Genes during Mouse Development - a Review", Genes & development, vol. 2, no. 7, pp. 773-782.
Hu, X., Li, X., Valverde, K., Fu, X., Noguchi, C., Qiu, Y. & Huang, S. 2009, "LSD1-mediated epigenetic modification is required for TAL1 function and hematopoiesis", Proceedings of the National Academy of Sciences of the United States of America, vol. 106, no. 25, pp. 10141-10146.
Huang, Y., Vasilatos, S.N., Boric, L., Shaw, P.G. & Davidson, N.E. 2011, "Inhibitors of histone demethylation and histone deacetylation cooperate in regulating gene expression and inhibiting growth in human breast cancer cells.", Breast Cancer Research and Treatment, .
Huang, D.W., Sherman, B.T. & Lempicki, R.A. 2009, "Systematic and integrative analysis of large gene lists using DAVID bioinformatics resources", Nature Protocols, vol. 4, no. 1, pp. 44-57.
Huang, J., Sengupta, R., Espejo, A.B., Lee, M.G., Dorsey, J.A., Richter, M., Opravil, S., Shiekhattar, R., Bedford, M.T., Jenuwein, T. & Berger, S.L. 2007, "p53 is regulated by the lysine demethylase LSD1", Nature, vol. 449, no. 7158, pp. 105-U80.
Huang, Y., Fang, J., Bedford, M.T., Zhang, Y. & Xu, R.M. 2006, "Recognition of histone H3 lysine-4 methylation by the double tudor domain of JMJD2A", Science, vol. 312, no. 5774, pp. 748-751.
Hughes, C.M., Rozenblatt-Rosen, O., Milne, T.A., Copeland, T.D., Levine, S.S., Lee, J.C., Hayes, D.N., Shanmugam, K.S., Bhattacharjee, A., Biondi, C.A., Kay, G.F., Hayward, N.K., Hess, J.L. & Meyerson, M. 2004, "Menin associates with a trithorax family histone methyltransferase complex and with the Hoxc8 locus", Molecular cell, vol. 13, no. 4, pp. 587-597.
Humphrey, G.W., Wang, Y.H., Russanova, V.R., Hirai, T., Qin, J., Nakatani, Y. & Howard, B.H. 2001, "Stable histone deacetylase complexes distinguished by the presence of SANT

277
domain proteins CoREST/kiaa0071 and Mta-L1", Journal of Biological Chemistry, vol. 276, no. 9, pp. 6817-6824.
Hwang, S., Schmitt, A.A., Luteran, A.E., Toone, E.J. & McCafferty, D.G. 2011, "Thermodynamic Characterization of the Binding Interaction between the Histone Demethylase LSD1/KDM1 and CoREST", Biochemistry, vol. 50, no. 4, pp. 546-557.
Ikura, T., Ogryzko, V.V., Grigoriev, M., Groisman, R., Wang, J., Horikoshi, M., Scully, R., Qin, J. & Nakatani, Y. 2000, "Involvement of the TIP60 histone acetylase complex in DNA repair and apoptosis", Cell, vol. 102, no. 4, pp. 463-473.
Inouye, S. & Tsuji, F.I. 1994, "Aequorea Green Fluorescent Protein - Expression of the Gene and Fluorescence Characteristics of the Recombinant Protein", FEBS letters, vol. 341, no. 2-3, pp. 277-280.
Issaeva, I., Zonis, Y., Rozovskaia, T., Orlovsky, K., Croce, C.M., Nakamura, T., Mazo, A., Eisenbach, L. & Canaani, E. 2007, "Knockdown of ALR (MLL2) reveals ALR target genes and leads to alterations in cell adhesion and growth", Molecular and cellular biology, vol. 27, no. 5, pp. 1889-1903.
Iwase, S., Lan, F., Bayliss, P., de la Torre-Ubieta, L., Huarte, M., Qi, H.H., Whetstine, J.R., Bonni, A., Roberts, T.M. & Shi, Y. 2007, "The X-linked mental retardation gene SMCX/JARID1C defines a family of histone H3 lysine 4 demethylases", Cell, vol. 128, no. 6, pp. 1077-1088.
Jenuwein, T. & Allis, C.D. 2001, "Translating the histone code", Science, vol. 293, no. 5532, pp. 1074-1080.
Joshi, A.A. & Struhl, K. 2005, "Eaf3 chromodomain interaction with methylated H3-K36 links histone deacetylation to Pol II elongation", Molecular cell, vol. 20, no. 6, pp. 971-978.
Kadosh, D. & Struhl, K. 1997, "Repression by Ume6 involves recruitment of a complex containing Sin3 corepressor and Rpd3 histone deacetylase to target promoters", Cell, vol. 89, no. 3, pp. 365-371.
Kaji, K., Caballero, I.M., MacLeod, R., Nichols, J., Wilson, V.A. & Hendrich, B. 2006, "The NuRD component Mbd3 is required for pluripotency of embryonic stem cells", Nature cell biology, vol. 8, no. 3, pp. 285-292.
Karytinos, A., Forneris, F., Profumo, A., Ciossani, G., Battaglioli, E., Binda, C. & Mattevi, A. 2009, "A Novel Mammalian Flavin-dependent Histone Demethylase", Journal of Biological Chemistry, vol. 284, no. 26, pp. 17775-17782.
Kasten, M.M., Dorland, S. & Stillman, D.J. 1997, "Large protein complex containing the yeast Sin3p and Rpd3p transcriptional regulators", Molecular and cellular biology, vol. 17, no. 8, pp. 4852-4858.
Keller, G. 2005, "Embryonic stem cell differentiation: emergence of a new era in biology and medicine", Genes & development, vol. 19, no. 10, pp. 1129-1155.

278
Keller, G., Kennedy, M., Papayannopoulou, T. & Wiles, M.V. 1993, "Hematopoietic Commitment during Embryonic Stem-Cell Differentiation in Culture", Molecular and cellular biology, vol. 13, no. 1, pp. 473-486.
Keller, G.M. 1995, "In-Vitro Differentiation of Embryonic Stem-Cells", Current opinion in cell biology, vol. 7, no. 6, pp. 862-869.
Keogh, M.C., Kurdistani, S.K., Morris, S.A., Ahn, S.H., Podolny, V., Collins, S.R., Schuldiner, M., Chin, K.Y., Punna, T., Thompson, N.J., Boone, C., Emili, A., Weissman, J.S., Hughes, T.R., Strahl, B.D., Grunstein, M., Greenblatt, J.F., Buratowski, S. & Krogan, N.J. 2005, "Cotranscriptional Set2 methylation of histone H3 lysine 36 recruits a repressive Rpd3 complex", Cell, vol. 123, no. 4, pp. 593-605.
Kim, S., Benoiton, L., & Paik, W.K. 1964,"Alkyllsinase. Purification and properties of the enzyme", Journal of Biological Chemistry, vol. 239, pp. 3790–3796.
Kim, J., Sif, S., Jones, B., Jackson, A., Koipally, J., Heller, E., Winandy, S., Viel, A., Sawyer, A., Ikeda, T., Kingston, R. & Georgopoulos, K. 1999, " Ikaros DNA-binding proteins direct formation of chromatin remodeling complexes in lymphocytes", Immunity, vol. 10, no. 3, pp. 345-355.
Kim, J., Daniel, J., Espejo, A., Lake, A., Krishna, M., Xia, L., Zhang, Y. & Bedford, M.T. 2006, "Tudor, MBT and chromo domains gauge the degree of lysine methylation", EMBO reports, vol. 7, no. 4, pp. 397-403.
Kim, J., Chu, J., Shen, X., Wang, J. & Orkin, S.H. 2008, "An extended transcriptional network for pluripotency of embryonic stem cells", Cell, vol. 132, no. 6, pp. 1049-1061.
Kinder, S.J., Tsang, T.E., Quinlan, G.A., Hadjantonakis, A.K., Nagy, A. & Tam, P.P.L. 1999, "The orderly allocation of mesodermal cells to the extraembryonic structures and the anteroposterior axis during gastrulation of the mouse embryo", Development, vol. 126, no. 21, pp. 4691-4701.
Kingston, R.E. and Narlikar, G.J. 1999, "ATP-dependent remodeling and acetylation as regulators of chromatin fluidity", Genes & Dev. vol. 13, pp. 2339–2352.
Kispert, A. & Herrmann, B.G. 1994, "Immunohistochemical Analysis of the Brachyury Protein in Wild-Type and Mutant Mouse Embryos", Developmental biology, vol. 161, no. 1, pp. 179-193.
Klose, R.J., Yamane, K., Bae, Y., Zhang, D., Erdjument-Bromage, H., Tempst, P., Wong, J. & Zhang, Y. 2006, "The transcriptional repressor JHDM3A demethylates trimethyl histone H3 lysine 9 and lysine 36", Nature, vol. 442, no. 7100, pp. 312-316.
Klose, R.J., Yan, Q., Tothova, Z., Yamane, K., Erdjument-Bromage, H., Tempst, P., Gilliland, D.G., Zhang, Y. & Kaelin, W.G., Jr. 2007, "The retinoblastoma binding protein RBP2 is an H3K4 demethylase", Cell, vol. 128, no. 5, pp. 889-900.
Kohlmaier, A., Savarese, F., Lachner, M., Martens, J., Jenuwein, T. & Wutz, A. 2004, "A chromosomal memory triggered by Xist regulates histone methylation in X inactivation", Plos Biology, vol. 2, no. 7, pp. 991-1003.
279
Kolasinska-Zwierz, P., Down, T., Latorre, I., Liu, T., Liu, X.S. & Ahringer J. 2009, "Differential chromatin marking of introns and expressed exons by H3K36me3", Nature Genetics, vol. 41, no. 3, pp. 376-381.
Kontaki, H. & Talianidis, I. 2010, "Lysine Methylation Regulates E2F1-Induced Cell Death", Molecular cell, vol. 39, no. 1, pp. 152-160.
Kornberg, R.D. 1974, "Chromatin Structure - Repeating Unit of Histones and DNA", Science, vol. 184, no. 4139, pp. 868-871.
Kornberg, R.D. and Lorch, Y. 1999. "Twenty-five years of the nucleosome, fundamental particle of the eukaryote chromosome" Cell, vol. 98, pp. 285–294
Kossel. A. 1884, Physiol. Chem., vol. 8, pp. 511–515.
Kouzarides, T. 2007, "Chromatin modifications and their function", Cell, vol. 128, no. 4, pp. 693-705.
Ku, M., Koche, R.P., Rheinbay, E., Mendenhall, E.M., Endoh, M., Mikkelsen, T.S., Presser, A., Nusbaum, C., Xie, X., Chi, A.S., Adli, M., Kasif, S., Ptaszek, L.M., Cowan, C.A., Lander, E.S., Koseki, H. & Bernstein, B.E. 2008, "Genomewide Analysis of PRC1 and PRC2 Occupancy Identifies Two Classes of Bivalent Domains", Plos Genetics, vol. 4, no. 10, pp. e1000242.
Kunath, T., Saba-El-Leil, M.K., Almousailleakh, M., Wray, J., Meloche, S. & Smith, A. 2007, "FGF stimulation of the Erk1/2 signalling cascade triggers transition of pluripotent embryonic stem cells from self-renewal to lineage commitment", Development, vol. 134, no. 16, pp. 2895-2902.
Kuo, M.H., Zhou, J., Jambeck, P., Churchill, M.E., & Allis, C.D. 1998, "Histone acetyltransferase activity of yeast Gcn5p is required for the activation of target genes in vivo", Genes & Dev. vol. 12, pp. 627–63.
Kurdistani, S.K., Robyr, D., Tavazoie, S. & Grunstein, M. 2002, "Genome-wide binding map of the histone deacetylase Rpd3 in yeast", Nature genetics, vol. 31, no. 3, pp. 248-254.
Kuzmichev, A. & Reinberg, D. 2001, "Role of histone deacetylase complexes in the regulation of chromatin metabolism", Curr. Top. Microbiol. Immunol. vol. 254, pp.35–58.
Lachner, M. & Jenuwein, T. 2002, "The many faces of histone lysine methylation", Current opinion in cell biology, vol. 14, no. 3, pp. 286-298.
Lachner, M., O'Carroll, N., Rea, S., Mechtler, K. & Jenuwein, T. 2001, "Methylation of histone H3 lysine 9 creates a binding site for HP1 proteins", Nature, vol. 410, no. 6824, pp. 116-120.
Lachner, M., O'Sullivan, R.J. & Jenuwein, T. 2003, "An epigenetic road map for histone lysine methylation", Journal of cell science, vol. 116, no. 11, pp. 2117-2124.
Lagger, G., O'Carroll, D., Rembold, M., Khier, H., Tischler, J., Weitzer, G., Schuettengruber, B., Hauser, C., Brunmeir, R., Jenuwein, T. & Seiser, C. 2002, "Essential function of histone
280
deacetylase 1 in proliferation control and CDK inhibitor repression.", EMBO Journal, vol. 21, no. 11, pp. 2672-2681.
Laherty, C.D., Yang, W.M., Sun, J.M., Davie, J.R., Seto, E. & Eisenman, R.N. 1997, "Histone deacetylases associated with the mSin3 corepressor mediate Mad transcriptional repression", Cell, vol. 89, no. 3, pp. 349-356.
Lai, A., Kennedy, B.K., Barbie, D.A., Bertos, N.R., Yang, X.J., Theberge, M.C., Tsai, S.C., Seto, E., Zhang, Y., Kuzmichev, A., Lane, W.S., Reinberg, D., Harlow, E. & Branton, P.E. 2001, "RBP1 recruits the mSIN3-histone deacetylase complex to the pocket of retinoblastoma tumor suppressor family proteins found in limited discrete regions of the nucleus at growth arrest", Molecular and cellular biology, vol. 21, no. 8, pp. 2918-2932.
Lake, J.A., Rathjen, J., Remiszewski, J. & Rathjen, P.D. 2000, "Reversible programming of pluripotent cell differentiation", Journal of cell science, vol. 113, no. 3, pp. 555-566.
Lan, F., Collins, R.E., De Cegli, R., Alpatov, R., Horton, J.R., Shi, X., Gozani, O., Cheng, X. & Shi, Y. 2007, "Recognition of unmethylated histone H3 lysine 4 links BHC80 to LSD1-mediated gene repression", Nature, vol. 448, no. 7154, pp. 718-U14.
Lan, F., Nottke, A.C. & Shi, Y. 2008, "Mechanisms involved in the regulation of histone lysine demethylases", Current opinion in cell biology, vol. 20, no. 3, pp. 316-325.
Lande-Diner, L., Zhang, J. & Cedar, H. 2009, "Shifts in Replication Timing Actively Affect Histone Acetylation during Nucleosome Reassembly", Molecular cell, vol. 34, no. 6, pp. 767-774.
Lee, M.G., Wynder, C., Bochar, D.A., Hakimi, M.A., Cooch, N. & Shiekhattar, R. 2006a, "Functional interplay between histone demethylase and deacetylase enzymes.", Molecular and Cellular Biology, vol. 26, no. 17, pp. 6395-6402.
Lee, M.G., Wynder, C., Schmidt, D.M., McCafferty, D.G. & Shiekhatter, R. 2006b, " Histone H3 lysine 4 demethylation is a target of nonselective antidepressive medications", Chemical Biology, vol. 13, pp. 563-567.
Lee, J.H., Hart, S.R.L. & Skalnik, D.G. 2004a, "Histone deacetylase activity is required for embryonic stem cell differentiation", Genesis, vol. 38, no. 1, pp. 32-38.
Lee, J.H., Hart, S.R.L. & Skalnik, D.G. 2004b, "Histone deacetylase activity is required for embryonic stem cell differentiation", Genesis, vol. 38, no. 1, pp. 32-38.
Lee, J., Smith, E. & Shilatifard, A. 2010, "The Language of Histone Crosstalk", Cell, vol. 142, no. 5, pp. 682-685.
Lee, M.G., Wynder, C., Cooch, N. & Shiekhattar, R. 2005, "An essential role for CoREST in nucleosomal histone 3 lysine 4 demethylation", Nature, vol. 437, no. 7057, pp. 432-435.
Lee, M.G., Wynder, C., Schmidt, D.M., McCafferty, D.G. & Shiekhattar, R. 2006, "Histone H3 lysine 4 demethylation is a target of nonselective antidepressive medications", Chemistry & biology, vol. 13, no. 6, pp. 563-567.

281
Lee, M.G., Norman, J., Shilatifard, A. & Shiekhattar, R. 2007a, "Physical and functional association of a trimethyl H3K4 demethylase and Ring6a/MBLR, a polycomb-like protein", Cell, vol. 128, no. 5, pp. 877-887.
Lee, M.G., Villa, R., Trojer, P., Norman, J., Yan, K., Reinberg, D., Di Croce, L. & Shiekhattar, R. 2007b, "Demethylation of H3K27 regulates polycomb recruitment and H2A ubiquitination", Science, vol. 318, no. 5849, pp. 447-450.
Lee, N., Erdjument-Bromage, H., Tempst, P., Jones, R.S. & Zhang, Y. 2009, "The H3K4 Demethylase Lid Associates with and Inhibits Histone Deacetylase Rpd3", Molecular and cellular biology, vol. 29, no. 6, pp. 1401-1410.
Lee, T.I., Jenner, R.G., Boyer, L.A., Guenther, M.G., Levine, S.S., Kumar, R.M., Chevalier, B., Johnstone, S.E., Cole, M.F., Isono, K., Koseki, H., Fuchikami, T., Abe, K., Murray, H.L., Zucker, J.P., Yuan, B., Bell, G.W., Herbolsheimer, E., Hannett, N.M., Sun, K., Odom, D.T., Otte, A.P., Volkert, T.L., Bartel, D.P., Melton, D.A., Gifford, D.K., Jaenisch, R. & Young, R.A. 2006, "Control of developmental regulators by Polycomb in human embryonic stem cells", Cell, vol. 125, no. 2, pp. 301-313.
Li, E., Bestor, T.H. & Jaenisch, R. 1992, "Targeted Mutation of the Dna Methyltransferase Gene Results in Embryonic Lethality", Cell, vol. 69, no. 6, pp. 915-926.
Li, H.T., Ilin, S., Wang, W.K., Duncan, E.M., Wysocka, J., Allis, C.D. & Patel, D.J. 2006, "Molecular basis for site-specific read-out of histone H3K4me3 by the BPTF PHD finger of NURF", Nature, vol. 442, no. 7098, pp. 91-95.
Li B, Jackson J, Simon MD, Fleharty B, Gogol M, Seidel C, Workman JL, Shilatifard A. 2009, "Histone H3 lysine 36 dimethylation (H3K36me2) is sufficient to recruit the Rpd3s histone deacetylase complex and to repress spurious transcription", Journal of Biological Chemistry, vol. 284, no. 12, pp. 7970-7976
Liang, J., Wan, M., Zhang, Y., Gu, P., Xin, H., Jung, S.Y., Qin, J., Wong, J., Cooney, A.J., Liu, D. & Zhou Songyang 2008, "Nanog and Oct4 associate with unique transcriptional repression complexes in embryonic stem cells", Nature cell biology, vol. 10, no. 6, pp. 731-739.
Lin, W.C. & Dent, S.Y.R. 2006, "Functions of histone-modifying enzymes in development", Current opinion in genetics & development, vol. 16, no. 2, pp. 137-142.
Lister, R., Pelizzola, M., Dowen, R.H., Hawkins, R.D., Hon, G., Tonti-Filippini, J., Nery, J.R., Lee, L., Ye, Z., Ngo, Q., Edsall, L., Antosiewicz-Bourget, J., Stewart, R., Ruotti, V., Millar, A.H., Thomson, J.A., Ren, B. & Ecker, J.R. 2009, "Human DNA methylomes at base resolution show widespread epigenomic differences RID B-9144-2008", Nature, vol. 462, no. 7271, pp. 315-322.
Litt, M.D., Simpson, M., Gaszner, M., Allis, C.D. & Felsenfeld, G. 2001, "Correlation between histone lysine methylation and developmental changes at the chicken beta-globin locus", Science, vol. 293, pp. 2453-2455.
Liu, P.T., Wakamiya, M., Shea, M.J., Albrecht, U., Behringer, R.R. & Bradley, A. 1999, "Requirement for Wnt3 in vertebrate axis formation", Nature genetics, vol. 22, no. 4, pp. 361-365.

282
Liu, Z., Li, T., Liu, Y., Jia, Z., Li, Y., Zhang, C., Chen, P., Ma, K., Affara, N. & Zhou, C. 2009, "WNT signaling promotes Nkx2.5 expression and early cardiomyogenesis via downregulation of Hdac1", Biochimica Et Biophysica Acta-Molecular Cell Research, vol. 1793, no. 2, pp. 300-311.
Loh, Y.H., Wu, Q., Chew, J.L., Vega, V.B., Zhang, W.W., Chen, X., Bourque, G., George, J., Leong, B., Liu, J., Wong, K.Y., Sung, K.W., Lee, C.W.H., Zhao, X.D., Chiu, K.P., Lipovich, L., Kuznetsov, V.A., Robson, P., Stanton, L.W., Wei, C.L., Ruan, Y.J., Lim, B. & Ng, H.H. 2006, "The Oct4 and Nanog transcription network regulates pluripotency in mouse embryonic stem cells", Nature genetics, vol. 38, no. 4, pp. 431-440.
Loh, Y., Zhang, W., Chen, X., George, J. & Ng, H. 2007, "Jmjd1a and Jmjd2c histone H3 Lys 9 demethylases regulate self-renewal in embryonic stem cells", Genes & development, vol. 21, no. 20, pp. 2545-2557.
Lowry, W.E., Richter, L., Yachechko, R., Pyle, A.D., Tchieu, J., Sridharan, R., Clark, A.T. & Plath, K. 2008, "Generation of human induced pluripotent stem cells from dermal fibroblasts", Proceedings of the National Academy of Sciences of the United States of America, vol. 105, no. 8, pp. 2883-2888.
Lubitz, S., Glaser, S., Schaft, J., Stewart, A.F. & Anastassiadis, K. 2007, "Increased apoptosis and skewed differentiation in mouse embryonic stem cells lacking the histone methyltransferase Mll2 RID A-8944-2010", Molecular biology of the cell, vol. 18, no. 6, pp. 2356-2366.
Luco, R.F., Pan, Q., Tominaga, K., Blencowe, B.J., Pereira-Smith, O.M. & Misteli, T. 2010, "Regulation of Alternative Splicing by Histone Modifications", Science, vol. 327, no. 5968, pp. 996-1000.
Lunyak, V.V., Burgess, R., Prefontaine, G.G., Nelson, C., Sze, S.H., Chenoweth, J., Schwartz, P., Pevzner, P.A., Glass, C., Mandel, G. & Rosenfeld, M.G. 2002, "Corepressor-dependent silencing of chromosomal regions encoding neuronal genes", Science, vol. 298, no. 5599, pp. 1747-1752.
Luo, R.X., Postigo, A.A. & Dean, D.C. 1998, "Rb interacts with histone deacetylase to repress transcription", Cell, vol. 92, no. 4, pp. 463-473.
Ma, Y.G., Rosfjord, E., Huebert, C., Wilder, P., Tiesman, J., Kelly, D. & Rizzino, A. 1992, "Transcriptional Regulation of the Murine K-Fgf Gene in Embryonic-Cell Lines", Developmental biology, vol. 154, no. 1, pp. 45-54.
Macfarlan, T.S., Gifford, W.D., Agarwal, S., Driscoll, S., Lettieri, K., Wang, J., Andrews, S.E., Franco, L., Rosenfeld, M.G., Ren, B. & Pfaff, S.L. 2011, "Endogenous retroviruses and neighboring genes are coordinately repressed by LSD1/KDM1A", Genes & development, vol. 25, no. 6, pp. 594-607.
Magnaghi-Jaulin, L., Groisman, R., Naguibneva, I., Robin, P., Lorain, S., Le Villain, J.P., Troalen, F., Trouche, D. & Harel-Bellan, A. 1998, "Retinoblastoma protein represses transcription by recruiting a histone deacetylase", Nature, vol. 391, no. 6667, pp. 601-605.

283
Maherali, N., Sridharan, R., Xie, W., Utikal, J., Eminli, S., Arnold, K., Stadtfeld, M., Yachechko, R., Tchieu, J., Jaenisch, R., Plath, K. & Hochedlinger, K. 2007, "Directly reprogrammed fibroblasts show global epigenetic remodeling and widespread tissue contribution", Cell Stem Cell, vol. 1, no. 1, pp. 55-70.
Margueron, R., Trojer, P. & Reinberg, D. 2005, "The key to development: interpreting the histone code?", Current opinion in genetics & development, vol. 15, no. 2, pp. 163-176.
Marks, P.A. & Xu, W.-. 2009, "Histone Deacetylase Inhibitors: Potential in Cancer Therapy", Journal of cellular biochemistry, vol. 107, no. 4, pp. 600-608.
Martin, C. & Zhang, Y. 2005, "The diverse functions of histone lysine methylation.", Nature Reviews Molecular Cell Biology, vol. 6, pp. 838-849.
Martin, G.R. 1981, "Isolation of a Pluripotent Cell-Line from Early Mouse Embryos Cultured in Medium Conditioned by Teratocarcinoma Stem-Cells", Proceedings of the National Academy of Sciences of the United States of America-Biological Sciences, vol. 78, no. 12, pp. 7634-7638.
Mayshoopes, L., Brown, A. & Huang, R. 1983, "Methylation and Rearrangement of Mouse Intracisternal a Particle Genes in Development, Aging, and Myeloma", Molecular and cellular biology, vol. 3, no. 8, pp. 1371-1380.
Mcclelland, M. 1981, "The Effect of Sequence Specific Dna Methylation on Restriction Endonuclease Cleavage", Nucleic acids research, vol. 9, no. 22, pp. 5859-5866.
Meissner, A., Wernig, M. & Jaenisch, R. 2007, "Direct reprogramming of genetically unmodified fibroblasts into pluripotent stem cells", Nature biotechnology, vol. 25, no. 10, pp. 1177-1181.
Mellor, J., Dudek, P. & Clynes, D. 2008, "A glimpse into the epigenetic landscape of gene regulation", Current opinion in genetics & development, vol. 18, no. 2, pp. 116-122.
Meshorer, E., Yellajoshula, D., George, E., Scambler, P.J., Brown, D.T. & Mistell, T. 2006, "Hyperdynamic plasticity in pluripotent embryonic of chromatin proteins stem cells", Developmental Cell, vol. 10, no. 1, pp. 105-116.
Metzger, E., Wissmann, M., Yin, N., Muller, J.M., Schneider, R., Peters, A.H.F.M., Gunther, T., Buettner, R. & Schule, R. 2005, "LSD1 demethylates repressive histone marks to promote androgen-receptor-dependent transcription", Nature, vol. 437, pp. 436-439.
Metzger, D., Clifford, J., Chiba, H. & Chambon, P. 1995, "Conditional Site-Specific Recombination in Mammalian-Cells using a Ligand-Dependent Chimeric Cre Recombinase", Proceedings of the National Academy of Sciences of the United States of America, vol. 92, no. 15, pp. 6991-6995.
Mikkelsen, T.S., Ku, M., Jaffe, D.B., Issac, B., Lieberman, E., Giannoukos, G., Alvarez, P., Brockman, W., Kim, T., Koche, R.P., Lee, W., Mendenhall, E., O'Donovan, A., Presser, A., Russ, C., Xie, X., Meissner, A., Wernig, M., Jaenisch, R., Nusbaum, C., Lander, E.S. & Bernstein, B.E. 2007, "Genome-wide maps of chromatin state in pluripotent and lineage-committed cells", Nature, vol. 448, no. 7153, pp. 553-U2.

284
Miller, T., Krogan, N.J., Dover, J., Erdjument-Bromage, H., Tempst, P., Johnston, M., Greenblatt, J.F. & Shilatifard, A. 2001, "COMPASS: A complex of proteins associated with a trithorax-related SET domain protein", Proceedings of the National Academy of Sciences of the United States of America, vol. 98, no. 23, pp. 12902-12907.
Millerhance, W.C., Lacorbiere, M., Fuller, S.J., Evans, S.M., Lyons, G., Schmidt, C., Robbins, J. & Chien, K.R. 1993, "In-Vitro Chamber Specification during Embryonic Stem-Cell Cardiogenesis - Expression of the Ventricular Myosin Light Chain-2 Gene is Independent of Heart Tube Formation", Journal of Biological Chemistry, vol. 268, no. 33, pp. 25244-25252.
Milne, T.A., Briggs, S.D., Brock, H.W., Martin, M.E., Gibbs, D., Allis, C.D. & Hess, J.L. 2002, "MLL targets SET domain methyltransferase activity to Hox gene promoters", Molecular cell, vol. 10, no. 5, pp. 1107-1117.
Mitsui, K., Tokuzawa, Y., Itoh, H., Segawa, K., Murakami, M., Takahashi, K., Maruyama, M., Maeda, M. & Yamanaka, S. 2003, "The homeoprotein Nanog is required for maintenance of pluripotency in mouse epiblast and ES cells.", Cell, vol. 113, no. 5, pp. 631-642.
Montgomery, N.D., Yee, D., Chen, A., Kalantry, S., Chamberlain, S.J., Otte, A.P. & Magnuson, T. 2005, "The murine polycomb group protein Eed is required for global histone H3 lysine-27 methylation", Current Biology, vol. 15, no. 10, pp. 942-947.
Montgomery, R.L., Hsieh, J., Barbosa, A.C., Richardson, J.A. & Olson, E.N. 2009, "Histone deacetylases 1 and 2 control the progression of neural precursors to neurons during brain development", Proceedings of the National Academy of Sciences of the United States of America, vol. 106, no. 19, pp. 7876-7881.
Murray, P. & Edgar, D. 2001, "The regulation of embryonic stem cell differentiation by leukaemia inhibitory factor (LIF)", Differentiation, vol. 68, no. 4-5, pp. 227-234.
Murry, C.E. & Keller, G. 2008, "Differentiation of embryonic stem cells to clinically relevant populations: lesson from embryonic development", Cell, vol. 132, no. 4, pp. 661-680.
Nagy, L., Kao, H.Y., Chakravarti, D., Lin, R.J., Hassig, C.A., Ayer, D.E., Schreiber, S.L. & Evans, R.M. 1997, "Nuclear receptor repression mediated by a complex containing SMRT, mSin3A, and histone deacetylase.", Cell, vol. 89, no. 3, pp. 373-380.
Nakano, T., Kodama, H. & Honjo, T. 1994, "Generation of Lymphohematopoietic Cells from Embryonic Stem-Cells in Culture", Science, vol. 265, no. 5175, pp. 1098-1101.
Nakayam, J., Rice, J.C., Strahl, B.D., Allis, C.D. & Grewal, S.I.S. 2001, "Role of histone H3 lysine 9 methylation in epigenetic control of heterochromatin assembly", Science, vol. 292, no. 5514, pp. 110-113.
Ng, H.H., Robert, F., Young, R.A. & Struhl, K. 2003, "Targeted recruitment of set1 histone methylase by elongating pol II provides a localized mark and memory of recent transcriptional activity", Molecular cell, vol. 11, no. 3, pp. 709-719.
Ng, S.S., Kavanagh, K.L., McDonough, M.A., Butler, D., Pilka, E.S., Lienard, B.M.R., Bray, J.E., Savitsky, P., Gileadi, O., von Delft, F., Rose, N.R., Offer, J., Scheinost, J.C., Borowski, T., Sundstrom, M., Schofield, C.J. & Oppermann, U. 2007, "Crystal structures of histone

285
demethylase JMJD2A reveal basis for substrate specificity", Nature, vol. 448, no. 7149, pp. 87-91.
Nichols, J., Zevnik, B., Anastassiadis, K., Niwa, H., Klewe-Nebenius, D., Chambers, I., Scholer, H. & Smith, A. 1998, "Formation of pluripotent stem cells in the mammalian embryo depends on the POU transcription factor Oct4.", Cell, vol. 95, no. 3, pp. 379-391.
Nicolas, E., Lee, M.G., Hakimi, M., Cam, H.P., Grewal, S.I.S. & Shiekhattar, R. 2006, "Fission yeast homologs of human histone H3 lysine 4 demethylase regulate a common set of genes with diverse functions", Journal of Biological Chemistry, vol. 281, no. 47, pp. 35983-35988.
Nielsen, S.J., Schneider, R., Bauer, U.M., Bannister, A.J., Morrison, A., O'Carroll, D., Firestein, R., Cleary, M., Jenuwein, T., Herrera, R.E. & Kouzarides, T. 2001, "Rb targets histone H3 methylation and HP1 to promoters", Nature, vol. 412, no. 6846, pp. 561-565.
Nishikawa, S., Nishikawa, S., Hirashima, M., Matsuyoshi, N. & Kodama, H. 1998, "Progressive lineage analysis by cell sorting and culture identifies FLK1(+)VE-cadherin(+) cells at a diverging point of endothelial and hemopoietic lineages", Development, vol. 125, no. 9, pp. 1747-1757.
Nishioka, K., Chuikov, S., Sarma, K., Erdjument-Bromage, H., Allis, C.D., Tempst, P. & Reinberg, D. 2002, "Set9, a novel histone H3 methyltransferase that facilitates transcription by precluding histone tail modifications required for heterochromatin formation", Genes & development, vol. 16, no. 4, pp. 479-489.
Niwa, H., Burdon, T., Chambers, I. & Smith, A. 1998, "Self-renewal of pluripotent embryonic stem cells is mediated via activation of STAT3", Genes & development, vol. 12, no. 13, pp. 2048-2060.
Niwa, H., Miyazaki, J. & Smith, A.G. 2000, "Quantitative expression of Oct-3/4 defines differentiation, dedifferentiation or self-renewal of ES cells", Nature genetics, vol. 24, no. 4, pp. 372-376.
Niwa, H., Toyooka, T., Shimosato, D., Strumpf, D., Takahashi, K., Yagi, R. & Rossant, J. 2005, "Interaction between Oct3/4 and Cdx2 determines trophectoderm differentiation", Cell, vol. 123, no. 5, pp. 917-929.
Noll, M. 1974, "Subunit structure of chromatin.", Nature, vol. 251, no. 5472, pp. 249-251.
Noma, K., Allis, C.D. & Grewal, S.I.S. 2001, "Transitions in distinct histone H3 methylation patterns at the heterochromatin domain boundaries", Science, vol. 293, pp. 1150-1155.
O'Carroll, D., Erhardt, S., Pagani, M., Barton, S.C., Surani, M.A. & Jenuwein, T. 2001, "The Polycomb-group gene Ezh2 is required for early mouse development", Molecular and cellular biology, vol. 21, no. 13, pp. 4330-4336.
Okita, K., Ichisaka, T. & Yamanaka, S. 2007, "Generation of germline-competent induced pluripotent stem cells", Nature, vol. 448, no. 7151, pp. 313-U1.
286
Okita, K., Nakagawa, M., Hong, H., Ichisaka, T. & Yamanaka, S. 2008, "Generation of Mouse Induced Pluripotent Stem Cells Without Viral Vectors", Science, vol. 322, no. 5903, pp. 949-953.
Ooi, S.K.T., Qiu, C., Bernstein, E., Li, K., Jia, D., Yang, Z., Erdjument-Bromage, H., Tempst, P., Lin, S., Allis, C.D., Cheng, X. & Bestor, T.H. 2007, "DNMT3L connects unmethylated lysine 4 of histone H3 to de novo methylation of DNA", Nature, vol. 448, no. 7154, pp. 714-U13.
Orford, K., Kharchenko, P., Lai, W., Dao, M.C., Worhunsky, D.J., Ferro, A., Janzen, V., Park, P.J. & Scadden, D.T. 2008, "Differential H3K4 methylation identifies developmentally poised hematopoietic genes", Developmental Cell, vol. 14, no. 5, pp. 798-809.
Oudet, P., Gross-Bellard, M. & Chambon, P. 1975, "Electron microscopic and biochemical evidence that chromatin structure is a repeating unit", Cell, vol. 4, no. 4, pp. 281-300.
Ouyang, J., Shi, Y., Valin, A., Xuan, Y. & Gill, G. 2009, "Direct binding of CoREST1 to SUMO-2/3 contributes to gene-specific repression by the LSD1/CoREST/HDAC1 complex", Molecular Cell, vol. 34, pp. 145-154.
Paik, W.K. & Kim, S. 1973, "Enzymatic demethylation of calf thymus histones", Biochem. Biophys. Res. Commun. vol, 51, pp. 781–788.
Paik, W.K. & Kim, S. 1974, "Epsilon-alkyllysinase. New assay method, purificational and biological significance", Arch. Biochem. Biophys. vol. 165, pp. 369–378.
Pan, G., Tian, S., Nie, J., Yang, C., Ruotti, V., Wei, H., Jonsdottir, G.A., Stewart, R. & Thomson, J.A. 2007, "Whole-genome analysis of histone H3 lysine 4 and lysine 27 methylation in human embryonic stem cells", Cell Stem Cell, vol. 1, no. 3, pp. 299-312.
Pardo, M., Lang, B., Yu, L., Prosser, H., Bradley, A., Babu, M.M. & Choudhary, J. 2010, "An Expanded Oct4 Interaction Network: Implications for Stem Cell Biology, Development, and Disease", Cell Stem Cell, vol. 6, no. 4, pp. 382-395.
Park, I., Zhao, R., West, J.A., Yabuuchi, A., Huo, H., Ince, T.A., Lerou, P.H., Lensch, M.W. & Daley, G.Q. 2008, "Reprogramming of human somatic cells to pluripotency with defined factors", Nature, vol. 451, no. 7175, pp. 141-U1.
Pasini, D., Bracken, A.P., Jensen, M.R., Denchi, E.L. & Helin, K. 2004, "Suz12 is essential for mouse development and for EZH2 histone methyltransferase activity", Embo Journal, vol. 23, no. 20, pp. 4061-4071.
Pazin, M.J. and Kadonaga, J.T. 1997, "What’s up and down with histone deacetylation and transcription?", Cell, vol. 89, pp. 325–328.
Pegoraro, G., Kubben, N., Wickert, U., Goehler, H., Hoffmann, K. & Misteli, T. 2009, "Ageing-related chromatin defects through loss of the NURD complex", Nature cell biology, vol. 11, no. 10, pp. 1261-U251.
Pena, P.V., Davrazou, F., Shi, X.B., Walter, K.L., Verkhusha, V.V., Gozani, O., Zhao, R. & Kutateladze, T.G. 2006, "Molecular mechanism of histone H3K4me3 recognition by plant homeodomain of ING2", Nature, vol. 442, no. 7098, pp. 100-103.

287
Peters, A.H.F.M., Mermoud, J.E., O'Carroll, D., Pagani, M., Schweizer, D., Brockdorff, N. & Jenuwein, T. 2002, "Histone H3 lysine 9 methylation is an epigenetic imprint of facultative heterochromatin", Nature genetics, vol. 30, no. 1, pp. 77-80.
Peterson, C.L. & Laniel, M.A. 2004, "Histones and histone modifications", Current Biology, vol. 14, no. 14, pp. R546-R551.
Prasher, D.C., Eckenrode, V.K., Ward, W.W., Prendergast, F.G. & Cormier, M.J. 1992, "Primary Structure of the Aequorea-Victoria Green-Fluorescent Protein", Gene, vol. 111, no. 2, pp. 229-233.
Qian, C.M., Zhang, Q., Li, S.D., Zeng, L., Walsh, M.J. & Zhou, M.M. 2005, "Structure and chromosomal DNA binding of the SWIRM domain", Nature Structural & Molecular Biology, vol. 12, no. 12, pp. 1078-1085.
Rathjen, J., Lake, J.A., Bettess, M.D., Washington, J.M., Chapman, G. & Rathjen, P.D. 1999, "Formation of a primitive ectoderm like cell population, EPL cells, from ES cells in response to biologically derived factors", Journal of cell science, vol. 112, no. 5, pp. 601-612.
Rea, S., Eisenhaber, F., O'Carroll, N., Strahl, B.D., Sun, Z.W., Schmid, M., Opravil, S., Mechtler, K., Ponting, C.P., Allis, C.D. & Jenuwein, T. 2000, "Regulation of chromatin structure by site-specific histone H3 methyltransferases", Nature, vol. 406, no. 6796, pp. 593-599.
Ridsdale, J.A., Hendzel, M.J., Delcuve, G.P. & Davie, J.R. 1990, "Histone acetylation alters the capacity of the H1 histones to condense transcriptionally active/competent chromatin.", Journal of Biological Chemistry, vol. 265, no. 9, pp. 5150-5156.
Ringrose, L. & Paro, R. 2004, "Epigenetic regulation of cellular memory by the polycomb and trithorax group proteins", Annual Review of Genetics, vol. 38, pp. 413-443.
Risau, W., Sariola, H., Zerwes, H.G., Sasse, J., Ekblom, P., Kemler, R. & Doetschman, T. 1988, "Vasculogenesis and Angiogenesis in Embryonic-Stem-Cell-Derived Embryoid Bodies", Development, vol. 102, no. 3, pp. 471-478.
Robert, F., Pokholok, D.K., Hannett, N.M., Rinaldi, N.J., Chandy, M., Rolfe, A., Workman, J.L., Gifford, D.K. & Young, R.A. 2004, "Global position and recruitment of HATs and HDACs in the yeast genome", Molecular cell, vol. 16, no. 2, pp. 199-209.
Robertson, E., Bradley, A., Kuehn, M. & Evans, M. 1986, "Germ-Line Transmission of Genes Introduced into Cultured Pluripotential Cells by Retroviral Vector", Nature, vol. 323, no. 6087, pp. 445-448.
Robinson, P.J.J., An, W., Routh, A., Martino, F., Chapman, L., Roeder, R.G. & Rhodes, D. 2008, "30 nm Chromatin Fibre Decompaction Requires both H4-K16 Acetylation and Linker Histone Eviction", Journal of Molecular Biology, vol. 381, no. 4, pp. 816-825.
Rogers, M.B., Hosler, B.A. & Gudas, L.J. 1991, "Specific Expression of a Retinoic Acid-Regulated, Zinc-Finger Gene, Rex-1, in Preimplantation Embryos, Trophoblast and Spermatocytes", Development, vol. 113, no. 3, pp. 815-824.

288
Roh, T., Cuddapah, S., Cui, K. & Zhao, K. 2006, "The genomic landscape of histone modifications in human T cells", Proceedings of the National Academy of Sciences of the United States of America, vol. 103, no. 43, pp. 15782-15787.
Rohwedel, J., Maltsev, V., Bober, E., Arnold, H.H., Hescheler, J. & Wobus, A.M. 1994, "Muscle-Cell Differentiation of Embryonic Stem-Cells Reflects Myogenesis In-Vivo - Developmentally-Regulated Expression of Myogenic Determination Genes and Functional Expression of Ionic Currents", Developmental biology, vol. 164, no. 1, pp. 87-101.
Ropero, S., Fraga, M.F., Ballestar, E., Hamelin, R., Yamamoto, H., Boix-Chornet, M., Caballero, R., Alaminos, M., Setien, F., Paz, M.F., Herranz, M., Palacios, J., Arango, D., Orntoft, T.F., Aaltonen, L.A., Schwartz, S. & Esteller, M. 2006, "A truncating mutation of HDAC2 in human cancers confers resistance to histone deacetylase inhibition", Nature genetics, vol. 38, no. 5, pp. 566-569.
Rosner, M.H., Vigano, M.A., Ozato, K., Timmons, P.M., Poirier, F., Rigby, P.W.J. & Staudt, L.M. 1990, "A Pou-Domain Transcription Factor in Early Stem-Cells and Germ-Cells of the Mammalian Embryo", Nature, vol. 345, no. 6277, pp. 686-692.
Rossant, J. & Ofer, L. 1977, "Properties of Extra-Embryonic Ectoderm Isolated from Postimplantation Mouse Embryos", Journal of embryology and experimental morphology, vol. 39, no. JUN, pp. 183-194.
Roth, S.Y., Denu, J.M. & Allis, C.D. 2001, "Histone acetyltransferases", Annual Review of Biochemistry, vol. 70, pp. 81-120.
Rudolph, T., Yonezawa, M., Lein, S., Heidrich, K., Kubicek, S., Schaefer, C., Phalke, S., Walther, M., Schmidt, A., Jenuwein, T. & Reuter, G. 2007, "Heterochromatin formation in Drosophila is initiated through active removal of H3K4 methylation by the LSD1 homolog SU(VAR)3-3", Molecular cell, vol. 26, no. 1, pp. 103-115.
Rundlett, S.E., Carmen, A.A., Kobayashi, R., Bavykin, S., Turner, B.M. & Grunstein, M. 1996, "HDA1 and RPD3 are members of distinct yeast histone deacetylase complexes that regulate silencing and transcription", Proceedings of the National Academy of Sciences of the United States of America, vol. 93, no. 25, pp. 14503-14508.
Ruthenburg, A.J., Li, H., Patel, D.J. & Allis, C.D. 2007, "Multivalent engagement of chromatin modifications by linked binding modules", Nature Reviews Molecular Cell Biology, vol. 8, no. 12, pp. 983-994.
Saito, M. & Ishikawa, F. 2002, "The mCpG-binding domain of human MBD3 does not bind to mCpG but interacts with NuRD/Mi2 components HDAC1 and MTA2", Journal of Biological Chemistry, vol. 277, no. 38, pp. 35434-35439.
Saleque, S., Kim, J., Rooke, H.M. & Orkin, S.H. 2007, "Epigenetic regulation of hematopoietic differentiation by Gfi-1 and Gfi-1b is mediated by the cofactors CoREST and LSD1", Molecular cell, vol. 27, no. 4, pp. 562-572.
Santos-Rosa, H., Schneider, R., Bannister, A.J., Sherriff, J., Bernstein, B.E., Emre, N.C.T., Schreiber, S.L., Mellor, J. & Kouzarides, T. 2002, "Active genes are tri-methylated at K4 of histone H3", Nature, vol. 419, pp. 407-411.

289
Sato, N., Meijer, L., Skaltsounis, L., Greengard, P. & Brivanlou, A.H. 2004, "Maintenance of pluripotency in human and mouse embryonic stem cells through activation of Wnt signaling by a pharmacological GSK-3-specific inhibitor", Nature medicine, vol. 10, no. 1, pp. 55-63.
Sauer, B. 1987, "Functional Expression of the Cre-Lox Site-Specific Recombination System in the Yeast Saccharomyces-Cerevisiae", Molecular and cellular biology, vol. 7, no. 6, pp. 2087-2096.
Sauer, B. & Henderson, N. 1988, "Site-Specific Dna Recombination in Mammalian-Cells by the Cre Recombinase of Bacteriophage-P1", Proceedings of the National Academy of Sciences of the United States of America, vol. 85, no. 14, pp. 5166-5170.
Schaeper, U., Boyd, J.M., Verma, S., Uhlmann, E., Subramanian, T. & Chinadurai, G. 1995, "Molecular-Cloning and Characterization of a Cellular Phosphoprotein that Interacts with a Conserved C-Terminal Domain of Adenovirus E1a Involved in Negative Modulation of Oncogenic Transformation", Proceedings of the National Academy of Sciences of the United States of America, vol. 92, no. 23, pp. 10467-10471.
Schneider, R., Bannister, A.J., Myers, F.A., Thorne, A.W., Crane-Robinson, C. & Kouzarides, T. 2004, "Histone H3 lysine 4 methylation patterns in higher eukaryotic genes", Nature Cell Biology, vol. 6, pp. 73-77.
Schneider, J., Bajwa, P., Johnson, F.C., Bhaumik, S.R. & Shilatifard, A. 2006, "Rtt109 is required for proper H3K56 acetylation - A Chromatin mark associated with the elongating RNA polymerase II", Journal of Biological Chemistry, vol. 281, no. 49, pp. 37270-37274.
Schoenherr, C.J. & Anderson, D.J. 1995, "The neuron-restrictive silencer factor (NRSF): a coordinate repressor of multiple neuron-specific genes.", Science, vol. 267, no. 5202, pp. 1360-1363.
Schotta, G., Lachner, M., Sarma, K., Ebert, A., Sengupta, R., Reuter, G., Reinberg, D. & Jenuwein, T. 2004, "A silencing pathway to induce H3-K9 and H4-K20 trimethylation at constitutive heterochromatin", Genes & development, vol. 18, no. 11, pp. 1251-1262.
Schreiber, S.L. & Bernstein, B.E. 2002, "Signaling network model of chromatin", Cell, vol. 111, no. 6, pp. 771-778.
Schuettengruber, B., Chourrout, D., Vervoort, M., LeBlanc, B. & Cavalli, G. 2007, "Genome Regulation by Polycomb and Trithorax Proteins", Cell, vol. 128, no. 4, pp. 735-745.
Shahbazian, M.D. & Grunstein, M. 2007, "Functions of site-specific histone acerylation and deacetylation", Annual Review of Biochemistry, vol. 76, pp. 75-100.
Shechter, D., Dormann, H.L., Allis, C.D. & Hake, S.B. 2007, "Extraction, purification and analysis of histones", Nature Protocols, vol. 2, no. 6, pp. 1445-1457.
Shen, M.M. & Leder, P. 1992, "Leukemia Inhibitory Factor is Expressed by the Preimplantation Uterus and Selectively Blocks Primitive Ectoderm Formation Invitro", Proceedings of the National Academy of Sciences of the United States of America, vol. 89, no. 17, pp. 8240-8244.

290
Shen, X., Liu, Y., Hsu, Y., Fujiwara, Y., Kim, J., Mao, X., Yuan, G. & Orkin, S.H. 2008a, "EZH1 Mediates Methylation on Histone H3 Lysine 27 and Complements EZH2 in Maintaining Stem Cell Identity and Executing Pluripotency", Molecular cell, vol. 32, no. 4, pp. 491-502.
Shen, X., Liu, Y., Hsu, Y., Fujiwara, Y., Kim, J., Mao, X., Yuan, G. & Orkin, S.H. 2008b, "EZH1 Mediates Methylation on Histone H3 Lysine 27 and Complements EZH2 in Maintaining Stem Cell Identity and Executing Pluripotency", Molecular cell, vol. 32, no. 4, pp. 491-502.
Shi, Y., Lan, F., Matson, C., Mulligan, P., Whetstine, J.R., Cole, P.A., Casero, R.A. & Shi, Y. 2004, "Histone demethylation mediated by the nuclear amine oxidase homolog LSD1", Cell, vol. 119, pp. 941-953.
Shi, X.B., Hong, T., Walter, K.L., Ewalt, M., Michishita, E., Hung, T., Carney, D., Pena, P., Lan, F., Kaadige, M.R., Lacoste, N., Cayrou, C., Davrazou, F., Saha, A., Cairns, B.R., Ayer, D.E., Kutateladze, T.G., Shi, Y., Cote, J., Chua, K.F. & Gozani, O. 2006, "ING2 PHD domain links histone H3 lysine 4 methylation to active gene repression", Nature, vol. 442, no. 7098, pp. 96-99.
Shi, Y.J., Matson, C., Lan, F., Iwase, S., Baba, T. & Shi, Y. 2005, "Regulation of LSD1 histone demethylase activity by its associated factors", Molecular cell, vol. 19, no. 6, pp. 857-864.
Shi, Y.J., Sawada, J., Sui, G.C., Affar, E.B., Whetstine, J.R., Lan, F., Ogawa, H., Luke, M.P.S., Nakatani, Y. & Shi, Y. 2003, "Coordinated histone modifications mediated by a CtBP co-repressor complex", Nature, vol. 422, no. 6933, pp. 735-738.
Shi, Y. & Whetstine, J.R. 2007, "Dynamic regulation of histone lysine methylation by demethylases", Molecular cell, vol. 25, no. 1, pp. 1-14.
Shilatifard, A. 2006, "Chromatin modifications by methylation and ubiquitination: Implications in the regulation of gene expression", Annual Review of Biochemistry, vol. 75, pp. 243-269.
Shogren-Knaak, M., Ishii, H., Sun, J.M., Pazin, M.J., Davie, J.R. & Peterson, C.L. 2006, "Histone H4-K16 acetylation controls chromatin structure and protein interactions", Science, vol. 311, no. 5762, pp. 844-847.
Silverstein, R.A. & Ekwall, K. 2005, "Sin3: a flexible regulator of global gene expression and genome stability", Current genetics, vol. 47, no. 1, pp. 1-17.
Sims, R.J III & Reinberg, D. 2006, "Histone H3 Lys 4 methylation: caught in a bind?", Genes & development, vol. 20, no. 20, pp. 2779-2786.
Smith, A.G. 2001, "Embryo-derived stem cells: Of mice and men", Annual Review of Cell and Developmental Biology, vol. 17, pp. 435-462.
Smith, A.G., Heath, J.K., Donaldson, D.D., Wong, G.G., Moreau, J., Stahl, M. & Rogers, D. 1988, "Inhibition of Pluripotential Embryonic Stem-Cell Differentiation by Purified Polypeptides", Nature, vol. 336, no. 6200, pp. 688-690.
Smithies, O., Gregg, R.G., Boggs, S.S., Koralewski, M.A. & Kucherlapati, R.S. 1985, "Insertion of Dna-Sequences into the Human Chromosomal Beta-Globin Locus by Homologous Recombination", Nature, vol. 317, no. 6034, pp. 230-234.

291
Snow, M.H.L. 1977, "Gastrulation in Mouse - Growth and Regionalization of Epiblast", Journal of embryology and experimental morphology, vol. 42, no. DEC, pp. 293-303.
Solari, F., Bateman, A. & Ahringer, J. 1999, "The Caenorhabditis elegans genes egl-27 and egr-1 are similar to MTA1, a member of a chromatin regulatory complex, and are redundantly required for embryonic patterning", Development, vol. 126, no. 11, pp. 2483-2494.
Southern, E.M. 1975, "Detection of Specific Sequences among Dna Fragments Separated by Gel-Electrophoresis", Journal of Molecular Biology, vol. 98, no. 3, pp. 503-&.
Spies, N., Nielsen, C.B., Padgett, R.A. & Burge, C.B. 2009, "Biased Chromatin Signatures around Polyadenylation Sites and Exons", Molecular cell, vol. 36, no. 2, pp. 245-254.
Spivakov, M. & Fisher, A.G. 2007, "Epigenetic signatures of stem-cell identity", Nature Reviews Genetics, vol. 8, no. 4, pp. 263-271.
Stadtfeld, M., Nagaya, M., Utikal, J., Weir, G. & Hochedlinger, K. 2008, "Induced Pluripotent Stem Cells Generated Without Viral Integration", Science, vol. 322, no. 5903, pp. 945-949.
Sterner, D.E. & Berger, S.L. 2000, "Acetylation of histones and transcription-related factors", Microbiology and Molecular Biology Reviews, vol. 64, no. 2, pp. 435-+.
Stock, J.K., Giadrossi, S., Casanova, M., Brookes, E., Vidal, M., Koseki, H., Brockdorff, N., Fisher, A.G. & Pombo, A. 2007, "Ring1-mediated ubiquitination of H2A restrains poised RNA polymerase II at bivalent genes in mouse ES cells", Nature cell biology, vol. 9, no. 12, pp. 1428-U174.
Strahl, B. & Allis, C.D. 2000, "The language of covalent histone modifications", Nature, vol. 403, pp. 41-45.
Strumpf, D., Mao, C.A., Yamanaka, Y., Ralston, A., Chawengsaksophak, K., Beck, F. & Rossant, J. 2005, "Cdx2 is required for correct cell fate specification and differentiation of trophectoderm in the mouse blastocyst", Development, vol. 132, no. 9, pp. 2093-2102.
Stucki, M. & Jackson, S.P. 2004, "Tudor domains track down DNA breaks", Nature cell biology, vol. 6, no. 12, pp. 1150-1152.
Su, A.I., Wiltshire, T., Batalov, S., Lapp, H., Ching, K.A., Block, D., Zhang, J., Soden, R., Hayakawa, M., Kreiman, G., Cooke, M.P., Walker, J.R. & Hogenesch, J.B. 2004, "A gene atlas of the mouse and human protein-encoding transcriptomes", Proceedings of the National Academy of Sciences of the United States of America, vol. 101, no. 16, pp. 6062-6067.
Sun, G., Alzayady, K., Stewart, R., Ye, P., Yang, S., Li, W. & Shi, Y. 2010, "Histone Demethylase LSD1 Regulates Neural Stem Cell Proliferation", Molecular and cellular biology, vol. 30, no. 8, pp. 1997-2005.
Sun, J., Zhang, Q. & Schlick, T. 2005, "Electrostatic mechanism of nucleosomal array folding revealed by computer simulation", Proceedings of the National Academy of Sciences of the United States of America, vol. 102, no. 23, pp. 8180-8185.

292
Surani, M.A., Hayashi, K. & Hajkova, P. 2007, "Genetic and epigenetic regulators of pluripotency", Cell, vol. 128, no. 4, pp. 747-762.
Szutorisz, H., Canzonetta, C., Georgiou, A., Chow, C.M., Tora, L. & Dillon, N. 2005, "Formation of an active tissue-specific chromatin domain initiated by epigenetic marking at the embryonic stem cell stage", Molecular and cellular biology, vol. 25, no. 5, pp. 1804-1820.
Tachibana, M., Matsumura, Y., Fukuda, M., Kimura, H. & Shinkai, Y. 2008, "G9a/GLP complexes independently mediate H3K9 and DNA methylation to silence transcription", Embo Journal, vol. 27, no. 20, pp. 2681-2690.
Takahashi, K., Tanabe, K., Ohnuki, M., Narita, M., Ichisaka, T., Tomoda, K. & Yamanaka, S. 2007, "Induction of pluripotent stem cells from adult human fibroblasts by defined factors", Cell, vol. 131, no. 5, pp. 861-872.
Takahashi, K. & Yamanaka, S. 2006, "Induction of pluripotent stem cells from mouse embryonic and adult fibroblast cultures by defined factors", Cell, vol. 126, no. 4, pp. 663-676.
Talasz, H., Lindner, H.H., Sarg, B. & Helliger, W. 2005, "Histone H4-lysine 20 monomethylation is increased in promoter and coding regions of active genes and correlates with hyperacetylation", Journal of Biological Chemistry, vol. 280, no. 46, pp. 38814-38822.
Tam, P.P.L. & Behringer, R.R. 1997, "Mouse gastrulation: the formation of a mammalian body plan", Mechanisms of development, vol. 68, no. 1-2, pp. 3-25.
Tanay, A., O'Donnell, A.H., Damelin, M. & Bestor, T.H. 2007, "Hyperconserved CpG domains underlie Polycomb-binding sites", Proceedings of the National Academy of Sciences of the United States of America, vol. 104, no. 13, pp. 5521-5526.
Taplick, J., Kurtev, V., Kroboth, K., Posch, M., Lechner, T. & Seiser, C. 2001, "Homo-oligomerisation and nuclear localisation of mouse histone deacetylase 1", Journal of Molecular Biology, vol. 308, no. 1, pp. 27-38.
Taunton, J., Hassig, C.A. & Schreiber, S.L. 1996, "A mammalian histone deacetylase related to the yeast transcriptional regulator Rpd3p", Science, vol. 272, no. 5260, pp. 408-411.
Taverna, S.D., Li, H., Ruthenburg, A.J., Allis, C.D. & Patel, D.J. 2007, "How chromatin-binding modules interpret histone modifications: lessons from professional pocket pickers", Nature Structural & Molecular Biology, vol. 14, no. 11, pp. 1025-1040.
ten Berge, D., Koole, W., Fuerer, C., Fish, M., Eroglu, E. & Nusse, R. 2008, "Wnt signalling mediates self-organisation and axis formation in embryoid bodies.", Cell Stem Cell, vol. 3, no. 5, pp. 508-518.
Thomas, K.R. & Capecchi, M.R. 1987, "Site-Directed Mutagenesis by Gene Targeting in Mouse Embryo-Derived Stem-Cells", Cell, vol. 51, no. 3, pp. 503-512.
Thomson, M., Liu, S.J., Zou, L., Smith, Z., Meissner, A. & Ramanathan, S. 2011, "Pluripotency Factors in Embryonic Stem Cells Regulate Differentiation into Germ Layers", Cell, vol. 145, no. 6, pp. 875-889.

293
Tie, F., Prasad-Sinha, J., Birve, A., Rasmuson-Lestander, A. & Harte, P.J. 2003, "A 1-megadalton ESC/E(Z) complex from Drosophila that contains polycomblike and RPD3", Molecular and cellular biology, vol. 23, no. 9, pp. 3352-3362.
Tjeertes, J.V., Miller, K.M. & Jackson, S.P. 2009, "Screen for DNA-damage-responsive histone modifications identifies H3K9Ac and H3K56Ac in human cells", Embo Journal, vol. 28, no. 13, pp. 1878-1889.
Tong, J.K., Hassig, C.A., Schnitzler, G.R., Kingston, R.E. & Schreiber, S.L. 1998, "Chromatin deacetylation by an ATP-dependent nucleosome remodelling complex", Nature, vol. 395, no. 6705, pp. 917-921.
Torres-Padilla, M., Parfitt, D., Kouzarides, T. & Zernicka-Goetz, M. 2007, "Histone arginine methylation regulates pluripotency in the early mouse embryo", Nature, vol. 445, no. 7124, pp. 214-218.
Trewick, S.C., McLaughlin, P.J. & Allshire, R.C. 2005, "Methylation: lost in hydroxylation?", vol. 6, no. 4, pp. 320.
Tse, C., Sera, T., Wolffe, A.P. & Hansen, J.C. 1998, "Disruption of higher-order folding by core histone acetylation dramatically enhances transcription of nucleosomal arrays by RNA polymerase III", Molecular and cellular biology, vol. 18, no. 8, pp. 4629-4638.
Tsukada, Y., Fang, J., Erdjument-Bromage, H., Warren, M.E., Borchers, C.H., Tempst, P. & Zhang, Y. 2006, "Histone demethylation by a family of JmjC domain-containing proteins", Nature, vol. 439, no. 7078, pp. 811-816.
Turner, B.M. 2005, "Reading signals on the nucleosome with a new nomenclature for modified histones", Nature Structural & Molecular Biology, vol. 12, no. 2, pp. 110-112.
Turner, B.M. 2002, "Cellular memory and the histone code", Cell, vol. 111, no. 3, pp. 285-291.
Vakoc, C.R., Sachdeva, M.M., Wang, H. & Blobel, G.A. 2006, "Profile of histone lysine methylation across transcribed mammalian chromatin", Molecular and cellular biology, vol. 26, no. 24, pp. 9185-9195.
van den Berg, D.L., Snoek, T., Mullin, N.P., Yates, A., Bezstarosti.,K., Demmers, J., Chambers, I. & Poot, R.A. 2010 "An Oct4-centred protein interaction network in embryonic stem cells", Cell Stem Cell, vol. 6, no. 4, pp. 369-381.
van der Vlag, J. & Otte, A.P. 1999, "Transcriptional repression mediated by the human polycomb-group protein EED involves histone deacetylation", Nature genetics, vol. 23, no. 4, pp. 474-478.
van Leeuwen, F., Gafken, P.R. & Gottschling, D.E. 2002, "Dot1p modulates silencing in yeast by methylation of the nucleosome core", Cell, vol. 109, no. 6, pp. 745-756.
Vangelder, R., Vonzastrow, M., Yool, A., Dement, W., Barchas, J. & Eberwine, J. 1990, "Amplified Rna Synthesized from Limited Quantities of Heterogeneous Cdna Rid B-2247-2010", Proceedings of the National Academy of Sciences of the United States of America, vol. 87, no. 5, pp. 1663-1667.

294
Vidal, M. & Gaber, R.F. 1991, "Rpd3 Encodes a 2nd Factor Required to Achieve Maximum Positive and Negative Transcriptional States in Saccharomyces-Cerevisiae", Molecular and cellular biology, vol. 11, no. 12, pp. 6317-6327.
Vignali, M., Hassan, A.H., Neely, K.E., & Workman, J.L. 2000, "ATP-dependent chromatin-remodeling complexes", Molecular and Cellular Bioliogy, vol. 20, pp. 1899–1910.
Wang, J., Hevi, S., Kurash, J.K., Lei, H., Gay, F., Bajko, J., Su, H., Sun, W., Chang, H., Xu, G.L., Gaudet, F., Li, E. & Chen, T. 2009, "The lysine demethylase LSD1 (KDM1) is required for maintenance of global DNA methylation", Nature Genetics, vol. 41, pp. 125-129.
Wang, J.X., Scully, K., Zhu, X., Cai, L., Zhang, J., Prefontaine, G.G., Krones, A., Ohgi, K.A., Zhu, P., Garcia-Bassets, I., Liu, F., Taylor, H., Lozach, J., Jayes, F.L., Korach, K.S., Glass, C.K., Fu, X.D. & Rosenfeld, M.G. 2007, "Opposing LSD1 complexes function in developmental gene activation and repression programmes", Nature, vol. 446, pp. 882-887.
Wang, A., Kurdistani, S.K. & Grunstein, M. 2002, "Requirement of Hos2 histone deacetylase for gene activity in yeast", Science, vol. 298, no. 5597, pp. 1412-1414.
Wang, H.B., Cao, R., Xia, L., Erdjument-Bromage, H., Borchers, C., Tempst, P. & Zhang, Y. 2001, "Purification and functional characterization of a histone H3-lysine 4-specific methyltransferase", Molecular cell, vol. 8, no. 6, pp. 1207-1217.
Wang, J., Rao, S., Chu, J., Shen, X., Levasseur, D.N., Theunissen, T.W. & Orkin, S.H. 2006, "A protein interaction network for pluripotency of embryonic stem cells", Nature, vol. 444, no. 7117, pp. 364-368.
Wang, J., Scully, K., Zhu, X., Cai, L., Zhang, J., Prefontaine, G.G., Krones, A., Ohgi, K.A., Zhu, P., Garcia-Bassets, I., Liu, F., Taylor, H., Lozach, J., Jayes, F.L., Korach, K.S., Glass, C.K., Fu, X. & Rosenfeld, M.G. 2007, "Opposing LSD1 complexes function in developmental gene activation and repression programmes", Nature, vol. 446, no. 7138, pp. 882-887.
Wang, Y., Zhang, H., Chen, Y., Sun, Y., Yang, F., Yu, W., Liang, J., Sun, L., Yang, X., Shi, L., Li, R., Li, Y., Zhang, Y., Li, Q., Yi, X. & Shang, Y. 2009a, "LSD1 Is a Subunit of the NuRD Complex and Targets the Metastasis Programs in Breast Cancer", Cell, vol. 138, no. 4, pp. 660-672.
Wang, Z., Zang, C., Cui, K., Schones, D.E., Barski, A., Peng, W. & Zhao, K. 2009b, "Genome-wide Mapping of HATs and HDACs Reveals Distinct Functions in Active and Inactive Genes", Cell, vol. 138, no. 5, pp. 1019-1031.
Wernig, M., Meissner, A., Foreman, R., Brambrink, T., Ku, M., Hochedlinger, K., Bernstein, B.E. & Jaenisch, R. 2007, "In vitro reprogramming of fibroblasts into a pluripotent ES-cell-like state", Nature, vol. 448, no. 7151, pp. 318-324.
Whetstine, J.R., Nottke, A., Lan, F., Huarte, M., Smolikov, S., Chen, Z.Z., Spooner, E., Li, E., Zhang, G.Y., Colaiacovo, M. & Shi, Y. 2006, "Reversal of histone lysine trimethylation by the JMJD2 family of histone demethylases", Cell, vol. 125, no. 3, pp. 467-481.
Wiles, M.V. & Keller, G. 1991, "Multiple Hematopoietic Lineages Develop from Embryonic Stem (Es) Cells in Culture", Development, vol. 111, no. 2, pp. 259-&.

295
Wilkinson, D.G., Bhatt, S. & Herrmann, B.G. 1990, "Expression Pattern of the Mouse T-Gene and its Role in Mesoderm Formation", Nature, vol. 343, no. 6259, pp. 657-659.
Wissmann, M., Yin, N., Mueller, J.M., Greschik, H., Fodor, B.D., Jenuwein, T., Vogler, C., Schneider, R., Guenther, T., Buettner, R., Metzger, E. & Schuele, R. 2007, "Cooperative demethylation by JMJD2C and LSD1 promotes androgen receptor-dependent gene expression", Nature cell biology, vol. 9, no. 3, pp. 347-U176.
Wu, J. & Grunstein, M. 2000, "25 years after the nucleosomemodel: Chromatin modifications", Trends Biochem. Sci. vol. 25, pp. 619–623.
Wysocka, J., Swigut, T., Xiao, H., Milne, T.A., Kwon, S.Y., Landry, J., Kauer, M., Tackett, A.J., Chait, B.T., Badenhorst, P., Wu, C. & Allis, C.D. 2006, "A PHD finger of NURF couples histone H3 lysine 4 trimethylation with chromatin remodelling", Nature, vol. 442, no. 7098, pp. 86-90.
Xiao, B., Jing, C., Kelly, G., Walker, P.A., Muskett, F.W., Frenkiel, T.A., Martin, S.R., Sarma, K., Reinberg, D., Gamblin, S.J. & Wilson, J.R. 2005, "Specificity and mechanism of the histone methyltransferase Pr-Set7", Genes & development, vol. 19, no. 12, pp. 1444-1454.
Xie, J.X., Pierce, M., Gailus-Durner, V., Wagner, M., Winter, E. & Vershon, A.K. 1999, "Sum1 and Hst1 repress middle sporulation-specific gene expression during mitosis in Saccharomyces cerevisiae", Embo Journal, vol. 18, no. 22, pp. 6448-6454.
Xie, W., Song, C., Young, N.L., Sperling, A.S., Xu, F., Sridharan, R., Conway, A.E., Garcia, B.A., Plath, K., Clark, A.T. & Grunstein, M. 2009, "Histone H3 Lysine 56 Acetylation Is Linked to the Core Transcriptional Network in Human Embryonic Stem Cells", Molecular cell, vol. 33, no. 4, pp. 417-427.
Yamane, K., Toumazou, C., Tsukada, Y., Erdjument-Bromage, H., Tempst, P., Wong, J.M. & Zhang, Y. 2006, "JHDM2A, a JmjC-containing H3K9 dernethylase, facilitates transcription activation by androgen receptor", Cell, vol. 125, no. 3, pp. 483-495.
Yang, M., Culhane, J.C., Szewczuk, L.M., Gocke, C.B., Brautigam, C.A., Tomchick, D.R., Machius, M., Cole, P.A. & Yu, H. 2007, "Structural basis of histone demethylation by LSD1 revealed by suicide inactivation", Nature Structural & Molecular Biology, vol. 14, no. 6, pp. 535-539.
Yang, M., Gocke, C.B., Luo, X., Borek, D., Tomchick, D.R., Machius, M., Otwinowski, Z. & Yu, H. 2006, "Structural basis for CoREST-dependent demethylation of nucleosomes by the human LSD1 histone demethylase", Molecular cell, vol. 23, no. 3, pp. 377-387.
Yang, X. & Seto, E. 2008, "The Rpd3/Hda1 family of lysine deacetylases: from bacteria and yeast to mice and men", Nature Reviews Molecular Cell Biology, vol. 9, no. 3, pp. 206-218.
Ying, Q.L., Nichols, J., Chambers, I. & Smith, A. 2003, "BMP induction of Id proteins suppresses differentiation and sustains embryonic stem cell self-renewal in collaboration with STAT3", Cell, vol. 115, no. 3, pp. 281-292.
Ying, Q.L. & Smith, A.G. 2003, "Defined conditions for neural commitment and differentiation", Differentiation of Embryonic Stem Cells, vol. 365, pp. 327-+.

296
Ying, Q., Wray, J., Nichols, J., Batlle-Morera, L., Doble, B., Woodgett, J., Cohen, P. & Smith, A. 2008, "The ground state of embryonic stem cell self-renewal", Nature, vol. 453, no. 7194, pp. 519-U5.
You, A., Tong, J.K., Grozinger, C.M. & Schreiber, S.L. 2001, "CoREST is an integral component of the CoREST-human histone deacetylase complex", Proceedings of the National Academy of Sciences of the United States of America, vol. 98, no. 4, pp. 1454-1458.
Yu, J., Vodyanik, M.A., Smuga-Otto, K., Antosiewicz-Bourget, J., Frane, J.L., Tian, S., Nie, J., Jonsdottir, G.A., Ruotti, V., Stewart, R., Slukvin, I.I. & Thomson, J.A. 2007, "Induced pluripotent stem cell lines derived from human somatic cells", Science, vol. 318, no. 5858, pp. 1917-1920.
Zeng, L. & Zhou, M.M. 2002, "Bromodomain: an acetyl-lysine binding domain", FEBS letters, vol. 513, no. 1, pp. 124-128.
Zeng, P., Vakoc, C.R., Chen, Z., Blobel, G.A. & Berger, S.L. 2006, "In vivo dual cross-linking for identification of indirect DNA-associated proteins by chromatin immunoprecipitation", BioTechniques, vol. 41, no. 6, pp. 694-+.
Zhang, Y., LeRoy, G., Seelig, H.P., Lane, W.S. & Reinberg, D. 1998, " The dermatomyositis-specific autoantigen Mi2 is a component of a complex containing histone deacetylase and nucleosome remodeling activities", Cell, vol. 95, no. 2, pp. 279-289.
Zhang, Y. & Reinberg, D. 2001, "Transcription regulation by histone methylation: interplay between different covalent modifications of the core histone tails", Genes and Development, vol. 15, pp. 2343-2360.
Zhou, W., Zhu, P., Wang, J., Pascual, G., Ohgi, K.A., Lozach, J., Glass, C.K. & Rosenfeld, M.G. 2008, "Histione H2A monoubiquitination represses transcription by inhibiting RNA polymerase II transcriptional elongation", Molecular cell, vol. 29, no. 1, pp. 69-80.