understanding the relationship between technical and
TRANSCRIPT

Eastern Michigan UniversityDigitalCommons@EMU
Master's Theses and Doctoral Dissertations Master's Theses, and Doctoral Dissertations, andGraduate Capstone Projects
10-29-2015
Understanding the relationship between technicaland managerial factors and product innovation at aTier 1 engine component supplierCarmo Ribeiro
Follow this and additional works at: http://commons.emich.edu/theses
Part of the Science and Technology Studies Commons
This Open Access Dissertation is brought to you for free and open access by the Master's Theses, and Doctoral Dissertations, and Graduate CapstoneProjects at DigitalCommons@EMU. It has been accepted for inclusion in Master's Theses and Doctoral Dissertations by an authorized administrator ofDigitalCommons@EMU. For more information, please contact [email protected].
Recommended CitationRibeiro, Carmo, "Understanding the relationship between technical and managerial factors and product innovation at a Tier 1 enginecomponent supplier" (2015). Master's Theses and Doctoral Dissertations. 653.http://commons.emich.edu/theses/653

Understanding the Relationship Between Technical and Managerial Factors and Product
Innovation at a Tier 1 Engine Component Supplier
by
Carmo Ribeiro
Dissertation
Submitted to the College of Technology
In partial fulfillment of the requirements for the degree of
DOCTOR OF PHILOSOPHY
Technology
Concentration: Technology Management
Dissertation Committee:
Daniel Fields, Ph.D. (Dissertation Chair - School of Engineering Technology)
Carol Haddad, Ph.D. (School of Technology and Professional Services Management)
Muhammad Ahmed, Ph.D. (School of Engineering Technology)
Stephanie Newell, Ph.D. (Graduate School Representative)
October 29, 2015
Ypsilanti, Michigan

ii
Dedication
To “God”, who has been the source of my strength.
iii
Acknowledgments
I am so grateful for the help and support I received to complete this study. A sincere
thank-you goes to all my committee members, especially to Dr. Daniel Fields, who was
willing to step up and serve as committee chair, giving invaluable guidance. To Dr. Carol
Haddad, who unceasingly assisted in the literature-review process and provided a clear path
to find precious information that facilitated the formation of the conceptual framework for
the study. To Dr. Muhammad Ahmed, who always challenged me and raised relevant
questions, causing me to open up the scope of the study and make it more exciting. To Dr.
Stephanie Newell, who enlightened the study with valuable suggestions related to
management and innovation reasoning and provided effective support from the graduate
school perspective.
My deepest thank-you goes to the XYZ Tier 1 supplier organization. It includes the
Engineering and Technology Director, Human Resources Manager who paved the way by
allowing the administration of the confidential voluntary survey instrument in the technical
center; the Research Assistant, who supported me in collecting the data; and to all XYZ Tier
1 supplier firm employees who voluntarily participated and returned the survey instruments
in a timely manner.
An earnest thank-you is extended to each person who, one way or another,
contributed to making this research possible, especially to my family: from Amanda F.
Ribeiro and Gabriel F. Ribeiro, who have been my source of inspiration and who provided
nonstop positive feedback, to Mary J. Ribeiro, who was supportive and encouraged me in
difficult times, believing that I was able to overcome the challenges associated with the
research process.

iv
Finally, a candid thank-you is given to Lisa M. Walters, who supported me in the
editing process and provided valuable remarks in order to reach the final format.

v
Abstract
This study provided an assessment of the technical and managerial factors on the
development of successful innovative internal combustion engine (ICE) components at a
XYZ Tier 1 supplier firm. Further, factors related to regulations, component application, and
customer integration were identified and complement the study.
A deficiency has been identified in the literature in that most studies concentrate on
inter-firm innovation from the customer’s perspective within the supply-chain relationship.
While suppliers have increasingly become a source of innovation, very little is known about
specific ways in which innovation occurs at Tier 1 suppliers. The mechanisms by which
innovative ideas are created, fostered, and diffused in the development of ICE components
from the Tier 1 supplier perspective are not obvious. It is a multifaceted phenomenon
involving several predictor and criterion variables. Several critical factors were thought to
affect the development of innovative ICE components, including technical capabilities and
strength, management practices, customer integration, and government regulation. The
present study investigated the association of technical and managerial factors on the
development of innovative ICE components at a Tier 1 supplier. The contribution of this
research was that it was centered on the supplier perspective and investigated the specific
ways in which innovation occurs from inside out. This study responded to the call for more
empirical research related to innovation in the context of supply chains.
The primary purpose of this research was to investigate the association of technical
and managerial factors to the successful development of innovative ICE components at a Tier
1 supplier firm. This study determined the extent to which technical elements—meaning
technical capabilities, technical strength, and technical enabler (KMS) from the XYZ
vi
adaptive subsystem—were more or less relevant than managerial factors, specifically risk-
taking, future orientation, openness, creativity, and pro-activeness associated with the
managerial subsystem in the development of innovative components for internal combustion
engines at a XYZ Tier 1 supplier firm.
It was found that openness and future orientation are significant factors from
the managerial standpoint, and technical enabler and technical capability are significant from
the technical standpoint.

vii
Table of Contents
Chapter 1: Introduction and Background .................................................................................. 1
Statement of the Problem .............................................................................................. 2
Nature and Significance of the Problem ....................................................................... 2
Objective of the Research ............................................................................................. 4
Research Questions ....................................................................................................... 4
Delimitations and Limitations ...................................................................................... 5
Assumptions .................................................................................................................. 6
Definitions of Terms ..................................................................................................... 6
Chapter 2: Literature Review .................................................................................................. 10
Understanding Innovation ........................................................................................... 10
Socio-Technical Systems Theory and Innovation ...................................................... 12
The Technical Subsystem ........................................................................................... 13
The Managerial Subsystem ......................................................................................... 16
Government Regulations Affecting ICE Innovation .................................................. 20
Regulations Affecting Automotive Engine Technology ................................... 22
Regulations Affecting Truck Engine Technology ............................................. 24
Customer Integration .................................................................................................. 26
Experience .................................................................................................................. 29
Conceptual Framework ............................................................................................... 29
Chapter 3: Research Methodology and Design .................................................................... .35
Research Methodology ............................................................................................... 35
Research Design ......................................................................................................... 35

viii
Research Site ............................................................................................................... 37
Population and Sample ............................................................................................... 37
Human Subjects Approval ......................................................................................... 40
Data Collection ........................................................................................................... 40
Pilot Study ................................................................................................................... 42
Data Analysis .............................................................................................................. 43
Personnel ..................................................................................................................... 45
Resources .................................................................................................................... 45
Timeline ...................................................................................................................... 46
Summary ..................................................................................................................... 46
Chapter 4: Data Analysis ....................................................................................................... .47
Pilot Study Input ......................................................................................................... 47
Data Collection Process .............................................................................................. 49
Data Analysis Process ................................................................................................. 54
Demographics ............................................................................................................. 54
Cronbach’s Alpha –Scale Reliability T-Test .............................................................. 59
Research Questions Investigation ............................................................................... 62
Factor Analysis Structure ............................................................................................ 62
Overall Factors Analysis ................................................................................. 64
Technical Factor Analysis .............................................................................. 75
Managerial Factors Analysis .......................................................................... 87
Combined Factors ..................................................................................................... 115
Summary ................................................................................................................... 135
ix
Chapter 5: Conclusions and Recommendations .................................................................. .137
Introduction ............................................................................................................... 137
Summary ................................................................................................................... 137
Conclusion ................................................................................................................ 144
Recommendations for Future Research .................................................................... 149
Implications .............................................................................................................. 150
References ............................................................................................................................. 152
Appendices ............................................................................................................................ 161
Appendix A - Human Subjects Approval Request Form ......................................... 162
Appendix B - UHSRC Approval .............................................................................. 163
Appendix C - Survey Instrument Consent ................................................................ 164
Appendix D - Survey Instrument .............................................................................. 166
Appendix E - PI - Research Study Introduction ....................................................... 170
Appendix F - RA - Research Study Introduction ..................................................... 171
Appendix G - Detailed Demographics Charts .......................................................... 172
Appendix H - Detailed Cronbach’s Alpha Analysis ................................................. 173
Appendix I - Detailed One sample T-Test ................................................................ 179
Appendix J - T-Test comparison Technical Factor versus Managerial Factors. ...... 180
Appendix K - RQ 5 Detailed Charts – Strength Correlations Analysis.................... 181
Appendix L - RQ 6 Detailed Charts - Strength Correlation Analysis. ..................... 188
Appendix M - Overall Factor Total Variance Explained. ........................................ 197
Appendix N - Technical Factor Total Variance Explained. ..................................... 198
Appendix O - Managerial Factor Total Variance Explained. ................................... 199

x
Appendix P - Correlations of SDIC, GR, Customer Integration, TF and MF. ......... 200

xi
List of Tables
Table Page
1 Population and Sampling ................................................................................................... 39
2 Variable Types and Coding System Definition ................................................................. 44
3 Definition of Codes and Statistical Analysis Planning ...................................................... 45
4 Percentage of Returned Survey per Technical Center Site ................................................ 52
5 Variables Names, Labels, and Constructs ......................................................................... 54
6 Cronbach’s Alpha Analysis Plan ....................................................................................... 59
7 Cronbach’s Alpha Technical Factors ................................................................................. 60
8 Cronbach’s Alpha Managerial Factors .............................................................................. 61
9 Construct Reliability Summary ......................................................................................... 61
10 Factor 1 Overall Case Processing Summary .................................................................... 67
11 Factor 1 Overall Cronbach’s Alpha for Eight Items ........................................................ 67
12 Factor 1 Overall - Item Statistics ..................................................................................... 67
13 Factor 1 Overall - Item Total Statistics ........................................................................... 68
14 Factor 3 Overall Cases Processing Summary .................................................................. 69
15 Factor 3 Overall Cronbach’s Alpha for Five Items ......................................................... 69
16 Factor 3 Overall - Item Statistics ..................................................................................... 69
17 Factor 3 Overall - Item Total Statistics ............................................................................ 70
18 Factor 4 Overall Case Processing Summaries ................................................................. 70
19 Factor 4 Overall Cronbach’s Alpha for Four Items ......................................................... 70
20 Factor 4 Overall - Item Statistics ..................................................................................... 71
21 Factor 4 Overall - Item Total Statistics ............................................................................ 71

xii
22 Factor 5 Overall Case Processing Summaries ................................................................. 71
23 Factor 5 Overall Cronbach’s Alpha for Four Items ......................................................... 72
24 Factor 5 Overall - Item Statistics ..................................................................................... 72
25 Factor 5 Overall - Item Total Statistics ............................................................................ 72
26 Pearson Correlation Between the Transformed Overall Factors Variables and SDIC .... 75
27 TGC Factor 1 Overall Case Processing Summaries ........................................................ 77
28 TGC Factor 1 Cronbach’s Alpha for Four Items ............................................................. 77
29 TCG Factor 1 - Item Statistics ......................................................................................... 77
30 TGC Factor 1 - Item Total Statistics ................................................................................ 78
31 TGC Factor 2 Overall Case Processing Summaries ........................................................ 78
32 TGC Factor 2 Cronbach’s Alpha for Four Items ............................................................. 78
33 TCG Factor 2 - Item Statistics ......................................................................................... 79
34 TGC Factor 2 - Item Total Statistics ................................................................................ 79
35 TGC Factor 3 Overall Case Processing Summaries ........................................................ 79
36 TGC Factor 3 Cronbach’s Alpha for Four Items ............................................................. 80
37 TCG Factor 3 - Item Statistics ......................................................................................... 80
38 TCG Factor 3 - Item Total Statistics ................................................................................ 80
39 Pearson Correlation of the Transformed Five Factors and SDIC .................................... 83
40 Technical Factor Mean and Standard Deviations ............................................................ 84
41 MGC Factor 1 Case Processing Summaries .................................................................... 90
42 MGC Factor 1 Cronbach’s Alpha for Eleven Items ........................................................ 90
43 MCG Factor 1 - Item Statistics ........................................................................................ 90
44 MGC Factor 1 - Item Total Statistics ............................................................................... 91

xiii
45 MGC Factor 2 Case Processing Summaries .................................................................... 91
46 MGC Factor 2 Cronbach’s Alpha for Eleven Items ........................................................ 92
47 MCG Factor 2 - Item Statistics ........................................................................................ 92
48 MGC Factor 2 - Item Total Statistics ............................................................................... 92
49 MGC Factor 3 Case Processing Summaries .................................................................... 93
50 MGC Factor 3 Cronbach’s Alpha for Eleven Items ........................................................ 93
51 MCG Factor 3 - Item Statistics ........................................................................................ 93
52 MGC Factor 3 - Item Total Statistics ............................................................................... 94
53 Pearson Correlation of the Transformed Four Variables and SDIC ................................ 97
54 Descriptive Statistics for Managerial Items ..................................................................... 98
55 MF Factor 1 Case Processing Summaries ..................................................................... 100
56 MF Factor 1 Cronbach’s Alpha for Nine Items ............................................................. 100
57 MF Factor 1 - Item Statistics ......................................................................................... 100
58 MF Factor 1 - Item Total Statistics ............................................................................... 101
59 MF Factor 2 Case Processing Summaries ..................................................................... 101
60 MF Factor 2 Cronbach’s Alpha for Nine Items ............................................................. 102
61 MF Factor 2 - Item Statistics ......................................................................................... 102
62 MF Factor 2 - Item Total Statistics ................................................................................ 102
63 MF Factor 4 Case Processing Summaries ..................................................................... 103
64 MF Factor 4 Cronbach’s Alpha for Four Items ............................................................. 103
65 MF Factor 4 - Item Statistics ......................................................................................... 103
66 MF Factor 4 - Item Total Statistics ................................................................................ 104
67 Pearson Correlation of the Transformed Four Variables and SDIC .............................. 106
xiv
68 Higher Correlation Numbers from the Factor Analysis ................................................. 107
69 Higher Correlation Numbers from the Factor Analysis Percentage Explain SDIC ...... 108
70 Higher Individual Pearson Correlation with SDIC ........................................................ 109
71 Higher Individual Correlation Numbers Percentage Explain SDIC .............................. 110
72 PMix TFMF4 Cronbach’s Alpha ................................................................................... 110
73 PMix TFMF4 Item Statistics ......................................................................................... 111
74 Correlations of Individual PMixTFMF4 Items ............................................................. 111
75 Comparison Higher Individual Correlation Numbers Percentage Explain SDIC ......... 112
76 Significant Managerial Items ......................................................................................... 113
77 Significant Technical Items ........................................................................................... 114
78 Correlation Using Non-Optimized Factors from SPSS Factor Analysis ....................... 115
79 Paired Sample T-Test Group Statistics .......................................................................... 117
80 Paired Sample T-Test Group Statistics Including Missing Values ................................ 117
81 Paired Sample T-Test Correlations (Missing items) ...................................................... 119
82 Paired Sample T-Test Correlations (Replacing Missing Items by Smean) ................... 120
83 Paired Sample T-Test Comparison (Replacing Missing Items by Smean) ................... 120
84 One Sample T-Test Statistics ......................................................................................... 121
85 One Sample T-Test ........................................................................................................ 122
86 PACE Independent T-Test Group Statistics .................................................................. 123
87 Independent T-Test PACE Award ................................................................................. 123
88 Technical Factors Correlations with SUMSDIC ........................................................... 124
89 Managerial Factors Correlations with SUMSDIC ......................................................... 126
90 Customer Integration – Correlation Strength Analysis Plan ......................................... 127

xv
91 Summary Customer Integration – Correlation Strength Analysis Results .................... 128
92 Government Regulations - Correlation Strength Analysis Plan .................................... 129
93 Summary Government Regulations - Correlation Strength Analysis Results ............... 130
94 Summary of Demographic Correlations ........................................................................ 132
95 Product Application Frequency ..................................................................................... 133
96 Correlation Between the Engine Component Application and the SDIC ...................... 135

xvi
List of Figures
Figure Page
1 Concept Framework ........................................................................................................... 34
2 Research Framework ......................................................................................................... 36
3 Research Timeline ............................................................................................................. 46
4 Number of surveys instrument sent electronically per technical site ................................ 51
5 Survey instruments sent electronically versus returned per tech center site ...................... 52
6 Returned Survey Instrument - Demographics ................................................................... 57
7 Pie chart demographics distribution .................................................................................. 58
8 Cronbach’s Alpha rule of thumb Classification and Frequency ........................................ 62
9 Overall items - rotated pattern matrix for five factors ....................................................... 66
10 Scree plot for the overall 44 items ................................................................................... 73
11 Three-dimensional items distribution for overall items ................................................... 74
12 Technical, government regulations and customer integration items rotated pattern matrix
for four factors ........................................................................................................................ 76
13 Scree plot the technical items, government regulations and customer interaction .......... 81
14 Three-dimensional distribution of technical, GR, and customer interaction items ......... 82
15 Technical items rotated pattern matrix for three factors .................................................. 85
16 Scree plot for the 13 technical items ................................................................................ 86
17 Three-dimensional items distribution for the technical factors items .............................. 87
18 Pattern matrix for managerial items, GR, and customer interactions .............................. 89
19 Scree plot managerial, government regulations and customer interaction items ............ 95
20 Three-dimensional distribution for managerial, GR, and customer interaction items ..... 96

xvii
21 Managerial items - rotated pattern matrix for four factors .............................................. 99
22 Scree plot of managerial items versus calculated Eigenvalues ...................................... 104
23 Three-dimensional distribution for managerial items .................................................... 105
24 SDIC frequencies using the survey instrument scale ..................................................... 118
25 Technical factors frequency using the survey instrument scale .................................... 118
26 Managerial factors frequency using the survey instrument scale .................................. 119
27 Product Application chart comparison .......................................................................... 134
28 Pie chart employee product application ......................................................................... 134

Chapter 1: Introduction and Background
Engine components used by engine and vehicle manufacturers are essential to the
movement of people and products on a daily basis. The ICE –– the most common method of
powered transportation used in cars, trucks, boats, vessels, trains, and motorcycles –– makes
mobility possible. ICEs are subjected to tight government regulation and demand a high level
of technical complexity; thus they require a significant amount of development effort.
Growing concern about depletion of non-renewable energy sources and the effects of carbon
emissions on climate and public health have precipitated federal regulatory standards
promoting innovation initiatives among vehicle manufacturers and their suppliers. Whether
such innovations are incremental or radical, superior ICE performance is essential if vehicle
fuel efficiency and CO2 reduction are to be satisfactorily addressed. Improved performance
of ICE engines is feasible by using state-of-the-art engine components that allow engine
manufacturers to meet regulations and customer expectations. Hence, newly developed
engine components must be technically viable; must follow the development steps of
conceptualization, design, test, validation, and production; and they must be supplied at a
competitive price. In short, they must add value for customers while remaining profitable for
the organizations that make and use them.
Several factors are critical to the development of innovative ICE components,
including technical capabilities and strength, management practices, customer integration,
and government regulation. The present study seeks to investigate the association of
technical and managerial factors on the development of innovative ICE components at a Tier
1 supplier firm. According to Jean, Sinkovics, and Hiebaun (2014), “A supplier with more

2
successful innovations should have the ability to create a relationship with its customers that
contributes to its market and financial performance” (p. 104).
XYZ is a Tier 1 lead engine component global manufacturer, headquartered in
Michigan, which designs and produces multiple engine components for different engine
applications. The engine components supplied by XYZ must meet and/or exceed customers’
expectations while also conforming to regulations associated with internal combustion
engines.
Statement of the Problem
The association of technical and managerial factors on the successful development of
innovative ICE components at an XYZ Tier 1 supplier firm has not been fully investigated.
Nature and Significance of the Problem
Due to the nature of the business, an XYZ Tier 1 supplier must create differentiation
through innovation in order to meet customer expectations and government regulations.
Differentiation implies delivering value that is centered on innovative processes and
products. Although the mobility industry has encouraged value creation through supplier
involvement during the product development process, Jean, Sinkovics, and Hiebaum (2014)
have identified a deficiency in the literature addressing this particular industry dynamic: most
studies concentrate on inter-firm innovation from the customer’s perspective within the
supply-chain relationship: “While suppliers have increasingly become a source of product
and process innovation, very little is known about specific ways in which innovation occurs
at supplier firms” (Chung & Kim, 2003, as cited in Jean et al., 2014, p. 99). Even within the
supply-chain relationship, innovation tends to be examined from a customer’s point of view
(Azadeganand & Dooley, 2010; Hult, Hurley, Ciunipero, & Nichols, 2000, as cited in Jean et

3
al., 2014). The contribution of this research is that it will center on the supplier perspective
and investigate the specific ways in which innovation occurs from inside out, by taking an in-
depth look at the innovation practices at a single Tier 1 supplier firm. Successful
development of innovative products is a critical factor in the survival and growth of
companies (Schmidt et al., 2009, as cited in Espallardo, Castillo, & Orejuela, 2012). The
purpose of this study is to examine the influence of technical and managerial factors on the
development of successful innovative ICE components at a specific Tier 1 supplier firm. Roy
and Sivakumar (2010) have touched on the subject of innovation generation in upstream and
downstream business relationships, investigating the role of knowledge redundancy and
relational embeddedness on the generation of radical and incremental innovations in the
context of the challenging variables of complexity and globalization. Their study
substantiates opportunities for several research implications including the prospect to
investigate the “contingency effect of a firm’s internal factors” (p. 7) as an area for additional
research. Understanding the relationship between technical and managerial factors in product
innovation on a Tier 1 supplier firm will expand the knowledge base in this area. Therefore,
this study responds to the call for more empirical research related to innovation in the context
of automotive supply chains (Roy & Sivakumar, 2010; Roy et al., 2004, as cited in Jean et
al., 2014).
The mechanisms by which innovative ideas are created, fostered, and diffused in the
development of ICE components are not obvious. It is a multifaceted phenomenon, involving
several predictor and criterion variables. In order for the XYZ Tier 1 supplier firm to respond
positively to their customers’ needs, it is paramount to identify the influence of particular
subsystems contributing to the successful development of innovative products.

4
Objective of the Research
The primary objective of this research is to investigate the association of technical
and managerial factors to the successful development of innovative ICE components at an
XYZ Tier 1 supplier firm.
Research Questions
The study addressed the following research questions:
RQ1 – Is there a commonality of factors that are associated with successful
development of innovative ICE components at a Tier 1 supplier firm?
RQ2 – Are technical factors more or less relevant than managerial factors on the
successful development of innovative ICE components at a Tier 1 supplier firm?
RQ3 – What is the relationship between technical factors and the successful
development of innovative ICE components at a Tier 1 supplier firm?
A. technical capabilities
B. technical strength
C. technical enabler - knowledge management systems (KMS)
RQ4 – What is the relationship between managerial factors and the successful
development of innovative ICE components at Tier 1 supplier firm?
A. risk-taking
B. future orientation
C. openness
D. creativity
E. proactiveness
5
RQ5 – Does customer integration change the relationship between technical and/or
managerial factors’ contribution to the successful development of innovative ICE
components at a Tier 1 supplier firm?
RQ6 – Do government regulations change the relationship between technical and/or
managerial factors’ contribution on the successful development of innovative ICE
components at a Tier 1 supplier firm?
RQ 7 – Is there an association between demographics and the successful development
of innovative ICE components at a Tier 1 supplier firm?
A. age group
B. title
C. function
D. component application
E. component type
F. PACE
RQ 8 – Are the automotive applications more or less frequent than truck applications
on the successful development of innovative ICE components at a Tier 1 supplier firm?
Delimitations and Limitations
- The study focused on an XYZ Tier 1 component supplier firm for ICE.
- The study considered technical and managerial subsystems of an XYZ Tier 1
supplier firm.
- The study was limited to the recent successful development of innovative ICE
components.

6
- The study was limited by organization factors regarding innovative components of
the XYZ Tier 1 supplier firm.
Assumptions
- The Premier Automotive Suppliers’ Contribution to Excellence Award (PACE
Award) was a valid indicator of a successful innovative ICE component. PACE is an
automotive industry award that involves an extensive evaluation process including face-to-
face customers’ and suppliers’ assessments. Other automotive innovation technology awards
were cited in the literature, such as the DuPont award and Society Petroleum Engineers
(SPE) awards. The DuPont award is in its fourth year and is based on a sponsored survey
with “WardsAuto.” The SPE award is based on engineers’ nominations. It was determined
that both awards do not fit the present study because of their limited experience, exposure,
and population.
- The XYZ Tier 1 supplier firm used state-of-the-art product development
methodologies to transform innovative ideas into actual ICE components.
Definitions of Terms
Tier 1 Supplier Firm: “By definition, a tier 1 supplier is a manufacturer who provides
products directly to a company without dealing with a middleman or other manufacturers.
This is a simple definition. In reality, being identified as a Tier 1 Automotive Supplier
establishes both the credibility and commitment required by global automotive manufacturers
of their closest business partners trusted to design, develop, and validate the products and
systems incorporated into their vehicles” (http://www.tier1parts.com/what-is-tier-1-supplier).
Technical Factors: “Technical capabilities underlie a firm’s technological knowledge
and expertise, skills in developing technically superior products and ability to apply recent

7
technological developments” (Kyrgidou & Spyropoulou, 2013, p. 284), and technical
strength, which is a “firm’s ability to utilize and or acquire various technologies and apply
them to its new product development process” (Xu, Wu, & Cavusgil, 2013, p. 753). This
variable will be measured based on Matsuno, Zhu, and Rice (2014) and knowledge
management systems (KMS), which are used “for integrating knowledge within the context
of virtual teams” in the organization (Choi, Kang, & Lee, 2008, p. 744).
The Knowledge Management Systems (KMS): A technical enabler (TE) factor that
allows explicit knowledge to be created, stored, retrieved, and transferred to other members
of the organization. It is typically controlled by the Information Technology (IT) function in
the organization and facilitates the efficient and effective sharing of a firm’s intellectual
resources (Choi, 2008, p. 744).
Managerial Factors: “A multiple construct model that reflects the organization’s
predisposition to innovate, using elements coupled with organization risk-taking, future
orientation, openness, creativity, and pro activeness,” representing the managerial climate
and tendency to innovate, measures based on Ruvio, Shoham, Gadot, and Schwabsky (2014).
Internal Combustion Engine Components: Components used in internal combustion
engines – bearings, valves, ignition systems (spark plugs), liners, rings, aluminum pistons,
steel pistons, pins, sealing systems (gaskets), and system protection systems.
Innovation: “The development and implementation of new ideas by people who over
time engage in transactions with others within an institutional context”; “An invention or
creative idea does not become an innovation until it is implemented or institutionalized”
(Van De Ven, 1986, p. 604).

8
Internal Combustion Engine Component Innovation: Improvements made to ICE
components which are recognized as producing at least one of the following outcomes: new
product lines, cost reduction, repositioning, additions, and/or incremental/radical
improvements for the product or process. At an XYZ Tier 1 supplier firm, it refers to those
components that have won the PACE Award or have been finalists in that selection process.
PACE award: “The PACE Award (Premier Automotive Suppliers’ Contribution to
Excellence Award) is an annual award from Automotive News in collaboration with Ernst
and Young and Transportation Research Center Inc. (TRC Inc.) to celebrate innovation,
technological advancement and business performance among automotive suppliers”
(https://www.paceaward.com/index.cfm).
GHG: Gases in the atmosphere such as carbon dioxide, methane, nitrous oxide, water
vapor, and ozone that absorb and emit radiation within the thermal infrared range
(http://www.epa.gov/climatechange/ghgemissions/, 2012).
Carbon Foot print: The amount of greenhouse gases emissions caused by a person,
event, or organization (http://www.epa.gov/climatechange/ghgemissions/ind-calculator.html,
2013).
CAFÉ: The Corporate Average Fuel Economy (CAFE) includes regulations in the
United States, first enacted by the U.S. Congress in 1975. It is intended to improve the
average fuel economy of cars and light trucks (trucks, vans, and sport utility vehicles) sold in
the U.S.
ROI: Return on Investment is “a performance measure used to evaluate the efficiency
of an investment or to compare the efficiency of a number of different investments. To
calculate ROI, the benefit (return) of an investment is divided by the cost of the investment;

9
the result is expressed as a percentage or a ratio”
(http://www.investopedia.com/terms/r/returnoninvestment.asp).

10
Chapter 2: Literature Review and Conceptual Framework
In Chapter 1, the importance of innovation in the mobility industry was briefly
discussed. This literature review chapter focuses primarily on the nature of innovation; socio-
technical systems theory; successful innovation, particularly in the development of ICE
components; the significance of government regulations; and customer integration in the
innovation process. This discussion culminates in the presentation of a conceptual framework
for the study.
Understanding Innovation
The word innovation is broadly used to denote a positive action taken to develop or
improve a product or a production method. The definition of innovation goes back to 1939
when Schumpeter clarified that innovation refers to the commercial introduction of new
technologies, whereas invention refers to the creation of new technologies (Lin & Chen,
2014). The innovation process itself is defined as the practical implementation of an idea into
a new product or process (Datta, Reed, & Jessup, 2012). More specifically, it consists of a set
of combined activities that lead to new, marketable products and services or to new product
delivery systems (Burgleman et al., 2006, as cited in Datta et al., 2012, p. 35). Referring
specifically to products, Song and Chen (2014) state: “A product innovation is a new
technology or combination of technologies introduced commercially to meet a user or a
market need” (p. 3). The process used to bring an innovative idea to the market varies
depending on the organization. Verworn (2002) presented several process models used by
enterprises, describing how companies develop new products. Per Cooper (2002), a
formalized process should be considered, such as a new product development (NPD)
process—also referred to: the Stage Gate® Process—accepted as a key best-practice process

11
in the rules of innovation. Hence, new product development (NPD) is the complete
formalized process of bringing a new product to market, while innovation is related to a new
idea, device, or process, viewed as the application of better solutions that meet customer
needs.
Innovation may be either incremental or radical. Incremental innovation refers to the
process of delivering innovative products that depart only minimally from existing routines,
operations, and knowledge sets (Menguc, Auh, & Yannopoulos, 2013). Xu et al. (2013) add
that “incremental innovation involves creating new solutions based on existing technologies
which are often consistent with a firm’s core competence” (p. 754). The XYZ Tier 1 supplier
firm has established a portfolio of critical ICE components which represents their core
business competence. In certain circumstances, radical innovation is required, involving
more significant changes to a product or process (Espallardo et al., 2012). The development
of engine electrification is an example of radical innovation in the automotive and truck
market.
Innovation research is not new to the automotive industry. A study was published by
Hanawalt and Rouse (2010) investigating underlying factors associated with marketplace
success and failure of vehicles. The study identified 14 factors contributing to meeting (or
failing to meet) vehicle program goals, specifically styling, flexibility, lead time, technology,
horsepower, fuel economy, quality, target segment, price, safety, utility, corporate goals,
development process, and economy. Hanawalt and Rouse (2010) focused on the vehicle as
their unit of analysis but did not identify relationships with suppliers as one of the factors
responsible for vehicle innovation or failure. Machado (2013, p. 75) reported a case study of
automotive cast resin supplier and a machine supplier focusing on innovative management
12
development , demonstrating that the responsibility to innovate is no longer solely in the
hands of the research and development department but is a cultural approach in
organizations. The role of suppliers is central to the innovativeness of the power train engines
and vehicles.
Innovation is very important for Tier 1 supplier firms, whose engine components are
expected to operate as technological innovations, meaning each Tier 1 supplier is expected to
be the first company to develop and launch innovative products (Hultink & Robben, 1995).
Organizations must create conditions to innovate their products using available resources.
Menguc et al. (2013) defined product innovation capability as the ability to pool, link, and
transform several different types of resources and knowledge sets into creative solutions that
are distinct from existing practices (p. 315).
There are two main sources of ideas for innovation: internal and/or external. The
internal source of ideas for innovation relies on organizational creativity based on individuals
or teams working on a specific project guided by customer needs or using formalized tools
derived from specific research and development functions. The external source of ideas for
innovation is typically contracted by the organization looking for experts to address a given
problem (Datta et al., 2012). Regardless of the source of ideas, they need to be processed
through the adaptive or technical subsystem and supported by the managerial subsystem.
Socio-Technical Systems Theory and Innovation
A relatively recent development in the study of innovation is recognition of the role
of socio-technical systems (STS) theory in that process. Essentially, STS theory recognizes
the existence of two interdependent sub-systems – one that is technical and another that is
organizational and advocates an integrative, systems approach to change (Haddad, 2002;

13
Patnaykuni & Ruppel, 2010). Geels (2004) has recognized the importance of casting an STS
gaze to the entire process of product innovation. Baxter and Sommerville (2011) went so far
as to argue that “it is not enough to simply analyze a situation from a socio-technical
perspective and then explain this analysis to engineers. We must also suggest how socio-
technical analysis can be used constructively when developing and evolving systems” (p. 4).
At an XYZ Tier 1 supplier firm, the components of the socio-technical system are measured
by the extent to which innovations are successfully developed or adopted by said
organization, where innovation depends on the managerial subsystem’s impact on the
organizational climate toward innovation.
The Technical Subsystem
The technical subsystem consists of techniques, tools, devices, artifacts, methods,
procedures, and knowledge used to acquire information and transform it into outputs
(Passmore, 1988, as cited in Patnayakuni & Ruppell, 2010, p. 223). The technical subsystem
of an XYZ Tier 1 supplier firm is essential to the process of creating and delivering ICE
component innovations. An organization’s technical capabilities refer to the set of
technologies and technical skills enabling the organization to adjust to business opportunities
in a timely manner (Walsh & Linton, 2002, as cited in Kyrgidou & Spyropoulou, 2013).
According to Kyrgidou and Spyropoulou (2013), “Technical capabilities underlie a firm’s
technological knowledge and expertise, skills in developing technically superior products and
ability to apply recent technological developments” (p. 284). Technical knowledge and
expertise can come from inside or outside of the organization. Internal technical capability
consists of employees’ expertise and organizational knowledge documented in internal
standards and procedures. In a technical center site, tools used for design, simulation, and

14
validation tests are part of the internal capabilities. External technical capability is based on
sub supplier’s (Tier 2) knowledge, which involves primarily materials, processes, and tests.
In order to maintain competitiveness, Tier 1 suppliers must use state-of-the-art
technologies at all phases of production, beginning with Research and Development (R & D)
and continuing through concept design, product development, and the validation and
manufacturing of engine components. According to Kyrgidou and Spyropoulou (2013), the
umbrellas term “technical capabilities” refers to “the technologies and technical skills that
enable firms to adjust to business opportunities in a timely fashion” (p. 285). This enables
firms to develop technically superior products and improves their ability to utilize recent
technological developments. Lin (2014) adds that technological innovation capabilities
enhance firm performance and may be more likely to achieve a higher level of supply- chain
partnership.
An organization’s technical strength is a direct function of technological investment
made by organizations and refers to a “firm’s ability to utilize and or acquire various
technologies and apply to its new product development process (Xu et al., 2013, p. 753).
Matsuno et al. (2014) define technology strength as the measurement of an organization’s
technological investment in the development and deployment of new product innovation (p.
1108). Technical strength is used as an indicator of an organization’s productive investment
in R&D and is assessed through comparison against major competitors. The major
competitor of the XYZ Tier 1 supplier firm is well known in the mobility industry, although
it, of course, differs depending on the engine component. By looking at the level of
technology embedded in a final ICE component, it is possible for experts to estimate the level
of process complexity and investment made to create and manufacture such a component.

15
Technical strength can be also deduced by the number of patents granted by a
particular organization. Narin (1987) reported an excellent correlation (0.82) between expert
opinion of pharmaceutical company technical strength and the number of US patents granted
to the 17 companies studied. Xu et al. (2013) added that “A firm’s patent count is used as a
measure of its internal technological strength” (p. 756). The technological strength is
attributed to patents owned by the organization in addition to the amount of technical
knowledge stored that provides a major source of competitive advantage. Patent counts have
been used as a proxy for internal technical strength in the literature as they serve as measures
of knowledge and skills residing in a firm that are essential to innovation (Wuyts, Dutta, &
Stremersch, 2004). More specifically, in the automotive manufacturing industry, Lin and
Chen (2014) used US supplier patent databases to collect more than ten thousand patents
from 47 automotive suppliers to measure innovation quality and knowledge flow and
concluded that “variables constructed based on patent data are perfect indicators of
innovation quality” (Tseng & Wu, 2007, as cited in Lin & Chen, 2014, p. 134). It reinforces
the idea that technical strength can also be derived from the number of patents and the quality
of innovation associated with such patents.
The Knowledge Management System (KMS) is another technical factor considered in
this study. Choi (2008) found that the quality of KMS is a technical-enabler factor that allows
explicit knowledge to be created, stored, retrieved, and transferred to other members in the
organization. It is typically controlled by the Information Technology (IT) function in the
organization and facilitates the efficient and effective sharing of a firm’s intellectual
resources (p. 744). It involves the companies’ intranet systems, share sites database, and
technical information exchange among technical teams. Because KMS enables the technical

16
exchange between firms’ members, it facilitates the technological synergy process, defined
by Evanschitzky et al. (2012) as the “congruency between existing technological skills of the
firm and the technological skills needed to execute a new product initiative successfully” (p.
37). The combination of technical capabilities, technical strength, and technical enabler
(KMS) constructs represents the technical factors to be used in this study and will be
measured primarily based on the work of Kyrgidou et al. (2013), Matsuno et al. (2014), and
Choi et al. (2008).
The Managerial Subsystem
The managerial subsystem facilitates the organization’s process of being innovative
and embracing new ideas while minimizing the impact of passive or active innovation
resistance. Organizations must create conditions for sustainable innovation, as they need
innovation in order to serve customers and thus thrive in the marketplace. Innovation is no
longer just a survival strategy, but rather is the survival strategy of our time. An
organization’s managerial subsystem sets the organization’s disposition toward embracing
and supporting the kind of experimentation and creativity that result in new products or new
technological processes. In other words, the managerial subsystem determines the cultural
traits that either enhance or curtail an organization’s willingness to pursue new opportunities.
It has been recognized that the managerial subsystem is essential for balancing the equation
of knowledge and power in the sense that “it is engineers who have technical knowledge yet
managers have the power, including the power to support or inhibit innovative engineering”
(Foucault, as cited in Machado, 2013, p. 24). It has been recognized that “innovation strategy
is shaped by interaction between a firm’s managerial resources and its environment in an
evolutionary process of capability generation, selection, and retention” (Helfat & Peteraf,

17
2003, as cited in Saemundsson & Candi, 2014, p. 940). It is applicable to a Tier 1 supplier
firm that interacts with the environment and must respond to government regulations and
engine manufacturers’ specifications driven by customers’ mobility trends.
In this study, the managerial subsystem is conceived of as a multi-dimensional
construct that reflects the organization’s predisposition to innovate based on management
actions. The variables composing this construct are taken from Ruvio et al. (2013):
organizational risk-taking, future orientation, openness, creativity, and proactiveness. Risk-
taking is the act or fact of doing something that involves danger or risk in order to achieve a
goal. The variables constructs reported by Ruvio were focused on Chinese and Korean
automotive suppliers. One of the recommendations of Ruvio’s study was to expand the use of
developed variables constructs to different markets (e.g., US automotive supplies) in order to
gain exposure and validation of the constructs he had developed. In the case of XYZ Tier 1
supplier firm, it is the risk of investing resources in new ideas, such as new products,
technologies, processes, and application without knowing if a Return on Investment (ROI)
and organization profitability will be achieved. Ruvio et al. (2013) described risk taking as
“the disposition of management toward pursuing uncertain or risky decisions” (p. 1010).
Risk-taking is a relevant factor for a supplier because of increasing interdependency among
companies in growing global networks. In this particular study, we will examine whether the
XYZ Tier 1 supplier firm management believes and encourages employees to take risks
towards new innovative ideas, or if the opposite is true and they have the attitude to “play it
safe.” It is recognized in the research literature that “Risk-taking allows organizations to
allocate resources to projects with uncertain payoffs” (Song & Chen, 2014, p. 6) and that the
“process and outcome of the new product development tends to allocate resources to projects

18
with uncertain payoffs, thereby contributing to innovation and adaptation” (Miller, 1983, as
cited in Song & Chen, 2014).
In a general sense, future orientation is the readiness for change and the positioning of
the organization to work on changes. More specifically, it represents “the extent to which
managers has a clear sense of direction and share it with their employees” (Ruvio et al.,
2013, pp. 1008 & 1010). Normally organizations derive future potentialities predominantly
based on past experience and most of the time focus on what went wrong. One author
mentioned that “the disproportionate weight placed on expectations derived from past
experience has been blamed for a variety of problems associated with individual and
organizational creativity and change” (Ford, 2002, as cited in Ruvio et al., 2013, p. 1008). It
is necessary to find a balance considering a relative weight or ratio between the past
experience as a source of knowledge and visions imagining the future for the organization. In
this study we will investigate the extent to which managers have a clear sense of direction,
with realistic goals, and share it with the organization.
Openness indicates how open-minded a person is. The concept of openness is
expanded from individuals to an organizational environment by addressing how managers
support innovation and encourage its adoption rather than resistance to it (Ruvio et al., 2013,
p. 1010). Resistance to innovation can exist in passive or active mode. Talke and Heidenreich
(2014) reported that “passive innovation resistance is defined as resistance to the changes
imposed by innovation. It evolves from adopter-specific factors that form individuals’
personality-related inclination to resist changes and situation-specific factors that determine
their status quo satisfaction. These factors prompt individuals to resist innovations without
evaluating them” (p. 897). On the other hand, active innovation resistance is perceived as “an
19
attitudinal outcome that follows an unfavorable evaluation of a new product” (Talke &
Heidenreich, 2014, p. 898). For this Tier 1 supplier firm study, organizational openness
represents managers’ flexibility and adaptability in responding positively to new ideas and
changes in the organization with regard to ICE.
Creativity is defined by Woodman et al. (1993) as the “creation of a valuable useful
new product, service, idea, procedure or process by individuals working together in a
complex social system” (Woodman et al., 1993, as cited in Ruvio et al., 2013, p. 1006).
Creativity is also defined as the “creative thinking and behaviors of the organizations’
managers” (Woodman et al., 1993, as cited in Ruvio et al., 2013, p. 1010). Janakova (2012)
emphasized the importance of creativity affirming its capacity “to break conventions, the
usual way of thinking, to allow the development of a new vision, an idea or a product” (p.
96). From the organization perspective, creativity management “is used to describe
alternative approaches to business processes such as strategy development and organizational
change at the operational level, the development of new products and technological
innovations and their introduction into practice” (p. 110). In this study, creativity is related to
individuals or teams working in collaboration in technical center environments to develop
innovative ICE components.
Proactiveness refers to “an organization’s pursuit of business opportunities, whether
related or unrelated to its present product lines” (Ruvio et al., 2013, p. 1008). It is associated
with “aggressive posturing relative to competitors” (Knight, 1997, as cited in Leyla, 2014, p.
36) and includes “initiative and risk-taking, and competitive aggressiveness and boldness that
are reflected in activities of management (Antoncic, 2006, as cited in Leyla, 2014, p. 36). A
proactive attitude creates a sense of urgency to innovate becoming part of organizational

20
culture. In this study, the researcher will investigate managers’ constant initiatives to look for
new opportunities and introduction of new practices and techniques to improve the way
businesses are managed. Intuitively, the pace of innovation should be intrinsically associated
on how managers encourage proactiveness in the organization.
An assessment using the constructs from Ruvio et al. is unique from the Tier 1
supplier’s firm perspective, because of its business-environment peculiarities associated with
the mobility industry. In fact, the use of such constructs is one of Ruvio’s recommendations
in order to validate his model. The extent to which any or all of the five factors composing
the managerial construct influence product component innovation in a Tier 1 supplier firm is
not fully investigated by Ruvio et al. The mobility industry is a specific market, and due to
the nature of the business environment, risk-taking, for example, can have more significance
than creativity. At the same time, organizational openness might not be as relevant to
technological innovation as is a culture of proactivity. The constructs described facilitate
assess of the organizational climate, which is “the mechanism through which dynamic
capabilities produce new resource configurations, enabling the development and launching of
innovative products and services and, in turn, the achievement of a strong advantage position
and enhanced performance outcomes” (Kyrgidou & Spyropoulou, 2013, p. 283).
Government Regulations Affecting ICE Innovation
The impact of regulation on product innovation has been the subject of much
discussion in previous literature (Porter & van der Linde, 1995a, 1995b; Ashford et al., 1985;
as cited in Rennings & Rammer, 2009). Holweg (2014) and others have studied the ICE
pathway, attempting to predict technology changes required for keeping mobility running
under existing and forthcoming restrictions. The use of crude oil and natural gas maintain a

21
strong presence in ICE and can be expected to do so in the future, even with advances in
alternative fuels. Incremental improvements in engine efficiency will continue to be
significant for passenger cars and trucks for the next few decades.
Because of growing concerns about climate change associated with black
carbon/greenhouses gas emissions (NRC, 2013; The World Bank, 2014; Sewalk, 2010),
environmental regulations have become more pronounced. Stanton, Charlton, and
Vajapeyazula (2013) stated that “For the past two decades, engine manufacturers have
focused on reducing engine emissions to near zero levels while maintaining or slightly
increasing fuel efficiency. With the advent of the joint Environmental Protection Agency
(EPA) and National Highway Traffic Safety Administration (NHTSA) commercial vehicle
GHG regulations in 2011, the need to reduce fuel consumption has been explicitly linked to
the ability to manufacture and sell engines. Limitations have been set for CO2 and other
GHGs from pick-up trucks and vans, vocational vehicles and semi-tractors, and heavy-duty
diesel engines. It is instructive to review the elements of the U.S. GHG regulation and their
impact on engine technology selection and deployment” (p. 1758). New definitions have
been developed such as “Eco-innovation,” which is the production, application, or
exploitation of a good service production process, organizational structure, or management or
business method that is novel to the firm or user and which results, throughout its life cycle,
in a reduction of environmental risk, pollution, and the negative impacts of resources use
(including energy use) compared to relevant alternatives (Kemp & Pearson, 2007 as cited in
Horbach, Rammer, & Rennings, 2011).
Depending on the organization and/or the market, regulations can be either beneficial
or detrimental from the company/performance point of view. Both arguments have been
22
made, often at the same time. For example, Rennings and Rammer (2010) stated that
“regulatory-driven environmental innovation may impose additional costs to firms and lower
their profits; on the other hand, eco-innovators could profit from lower uncertainty” (p. 3).
The effect of regulation on vehicle engine innovation depends on regulatory stringency that
measures the degree to which a regulation requires compliance leading to circumventive or,
alternatively, to compliance innovation (Stewart, 2010). According to Stewart (2010),
circumventive innovation occurs when the scope of regulation is narrow and the resulting
innovation allows the firms to escape the regulatory constraints. Compliance innovation
occurs when the scope of the regulation is broad and the resulting product and process
innovations remain within the scope of the regulation. (p. 2). The latter are the typical types
of requirements enforced in the development and use of ICE in the mobility industry.
The push for “zero emissions” vehicles advances electrical automotive technology
innovation and has a significant impact on strategic direction, causing organizations to
refocus their resources and priorities. Tier 1 supplier firms sometimes get involved in
regulatory matters secondhand, after the subject has been discussed internally by engine or
vehicle manufacturers. Currently, regulation is pushing engine manufacturers and suppliers
to develop products with lightweight materials, downsize the ICE, and potentially transition
away from carbon-based fuel (Holweg, 2014). This study seeks to determine, from a Tier 1
supplier firm perspective, whether and how government regulations moderate the
relationship between the technical and managerial factors on the development of innovative
ICE components at a Tier 1 supplier firm.
Regulations Affecting Automotive Engine Technology. Automotive engine
production is impacted by federal mandates. The National Highway Traffic Safety

23
Administration (NHTSA), the Corporate Average Fuel Economy (CAFE) program, and the
EPA’s light-duty vehicle GHG emissions program all set high efficiency standards for
passenger cars, light-duty trucks, and medium-duty passenger vehicles
(www.afdc.energy.gov, retrieved 10/9/2014.) These standards include policies that provide
some flexibility to manufacturers, including affording the ability for manufacturers to earn
credits for producing alternative fuel vehicles. Nevertheless, government regulations force
auto manufacturers to dramatically improve the fuel economy of cars built in the U.S. By
Model Year (MY) 2025, new vehicles must meet an estimated combined average fuel
economy of 48.7 to 49.7 miles per gallon or higher. The regulatory process is ongoing, with
updated changes to the final rules provided by Federal Register. In total, the National
Highway Traffic Safety Administration’s national program to improve fuel economy and
reduction CO2 emissions will save consumers more than $1.7 trillion at the gas pump and
reduce U.S. oil consumption by 12 billion barrels (www.whitehouse.gov, retrieved
10/9/2014; 2017-25 CAFÉ final rule – Federal Register Vol.77 n# 199 10/15/2012).
From the May 2010 CAFÉ regulations, both fuel economy and the associated GHG
emissions from vehicles will be regulated by standards, and EPA was given authority to
regulate GHG emissions (McConnell, 2013). The GHG emissions from the new vehicles
must fall by close to 40% for cars by the 2025 model year compared to current levels. The
first phase of the standards affects the MY 2012–2016 vehicles and requires fuel economy
for cars in terms of miles per gallon to increase by over 4% per year. For cars, the
requirement was 27.5 mpg in 2010, and the average across manufacturers with no change in
vehicle size mix is predicted to be 37.8 mpg in 2016, or about 37% higher. Light-duty truck

24
standards have always been lower: they were 23.5 mpg in 2010, and under the Phase 1 rules,
they are forecast to increase by 23% by 2016.
The second phase of the joint rulemaking requires continually improving fuel
economy and reduced CO2 levels for MY 2017 to 2025 vehicles (improvements of roughly 3
to 4% a year). Under these rules, cars are predicted to reach an average of 55 mpg by 2025, a
48% increase over 2016, and truck fuel economy is predicted to improve by an average of
33% over that time period. For cars as a whole, fuel economy will be required to almost
double from 2010 to 2025, meaning CO2 levels will decline by close to 45%. These new
reformed CAFE rules would require fuel use and CO2 emissions by light-duty vehicles to fall
by close to 40% over the next 15 years (Federal Register). These new NHTSA, CAFÉ, and
EPA CO2 rules are directed at the fuel efficiencies of vehicles sold by manufacturers
(McConnell, 2013). The expected reduction levels in fuel efficiencies and CO2 reduction
require significant development of innovative ideas in order for internal combustion engines
to meet the required target.
As part of the global warming reduction process, the California Air Resources Board
passed, by a unanimous vote, the largest greenhouse gas emissions plan in the United States.
The plan was designed to cause a 15% decrease in emissions over the next 12 years (starting
in 2011), with the goal to lower emissions to 1990 levels (CEPA, 2008). The State of
California, which represents the world’s eighth largest economy and accounts for 1.5% of
global emissions, will be implementing widespread regulations impacting operations of
transportation, building construction, waste disposal, and electricity generation, among other
waste-producing industries (Forcechange, 2013).

25
Regulations Affecting Truck Engine Technology. The legal imperative toward the
reduction of carbon dioxide (CO2) emissions represents a significant shift in industry
mandates, affecting 50% of companies involved in over-the-road transportation by 2015 and
80% by 2020 (Piecyk, 2010). The Environmental Protection Agency (EPA) estimates that
fossil-fuel-burning transportation vehicles account for 33% of total U.S. CO2 emissions
(Caruso, 2009). The limitations on hydrocarbons (HC) and nitrogen oxides (NOx) emitted
from combustion engines have been strengthened ten times in the past ten years. The EPA
and the Department of Transportation’s (DOT) National Highway Traffic Safety
Administration proposed the first-ever program to reduce Greenhouse Gas (GHG) emissions
and to improve fuel efficiency of medium and heavy-duty trucks.
According to the DOT and the EPA, the proposed rules would create a strong,
comprehensive national program addressing heavy-duty trucks, which is designed to address
the urgent and closely intertwined challenges of dependence on oil, energy security, and
global climate change. The heavy-duty truck sector included in this EPA-DOT joint proposal
accounts for nearly six percent of all U.S. GHG emissions (EPA, 2011). Per Haugen (2014),
carbon dioxide represents 84% of greenhouse gas emissions, while the transportation sector
represents 28% of greenhouse gas emissions recorded in 2013, and medium/HD trucks
account for 22% of total transportation. Clearly, any climate solution must include
transportation (p. 5).
In order to meet the requirements mandated by the emissions and fuel-consumption-
limits legislation, several initiatives are under consideration that would enhance technologies
applied to ICE components. Some technologies are focused on the outside of the ICE, using
after-treatment control units such as Exhaust Gas Recirculation (EGR) and waste recovery.

26
Other technologies are focused on the inside of the ICE, looking for better ways to manage
the energy generated by optimizing the combustion systems. The use of inside cylinder
power train engine technologies imply a more aggressive and demanding environment for the
power train components, whereas friction reduction and higher engine efficiency are critical
contributing factors to achieving the regulatory targets.
Potential new fuel technologies such as natural gas, flex fuel conversions, hybrid
fuels, bio-diesel, and clean diesel applications have also been considered for heavy-duty
trucks (EPA, 2011). The use of alternative fuels is one component of the engine
manufacturers’ set of strategies for attaining the 55% target for Break Thermal Efficiency
(Johnson, 2014). Regardless of the types of alternative fuels chosen, however, public policy
measures may be needed to help overcome potential deployment obstacles associated with
fuel production and fuel availability at pumps across the nation (Steenberghen, 2012). Thus
engine manufacturers, along with their suppliers, need to develop products that will satisfy
the efficiency and environmental regulations imposed by federal and state governments.
Customer Integration
Supplier involvement in the process of new product development has been renowned
as a critical component in the successful innovation. According to Fitzgerald (2003),
“Innovation can only be sustained if customers have proper philosophies, attitudes,
infrastructure and system that enable effective collaboration between supplier and customer.
Savvy supplier organizations deliberately allocate their innovation resource to those
customers with the greatest probability for commercial success” (p. 2). Through inter-firm
cooperation, particularly in the automotive industry (Jean et al., 2014, p. 102), supplier
involvement facilitates a mutually cooperative relationship with customers (in this case,

27
Original Equipment Managers) to enhance innovation, product quality, and financial
performance at all levels of manufacture. Menguc et al. (2013) believe that innovative results
are optimized when product design is informed by a broad range of professional expertise,
including best practices for customer integration (p. 325). With respect to the process of
customer integration, Jean et al. (2014, p. 101) report that best results might not effectively
depend on shifts in customer supplier relationships. Lau, Tang, & Yam (2010) argued that
“customers can generate new ideas by articulating their unmet needs and can co-design new
products with manufacturers to satisfy these needs” (Afuah & Bahram, 1995; Baldwin &
Hanel, 2003; Bozdogan et al., 1998; Chesbrough, 2003; Freel, 2002; Peterson, Handfield, &
Ragatz, 2003; von Hippel, 2005, as cited in Lau et al., 2010, p. 762).
Within the auto industry, customer integration depends on the degree to which a firm
collaborates with its customers to improve visibility and enable joint planning. The customer
has been monitored between engine manufacturers and Tier 1 suppliers firm through the use
of agreeable internal measuring tools or industry quality standards guidelines. Customer
integration is recognized as an important issue; in fact, the Society of Automotive Analysts
(SAA) publishes annual reports monitoring the customer and production subsystems to
provide a better understanding of market expectations, thereby giving suppliers the
opportunity to be more responsive to customer needs (Afshan, 2013). Stock and Zacharias
(2013) added that “customer integration relates to the degree to which customers are
involved in the company’s value-creating process”; this integration process helps “companies
better meet needs and protects against high failure rates of newly introduced innovative
products” (p. 521-22), while indirectly impacting customer satisfaction through its
relationship to product innovation performance. On the other hand, the positive expected

28
results might not be effective depending on the differences in customer-supplier relationship,
as reported by Jean et al. (2014). Negative customer responses toward innovation may occur,
as customers can perceive it as significant, requiring major behavioral changes. Sometimes
the response is negative because it leads to limited strategic choices in product development
or customers who are not engaged in working towards innovation (Lau et al., 2010).
Another aspect discussed in the literature is the supplier’s invention quality based on
the use of automaker’s knowledge. Lin and Chen (2014) pointed that the existent
technological linkage between the automaker and suppliers is critical for the knowledge
transfer and necessary for suppliers. It improves suppliers’ current innovations and promotes
“proper knowledge sources for exploitative inventions” (p.130). Tighter technological links
are expected between automakers and Tier 1 suppliers, predominantly in cases of
components with complex interface interaction between components involved in the system.
Automakers’ and suppliers’ interaction is vastly explored in the literature but not investigated
in the context of technical and managerial subsystem from the supplier’s perspective.
In this present study we will consider customer integration as a moderating variable,
expanding on Stock, Totzauer, and Zacharias’s (2014) study, by making allowances for
different predictor variables that might affect variable relationships. The technical and
managerial factors will be adopted as predictor variables and will be tested as to the strength
of customer integration in contrast to the strength of leadership and Human Resources
practices as reported by Stock et al. (p. 929). A company’s innovation capacity includes
elements of both a technical and a managerial nature, providing a broader perspective on
factors that might influence the overall innovation process. We expect this study to further
document that, in the case of the Tier 1 supplier, customer integration/interaction, from both

29
a technical and/or a managerial standpoint, will strengthen innovation output. The literature
is thus far consistent, stating that “customer integration increases the quality and benefits of
new products that then better meet customer need” (Stock & Zacharias, 2013, p. 523).
Experience
By definition, experience in the business context is the act of observing,
encountering, or undergoing things generally as they occur in the course of time. In this
study, the year’s engineers, managers, and directors who have been working in ICE
components-development activities will be considered. Regarding experience, Carbonell
(2006) reported that experience and small teams have shown to speed up technologically
simple projects. Experience requires time. The experience or lack thereof with relatively new
innovative technology can present unforeseen challenges that impact the product
development. Per Grant (2014), research and development, technology, and intellectual
property in the form of patents, copyrights, trade secrets, and trademarks composes the
technological part of resources that can be applied to product development. It constitutes
firms’ intangible experience in dealing with product innovation. The ICE component-
development cycle time can be on the order of three to five years, which is in the same
magnitude of typical employee rotation observed in US organizations. Employees’
relationships for companies in the U.S. average about four years; in Europe the time is
longer, eight years plus. In this study we will be able to determine the age group of
employees working on XYZ Tier 1 supplier firm.
Conceptual Framework
The Tier 1 supplier firm referred to in this study as XYZ is a large global
organization; XYZ is composed of multiple subsystems, which receive input from other

30
subsystems and turn input into output for use by still other subsystems. The subsystems in the
XYZ Tier 1 supplier firm resemble patterns of activities clustered in different departments
and functions. Katz and Kahn (1978) identified at least five subsystems that are important to
the success of any business organization: the production subsystem, the maintenance
subsystem, the adaptive subsystem, the supportive subsystem, and the managerial subsystem.
The present study will concentrate on two subsystems: the adaptive subsystem—also referred
to in this study as the technical subsystem—which serves to obtain information about
opportunities and problems in the environment and then respond with innovations that enable
the organization to adapt, and also on the managerial subsystem, which directs activities of
other subsystems in the organization. The adaptive subsystem and managerial subsystem
represents the social and technical components of the XYZ Tier 1 supplier firm relevant to
the socio-technical systems theory. Per Geels (2004), the socio-technical systems encompass
production, diffusion, and use of technology, applicable to the XYZ Tier 1 supplier firm
innovation capacity and the use of innovative components. The distinction of how the
adaptive/technical subsystem and managerial subsystem relates to the innovation process in
the Tier 1 supplier firm is the novelty of the proposed study.
Amagoh (2008) described systems theory as “a set of two or more elements where:
the behavior of each element has an effect on the behavior of the whole; the behavior of
elements and their effects on the whole are independent” (p. 2). The contribution of each
element associated with adaptive subsystems (technical nature) and/or managerial sub-
systems (management nature) determines the XYZ Tier 1 supplier firm innovation capacity.
The elements considered in this study will be of a technical nature, when associated with the
adaptive subsystem, and of a managerial nature, when associated with the organizational

31
climate and willingness to innovate. The foremost objective of this study is to determine the
extent to which the elements associated with organizational innovation capacity will affect
the transformation of ideas into a successful ICE component innovation.
Another aspect of the study involves the implications of the theory of innovation in
the context of customer integration. “The common foundations through which theorists study
the adoption and development of new ideas is commonly known as Innovation Theory or
Diffusion Theory” and “its fundamental form is defined as the process by which an
innovation is adopted and gains acceptance by individuals or members of a community”
(Kuo, Wei, Hu, & Yang, 2013, p. 57). Notwithstanding the benefits associated with customer
integrations, research suggests that collaborative initiatives between customer and supplier
can lead to internal and/or external technology information exchange but be repressed by
behavioral constraints. Given the customer(s) in question––in this case the engine
manufacturer and the respective Tier 1 supplier firm, two independent socio-technical
systems––socio-technical systems theory is a very useful framework for analyzing how a
work organization functions, contributing to design processes that will create new socio-
technical systems (Eason, 2008).
The relationship between the customers’ and suppliers’ socio-technical systems
depends on social, technical, and environmental interactions and can be limited by behavioral
constraints created prior to, or during, the socio-technical exchange process. Customer
integration can be seen as a “virtual entity” (new socio-technical system) merged from
technical systems across customer and supplier. It can be impacted by behavior constraints
between the two individual socio-technical systems as they depend upon people’s
cooperation and type of tools and technology used to get their collective work done and

32
environment changes associated with open system (Eason, 2008, p. 2). The process of co-
creating and deploying new innovative engine components involves knowledge transfer
between customer and supplier as part of the customer integration.
Ruvio et al.’s study, addressing organizational managerial subsystems focusing on
systems that are specific to the context of organization climate/willingness to innovate,
suggests that the theoretical model using multidimensional constructs for measuring
organizational innovativeness should be examined in different organizations, exploring
relationships in particular fields of application (Ruvio et al., 2014). The present study intends
to apply the suggested theoretical model exploring how the organizational
climate/willingness to innovate influences successful development of innovative ICE
components developed by a Tier 1 supplier firm in the U.S. The idea is to test recently
proposed theories to verify the importance of the five dimensions construct (risk-taking,
future orientation, openness, creativity, and proactiveness) in the engine component supplier
turf. The original constructs will be slightly modified to serve the ICE component field of
application; testing to what extent the five constructs (risk-taking, future orientation,
openness, creativity, and proactiveness) are used to achieve organizational innovation leading
to successful engine component innovations. As engine component production is a specific
industry, the level of influence of each construct would be, in principle, unique to this distinct
context. Previous studies were focused on mid-managers’ participation, limiting the
population involved in the innovation process. In contrast, this study will consider a broader
scope of key participants in the innovative process. This study also includes technical
constructs related to adaptive subsystems of the organization, such as technical strength and

33
technical capabilities. The integration of technical constructs and managerial constructs will
provide a broader perspective than that provided within previous studies.
Moreover, this study seeks to understand to what extent government regulations
influence the relationship between organizational innovation factors and successful ICE
component innovation. The impact of technology regulation is regularly seen in new product
releases and is ambiguous, but the influence of regulation in moderating the strength of
relationships between organization innovation factors and the successful development of
innovative ICE component during the “innovation process” in the supplier environment is not
well documented in the literature.
In addition, this study intends to understand to what extent customer integration––in
this case the engine or vehicle manufacturers’ customer integration––moderates the
relationship between the XYZ Tier 1 supplier firm innovation factors and successful
development of innovative component for ICE. The present study seeks to investigate
customer integration in order to specifically address its moderating effect, from the supplier’s
perspective, on the relationship between organizational innovation factors and the successful
development of innovative ICE components. Control variables related to engine application
for the automotive or truck market were used to study whether the relationship between
organizational innovation capacity and successful innovation of combustion engine
components becomes weaker or stronger depending on the product application.
A Factor Analysis (FA) was used in order to access the contribution of the factors
described above and will be discussed in more detail in Chapter 4. FA has been used to
identify groups of factors, so that a common theme can be identified to determine the nature
and contribution of combinations of factors (Fields, 1991). In the present study FA was used

34
to explore and understand patterns of correlation among variables associated with successful
development of innovative components (SDIC) for ICE at the XYZ Tier 1 supplier firm.
Anecdotally, we know that it is important for internal engine component suppliers to
provide innovative products or processes to engine manufacturers, allowing manufacturers to
keep up with regulations and consumer demands. Determining which critical elements of
organization innovation factors would most productively influence the innovation component
outcome will benefit supplier growth and sustainability in the marketplace. Figure 1 depicts
the conceptual framework.
Figure 1. Conceptual framework.
35
Chapter 3: Research Methodology and Design
In Chapter 2, literature relevant to innovation, socio-technical systems theory,
regulation of the vehicle industry, and supply-chain integration in product development was
reviewed, leading to the presentation of a conceptual framework for the present study. This
Research Methodology and Design chapter focuses primarily on the methodology, the
research framework adopted, and the population and tools used to collect data. This
culminated with a proposal of how the data collected would be analyzed.
Research Methodology
A descriptive survey research methodology was used in this effort to capture a
fleeting moment in time. The use of a descriptive statistical survey coupled with correlation
studies were implemented in this research effort. The descriptive method is well suited to
situations where data are gathered from events that are occurring or have already occurred
(Leedy & Ormrod, 2010, p. 182), such as the successful development of innovative
components for the ICE engines.
Research Design
This study seeks to determine the extent to which technical elements, meaning
technical capabilities, technical strength, and technical enabler (KMS) from the XYZ Tier 1
supplier firm adaptive subsystem were more or less relevant than managerial factors—
specifically risk-taking, future orientation, openness, creativity, and proactiveness associated
with the managerial subsystem in the development of innovative components for internal
combustion engines at the XYZ Tier 1 supplier firm.

36
Figure 2 shows the research framework. The development of innovative internal
engine components was the criterion variable that can be associated with variables
representing technical factors (technical capabilities, technical strength and technical enabler
- KMS) and managerial factors (based on a five-dimensional construct: risk-taking, future
orientation, and creativity, openness, and proactiveness). Customer integration and
government regulations were included in the study as moderating variables that might
influence the relationship between technical and managerial factors and ICE component
innovation at a Tier 1 supplier firm. Auto and truck engine component applications and the
PACE award recognition were included as part of the demographics, and its association with
successful development of innovative component was investigated.
Figure 2. Research framework.

37
Research Site
The XYZ Tier 1 supplier firm serving as the research site has several technical
centers globally working in tandem on state-of-the art ICE components. Four technical
centers located in the U.S. were invited to participate in this study. The technical centers are
ISO/TS 16949 certified entities, engaged in the development of innovative ICE engine
components used in autos, trucks, and other applications. The components associated with
this study were pistons (aluminum/steel), engine bearings, valve seats and guides, ignition
systems (spark plugs), liners, rings, pins, and sealing systems (gaskets).
The research sites had more than 250 employees, primarily in technical and
managerial functions such as engineering directors, engineering managers, supervisors,
engineers, and technicians. Approximately 80% of the workforce (200 employees) works on
the development of new components or improvements of existing components used in ICE.
One of the attributes of these particular XYZ Tier 1 supplier technical sites was the
interaction with Original Equipment Manufacturer customers (engine or vehicle
manufacturers). The technical sites used in this research were equipped to design, simulate,
test, and validate components in their laboratories or in conjunction with customers, while
working with unique materials, processes, coatings, and/or new designs.
Population and Sample
The population for this study consisted of 202 employees involved in activities
related to product development located at XYZ Tier 1 Supplier’s North America technical
centers who worked engine components for ICE. This workforce has been regularly involved
in activities related to management, engineering, and product development, representing the
strata of technical and managerial employees within the XYZ Tier 1 supplier firm.

38
The entire relevant technical and managerial population was asked to participate in a
survey which provided adequate representation from directors, managers, research and
development engineering, application engineering, test and validation teams, product and
process engineering, design and analysis, and project management disciplines from the XYZ
Tier 1 supplier firm working on the creation, development, validation, and release of new
innovative components for ICE. The idea to survey the entire population expands on Leedy
and Ormrod’s (2010) recommendation for cases of “N” less than 100 (p. 213).
The participants were identified in conjunction with the technical center Human
Resources Manager (HRM), to avoid surveying employees who were not part of the technical
and managerial strata.
As mentioned in Chapter 1, the PACE award was used as one of the criteria to
identify successful innovative components that were developed and recognized by the
industry as innovative components from lists published on the PACE website. The typical
lead time for ICE truck engines, from design to market, had been about three years; hence,
considering a statement in the survey instrument that incorporated recent innovative
components assured that relevant ideas related to ICE were included in the present study.
The PACE website depicted different types of components and/or processes selected
for recognition. The XYZ Tier 1 supplier firm had components such as bearings, valve seats
and guides, ignition system (spark plugs), rings and liners, aluminum pistons, steel pistons,
pins, sealing systems (gaskets), system protection, and others included on the list. It was
found that a minimum of three participants from each innovative product/process component
above returned the survey instrument and covered the main development functions: design,
analysis, testing, application, product development, and management. The participants were
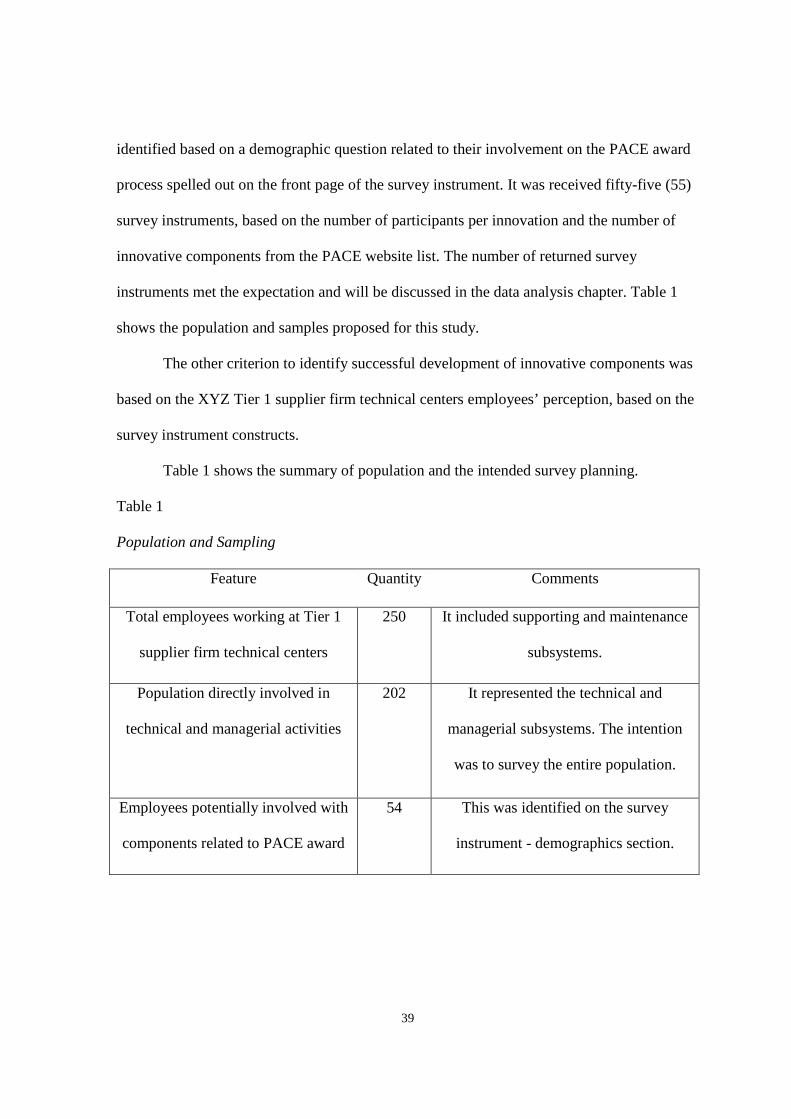
39
identified based on a demographic question related to their involvement on the PACE award
process spelled out on the front page of the survey instrument. It was received fifty-five (55)
survey instruments, based on the number of participants per innovation and the number of
innovative components from the PACE website list. The number of returned survey
instruments met the expectation and will be discussed in the data analysis chapter. Table 1
shows the population and samples proposed for this study.
The other criterion to identify successful development of innovative components was
based on the XYZ Tier 1 supplier firm technical centers employees’ perception, based on the
survey instrument constructs.
Table 1 shows the summary of population and the intended survey planning.
Table 1
Population and Sampling
Feature Quantity Comments
Total employees working at Tier 1
supplier firm technical centers
250 It included supporting and maintenance
subsystems.
Population directly involved in
technical and managerial activities
202 It represented the technical and
managerial subsystems. The intention
was to survey the entire population.
Employees potentially involved with
components related to PACE award
54 This was identified on the survey
instrument - demographics section.

40
Human Subjects Approval
The Principal Investigator (PI) and his professor completed the required online
training module sponsored by Collaborative Institutional Training Initiative (CITI) and then
applied to the University Human Subjects Review Committee for approval of the proposed
research project by using IRBNet in accordance with the procedures outlined on the Office of
Research Development’s Research Compliance website:
http://www.emich.edu/ord/compliance/compliance_subdir/human.html
Data Collection
The Human Resources Manager (HRM) of XYZ Tier 1 supplier firm was contacted
in order to explain the research objectives and the study outcome and to obtain approval to
administer the survey in the technical center facilities. After approval was granted, a survey
instrument as shown in Appendices B and C was sent to participants. The construct labels
were removed and the question items were randomly ordered before the survey instrument
was sent to participants. The study participants were asked to complete the survey
independent of their level of involvement in the corresponding component development and
regardless of the particular development process in which they were involved. This
facilitated having broader data, thereby avoiding bias related to a specific function or
department.
The survey instrument was based on existing literature, slightly modified for this
study, collecting the XYZ Tier 1 supplier employees’ perspectives on the successful
development of innovative component for ICEs. The survey instrument used the following
construct references:

41
Technology Capability – The scale was based on Kyrgidou and Spyropoulou (2013),
with slight adaptation to the XYZ Tier 1 supplier firm that works on ICE components. The
scale used six items and a five-point Likert response scale and aimed to investigate the
technical expertise, development, and knowledge in the organization in the past five years.
Technology Strength – The scale was based on Matsuno, Zhu, and Rice (2014) with
slight adaptation to the XYZ Tier 1 supplier firm that works on ICE components. The scale
used three items and a five-point Likert response scale (reflective construct) and aimed to
investigate the organization investment perception on research and development and
intellectual property in comparison with competitors.
Technology Enabler (KMS) – The scale was based on Choi et al. (2008) with slight
adaptation to the XYZ Tier 1 supplier firm that works on ICE components. The scale used
four items and a five-point Likert response scale aimed to investigate the organization’s
perception on knowledge management systems in use, involving the intranet, share sites, and
design exchange information among technical members.
Managerial Innovation Climate – The scale was based on Ruvio, Shoham, Gadot, and
Schwabsky (2014) with slight adaptation to the XYZ Tier 1 supplier firm that works on ICE
components. The scale used a multiple constructs model, consisting of risk-taking, future
orientation, openness, creativity, and proactiveness. Risk-taking (RT) was a five-item section
(combining items from Song & Chen, 2014) and used a five-point Likert response scale.
Future orientation (FO) used four items and a five-point Liker response scale; Openness
(OP), four items and a five-point Likert response scale; Creativity (CR), seven items and a
five-point Liker response scale; Proactiveness (PA), four items and a five-point Likert
response scale.

42
Government Regulations (GR) was a new three-item section with a five-point Likert
response scale.
Customer integration – This scale was based on Stock and Zacharias (2013) with
slight adaptation to the XYZ Tier 1 supplier firm that works on ICE components including
the truck and auto markets. That scale used three items and a five-point Likert response scale
and aimed to investigate integration, discussions, influence, and value creation processes
with the customer.
The scale measuring “successful ICE component innovation” was based on
Benedetto (1999) and Song and Chen (2014), with slight adaptations for applicability to a
XYZ Tier 1 supplier firm that works on engine components for the truck and auto markets.
The scale used four items and a five-point Likert response scale and aimed to investigate the
success of market entrance, customer integration, and comparison with competitors.
In order to prevent bias, the survey instrument was sent electronically to the
participants by a nominated Research Assistant (RA) selected in conjunction with the Human
Resources Manager (HRM) of the XYZ Tier 1 supplier firm.
Pilot Study
A pilot run of the survey instrument was conducted with five respondents who were
part of the intended population as described in Table 1. The purpose of the pilot study was to
review the survey instrument for clarity and completeness and to determine whether
respondents would have difficulty in answering the survey questions. The pilot study also
helped to check for validity. According to Leedy and Ormrod (2012), “The validity of a
measurement instrument is the extent to which the instrument measures what is it actually
intended to measure” (p. 92).

43
Data Analysis
The influence of technical and managerial factors on the successful development of
innovative ICE components for the XYZ Tier 1 supplier firm was determined by processing
the data collected using the survey instruments. An analysis of demographic data was
performed in order to identify the employees who had been involved in the innovative
component. The subsequent analysis was divided into five steps:
1. Perform Cronbach Alpha test for scale reliability.
2. Use descriptive statistics to check for central tendencies and outliers within
the instrument responses of the multi-group data collected and perform several
factor analysis interactions to determine latent variables that are significant
and had a reasonable correlation with the successful development of
innovative components.
3. Perform t-test analysis to check for significance of means between key
variables.
4. Perform multiple correlations to examine association between variables.
5. Perform correlations analysis including additional variables to see changes on
the correlation strength.
All statistical calculations were conducted using the IBM SPSS Statistics 22
computer software.
Two tables were created to support the data analysis. Table 2 depicts the variable
types and the adopted coding system used during the analysis. Table 3 shows the statistical
approach used to address the proposed research questions.

44
Table 2
Variable Types and Coding System Definition
Coding Plan Variable Types and Constructs Elements Items Initial Code
Predictor Variable
Successful Development Innovative Component SDIC Total 4 SUMSDIC
Predictor Variable Technology Factors TF Total 13 SUMTF
Technology Capabilities 6 TC Technology Strength 3 TS Technology Enabler (KMS) 4 TE
Managerial Factors MF Total 24 SUMMF Risk-Taking 5 RT Future Orientation 4 FO Openess 4 OP Creativity 7 CR Pro-Activeness 4 PA
Demographics Age Group AG Title AG Function EF Component Application AA/TA Component Type CT PACE PACE
Government Regulations GR Total 3 SUMGR Customer Integration CI Total 3 SUMCI

45
Table 3
Definition of Codes and Statistical Analysis Planning
Research Questions Sub- questions Codes Analysis Tool Comments RQ1- Is there a commonality of factors that is associated with successful development of innovative ICE components at a Tier 1 supplier firm?
SDICsum Factor Analysis consider individual and combined factors
RQ2 – Are technical factors more or less relevant than managerial factors on the successful development of ICE components at a Tier 1 supplier firm?
TFsum; MFsum "t" test compare using
"Xsum"RQ3 – What is the relationship between technical factors and the successful development of innovative ICE component firm?
TFsum ; SDICsum Pearson Correlation use "Xsum"
A. technical capabilities TC; SDICsum Pearson Correlation B. technical strength TS; SDICsum Pearson Correlation C. techncal enabler (KMS) TE; SDICsum Pearson Correlation
RQ4 – What is the relationship between managerial factors and the successful development of innovative ICE component firm?
MFsum ; SDICsum
Pearson Correlation use "Xsum"
A. risk-taking RT; SDICsum Pearson Correlation B. future orientation FO; SDICsum Pearson Correlation C. openness OP; SDICsum Pearson Correlation D. creativity CR; SDICsum Pearson Correlation E. proactiveness PA; SDICsum Pearson Correlation
RQ5 – Does customer integration change the relationship between technical and/or managerial factors contribution on the successful development of ICE components at a Tier 1 supplier firm?
CI; TFsum; MFsum; SDICsum
multiple correlation
RQ6 – Do government regulations change the relationship between technical and/or managerial factors contribution on the successful development of ICE components at a Tier 1 supplier firm?
GR; TFsum; MFsum; SDICsum
multiple correlation
RQ7- Is there an association between demographics and the successful development of innovative ICE components at a Tier 1 supplier firm?
SDICsum multiple correlation
A.age group AG; SDICsum Pearson Correlation B.title TI; SDICsum scatter plots, parettoC.function FU; SDICsum scatter plots, parettoD.component application CA; SDICsum scatter plots, parettoE. component type CT; SDICsum scatter plots, parettoF. PACE PACE;SDICsum Pearson Correlation
RQ8- Are the auto applications more or less frequent than truck applications on the successful development of ICE components at a Tier 1 supplier firm?
AA/TA/SDICsum histogramsnote innovations used in both applications
Personnel
This study was coordinated by the researcher who was responsible for the majority of
the tasks. The academic advisor, research method representative, and dissertation chair were
involved to guide the process. The Tier 1 supplier participants completed the personnel
required for the study.
Resources
Resources required were limited to the researcher’s time, computer, computer
software, statistical analysis tools, word processing programs, printer and printer suppliers,

46
postage, access to an email programs, the dissertation committee’s time, and participants’
time.
Timeline
The proposed timeline, including the pre-dissertation phase took approximately 15
months for completion as shown in Figure 3.
Figure 3. Research timeline.
Summary
Chapter 3 described the research design, methodologies, and analyses used in the
study. These included a definition of population and sampling, variables of the study, survey
instrument description, data collection approach, and data analysis methods proposed.

47
Chapter 4: Data Collection
In Chapter 3, research design, methodologies, and analyses used in the study were
described. These included a definition of population and sampling, variables of the study,
survey instrument description, data collection approach, and data analysis methods. The data
collection process, the process used to analyze the data and the thought process used to
address the research question are described in this chapter.
Pilot Study Input
The literature recommends performing a pilot study before the final version of the
survey instrument is released for data collection. The pilot study helps to determine if the
items considered in the survey instrument yield the information needed for the study (Simon,
2011). In this study, the pilot survey aimed to find out if the instructions were
comprehensible and if the engineers and managers were skilled in the procedures, to verify
the survey wording, and to improve the reliability and validity of the results. The pilot study
was administered in person to a small group, which was proven to be a common approach to
obtain valuable feedback before starting the formal data collection. As Sampson (2004)
noted, “While pilots can be used to refine research instruments such as questionnaires and
interview schedules, they have greater use still in ethnographic approaches to data collection
in foreshadowing research problems and questions, in highlighting gaps and wastage in data
collection, and in considering broader and highly significant issues such as research validity
ethics representation, and researcher health and safety” (Sampson, 2004, as cited in Marshall,
2011, p. 95). The approach suggested in the pilot study fits the present research, as we were
looking for ways to close potential gaps and wastage in the data collection prior
administering the survey instruments.

48
The pilot study participants have been working with the XYZ Tier 1 supplier firm
company between 3 and 20 years. They were asked to provide feedback and suggestions
regarding the clarity of the survey statements, which could facilitate understanding and
interpretation of people completing the survey in the data collection process. In the pilot
study, the researcher asked respondents to check for comprehensibility, statement
simplification, statement rewording, statement combinations, statement expansion, and so on.
As part of the feedback process, an additional definition regarding the Knowledge
Management System (KMS) was suggested and introduced in the instrument survey to
improve statements’ comprehensiveness.
The survey instrument was also revised to improve the definition of employees’
functions as suggested by the Tier 1 supplier firm’s Human Resources Manager. In addition,
it was recommended by the XYZ Human Resources Manager to include the director’s title as
part of the management team and make small changes on the demographics, formatting, and
clarification of statements (e.g., definition of Knowledge Management System – KMS).
Another suggestion incorporated as a result of the pilot study was a better definition of job
functions and classifications that better fit the organizational structure of this particular Tier 1
supplier firm. The elimination of years of experience was suggested by University Human
Subjects and incorporated as part of the pilot revision, because it would lead to the
identification of respondents in the case of cross tabulation of the data. The revisions also
included changes to improve descriptions and statements’ terms, using similar wording
across the survey instrument to facilitate the reading and understanding.
In summary, the Human Resources representative provided feedback mainly related
to employees’ job functions; the piston technology employees provided feedback focused on

49
the clarity and combination of survey statements; the piston development process manager
and design and analysis provided feedback suggesting statements’ simplification, and the
application engineer employee provided feedback related to consistency among the
statements and rewording a few questions for comprehension. As a result of the pilot survey,
the number of survey instrument statements (questions) increased from 44 to 47.
Lastly, the University Human Subjects Committee recommended nominating a
Research Assistant (RA) to perform the data collection, distributing and collecting the survey
instrument. This action was to prevent prospective interference of the PI on the survey
results. As part of the process, the RA was instructed to keep the collected data confidential
and to delete any personal information prior to recording into a password-protected data file.
Data Collection Process
Several meetings were conducted with the Tier 1 supplier firm Human Resources
Manager (HRM) to explain the purpose of the study and ask for help in facilitating the
internal data collection process. The HRM provided a list of employees (directors, managers,
and engineering functions) that the PI and RA would find relevant to the study. Four
technical centers located in Southeast Michigan were included in the present study. A total of
202 employees working on technical and managerial functions of the XYZ Tier 1 supplier
firm were asked to participate voluntarily on the survey process. After meeting with the
Director of Engineering and Technology and Human Resources Manager of the technical
center, it was decided to send an initial internal email notification to potential participants
informing them of the general purpose of the study and indicating that a survey instrument
form and consent form should be presented to them by an RA. The internal email also
provided brief information about the study’s objective. The full text of this internal email
50
correspondence is shown in Appendix D. A week later the RA made contact with the same
population, initially via email, using an internal email as shown in Appendix E, and then in
person, asking them to sign the consent form either electronically or via a hard copy and
complete the survey instrument. Three weeks were given to complete and return the survey
instruments to the RA.
Figure 4 shows the number of survey instruments sent electronically by the RA to the
individual technical center site. Eleven survey instruments were sent to technical center site
“A,” which works with the core components of power train engine. A total of 37 survey
instruments were sent to technical center site “B,” with employees who work more in
peripheral components to the power train. A total of 121 survey instruments were sent to
technical center site “C,” the largest Michigan tech center, with employees who develop a
wide variety of ICE components for the power train engine, and 33 survey instruments were
sent to technical center site “D” with employees who work in broader components accounts
related to internal combustion engine. The employees who work on the support subsystem in
the Tier 1 supplier firm, including support technicians and those dealing with maintenance
tasks, human resources activities, information technology, and general assistant activities
were not asked to participate, since they were not directly involved in product
creation/innovation and development process of components for ICE.

51
11
37
121
33
sit e A
sit e B
sit e C
sit e D
Figure 4. Number of surveys instrument sent electronically per technical site.
A total of 55 survey instruments and consent forms were returned. Forty-eight were
returned in electronic format and 7 in printed format. Figure 5 and Table 4 illustrate the
percentage of returned surveys. Figure 5 illustrates the number of surveys sent per technical
sites “A” through “D” versus the number of surveys returned per technical site. Table 4
shows the percentage of returned survey instruments per technical center.

52
0
50
100
150
200
site A site B site C site D Total
N# Survey
SentAnswered
Figure 5. Survey instruments sent electronically versus returned per tech center site.
Table 4
Percentage of Returned Survey per Technical Center Site
N# Survey Sent Answered Percentage
site A 11 7 64
site B 37 7 19
site C 121 34 28
site D 33 7 21
Total 202 55 27
The returned survey instruments were revised individually by the RA, primarily for
accuracy and missing information, and then revised to eliminate any potential personnel
identification prior to loading the documents into a password-protected file.

53
The next step as part of the data collection process was to add the data on the IBM
SPSS Statistics 22 and develop a definition of variables that better explain the data. It
included, for example, predictor variables that describe cases where respondents indicated
that they worked in more than one ICE component or employees perceived to work in more
than one function.
The items with “I do not know” responses and lack of responses were bundled and
considered as missing information in the variable definition for the data analysis process.
The survey instruments were downloaded in an Excel file, and the random format
used during the data collection process was reconfigured in order to cluster the constructs in
sequence; then depending on the case, the variables were transformed by the PI using SPSS
22 standard procedure. The variables’ names and labels were defined according to Table 5
and loaded in the IBM SPSS 22 database file.

54
Table 5
Variables’ Names, Labels, and Constructs
Data Analysis Process
The data analysis was performed using statistical tools and was intended to address
the research questions listed in Chapter 1.
Demographics
The first step of demographic analysis was to determine whether the data collected
was sufficient to meet the dissertation targets. Frequency distributions using the demographic
section of the completed survey instruments were plotted to identify whether the data were
adequate to cover all items listed. There are eight research questions associated wth this
research, so it was paramount to verify whether the number of responses was legitimate to
address those research questions. Figure 6 illustrates the frequency distribution of the

55
demographics as defined on the survey instrument: age group, title, function, application,
product, and PACE Award involvement.
Age Group – The results of the age group analysis are as follows: Employees between
51 and 65 years old returned the most survey instruments, followed by 36-50-year-olds and
26-35-year-olds. Three employees over 65 years old and only one under 25 years old also
returned the survey instrument.
Title – The results with regard to title are as follows: 26 engineers, 6 technical
specialists, and 22 directors and/or managers responded to the survey instument. The
responses of technical specialists and engineers were pooled together for the purpose of this
study because both are directly involved in the technical factors. There was one case
identified as “other title” which could be related to an employee who did not answer
correctly.
Function – The results with regard to function are as follows: Employees from
R&D/Technology function returned the highest number of survey instruments (25), followed
by Application Engineers (17) and Product Engineers (10).
Application – The results with regard to application are as follows: 31 employees
responded that they work in both automotive and/or truck engine components. Twelve
responded they work in auto application, and 12 work in diesel engine componensts. There
was a parity (12 and 12) between auto and truck engine component application. The majority
work in both automotive and truck engine component applications.
Product – The results with regard to product are as follows: due to the function
attributes of the ICE and close interaction between components, sometimes engineers and
managers work in more the one type of component. The components interface with each

56
other in the power train, helping the engine to function as a whole system; therefore, it has
been the practice to combine responsibilities between different products optimizing synergy
between components. Figure 6 shows the distribution between different types of components.
Aluminum and steel pistons combined shows the higher frequency of responses. There was a
wide distribution among the internal combustiom engine components including sealing
system (gaskets) used on the top of the engine and bearing used on the bottom of the engine.
PACE – The results of PACE are as follows: There was an even distributiom between
respondents regarding the involvement on PACE award. Twenty-eight employees indicated
they were involved, and 26 said they were not directily involved; one did not respond.
Figure 6 shows the demographic results.
n# 1 2 3 4 5 6 7 8 9 10 11 12 13 14 15 16 17 18 19 20 21 22 23 24 25 26 27 28 29 30 31
AGE under 25 1
26-35 12
36-50 17
51-65 22
over 65 3
Title Director/Manager22
Engineer 26
Technical Specialist 6
Other 1
Function Product10
R&D/Technology 25
Design 1
Tests (lab/engine) 6
Simulation/Analysis 2
Materials 5
Application 17
Other 1
Application Auto engine12
Truck engine 12
Both auto & truck engines31
Product Engine Bearings 8
Ignition Systems 5
Engine Rings 14
Engine Liners 12
Aluminum Pistons 13
Steel Pistons 22
Valve Seat and Guides 4Sealing Systems13
Systems Protection 1
Other 3
PACE YES 28
NO 26
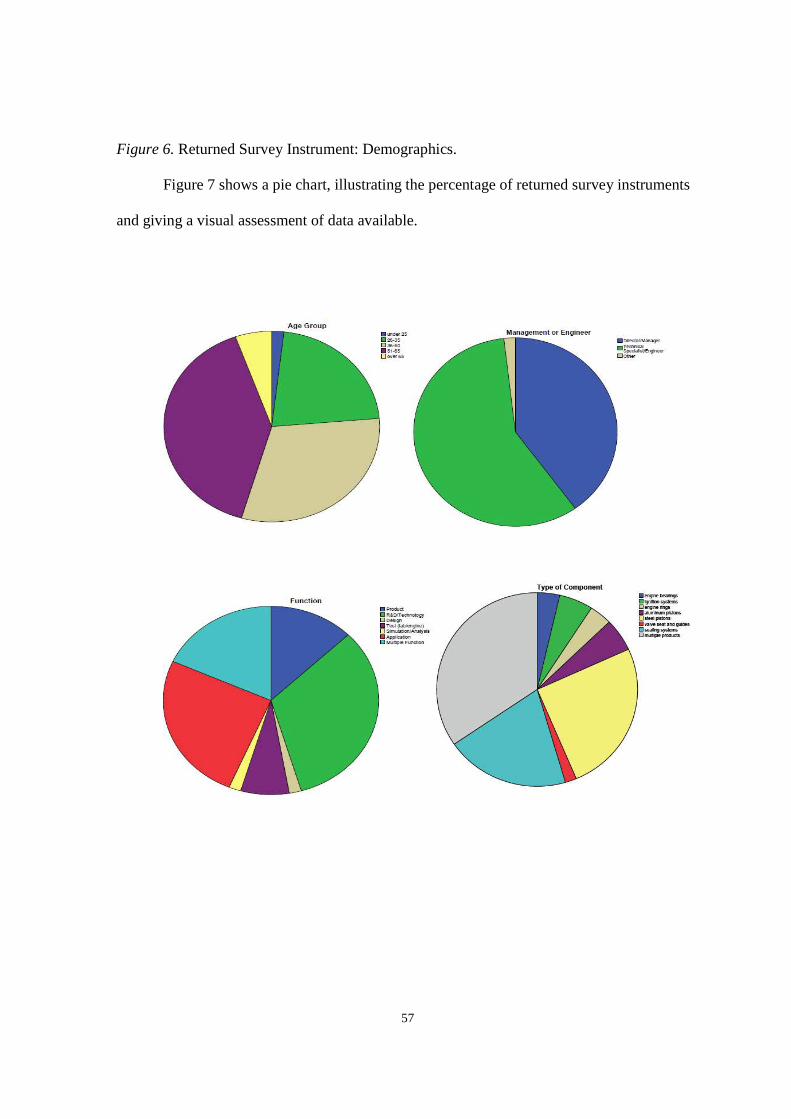
57
Figure 6. Returned Survey Instrument: Demographics.
Figure 7 shows a pie chart, illustrating the percentage of returned survey instruments
and giving a visual assessment of data available.

58
Figure 7. Pie chart demographics distribution.
In summary, it was found that there is enough information to proceed with further
data analysis.
Cronbach’s Alpha - Scale Reliability Test
A Cronbach’s Alpha reliability coefficient can range from zero to one. However,
there is no lower limit to the Cronbach’s Alpha coefficient; it has been acknowledged that the
closest the coefficient is to one (1), the greater the internal consistency of the items in a given
scale. Table 6 shows the code and plan to run the Cronbach’s Alpha.
Table 6
Cronbach’s Alpha Analysis Plan

59
Variable
Age group Age -
Management or Engineering Title -
Employee Function Function -
Product Application Application -Type of Component Product -PACE Award Involvement PACE -Technical Capability TC XTechnical Strenght TS XKnowledge Management System (Technical Enabler) TE XManagement Creativity MANCR XManagement Openness MANOP XManagement Orientation MANOFO XManagement Risk-Taking MANRT XManagement Proactiveness MANPA XGovernment Regulations GR XCustomer Integration CUSTINTE XDevelopment of Innovative ICE engine component SDIC XSum Technical Factors SUMTC XSum Managerial Factors SUMMF X
SPSS LabelCronbach's
Alpha
The Cronbach’s Alpha results associated with Sum of Technical Factor and
Managerial Factors variables are shown in Tables 7 and 8. Although there is no standardized
acceptance criterion for the Cronbach Alpha, the following rule of thumb is suggested in the
literature: “>0.9-Excellent, >0.8-Good, >0.7-Acceptable, >0.6-Questionable,>0.5-Poor, <0.5-
Unacceptable” (George & Mallery as cited in Gliem, 2003, p. 87). By considering the
criterion suggested by George and Mallery, it can be stated that the Sum of Technical Factors
and the Sum of Managerial Factors variables have good to excellent Cronbach’s Alpha index,
respectively.
An optimization of Cronbach’s Alpha was achieved by revising the items of
individual constructs. Few items with lower Cronbach’s Alpha were removed from the
constructs as shown of Table 9. It was concluded that two scales are considered excellent
(KMS Technical Enabler construct and Sum of Managerial Factors construct); three scales
are considered good (Management Openness, Management Orientation, and Sum of

60
Technical Factors); three scales are acceptable (Technical Capability, Management
Creativity, Management Risk-Taking); three scales are considered questionable (Technical
Strength, Management Proactiveness, and Development of Innovative ICE component); and
two scales are considered poor (Government Regulations and Customer Integration). There
were no constructs below 0.5, which is considered “unacceptable.” Table 9 illustrates a
detailed construct reliability summary and confirms that a higher number of items on a scale
tends to increase the Cronbach’s Alpha. Figure 8 illustrates the Cronbach’s Alpha rule-of-
thumb classification considering the individual constructs. It can be stated that the bulk of
Cronbach’s Alpha are above the acceptable level.
Table 7
Cronbach’s Alpha Technical Factors
--------------------------------------------------- ----------------------- RELIABILITY /VARIABLES=TECAPA1 TECAPA2 TECAPA3 TECAPA4 TECAPA 5 TECAPA6 TECHSTREN1 TECHSTREN2 TECHSTREN3 KMS1 KMS2 KMS3 KMS4 /SCALE('ALL VARIABLES') ALL /MODEL=ALPHA /STATISTICS=SCALE.
Reliability Statistics
Cronbach's
Alpha N of Items
.830 13
Table 8
Cronbach’s Alpha Managerial Factors
---------------------------------------------------------------------------------------------------------------- RELIABILITY /VARIABLES=MANCREATE1 MANCREATE2 MANCREATE3 MANCREATE4 MANCREATE5 MANCREATE6 MANCREATE7 MANOPEN1 MANOPEN2 MANOPEN3 MANOPEN4 MANORIENT1 MANORIENT2 MANORIENT3 MANORIENT4 MANRISKT1 MANRISKT2 MANRISKT3 MANRISKT4 MANRISKT5 MANPROACT1 MANPROACT2 MANPROACT3 MANPROACT4 /SCALE('ALL VARIABLES') ALL /MODEL=ALPHA.
Reliability Statistics

61
Cronbach's
Alpha N of Items
.903 24
Table 9
Construct Reliability Summary
Variable Code
Cronbach's Alpha N
# of Items
Selected
# of Items Total
Items Deleted
Age group Age -
Management or Engineering Title -Employee Function Function -
Product Application Application -Type of Component Product -
PACE Award Involvement PACE -Technical Capabili ty TC 0.735 51 6 6 0Technical Strength TS 0.644 33 2 3 TS3
Knowledge Management System (Technical Enabler) TE 0.907 42 3 3 0Management Creativi ty MANCR 0.759 45 6 6 0Management Openness MANOP 0.846 49 4 4 0
Management Orientation MANOFO 0.813 48 4 4 0Management Risk-Taking MANRT 0.723 50 4 5 MANRT5
Management Proact iveness MANPA 0.678 47 4 4 0Government Regulations GR 0.547 37 2 3 GR3
Customer Integration CUSTINTE 0.542 44 3 3 0Development of Innovative ICE component SDIC 0.687 37 4 4 0
Sum Technical Factors SUMTC 0.83 55 12 12 0Sum Managerial Factors SUMMF 0.903 55 23 23 0

62
Figure 8. Cronbach’s Alpha rule-of-thumb Classification and Frequency.
Research Questions Investigation
This section aims to analyze the research questions using statistical tools as proposed
in Table 3.
RQ1- Is there a commonality of factors that is associated with successful
development of innovative ICE components at a Tier 1 supplier firm?
A series of Factor Analysis (FA) and correlations were performed considering
Technical Factors constructs, Managerial Factors constructs, and other general factors
constructs per the survey instrument.
Factor Analysis Structure
Factor Analysis is an exploratory statistical technique that allows researchers to find
clusters of indicators (items) that characterize important latent variables embedded in a set of
data. In simple terms, Factor Analysis is a way to find patterns of relationships among
variables, which produces combinations of items that best represent important variables
entrenched on the data being analyzed. Factor Analysis is known as a subjective approach to
statistically consolidate and reduce the number of variables presented in a study. Because of
its subjectivity, Factor Analysis involves assumptions in the planning stage and several
interactions in the data analysis steps. In this study, 44 items from the survey instrument were
included in the data analysis steps. Four items related to the criterion variable were not
included. The following assumptions were used to run the Factor Analysis:
1 - Run the Factor Analysis (FA) considering overall items from the survey
instrument; then run FA considering items from the managerial section of the survey
instrument combined with items related to government regulations and customer integration;

63
then run FA considering items from managerial realm only; then run FA using items from
technical section of the survey instrument combined with items related to government
regulations and customers integration; and finally run FA using items from the technical
realm only.
2 - Use the Principal Axis Factoring (PAF) approach, commonly applied to this type
of survey instrument.
3 - Exclude Pearson correlation numbers (results) below 0.5.
4 - Consider Eingenvalues above one (“1”).
5 - Separate (do not consider) negative items being known as “bipolar” items because
they can confound the conclusions.
6 - Rotate the data and generate “pattern matrix” to determine cluster of factors.
7 - Select the number of factors based on the “Eingenvalues table” (output from
SPSS) and the “scree plot” capturing items or combinations of items that represent more than
50% of the items. Perform multiple interactions to determine the number of factors.
8 - Use the cross matrix from SPSS to confirm validity of identified factors.
9 - Compile the results in an Excel spreadsheet per 1- ) to 8- ) as part of the data
analysis review. Include a step process to create a table and identify items that appear
multiple times in the factor analysis simulations, have Pearson numbers above 0.6 and Sig (2-
tailed) lower than 0.05, to help narrow the cases with higher overall correlations between the
items.
10 - Run correlation analysis against the successful development of the innovative
component (SDIC) criterion variable. The recommendation to adopt highly correlated items
with more than 95% significance relies on the common sense of the natural selection process,

64
where combinations on good strong items will produce positive results. An example of this
natural selection process is the approach used by horses’ owners. They use a selective
breeding process to create champions. Their principle is to select premium genes that, when
combined, should result in a positive result. In the same way, in this study we expect that pre-
selecting high correlation items and combining them will draw best correlation results.
The items with lowest correlation values should be also tested for correlation against
the successful development of innovative component (SDIC) in order to confirm that items
with lower correlation from the pattern matrix would also produce lower correlation against
the criterion variable.
The final step on the FA structure was to review the original written statements of the
identified items per FA analysis and verify if there was commonality between the items that
could determine a theme (latent variable) that conveyed the best correlation with the
successful development of innovative ICE components.
Overall Factors Analysis
A total of 44 items were identified in the literature and included in this first step of
Factor Analysis using the approach described on the Factor Analysis Structure section.
Figure 9 illustrates a pattern matrix for the 44 items. This matrix was generated using
rotation method, principal axis factoring recommended for exploratory survey instruments. It
can be seen that five factors were clustered by the SPSS software, and the items are shown in
columns numbered 1 to 5 known as factors. The five factors shown in Figure 9 represent
more than 50% initial Eigenvalues. Beavers (2013) defined Eigenvalue as the “value
associated with each factor describing the amount of variance in the items that can be
explained by that factor” (Pett et al., 2003, as cited in Beaver et al., p. 7). Factor 1 has eight
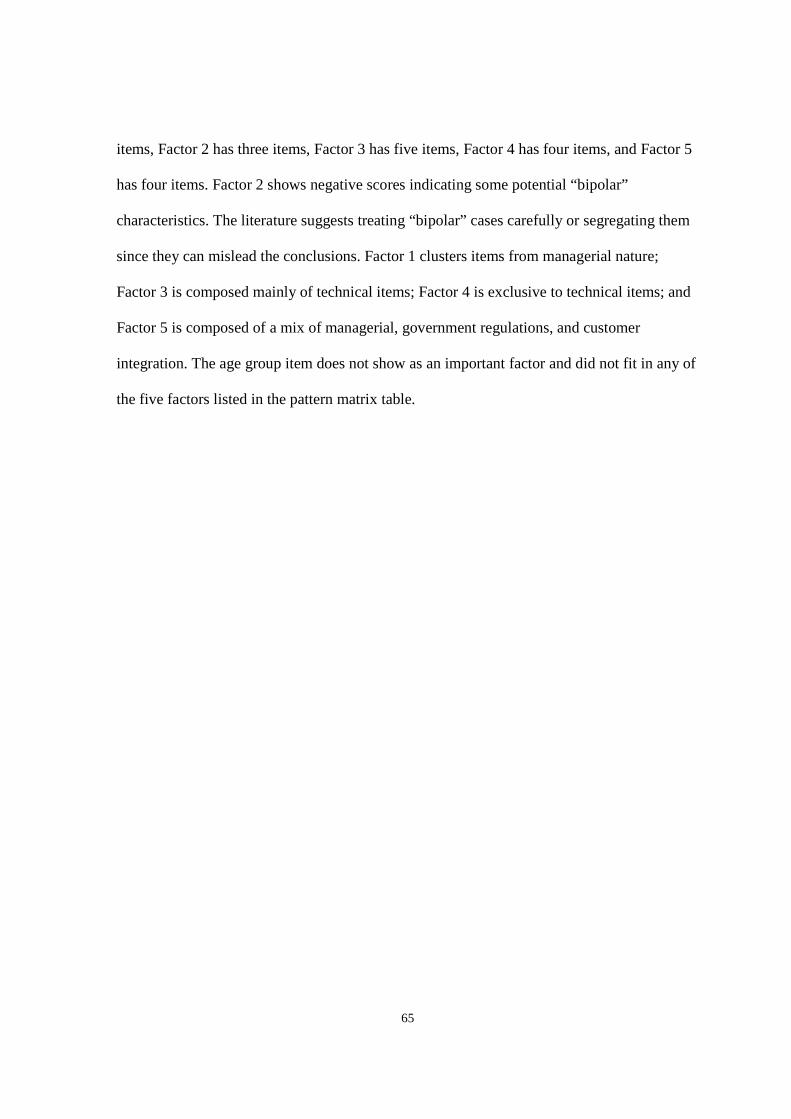
65
items, Factor 2 has three items, Factor 3 has five items, Factor 4 has four items, and Factor 5
has four items. Factor 2 shows negative scores indicating some potential “bipolar”
characteristics. The literature suggests treating “bipolar” cases carefully or segregating them
since they can mislead the conclusions. Factor 1 clusters items from managerial nature;
Factor 3 is composed mainly of technical items; Factor 4 is exclusive to technical items; and
Factor 5 is composed of a mix of managerial, government regulations, and customer
integration. The age group item does not show as an important factor and did not fit in any of
the five factors listed in the pattern matrix table.

66
1 2 3 4 5TC1
TC2
TC3
TC4 .642
TC5 .574
TC6 .582
TS1
TS2 .678
TS3
TE1 .712
TE2 .808
TE3 .760
TE4 .820
MANCR1
MANCR2 .557
MANCR3
MANCR4
MANCR5 .544
MANCR6
MANCR7
MANOP1 .745
MANOP2 .716
MANOP3
MANOP4 .786
MANFO1 .689
MANFO2
MANFO3 .724
MANFO4 .685
MANRT1 .715
MANRT2 .681
MANRT3 -.596
MANRT4 -.589
MANRT5
MANPA1 .623
MANPA2
MANPA3
MANPA4
GR1
GR2 .504
GR3
CUSTINTE1 .701
CUSTINTE2 .534
CUSTINTE3
Age Group
a. Rotation converged in 15 iterations.
Extraction Method: Principal Axis Factoring.
Rotation Method: Oblimin with Kaiser Normalization.a
Pattern Matrixa
Factor
Figure 9. Overall items - rotated pattern matrix for five factors.
A reliability statistics analysis was performed considering the five factors listed on
Figure 9 for the overall items.

67
Table 10 Factor 1 Overall Case Processing Summary
Case Processing Summary
N %
Cases Valid 41 74.5
Excludeda 14 25.5
Total 55 100.0
a. Listwise deletion based on all variables in the
procedure.
Table 11
Factor 1 Overall Cronbach’s Alpha for Eight Items
Reliability Statistics
Cronbach's
Alpha N of Items
.921 8
Table 12
Factor 1 Overall – Item Statistics
Item Statistics
Mean Std. Deviation N
MANOP1 3.22 1.084 41
MANOP2 3.22 1.107 41
MANOP4 3.07 1.081 41
MANFO1 3.44 1.026 41
MANFO3 2.98 1.060 41
MANFO4 3.27 .975 41
MANRT1 2.68 .934 41
MANRT2 3.66 1.087 41
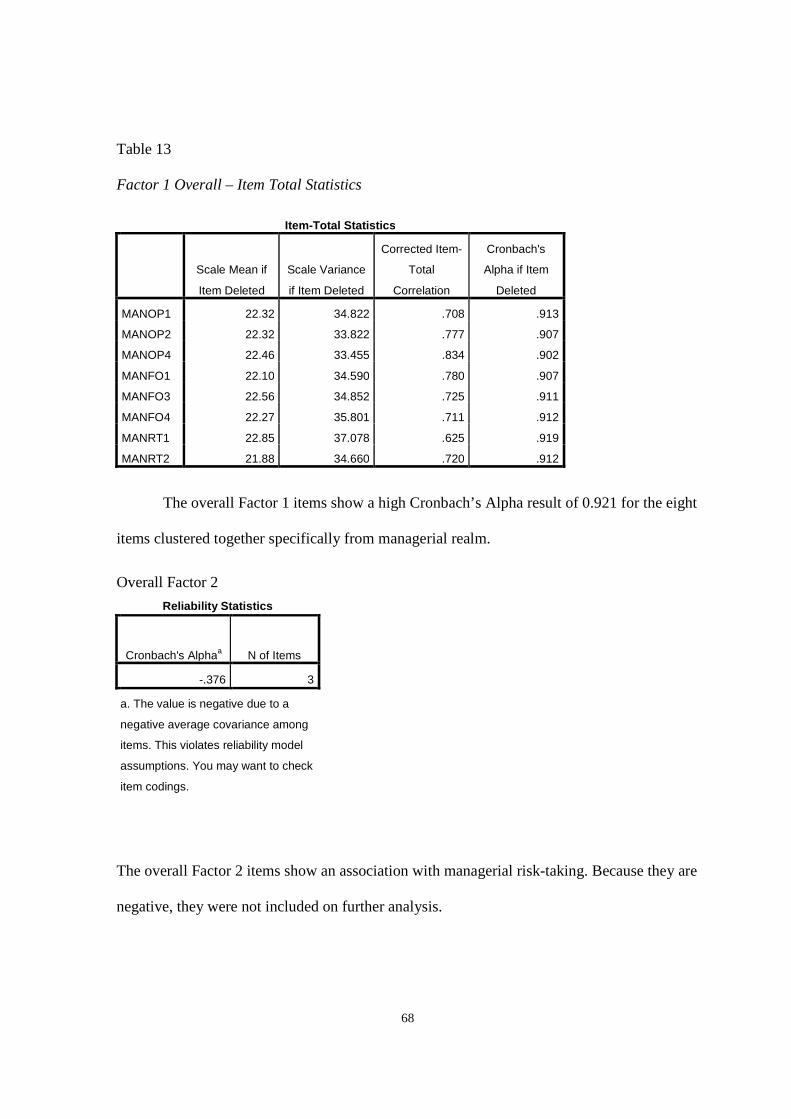
68
Table 13
Factor 1 Overall – Item Total Statistics
Item-Total Statistics
Scale Mean if
Item Deleted
Scale Variance
if Item Deleted
Corrected Item-
Total
Correlation
Cronbach's
Alpha if Item
Deleted
MANOP1 22.32 34.822 .708 .913
MANOP2 22.32 33.822 .777 .907
MANOP4 22.46 33.455 .834 .902
MANFO1 22.10 34.590 .780 .907
MANFO3 22.56 34.852 .725 .911
MANFO4 22.27 35.801 .711 .912
MANRT1 22.85 37.078 .625 .919
MANRT2 21.88 34.660 .720 .912
The overall Factor 1 items show a high Cronbach’s Alpha result of 0.921 for the eight
items clustered together specifically from managerial realm.
Overall Factor 2
Reliability Statistics
Cronbach's Alphaa N of Items
-.376 3
a. The value is negative due to a
negative average covariance among
items. This violates reliability model
assumptions. You may want to check
item codings.
The overall Factor 2 items show an association with managerial risk-taking. Because they are
negative, they were not included on further analysis.

69
Table 14
Factor 3 Overall Case Processing Summary
Case Processing Summary
N %
Cases Valid 41 74.5
Excludeda 14 25.5
Total 55 100.0
a. Listwise deletion based on all variables in the
procedure.
Table 15
Factor 3 Overall Cronbach’s Alpha for Five Items
Reliability Statistics
Cronbach's
Alpha N of Items
.754 5
Table 16
Factor 3 Overall – Item Statistics
Item Statistics
Mean Std. Deviation N
TC4 4.59 .706 41
TC5 3.63 .968 41
TC6 4.17 .834 41
TS2 3.41 1.048 41
MANCR5 3.78 .690 41

70
Table 17
Factor 3 Overall – Item Total Statistics
Item-Total Statistics
Scale Mean if
Item Deleted
Scale Variance
if Item Deleted
Corrected Item-
Total
Correlation
Cronbach's
Alpha if Item
Deleted
TC4 15.00 6.950 .510 .718
TC5 15.95 5.798 .560 .697
TC6 15.41 6.649 .466 .730
TS2 16.17 5.345 .599 .683
MANCR5 15.80 7.011 .510 .719
The overall Factor 3 items show a Cronbach’s Alpha result 0.754 for the five items
clustered together: four items from technical realm and one item from managerial realm.
Table 18
Factor 4 Overall Case Processing Summaries
Case Processing Summary
N %
Cases Valid 42 76.4
Excludeda 13 23.6
Total 55 100.0
a. Listwise deletion based on all variables in the
procedure.
Table 19
Factor 4 Overall Cronbach’s Alpha for Four Items
Reliability Statistics
Cronbach's
Alpha N of Items
.907 4

71
Table 20
Factor 4 Overall – Item Statistics
Item Statistics
Mean Std. Deviation N
TE1 3.24 1.185 42
TE2 2.76 1.144 42
TE3 2.71 1.066 42
TE4 2.76 1.144 42
Table 21
Factor 4 Overall – Item Total Statistics
Item-Total Statistics
Scale Mean if
Item Deleted
Scale Variance
if Item Deleted
Corrected Item-
Total
Correlation
Cronbach's
Alpha if Item
Deleted
TE1 8.24 9.357 .737 .899
TE2 8.71 8.941 .857 .854
TE3 8.76 9.893 .758 .890
TE4 8.71 9.185 .810 .871
The overall Factor 4 items show a high Cronbach’s Alpha result 0.907 for the four items
clustered together; four item from technical realm.
Table 22 Factor 5 Overall Case Processing Summaries
Case Processing Summary
N %
Cases Valid 39 70.9
Excludeda 16 29.1
Total 55 100.0
a. Listwise deletion based on all variables in the
procedure.

72
Table 23
Factor 5 Overall Cronbach’s Alpha for Four Items
Reliability Statistics
Cronbach's
Alpha N of Items
.642 4
Table 24
Factor 5 Overall – Item Statistics
Item Statistics
Mean Std. Deviation N
MANPA1 3.56 .882 39
GR2 2.87 1.056 39
CUSTINTE1 3.92 .929 39
CUSTINTE2 4.26 .785 39
Table 25
Factor 5 Overall – Item Total Statistics
Item-Total Statistics
Scale Mean if
Item Deleted
Scale Variance
if Item Deleted
Corrected Item-
Total
Correlation
Cronbach's
Alpha if Item
Deleted
MANPA1 11.05 4.103 .455 .552
GR2 11.74 3.933 .348 .639
CUSTINTE1 10.69 3.745 .528 .495
CUSTINTE2 10.36 4.605 .381 .602
The overall Factor 5 items show a Cronbach’s Alpha result 0.642 for the four items
clustered together, a mix of customer integration (two items), one government regulation and

73
one managerial realm. Factor 5 shows the lowest Cronbach’s Alpha result among the five
factors identified on the overall factor analysis.
Figure 10 shows the scree plot for the overall 44 items. A significant drop is observed
in the first five factor numbers, which represent more than 50% of initial Eigenvalues. The
typical procedure used to select factors generated in a scree plot was adopted by retaining the
factors that lie above the “elbow” of the plot. A detailed Eigenvalues table is attached in
Appendix Q.
Figure 10. Scree plot for the overall 44 items.
Figure 11 shows a three-dimensional distribution of overall items. The three-
dimensional chart is an output of SPS, which illustrates where the items tend to gravitate in
space, providing a visual assessment and “density” where the items are clustered.

74
Figure 11. Three-dimensional items distribution for overall items.
The tri-dimensional plot shows that items related to management risk-taking,
government regulations, and customer integration were positioned to the outside borders of
the distribution.
The five factor items shown in Figure 9 were transformed into specific variables
called “overall 1 to 5” and a correlation performed against the successful development of
innovative component (SDIC) criterion variable. Table 26 shows the correlation results. The
transformed variables Overall 1 and Overall 4 show the best correlation results of the matrix
shown in the Table 26 with Sig (2-tailed) significance below 0.05.

75
Table 26
Pearson Correlation Between the Transformed Overall Factors Variables and SDIC
SUMSDIC overall1 overall2 overall3 overall4 overall5
SUMSDIC Pearson Correlation 1 .466** -.056 .308 .353* -.357
Sig. (2-tailed) .007 .751 .086 .044 .057
N 37 32 34 32 33 29
overall1 Pearson Correlation .466** 1 .057 .266 .458** .148
Sig. (2-tailed) .007 .739 .135 .007 .418
N 32 41 37 33 33 32
overall2 Pearson Correlation -.056 .057 1 -.136 .095 .037
Sig. (2-tailed) .751 .739 .428 .575 .832
N 34 37 46 36 37 36
overall3 Pearson Correlation .308 .266 -.136 1 .141 .014
Sig. (2-tailed) .086 .135 .428 .419 .937
N 32 33 36 41 35 32
overall4 Pearson Correlation .353* .458** .095 .141 1 .211
Sig. (2-tailed) .044 .007 .575 .419 .263
N 33 33 37 35 42 30
overall5 Pearson Correlation -.357 .148 .037 .014 .211 1
Sig. (2-tailed) .057 .418 .832 .937 .263
N 29 32 36 32 30 39
**. Correlation is significant at the 0.01 level (2-tailed).
*. Correlation is significant at the 0.05 level (2-tailed).
Factors 1 and 4 show the higher correlation with SDIC and also good correlation
between themselves. Factor 1 is a combination of managerial items related to openness,
future orientation, and risk-taking. Factor 4 is related to technical items associated with a
technical enabler – the Knowledge Management System.
Technical Factors Analysis
In order to continue the investigation, a second interaction of Factor Analysis was
performed using the technical items combined with government regulations and customer
integration. A total of 20 items were identified in the literature and used in this factor

76
analysis. Figure 12 illustrates a pattern matrix for the 20 items. This matrix was generated
using rotation method, principal axis factoring recommended for exploratory survey
instruments. It can be seen that four factors were clustered by the SPSS software, and the
items are shown in columns numbered 1 to 4. The four items shown in Figure 12 represent
more than 76% initial Eigenvalues among the 20 items: Factor 1 has four items, Factor 2 has
three items, Factor 3 has four items, and Factor 4 has 1 item. The Factor 1 cluster items show
higher correlations related to technical enabler items; Factor 2 is composed mainly of
technical capability items; Factor 3 is composed of a mix of government regulations and
customer integration; Factor 4 is a single item related to technical strength.
1 2 3 4TC1
TC2 .538
TC3
TC4 .737
TC5
TC6 .690
TS1
TS2 .579
TS3
TE1 .733
TE2 .855
TE3 .750
TE4 .866
GR1
GR2 .622
GR3
CUSTINTE1 .507
CUSTINTE2 .591
CUSTINTE3 .524
Age Group
a. Rotation converged in 16 iterations.
Pattern Matrixa
Factor
Extraction Method: Principal Axis Factoring.
Rotation Method: Oblimin with Kaiser Normalization.a
Figure 12. Technical, government regulations and customer integration items rotated pattern
matrix for four factors.

77
A reliability statistics analysis was performed considering the four factors listed in
Figure 12 for the technical, government regulations, and customer integration (TGC) items.
Table 27
TGC Factor 1 Overall Case Processing Summaries
Case Processing Summary
N %
Cases Valid 42 76.4
Excludeda 13 23.6
Total 55 100.0
a. Listwise deletion based on all variables in the
procedure.
Table 28
TGC Factor 1 Cronbach’s Alpha for Four Items
Reliability Statistics
Cronbach's
Alpha N of Items
.907 4
Table 29
TCG Factor 1 – Item Statistics
Item Statistics
Mean Std. Deviation N
TE1 3.24 1.185 42
TE2 2.76 1.144 42
TE3 2.71 1.066 42
TE4 2.76 1.144 42

78
Table 30
TGC Factor 1 –Item Total Statistics
Item-Total Statistics
Scale Mean if
Item Deleted
Scale Variance
if Item Deleted
Corrected Item-
Total
Correlation
Cronbach's
Alpha if Item
Deleted
TE1 8.24 9.357 .737 .899
TE2 8.71 8.941 .857 .854
TE3 8.76 9.893 .758 .890
TE4 8.71 9.185 .810 .871
The TGC Factor 1 items show a high Cronbach’s Alpha result 0.907 for the four
items clustered together from technical enabler nature.
Table 31
TGC Factor 2 Overall Case Processing Summaries
Case Processing Summary
N %
Cases Valid 52 94.5
Excludeda 3 5.5
Total 55 100.0
a. Listwise deletion based on all variables in the
procedure.
Table 32
TGC Factor 2 Cronbach’s Alpha for Four Items
Reliability Statistics
Cronbach's
Alpha N of Items
.705 3

79
Table 33
TCG Factor 2 – Item Statistics
Item Statistics
Mean Std. Deviation N
TC2 4.29 .723 52
TC4 4.60 .693 52
TC6 4.15 .849 52
Table 34
TGC Factor 2 – Item Total Statistics
Item-Total Statistics
Scale Mean if
Item Deleted
Scale Variance
if Item Deleted
Corrected Item-
Total
Correlation
Cronbach's
Alpha if Item
Deleted
TC2 8.75 1.917 .406 .746
TC4 8.44 1.742 .563 .572
TC6 8.88 1.320 .622 .479
The TGC Factor 2 items show a Cronbach’s Alpha result 0.705 for the three items
clustered together from technical capability nature.
Table 35
TGC Factor 3 Overall Case Processing Summaries
Case Processing Summary
N %
Cases Valid 40 72.7
Excludeda 15 27.3
Total 55 100.0
a. Listwise deletion based on all variables in the
procedure.

80
Table 36
TGC Factor 3 Cronbach’s Alpha for Four Items
Reliability Statistics
Cronbach's
Alpha N of Items
.625 4
Table 37
TCG Factor 3 – Item Statistics
Item Statistics
Mean Std. Deviation N
GR2 2.88 1.042 40
CUSTINTE1 3.95 .932 40
CUSTINTE2 4.23 .800 40
CUSTINTE3 3.25 .840 40
Table 38
TGC Factor 2 – Item Total Statistics
Item-Total Statistics
Scale Mean if
Item Deleted
Scale Variance
if Item Deleted
Corrected Item-
Total
Correlation
Cronbach's
Alpha if Item
Deleted
GR2 11.43 3.430 .440 .531
CUSTINTE1 10.35 4.028 .352 .594
CUSTINTE2 10.08 4.276 .392 .567
CUSTINTE3 11.05 3.997 .451 .526
The TGC Factor 3 items show a Cronbach’s Alpha result 0.625 for the four items
clustered together from customer integration (three items) and one item from government
regulations.

81
TGC Factor 4
Factor 4 is a single item. Therefore no reliability analysis was performed.
Figure 13 shows a scree plot of technical items, government regulations, and
customer interaction numbers versus calculated Eigenvalues. A pronounced drop is observed
considering the initial four factors. Then the slope of the curve reduces, showing less
influence.
Figure 13. Scree plot for the technical items, government regulations and customer
interaction.
A distinct drop is observed considering the initial 4 technical factors. Then the slope
of the curve reduces, showing less influence of the remaining factors from 5 to 20.
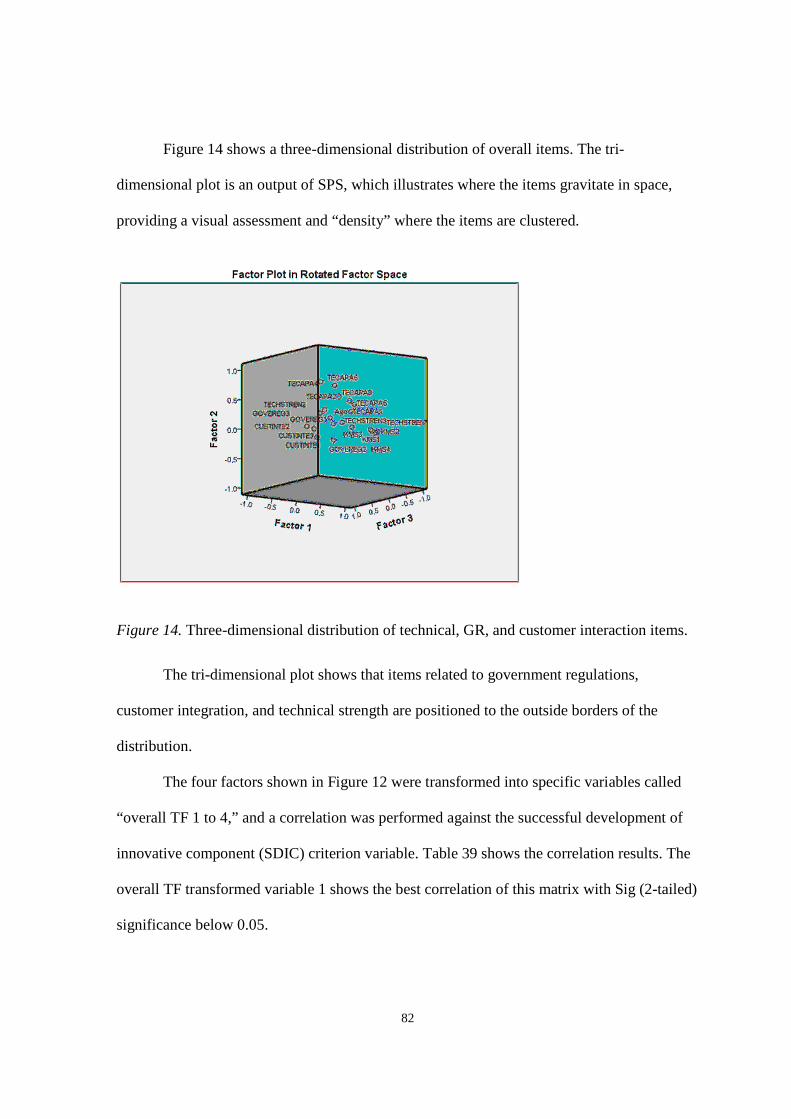
82
Figure 14 shows a three-dimensional distribution of overall items. The tri-
dimensional plot is an output of SPS, which illustrates where the items gravitate in space,
providing a visual assessment and “density” where the items are clustered.
Figure 14. Three-dimensional distribution of technical, GR, and customer interaction items.
The tri-dimensional plot shows that items related to government regulations,
customer integration, and technical strength are positioned to the outside borders of the
distribution.
The four factors shown in Figure 12 were transformed into specific variables called
“overall TF 1 to 4,” and a correlation was performed against the successful development of
innovative component (SDIC) criterion variable. Table 39 shows the correlation results. The
overall TF transformed variable 1 shows the best correlation of this matrix with Sig (2-tailed)
significance below 0.05.

83
Table 39
Pearson Correlation of the Transformed Five Factors and SDIC
Correlations
SUMSDIC overallTF1 overallTF2 overallTF3 overallTF4
SUMSDIC Pearson Correlation 1 .353* .235 -.331 .179
Sig. (2-tailed) .044 .174 .069 .318
N 37 33 35 31 33
overallTF1 Pearson Correlation .353* 1 .148 .189 .040
Sig. (2-tailed) .044 .361 .300 .815
N 33 42 40 32 36
overallTF2 Pearson Correlation .235 .148 1 .156 .443**
Sig. (2-tailed) .174 .361 .343 .004
N 35 40 52 39 40
overallTF3 Pearson Correlation -.331 .189 .156 1 .116
Sig. (2-tailed) .069 .300 .343 .527
N 31 32 39 40 32
overallTF4 Pearson Correlation .179 .040 .443** .116 1
Sig. (2-tailed) .318 .815 .004 .527
N 33 36 40 32 43
*. Correlation is significant at the 0.05 level (2-tailed).
**. Correlation is significant at the 0.01 level (2-tailed). The overall TF1 is essentially a combination of items related to technical enabler
(KMSS), which shows the higher Cronbach’s Alpha results of 0.907 and higher correlation
with SDIC. Three items from technical capability constructs presented an acceptable
Cronbach’s Alpha result but did not show a high correlation with the SDIC. Factor 3,
customer integration and government regulations, shows an acceptable Cronbach’s Alpha but
negative correlation with SDIC. The items related to technical strength did appear to be
significant in the variance of all technical items.

84
Additional analysis was performed considering only the technical items. A
descriptive analysis per Table 40 was run to identify the means and standard deviation of
every single item. Higher numbers indicated an agreement with the statement presented in
the survey instrument. TC4 (“We have a good mix of technical expertise within our work
group in our organization”) and TC2 (“One of this organization’s greatest strengths is the
development of technically superior engine components”) showed the highest mean and
lowest standard deviations.
Table 40
Technical Factor Mean and Standard Deviations
Mean Std. Deviation
TC1 4.19 .895
TC2 4.35 .562
TC3 4.12 .766
TC4 4.73 .533
TC5 3.69 1.087
TC6 4.23 .652
TS1 2.62 .983
TS2 3.31 .970
TS3 4.04 1.183
TE1 3.23 1.243
TE2 2.73 1.218
TE3 2.73 1.041
TE4 2.69 1.225
Figure 15 illustrates a pattern matrix for the 13 technical items. This matrix was
generated using rotation method, the principal axis factoring recommended for exploratory
survey instrument. It can be seen that five factors were clustered by the SPSS 22 software
and the items are shown in columns numbered 1 to 3. The three factors shown on Figure 15
represent more than 76% initial Eigenvalues among the 13 items: Factor 1 has four items,

85
Factor 2 has two items, and Factor 3 has one item. Factor 3 is a single item and shows a
negative score, indicating some potential “bipolar” characteristics. Factors 1 and 2 clustered
items show higher correlations related to technical enabler items and technical capability
items.
1 2 3TC1
TC2
TC3
TC4 .785
TC5
TC6 .716
TS1
TS2 -.861
TS3
TE1 .676
TE2 .845
TE3 .807
TE4 .877
Pattern Matrixa
Factor
Extraction Method: Principal Axis Factoring.
Rotation Method: Oblimin with Kaiser Normalization.a
Figure 15. Technical items rotated pattern matrix for three factors.
Figure 16 shows a screen plot of Technical Factor numbers versus calculated
Eigenvalues. A pronounced drop is observed considering the initial 3 technical factors. Then
the slope of the curve reduces, showing less influence of the remaining factors from 6 to 13.

86
Figure 16. Scree plot for the 13 technical items.
Figure 17 shows a three-dimensional distribution of overall items. It is an output of
SPSS, which illustrates where the items gravitate in space, providing a visual assessment and
“density” where the items are clustered.

87
Figure 17. Three-dimensional items distribution for the technical factors items.
The tri-dimensional plot shows that items are concentrated to the right side of the
chart in a positive side of Factor 1. The technical enabler items (KMS) are clustered together.
The technical enabler (KMS) items appear to be the most common factors clustered
together. They are clustered in Factor 1, independently if the factor analysis was run
considering only technical items or if the factor analysis was performed considering the
technical items combined with the government regulations and customer interaction. The
technical enabler items (Factor 1) also showed the highest correlation results with the SDIC
when compared with the other factors (2, 3, and 4) and showed Sig (2-tailed) lower than 0.05
(significant).
Managerial Factors Analysis
A total of 31 managerial items, government regulations, and customer integration
items were identified in the literature and used in this factor analysis. Figure 18 illustrates a

88
pattern matrix for the 31 items. The matrix was generated using the rotation method,
principal axis factoring recommended for exploratory survey instrument. It can be seen that
four factors were clustered by the SPSS 22 software, and the items are shown in columns
numbered 1 to 4. The four factors shown on Figure 18 represent 65% of the cumulative
initial Eigenvalues: Factor 1 has eleven items, Factor 2 has two items, Factor 3 has four
items, and Factor 4 has two items. Factor 1 shows a cluster containing items associated with
openness (three items) and future orientation (four items), creativity (two items) and risk-
taking (two items). Factor 2 shows negative scores indicating some potential “bipolar”
characteristics. The literature suggests treating “bipolar” cases carefully or segregating them
since they can mislead the conclusions. Factor 3 shows a mix of items associated with
government regulations, customer integration, and one item from proactive. Factor 4 shows
two items that are divided between risk-taking and proactive.

89
1 2 3 4Age Group
MANCR1
MANCR2
MANCR3
MANCR4 .733
MANCR5
MANCR6
MANCR7 .527
MANOP1 .791
MANOP2 .785
MANOP3
MANOP4 .786
MANFO1 .834
MANFO2 .511
MANFO3 .760
MANFO4 .709
MANRT1 .662
MANRT2 .634
MANRT3 -.621
MANRT4 -.645
MANRT5 .698
MANPA1 .632
MANPA2
MANPA3
MANPA4 .558
GR1
GR2 .562
GR3
CUSTINTE1 .602
CUSTINTE2 .583
CUSTINTE3
a. Rotation converged in 12 iterations.
Pattern Matrixa
Factor
Extraction Method: Principal Axis Factoring.
Rotation Method: Oblimin with Kaiser Normalization.a
Figure 18. Pattern matrix for managerial items, GR and customer interactions.
A reliability statistics analysis was performed considering the four factors listed in
Figure 18 for the managerial, government regulations, and customer integration items
(MGC).

90
Table 41
MGC Factor 1 Case Processing Summaries
Case Processing Summary
N %
Cases Valid 41 74.5
Excludeda 14 25.5
Total 55 100.0
a. Listwise deletion based on all variables in the
procedure.
Table 42
MGC Factor 1 Cronbach’s Alpha for Eleven Items
Reliability Statistics
Cronbach's
Alpha N of Items
.922 11
Table 43
MCG Factor 1 – Item Statistics
Item Statistics
Mean Std. Deviation N
MANCR4 3.66 1.039 41
MANCR7 3.90 .860 41
MANOP1 3.22 1.084 41
MANOP2 3.22 1.107 41
MANOP4 3.07 1.081 41
MANFO1 3.44 1.026 41
MANFO2 3.32 1.128 41
MANFO3 2.98 1.060 41
MANFO4 3.27 .975 41
MANRT1 2.68 .934 41
MANRT2 3.66 1.087 41

91
Table 44
MGC Factor 1 – Item Total Statistics
Item-Total Statistics
Scale Mean if
Item Deleted
Scale Variance
if Item Deleted
Corrected Item-
Total
Correlation
Cronbach's
Alpha if Item
Deleted
MANCR4 32.76 61.739 .632 .917
MANCR7 32.51 64.206 .595 .919
MANOP1 33.20 59.911 .719 .913
MANOP2 33.20 59.361 .736 .912
MANOP4 33.34 58.280 .830 .908
MANFO1 32.98 59.724 .780 .910
MANFO2 33.10 63.190 .484 .925
MANFO3 33.44 59.852 .742 .912
MANFO4 33.15 61.378 .708 .914
MANRT1 33.73 62.801 .640 .917
MANRT2 32.76 59.739 .728 .913
The MGC Factor 1 item shows an excellent Cronbach’s Alpha result, 0.922, for the
eleven items clustered together: managerial, government, and customer interactions items.
Table 45
MGC Factor 2 Case Processing Summaries
Case Processing Summary
N %
Cases Valid 54 98.2
Excludeda 1 1.8
Total 55 100.0
a. Listwise deletion based on all variables in the
procedure.

92
Table 46
MGC Factor 2 Cronbach’s Alpha for Two Items
Reliability Statistics
Cronbach's
Alpha N of Items
.794 2
Table 47
MCG Factor 2 – Item Statistics
Item Statistics
Mean Std. Deviation N
MANRT3 2.13 .953 54
MANRT4 2.33 .890 54
Table 48
MGC Factor 2 – Item Total Statistics
Item-Total Statistics
Scale Mean if
Item Deleted
Scale Variance
if Item Deleted
Corrected Item-
Total
Correlation
Cronbach's
Alpha if Item
Deleted
MANRT3 2.33 .792 .660 .
MANRT4 2.13 .907 .660 .
Only two items clustered on Factor 2 related to taking a management risk, showing a
good Cronbach’s Alpha of 0.794.

93
Table 49
MGC Factor 3 Case Processing Summaries
Case Processing Summary
N %
Cases Valid 39 70.9
Excludeda 16 29.1
Total 55 100.0
a. Listwise deletion based on all variables in the
procedure.
Table 50
MGC Factor 3 Cronbach’s Alpha for Four Items
Reliability Statistics
Cronbach's
Alpha N of Items
.642 4
Table 51
MCG Factor 3 – Item Statistics
Item Statistics
Mean Std. Deviation N
MANPA1 3.56 .882 39
GR2 2.87 1.056 39
CUSTINTE1 3.92 .929 39
CUSTINTE2 4.26 .785 39

94
Table 52
MGC Factor 3 – Item Total Statistics
Item-Total Statistics
Scale Mean if
Item Deleted
Scale Variance
if Item Deleted
Corrected Item-
Total
Correlation
Cronbach's
Alpha if Item
Deleted
MANPA1 11.05 4.103 .455 .552
GR2 11.74 3.933 .348 .639
CUSTINTE1 10.69 3.745 .528 .495
CUSTINTE2 10.36 4.605 .381 .602
The MGC Factor 3 shows an acceptable Cronbach’s Alpha of 0.642 for the four items
clustered from customer interactions (two items), government regulations (one item) and
managerial (pro-active) constructs (one item).
MGC Factor 4
Reliability Statistics
Cronbach's
Alphaa N of Items
-.637 2
a. The value is negative due to
a negative average covariance
among items. This violates
reliability model assumptions.
You may want to check item
codings.
The MGC Factor 4 shows items associated with managerial risk-taking and
proactiveness. Because they are negative, they were not included in further analysis.
Figure 19 shows a screen plot of managerial, government regulations, and customer
interaction item versus the calculated Eigenvalues. A pronounced drop is observed

95
considering the initial Factor 4. Then the slope of the curve reduces, showing less influence
of the remaining factors from 5 to 31.
Figure 19. Scree plot managerial, government regulations, and customer interaction items.
Figure 20 shows a three-dimensional distribution of managerial, government
regulations, and customer integration items. The tri-dimensional plot is an output of SPSS
that illustrates where the items gravitate in space, providing a visual assessment “density” of
the clusters.

96
Figure 20. Three-dimensional items distribution for managerial, government regulations, and
customer interaction items.
The tri-dimensional plot shows that items related to management risk-taking,
government regulations, and customer integration are positioned to the borders of the
distribution.
The four factors shown in Figure 18 were transformed into specific variables called
“overall MF1 to 4” and a correlation was performed against the successful development of
innovative component (SDIC) criterion variable. Table 53 shows the correlation results. The
overall MF 1 transformed variable shows the best correlation of this matrix with Sig (2-
tailed) significance below 0.05.

97
Table 53
Pearson Correlation of the Transformed Four Variables and SDIC
Correlations
SUMSDIC overallMF1 overallMF2 overallMF3 overallMF4
SUMSDIC Pearson Correlation 1 .542** -.344* -.357 -.260
Sig. (2-tailed) .001 .037 .057 .131
N 37 32 37 29 35
overallMF1 Pearson Correlation .542** 1 .214 .124 -.133
Sig. (2-tailed) .001 .179 .500 .421
N 32 41 41 32 39
overallMF2 Pearson Correlation -.344* .214 1 .260 .467**
Sig. (2-tailed) .037 .179 .110 .001
N 37 41 54 39 48
overallMF3 Pearson Correlation -.357 .124 .260 1 -.063
Sig. (2-tailed) .057 .500 .110 .717
N 29 32 39 39 36
overallMF4 Pearson Correlation -.260 -.133 .467** -.063 1
Sig. (2-tailed) .131 .421 .001 .717
N 35 39 48 36 48
**. Correlation is significant at the 0.01 level (2-tailed).
*. Correlation is significant at the 0.05 level (2-tailed).
Factor 1 (overall MF1) shows the highest correlation (0.542) with SDIC. Factor 1 is a
combination of managerial items related to openness, future orientation, risk-taking and
creativity. The Sig (2-tailed) is lower than 0.05 (significant).
Additional analysis was performed considering only the managerial items. A
descriptive analysis per Table 54 was run to identify the means and standard deviation of
every single item. The higher numbers indicated strong agreement with the statement
presented on the survey instrument. MANCR3 (“In this organization we are constantly
looking to develop and offer new or improved products”), showed the highest mean; the

98
lowest standard deviation and MANCR2 (“In this organization managers are expected to be
resourceful problem solvers”) showed the second-highest mean.
Table 54
Descriptive Statistics for Managerial Items
Descriptive Statistics
Mean Std. Deviation Analysis N
MANCR1 3.63 1.040 32
MANCR2 4.09 .893 32
MANCR3 4.19 .693 32
MANCR4 3.81 .998 32
MANCR5 3.78 .832 32
MANCR6 3.25 .803 32
MANCR7 4.00 .762 32
MANOP1 3.31 1.120 32
MANOP2 3.34 1.125 32
MANOP3 3.63 .871 32
MANOP4 3.19 1.148 32
MANFO1 3.47 1.077 32
MANFO2 3.34 1.066 32
MANFO3 3.09 1.058 32
MANFO4 3.31 1.061 32
MANRT1 2.88 .907 32
MANRT2 3.72 1.170 32
MANRT3 2.00 .880 32
MANRT4 2.34 .902 32
MANRT5 3.19 1.030 32
MANPA1 3.63 .833 32
MANPA2 3.41 .911 32
MANPA3 3.09 .963 32
MANPA4 2.91 1.027 32
Figure 21 illustrates a pattern matrix for the 24 items. This matrix was generated
using rotation method, the principal axis factoring recommended for an exploratory survey
instrument. It can be seen that four factors were clustered by the SPSS22 software, and the

99
items are shown in columns numbered 1 to 4. The four factors shown in Figure 21 represent
65% cumulative initial Eigenvalues: Factor 1 has nine items, Factor 2 has three items, Factor
3 has one item (risk-taking), and Factor 4 has four items. Factor 1 shows a cluster of items
associated with openness (three items), future orientation (four items), creativity (one item)
and risk-taking (one item). Factor 2 shows negative scores indicating some potential
“bipolar” characteristics. The literature suggests treating “bipolar factors” carefully since
they are usually more difficult to interpret (SJSU, 2015). The bipolar factors were segregated
because could mislead the conclusions. Factor 3 shows a single item (MANRT5). Factor 4
has a mix of items between creativity, openness, and proactiveness.
1 2 3 4MANCR1
MANCR2
MANCR3
MANCR4 .717
MANCR5
MANCR6
MANCR7 .530
MANOP1 .598
MANOP2 .775
MANOP3 .519
MANOP4 .756
MANFO1 .746
MANFO2 .571
MANFO3 .836
MANFO4 .688
MANRT1 .641 -.523
MANRT2
MANRT3 -.684
MANRT4 -.779
MANRT5 .703
MANPA1 .740
MANPA2
MANPA3 .529
MANPA4
a. Rotation converged in 14 iterations.
Pattern Matrixa
Factor
Extraction Method: Principal Axis Factoring.
Rotation Method: Oblimin with Kaiser Normalization.a
Figure 21. Managerial items - rotated pattern matrix for four factors.

100
A reliability statistics analysis was performed considering the five factors listed in
Figure 21 for the managerial items.
Table 55
MF Factor 1 Case Processing Summaries
Case Processing Summary
N %
Cases Valid 42 76.4
Excludeda 13 23.6
Total 55 100.0
a. Listwise deletion based on all variables in the
procedure.
Table 56
MF Factor 1 Cronbach’s Alpha for Nine Items
Reliability Statistics
Cronbach's
Alpha N of Items
.910 9
Table 57
MF Factor 1 – Item Statistics
Item Statistics
Mean Std. Deviation N
MANCR4 3.67 1.028 42
MANOP1 3.21 1.071 42
MANOP2 3.24 1.100 42
MANOP4 3.10 1.078 42
MANFO1 3.45 1.017 42
MANFO2 3.33 1.119 42
MANFO3 3.00 1.059 42
MANFO4 3.29 .970 42
MANRT1 2.69 .924 42

101
Table 58
MF Factor 1 – Item Total Statistics
Item-Total Statistics
Scale Mean if
Item Deleted
Scale Variance
if Item Deleted
Corrected Item-
Total
Correlation
Cronbach's
Alpha if Item
Deleted
MANCR4 25.31 41.731 .629 .904
MANOP1 25.76 40.625 .686 .900
MANOP2 25.74 39.710 .738 .896
MANOP4 25.88 38.839 .830 .889
MANFO1 25.52 40.353 .755 .895
MANFO2 25.64 42.479 .508 .913
MANFO3 25.98 39.877 .758 .895
MANFO4 25.69 41.341 .711 .899
MANRT1 26.29 42.843 .616 .905
The MF Factor 1 item shows an excellent Cronbach’s Alpha result, 0.910, for the
nine managerial items clustered together with the majority of items related to openness and
future orientation.
Table 59
MF Factor 2 Case Processing Summaries
Case Processing Summary
N %
Cases Valid 51 92.7
Excludeda 4 7.3
Total 55 100.0
a. Listwise deletion based on all variables in the
procedure.

102
Table 60
MF Factor 2 Cronbach’s Alpha for Three Items
Reliability Statistics
Cronbach's
Alpha N of Items
.782 3
Table 61
MF Factor 2 – Item Statistics
Item Statistics
Mean Std. Deviation N
MANRT1 2.71 .901 51
MANRT3 2.10 .964 51
MANRT4 2.29 .879 51
Table 62
MF Factor 2 – Item Total Statistics
Item-Total Statistics
Scale Mean if
Item Deleted
Scale Variance
if Item Deleted
Corrected Item-
Total
Correlation
Cronbach's
Alpha if Item
Deleted
MANRT1 4.39 2.803 .542 .786
MANRT3 5.00 2.400 .643 .680
MANRT4 4.80 2.561 .682 .640
The MF Factor 2 item shows a good Cronbach’s Alpha result, 0.782, for three
managerial items related to risk-taking.
MF Factor 3 Factor 3 shows a single item. Therefore no reliability analysis was performed.

103
Table 63
MF Factor 4 Case Processing Summaries
Case Processing Summary
N %
Cases Valid 50 90.9
Excludeda 5 9.1
Total 55 100.0
a. Listwise deletion based on all variables in the
procedure.
Table 64
MF Factor 4 Cronbach’s Alpha for Four Items
Reliability Statistics
Cronbach's
Alpha N of Items
.654 4
Table 65
MF Factor 4 – Item Statistics
Item Statistics
Mean Std. Deviation N
MANCR7 3.84 .866 50
MANOP3 3.54 .838 50
MANPA1 3.58 .883 50
MANPA3 3.02 .979 50

104
Table 66
MF Factor 4 – Item Total Statistics
Item-Total Statistics
Scale Mean if
Item Deleted
Scale Variance
if Item Deleted
Corrected Item-
Total
Correlation
Cronbach's
Alpha if Item
Deleted
MANCR7 10.14 3.960 .452 .576
MANOP3 10.44 4.129 .421 .596
MANPA1 10.40 3.592 .566 .493
MANPA3 10.96 4.039 .322 .671
The MF Factor 4 shows an acceptable Cronbach’s Alpha result, 0.654, for four items
related to proactiveness, openness, and creativity.
Figure 22 shows a scree plot of managerial items versus the calculated Eigenvalues.
Figure 22. Scree plot of managerial items versus calculated Eigenvalues.
A significant drop is noticed in the initial four managerial factors. Then the slope of
the curve reduces, showing less influence of the remaining factors from 5 to 24.

105
Figure 23 shows a three-dimensional distribution of managerial items. It is an output
of SPSS22, which illustrates where the items gravitate in space, providing a visual
assessment “density” of the clusters.
Figure 23. Three-dimensional distribution for managerial items.
The tri-dimensional plot shows that items related to management risk-taking and
creativity are positioned to the borders of the distribution.
The four factors shown in Figure 21 were transformed into variables defined as “only
MF1”,”only MF2”, “only MF3”, “only MF4” and a correlation was performed against the
successful development of the innovative component (SDIC) criterion variable. Table 67
shows the correlation results. The only MF 1 transformed variable shows the best correlation
of this matrix with Sig (2-tailed) significance below 0.05.

106
Table 67
Pearson Correlation of the Transformed Four Variables and SDIC
Correlations
SUMSDIC onlyMF1 onlyMF2 onlyMF3 onlyMF4
SUMSDIC Pearson Correlation 1 .547** -.212 -.044 .180
Sig. (2-tailed) .001 .208 .800 .301
N 37 33 37 35 35
onlyMF1 Pearson Correlation .547** 1 .430** -.210 .504**
Sig. (2-tailed) .001 .004 .194 .001
N 33 42 42 40 39
onlyMF2 Pearson Correlation -.212 .430** 1 -.166 .262
Sig. (2-tailed) .208 .004 .270 .072
N 37 42 51 46 48
onlyMF3 Pearson Correlation -.044 -.210 -.166 1 -.046
Sig. (2-tailed) .800 .194 .270 .766
N 35 40 46 48 44
onlyMF4 Pearson Correlation .180 .504** .262 -.046 1
Sig. (2-tailed) .301 .001 .072 .766
N 35 39 48 44 50
**. Correlation is significant at the 0.01 level (2-tailed).
Factor 1 (only MF1) shows the higher correlation with SDIC (0.547). It explains the
29.9% variation on the SDIC. Factor 1 is a combination of managerial items related to
openness, future orientation, risk-taking, and creativity. The Sig (2-tailed) is lower than 0.05
(significant).
Table 68 combines items with higher correlation numbers from the factor analysis
interactions. The individual correlation numbers from the factor analysis were added,
creating a sum total from five runs and the numbers displayed from high to low scores. A
mix of technical items and managerial items were found in the top twelve items that are
above sum total 2.0. Five items are from technical nature (TE4, TE2, TE3, TC4, and TE1),

107
and seven items are managerial nature (MANOP4, MANF03, MANOP2, MANFO1,
MANOP1, MANFO4 and MANRT1). Four of five technical items are related to technical
enablers (KMS) who consistently appear in the factor analysis interactions. Three items are
from future orientation and three items from openness, composing the bulk of the managerial
items. The customer integration and government regulations items are shown in a second tier,
with sum total correlations below 1.810 as shown on Table 68.
Table 68
Higher Correlation Numbers from the Factor Analysis
FArun1 FArun2 FArun3 FArun4 FArun5
label Overall items MF+GR+Customer TF+GR+Customer SUM
(run1+run2+run3 MF TF SUM total Pearson Sig 2tailed TE4
.820 .866 1.686 .877 2.563 0.356 0.033TE2
.808 .855 1.663 .845 2.508MANOP4 .786 .786 1.571 .756 2.327 0.448 0.006MANFO3 .724 .760 1.485 .836 2.320 0.351 0.033TE3 .760 .750 1.510 .807 2.317 0.308 0.077MANOP2 .716 .785 1.501 .775 2.276 0.387 0.020MANFO1 .689 .834 1.523 .746 2.270 0.381 0.022TC4 .642 .737 1.380 .785 2.165MANOP1 .745 .791 1.536 .598 2.134 0.484 0.002TE1 .712 .733 1.446 .676 2.121MANFO4 .685 .709 1.395 .688 2.082 0.321 0.056MANRT1 .715 .662 1.377 .641 2.017MANPA1 .623 .632 1.255 .740 1.995TC6 .582 .690 1.272 .716 1.988CUSTINTE1 .701 .602 .507 1.810 1.810CUSTINTE2 .534 .583 .591 1.708 1.708GR2 .504 .562 .622 1.688 1.688MANCR4 .733 .733 .717 1.450 0.575 0.000MANRT2 .681 .634 1.315 1.315 0.319 0.055TS2 .678 .579 1.257 1.257MANFO2 .511 .511 .571 1.082 0.469 0.003TC5 .574 .574 0.574 0.363 0.027MANPA4 .558 .558 0.558MANCR2 .557 .557 0.557MANCR5 .544 .544 0.544 0.403 0.013TC2
.538 .538 0.538MANCR7 .000 .530 0.530 0.344 0.037MANPA3 .529 0.529CUSTINTE3 .524 .524 0.524MANOP3 .000 .519 0.519
Factor 1

108
A series of correlation analyses using transformed variables (Smix), which combined
the higher score items per Table 68, were performed to verify the permutation that should
produce the highest correlation with the successful development of innovative component
(SDIC). By eliminating three managerial items (MANFO3, MANFO1, and MANF04) and
eliminating three technical items (TE4, TE2, and TE1) it was possible to reach a Pearson
correlation of 0.606, which explains 36.7 percentage variations of the SDIC. The
SMixTFMF13 combination shows the highest correlation score as illustrated in Table 69.
Table 69
Higher Correlation Numbers from the Factor Analysis Percentage Explain SDIC
SMixTFMF1 SMixTFMF2 SMixTFMF3 SMixTFMF4 SMixTFMF5 SMixTFMF6 SMixTFMF7 SMixTFMF8 SMixTFMF9 SMixTFMF10SMixTFMF11SMixTFMF12SMixTFMF13SMixTFMF14SMixTFMF15SMixTFMF16TE4 TE4 TE4 TE4 TE4 TE4 TE4TE2 TE2 TE2 TE2 TE2 TE2 TE2 TE2MANOP4 MANOP4 MANOP4 MANOP4 MANOP4 MANOP4 MANOP4 MANOP4 MANOP4 MANOP4 MANOP4 MANOP4 MANOP4 MANOP4 MANOP4MANFO3 MANFO3 MANFO3 MANFO3 MANFO3 MANFO3 MANFO3 MANFO3 MANFO3 MANFO3 MANFO3 MANFO3 MANFO3TE3 TE3 TE3 TE3 TE3 TE3 TE3 TE3 TE3 TE3 TE3 TE3 TE3 TE3 TE3MANOP2 MANOP2 MANOP2 MANOP2 MANOP2 MANOP2 MANOP2 MANOP2 MANOP2 MANOP2 MANOP2 MANOP2 MANOP2MANFO1 MANFO1 MANFO1 MANFO1 MANFO1 MANFO1 MANFO1 MANFO1 MANFO1 MANFO1 MANFO1 MANFO1 MANFO1 MANFO1TC4 TC4 TC4 TC4 TC4 TC4 TC4 TC4 TC4 TC4 TC4 TC4 TC4 TC4MANOP1 MANOP1 MANOP1 MANOP1 MANOP1 MANOP1 MANOP1 MANOP1 MANOP1 MANOP1 MANOP1 MANOP1 MANOP1 MANOP1TE1 TE1 TE1MANFO4 MANFO4MANRT1
Pearson 0.554 0.578 0.589 0.596 0.576 0.565 0.586 0.599 0.605 0.539 0.596 0.593 0.606 0.604 0.603 0.519Sig 2tailed 002 001 001 000 001 001 001 000 000 001 000 000 000 000 000 002
% 30.7 33.4 34.7 35.5 33.2 31.9 34.3 35.9 36.6 29.1 35.5 35.2 36.7 36.5 36.4 26.9
A further analysis based on individual Pearson correlation values was used in order to
continue the investigation. Table 70 combined the items with higher individual Pearson
correlation numbers. The individual correlation is displayed in yellow, from higher to lower
scores. The correlation Pearson numbers below 0.3 are not shown on the Table 70. It was
defined as a blend of technical items and managerial items with Pearson correlations above
0.351. The Pearson 0.351 number was arbitrary, based on literature suggesting that
researchers consider 0.3-0.4 a common range. Two items are from the technical realm (TC5
and TE4), and seven items are from the managerial realm (MANCR4, MANOP1, MANFO2,

109
MANOP4, MANCR5, MANOP2, and MANFO1). The two items from the technical realm
are split between technical enabler and technical capability. The seven items from the
managerial realm are distributed as follows: two items from creativity, three items from
openness, and two items from future orientation, composing the higher correlation numbers
from individual Pearson correlation against successful development of innovative component
(SDIC).
Table 70
Higher Individual Pearson Correlation with SDIC
FArun1 FArun2 FArun3 FArun4 FArun5
label Overall items MF+GR+Customer TF+GR+Customer MF TF Pearson Sig 2tailedMANCR4 .733 .717 0.575 0.000MANOP1 .745 .791 .598 0.484 0.002MANFO2 .511 .571 0.469 0.003MANOP4 .786 .786 .756 0.448 0.006MANCR5 .544 0.403 0.013MANOP2 .716 .785 .775 0.387 0.020MANFO1 .689 .834 .746 0.381 0.022TC5 .574 0.363 0.027TE4 .820 .866 .877 0.356 0.033MANFO3 .724 .760 .836 0.351 0.033MANCR7 .530 0.344 0.037MANFO4 .685 .709 .688 0.321 0.056MANRT2 .681 .634 0.319 0.055TE3 .760 .750 .807 0.308 0.077TE2 .808 .855 .845TC4 .642 .737 .785TE1 .712 .733 .676MANRT1 .715 .662 .641MANPA1 .623 .632 .740TC6 .582 .690 .716CUSTINTE1 .701 .602 .507CUSTINTE2 .534 .583 .591
GR2 .504 .562 .622TS2 .678 .579MANPA4 .558MANCR2 .557TC2 .538MANPA3 .529CUSTINTE3 .524MANOP3 .519
Factor 1 A series of correlations between the transformed variables (Pmix) were performed to
verify the combination of items that should produce the highest correlation result with the
successful development of innovative component (SDIC). By eliminating three managerial

110
items (MANCR5, MANOP2, and MANF01) and keeping the two technical items, it was
possible to reach a Pearson correlation of 0.727, which explains the 52.9% variation of
SDIC. The PMixTFMF4 items combination shows the highest correlation result with SDIC
as shown in Table 71.
Table 71
Higher Individual Correlation Numbers Percentage Explain SDIC
PMixTFMF1 PMixTFMF2 PMixTFMF3 PMixTFMF4 PMixTFMF5 PMixTFMF6 PMixTFMF8 PMixTFMF9 MANCR4 MANCR4 MANCR4 MANCR4 MANCR4 MANCR4 MANCR4
MANOP1 MANOP1 MANOP1 MANOP1 MANOP1 MANOP1 MANOP1 MANOP1
MANFO2 MANFO2 MANFO2 MANFO2 MANFO2 MANFO2 MANFO2 MANFO2
MANOP4 MANOP4 MANOP4 MANOP4 MANOP4 MANOP4 MANOP4
MANCR5 MANCR5 MANCR5
MANOP2 MANOP2
MANFO1
TC5 TC5 TC5 TC5 TC5 TC5 TC5
TE4 TE4 TE4 TE4 TE4 TE4 TE4
Pearson 0.706 0.717 0.726 0.727 0.712 0.677 0.682 0.702 Sig
2tailed 000 000 000 000 000 000 000 000 % 49.8 51.4 52.7 52.9 50.7 45.8 46.5 49.3
A descriptive statistics analysis was performed to access the reliability of
PMixTFMF4. The results are shown in Tables 72 and 73. It was found to be a “good”
Cronbach’s Alpha (0.779) for the six-item scale. All items have a Sig 2-tailed below 0.05,
considering individual correlation with successful development of innovative component
(SDIC) as illustrated in Table 74.
Table 72
PMix TFMF4 Cronbach’s Alpha
Reliability Statistics
Cronbach's
Alpha N of Items
.779 6

111
Table 73
PMix TFMF4 Item Statistics
Item Statistics
Mean Std. Deviation N
MANCR4 3.73 1.020 44
MANOP1 3.27 1.065 44
MANFO2 3.27 1.128 44
MANOP4 3.14 1.069 44
TC5 3.55 .999 44
TE4 2.57 1.169 44
Table 74
Correlations of Individual PMixTFMF4 Items
SUMSDIC MANCR4 MANOP1 MANFO2 MANOP4 TE4 TC5
Pearson Correlation 1 .575** .484** .469** .448** .356* .363*
Sig. (2-tailed) .000 .002 .003 .006 .033 .027
N 37 37 37 37 36 36 37
Pearson Correlation .575** 1 .566** .513** .502** .389** .353**
Sig. (2-tailed) .000 .000 .000 .000 .006 .009
N 37 54 51 54 52 48 54
Pearson Correlation .484** .566** 1 .408** .684** .296* .272
Sig. (2-tailed) .002 .000 .003 .000 .048 .051
N 37 51 52 52 50 45 52
Pearson Correlation .469** .513** .408** 1 .434** .249 .155
Sig. (2-tailed) .003 .000 .003 .001 .088 .258
N 37 54 52 55 53 48 55
Pearson Correlation .448** .502** .684** .434** 1 .512** .294*
Sig. (2-tailed) .006 .000 .000 .001 .000 .032
N 36 52 50 53 53 47 53
Pearson Correlation .356* .389** .296* .249 .512** 1 .271
Sig. (2-tailed) .033 .006 .048 .088 .000 .062
N 36 48 45 48 47 48 48
Pearson Correlation .363* .353** .272 .155 .294* .271 1
Sig. (2-tailed) .027 .009 .051 .258 .032 .062
N 37 54 52 55 53 48 55
TC5
**. Correlation is significant at the 0.01 level (2-tailed).
*. Correlation is significant at the 0.05 level (2-tailed).
MANCR4
MANOP1
MANFO2
MANOP4
TE4
SUMSDIC
Table 75 summarizes the factor analysis and correlation interactions performed. Two
items (MANOP4 and MANOP1) consistently appear in all managerial and overall analyses
performed. Two items (MANFO1 and MANOP2) appear in four out of five managerial
analyses. Two items (MANCR4 and MANFO2) appear in three out of five managerial
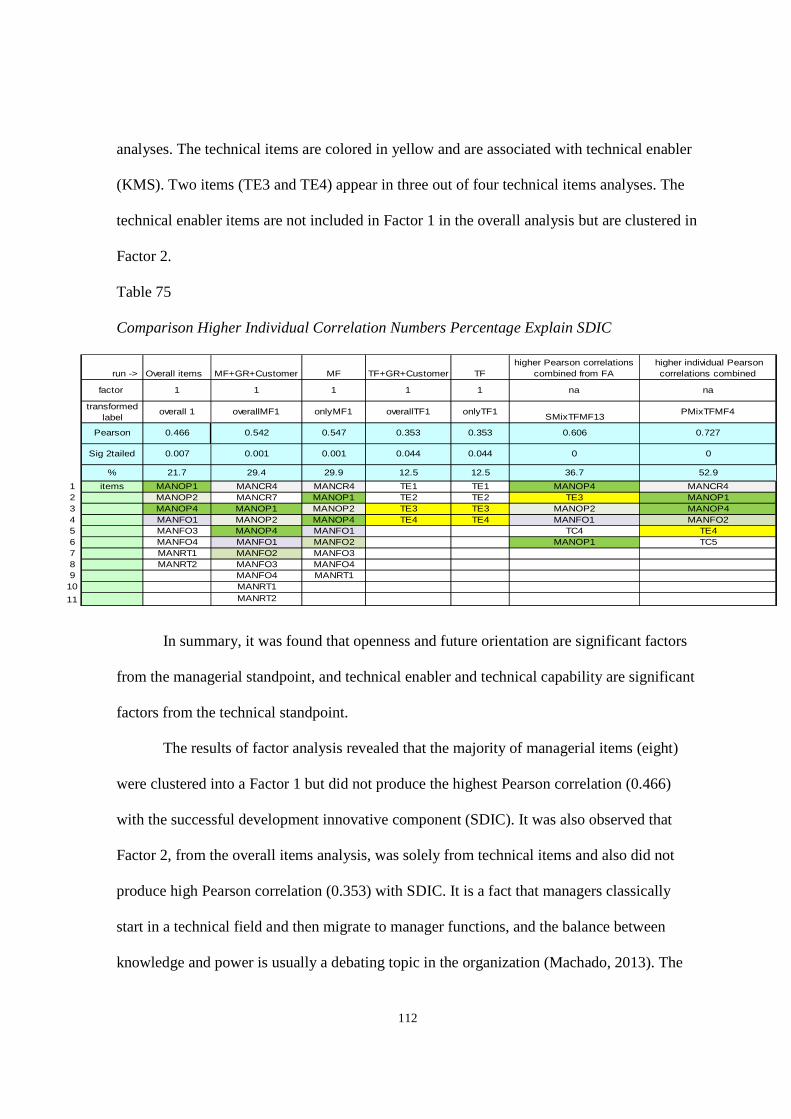
112
analyses. The technical items are colored in yellow and are associated with technical enabler
(KMS). Two items (TE3 and TE4) appear in three out of four technical items analyses. The
technical enabler items are not included in Factor 1 in the overall analysis but are clustered in
Factor 2.
Table 75
Comparison Higher Individual Correlation Numbers Percentage Explain SDIC
run -> Overall items MF+GR+Customer MF TF+GR+Customer TFhigher Pearson correlations
combined from FA higher individual Pearson
correlations combined
factor 1 1 1 1 1 na na
transformed label
overall 1 overallMF1 onlyMF1 overallTF1 onlyTF1SMixTFMF13
PMixTFMF4
Pearson 0.466 0.542 0.547 0.353 0.353 0.606 0.727
Sig 2tailed 0.007 0.001 0.001 0.044 0.044 0 0
% 21.7 29.4 29.9 12.5 12.5 36.7 52.9
1 items MANOP1 MANCR4 MANCR4 TE1 TE1 MANOP4 MANCR42 MANOP2 MANCR7 MANOP1 TE2 TE2 TE3 MANOP13 MANOP4 MANOP1 MANOP2 TE3 TE3 MANOP2 MANOP44 MANFO1 MANOP2 MANOP4 TE4 TE4 MANFO1 MANFO25 MANFO3 MANOP4 MANFO1 TC4 TE46 MANFO4 MANFO1 MANFO2 MANOP1 TC57 MANRT1 MANFO2 MANFO38 MANRT2 MANFO3 MANFO49 MANFO4 MANRT1
10 MANRT1
11 MANRT2
In summary, it was found that openness and future orientation are significant factors
from the managerial standpoint, and technical enabler and technical capability are significant
factors from the technical standpoint.
The results of factor analysis revealed that the majority of managerial items (eight)
were clustered into a Factor 1 but did not produce the highest Pearson correlation (0.466)
with the successful development innovative component (SDIC). It was also observed that
Factor 2, from the overall items analysis, was solely from technical items and also did not
produce high Pearson correlation (0.353) with SDIC. It is a fact that managers classically
start in a technical field and then migrate to manager functions, and the balance between
knowledge and power is usually a debating topic in the organization (Machado, 2013). The

113
managers from a Tier 1 supplier firm generally come from a technical background and move
to managerial functions as part of natural career progression. Because of the technical center
environment where technical and managerial people operate in cross-functional teams, it
becomes difficult to dissociate the managerial and technical factors completely, as they are
interrelated and embedded in a technical center routine. Additional analysis, selecting and
combining items either from managerial or technical nature from Sum FA or individual
higher correlation, draw the highest correlation results with SDIC, reinforcing the fact that a
combination of items from managerial and technical natures has a better chance of conveying
higher association results with SDIC. The number of managerial items considered in the
analysis was twice as high as the technical items, which influenced the fact that more
managerial than technical items had surfaced on the factor analysis clusters. The items
related to openness and future orientation are relevant and appear in most of the analyses
from the managerial standpoint. The technical items related to technical enablers tend to
facilitate the development process and enhance the technical capabilities of the XYZ Tier 1
supplier firm. Table 76 shows the core of significant managerial items and, in bold, the items
that appear in most of the analysis.
Table 76
Significant Managerial Items
MANOP1 In this organization assistance in developing new ideas is readily available.
MANOP2 This organization is open to changes.
MANOP4 This organization is responsive to changes.
MANFO1 This organization establishes a realistic set of future goals for itself.
MANFO2 This organization effectively ensures that all managers and employees share the same vision of the future.
MANFO3 This organization conveys a clear sense of future direction to employees.
MANCR4 In this organization our ability to function creati vely is respected by the leadership

114
Table 77 shows the core of significant technical items and, in bold, the items that are
commonly present on the analysis.
Table 77
Significant Technical Items
TE1 In this organization the Knowledge Management System is available whenever is needed. TE2 In this organization the Knowledge Management System is easy for anyone to use.
TE3 In this organization the Knowledge Management System is stable, without any interruption.
TE4 In this organization the Knowledge Management System provides rapid responses. TC4 We have a good mix of technical expertise within our work group in our organization.
TC5 My work group has access to adequate state-of-the-art technologies.
The data suggest that organizational responsiveness, assistance in the development
of new ideas, respecting the ability to be creative and promotion of shared goals and vision
for the future, is significant from the managerial perspective for the XYZ Tier 1 supplier
firm. From the technical perspective, a responsiveness stable, uninterrupted knowledge
management system combined with group access of state of art technologies is also
significant for XYZ Tier 1 supplier firm.
After identifying the combination of important factors responsible for the successful
development of innovative component (SDIC), an additional correlation verification analysis
was performed using the lowest score numbers from the factor analysis table, in order to
verify that lower score items from factor analysis and previous correlations indeed should
convey lower association with SDIC criterion variable and are not significant. The results of
such verification analysis are shown in Table 78. By using items from the bottom of the
scale, it was found the Pearson correlation reduces from 0.637 to 0.104, meaning that the
combination of factors from the bottom of scale explains only a 1% variation on the
successful development innovation component (SDIC). The Sig (2-tailed) increased from

115
“000” to 0.547 and became not significant. It confirms the expectation that a combination of
lower initial individual scores will result in lower scores in the same way that a combination
of higher individual scores was demonstrated to produce higher correlation results.
Table 78
Correlation Using Non-Optimized Factors from SPSS Factor Analysis
Correlations
SUMSDIC
RotateRT1FO1RT
3
SUMSDIC Pearson Correlation 1 .104
Sig. (2-tailed) .547
N 37 36
RotateRT1FO1RT3 Pearson Correlation .104 1
Sig. (2-tailed) .547
N 36 48
Combined Factors
It was determined by a series of factor analysis interactions that a selective
composition between technical and managerial factors should present higher association with
the successful development of innovative components.
RQ2 – Are technical factors more or less relevant than managerial factors on the
successful development of internal combustion engines components at a Tier 1 supplier
firm?
A series of t-test analyses were performed in order to investigate this research
question. The t-test assesses whether the means of two groups are statistically different from
each other. By comparing the means of two groups, the t-test helps to verify whether the
groups are statistically significant. This study aimed to compare the Technical Factors and

116
the Managerial Factors and also test the PACE Award against the successful development of
innovative component (SDIC).
1. Paired samples t-test: The paired samples t-test compares the means between two
unrelated groups on the same continuous, criterion variable. In this study we were looking to
compare the means of the transformed variable labeled Sum Technical Factor (SUMTC) and
the transformed variable labeled Sum Managerial Factors (SUMMF) against the Sum of
Successful Development of Innovative Component (SUMSDIC) as a criterion variable. The
following variables certification were performed prior to running the paired samples t-test
using SPSS software.
a. The criterion variable has a measurable scale.
b. The predictor variable has two categorical independent groups.
c. There is no dependency of responses among different participants in each
category. It means no relationship between the observations in each group.
d. There is no significant outlier among the returned surveys – confirmed
using descriptive statistics.
e. The criterion variable is approximately normally distributed for each group
of the predictior variables confirmed using descriptive statistics.
f. There is homogeneity of variances.
Note: #4 , #5, and #6 have been checked using IBM SPSS.
Table 79 shows the paired sample t-test results comparing the SUMSDIC and
SUMTF, and SUMSDIC and SUMMF, respectively. Smaller standard deviation was
observed in the SUMSDIC, which had the number of returned survey instruments (N)
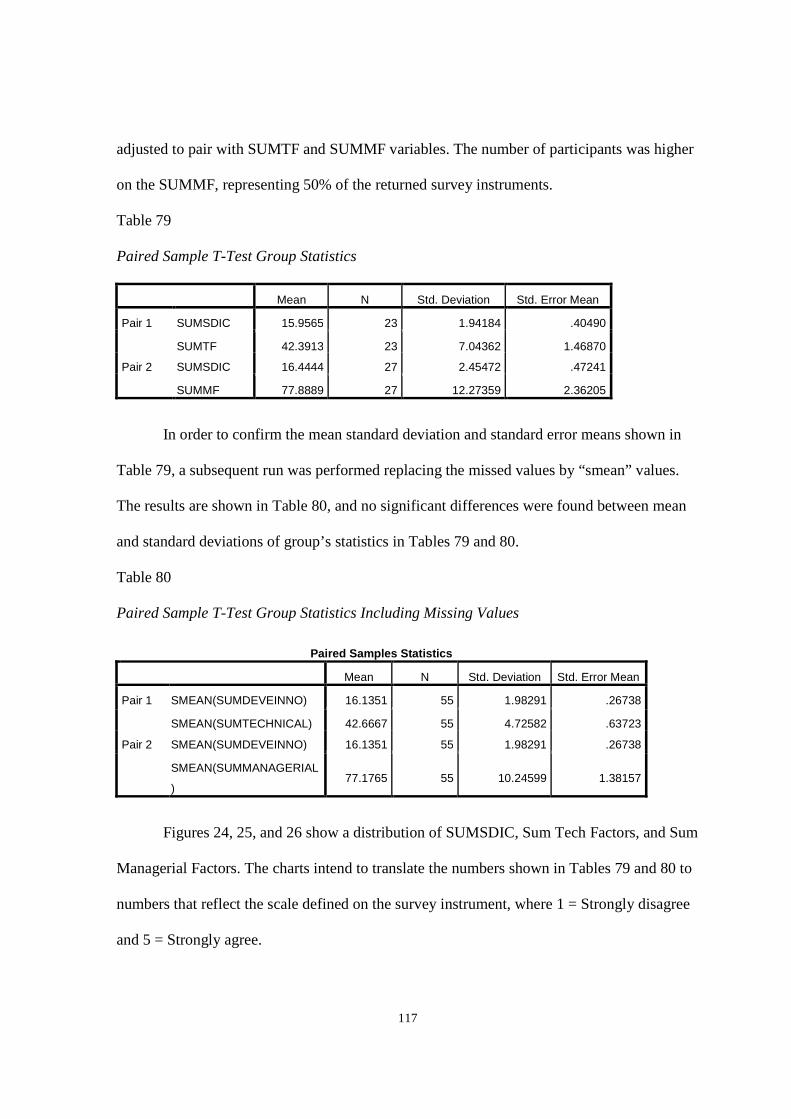
117
adjusted to pair with SUMTF and SUMMF variables. The number of participants was higher
on the SUMMF, representing 50% of the returned survey instruments.
Table 79
Paired Sample T-Test Group Statistics
Mean N Std. Deviation Std. Error Mean
Pair 1 SUMSDIC 15.9565 23 1.94184 .40490
SUMTF 42.3913 23 7.04362 1.46870
Pair 2 SUMSDIC 16.4444 27 2.45472 .47241
SUMMF 77.8889 27 12.27359 2.36205
In order to confirm the mean standard deviation and standard error means shown in
Table 79, a subsequent run was performed replacing the missed values by “smean” values.
The results are shown in Table 80, and no significant differences were found between mean
and standard deviations of group’s statistics in Tables 79 and 80.
Table 80
Paired Sample T-Test Group Statistics Including Missing Values
Paired Samples Statistics
Mean N Std. Deviation Std. Error Mean
Pair 1 SMEAN(SUMDEVEINNO) 16.1351 55 1.98291 .26738
SMEAN(SUMTECHNICAL) 42.6667 55 4.72582 .63723
Pair 2 SMEAN(SUMDEVEINNO) 16.1351 55 1.98291 .26738
SMEAN(SUMMANAGERIAL
) 77.1765 55 10.24599 1.38157
Figures 24, 25, and 26 show a distribution of SUMSDIC, Sum Tech Factors, and Sum
Managerial Factors. The charts intend to translate the numbers shown in Tables 79 and 80 to
numbers that reflect the scale defined on the survey instrument, where 1 = Strongly disagree
and 5 = Strongly agree.

118
Figure 24. SDIC frequencies using the survey instrument scale.
Mean = 3.88
Mode = 4
“Somewhat agree”
Figure 25. Technical factors frequency using the survey instrument scale.
Mean = 3.34
Mode = 2.85
“Neutral”

119
Figure 26. Managerial factors frequency using the survey instrument scale.
Mean =3.10
Mode = 3.5
“Neutral” to “Somewhat agree”
Table 81 shows the results of paired samples correlations between the successful
development of innovative component, the Sum of Technical Factor, and Sum of Managerial
Factors, discarding the missing items. The managerial factors show a higher correlation,
0.496, than the technical factors, 0.267.
Table 81
Paired Sample T-Test Correlations (Missing Items)
Paired Samples Correlations
N Correlation Sig.
Pair 1 SUMSDIC & SUMTF 23 .267 .218
Pair 2 SUMSDIC & SUMMF 27 .496 .009
Table 82 shows the results of paired samples correlations replacing the missing items
by “smean” from the Sum of Technical Factors and items from Sum of Managerial Factors.

120
Table 82
Paired Sample T-Test Correlations (Replacing Missing Items by smean)
Paired Samples Correlations
N Correlation Sig.
Pair 1 SMEAN(SUMDEVEINNO) &
SMEAN(SUMTECHNICAL) 55 .161 .240
Pair 2 SMEAN(SUMDEVEINNO) &
SMEAN(SUMMANAGERIA) 55 .359 .007
Table 82 shows an output comparison of paired t-test correlations. The Pearson
results are higher for the Sum Managerial Factor, 0.496 and 0.359, respectively, than the
Sum Technical Factors (0.267 and 0.161). The Sum of Managerial Factors could explain the
13% to 24.6% variation on the Successful Development Innovative component. The Sum of
Technical Factors could explain no more than 7%, and the correlation is not significant. The
replacement of the missing items by “smean” did not change significantly the results.
Table 83 shows the complete output of paired samples t-tests comparing the
successful development of innovative components against the sum of technical factors and
comparing the successful development of innovative components against the sum of
managerial factors.
Table 83
Paired Sample T-Test Comparison (Replacing Missing Items by smean)
Lower Upper
Pair 1 SMEAN(SUMDEVEINNO) - SMEAN(SUMTECHNICAL) -26.53153 4.82140 .65012 -27.83494 -25.22812 -40.810 54 .000
Pair 2 SMEAN(SUMDEVEINNO) - SMEAN(SUMMANAGERIAL) -61.04134 9.71129 1.30947 -63.66667 -58.41600 -46.615 54 .000
Paired Samples Test
Paired Differences
t df Sig. (2-tailed)MeanStd.
DeviationStd. Error
Mean
95% Confidence Interval of the Difference

121
Table 83 shows that the pair one (successful development of innovative component
and technical factor) and the pair two (successful development of innovative component and
managerial factor) are significant. The results show that managerial factors have higher mean
and standard deviation.
2. One sample t-test: A one-sample test was performed to compare the Summary of
Technical Factors (SUMTF transformed variable) and Summary of Managerial Factors
(SUMMF transformed variable) among the returned survey instruments. Table 84 shows the
results of descriptive statitics for the Sum of Technical Factors and Sum of Managerial
Factors.
Table 84
One Sample T-Test Statistics
One-Sample Statistics
N Mean Std. Deviation Std. Error Mean
SUMTF 27 42.6667 6.81063 1.31071
SUMMF 34 77.1765 13.10672 2.24778
The mean is higher for the Sum of Managerial Factors (77.17) than the Sum of
Technical Factors (42.7). By converting the mean numbers from the Table 84, it was found
that the Technical Factors is 3.3 on the 1 to 5 scale as defined in the survey instrument and
the Managerial Factors is 3.2 on the 1 to 5 scale as defined on survey scale instrument, where
1 is strongly disagree and 5 is strongly agree. Based exclusively on the numbers presented in
Table 84, it was not possible to determine the significance between the technical and
managerial factors. The one-sample test as shown in Table 85 provided additional
comparative results.

122
Table 85
One Sample T-Test
One-Sample Test
Test Value = 0
t df Sig. (2-tailed) Mean Difference
95% Confidence Interval of the
Difference
Lower Upper
SUMTF 32.552 26 .000 42.66667 39.9725 45.3609
SUMMF 34.334 33 .000 77.17647 72.6033 81.7496
Useful information is shown in Table 85 considering the two groups associated with
technical factors and managerial factors. The mean and standard deviation of managerial
factors are higher than those of technical factors, and both show a Sig (2-tailed) = 0.000.
Despite the higher standard deviation and standard error mean, Table 85 suggests, with 95%
confidence interval, that the managerial factors have a higher association with on the factors
that contribute to the success of development of internal engine components.
3. Independent t-test PACE Award assessment: An independent t-test was also
performed considering the Successful Development of Innovative Component as a criterion
variable and the PACE award divided into two groups: employees involved in the PACE
award activities, called group one (1), and employees who were not involved in the PACE
award activities, called group two (2). The results are shown in Table 86.

123
Table 86
PACE Independent T-Test Group Statistics
Group Statistics
PACE Award involvement N Mean Std. Deviation Std. Error Mean
SUMSDIC YES 20 16.3000 2.47301 .55298
NO 16 15.6875 2.27211 .56803
The group statistics comparing the employees who are involved with PACE awards
activities and the employees who are not did not show a significant difference between the
means, standard deviations, and standard error.
Table 87 shows the complete output of independent sample tests for the PACE award
against the successful development of innovative components.
Table 87
Independent T-Test PACE Award
Lower Upper
.113 .739 .765 34 .449 .61250 .80045 -1.01420 2.23920
.773 33.295 .445 .61250 .79275 -.99981 2.22481
SUMSDIC
Independent Samples Test
Levene's Test for Equality of Variances t-test for Equality of Means
F Sig. t df Sig. (2-tailed) Mean DifferenceStd. Error Difference
95% Confidence Interval of the Difference
Table 87 shows that the mean and standard deviations between the employees who
are involved with PACE award activities and employees who are not involved with PACE
Award activities are technically the same. The results indicate that there is no statistical
significance between employees who were involved (16.3+/- 2.46) and employees who were
not ( 15.7+/- 2.27). t (34)=0.765. Sig ( 2-tailed)=0.449.

124
RQ3 – What is the relationship between technical factors and the successful
development of innovative ICE component firm?
A. Technical Capabilities
B. Technical Strength
C. Technical Enabler - Knowledge Management Systems (KMS)
Table 88 shows a summary correlation between the technical factors and successful
development of innovative components.
Table 88
Technical Factors Correlations with SUMSDIC
Correlations
SUMSDIC SUMTC SUMTS SUMTE SUMTF
SUMSDIC Pearson Correlation 1 .399* .190 .353* .267
Sig. (2-tailed) .016 .344 .044 .218
N 37 36 27 33 23
SUMTC Pearson Correlation .399* 1 .596** .395* .642**
Sig. (2-tailed) .016 .000 .011 .000
N 36 52 31 41 27
SUMTS Pearson Correlation .190 .596** 1 .431* .805**
Sig. (2-tailed) .344 .000 .020 .000
N 27 31 33 29 27
SUMTE Pearson Correlation .353* .395* .431* 1 .837**
Sig. (2-tailed) .044 .011 .020 .000
N 33 41 29 42 27
SUMTF Pearson Correlation .267 .642** .805** .837** 1
Sig. (2-tailed) .218 .000 .000 .000
N 23 27 27 27 27
*. Correlation is significant at the 0.05 level (2-tailed).
**. Correlation is significant at the 0.01 level (2-tailed).

125
The technical capabilities (TC) and technical enabler (TE) factors show the best
correlations with the SUMSDIC with Sig (2-tailed) below 0.05 (significant). The technical
capability factor shows a Pearson correlation of 0.399, and the technical enabler factor shows
a Pearson of 0.353. The technical enabler factor and technical capability factor were found to
be important, confirming what was observed in the factor analysis discussed in the research
Question 1. Although good correlations were found between the technical factors, the
technical strength (TS) showed the lowest correlation with SUMSDIC (0.190). The
transformed sum of technical factors (SUMTF) can explain about 7% of the variation on the
successful development of innovative component.
RQ4 – What is the relationship between managerial factors and the successful
development of innovative ICE component firm?
A. risk-taking
B. future orientation
C. openness
D. creativity
E. proactiveness
Table 89 shows the summary correlation between the technical factors and successful
development of innovative components.

126
Table 89
Managerial Factors Correlations with SUMSDIC
The creativity, openness, and future orientation managerial factors show Pearson
correlations with successful development of innovative component (SUMSDIC) above 0.45
and Sig (2-tailed) below 0.05 and therefore significant. The creativity shows the highest
correlation, 0.599, followed by openness (0.511) and future orientation (0.459). The
proactiveness factor has a correlation of 0.228, and risk-taking a negligible negative
correlation (-0.053). The managerial transformed variable shows a correlation of 0.496. The
transformed sum of managerial factor (SUMMF) can explain about 25% of the variation on
the successful development of innovative component.

127
RQ5 – Does customer integration moderate the relationship between technical
and/or managerial factors’ contributions to the successful development of ICE
components at a Tier 1 supplier firm?
The following data analysis was performed to verify for correlation between the
criterion variable Successful Development of Innovative Component (SDIC) and Technical
and/or Managerial Factors (predictor variables) using Customer Integration (CUSTINTE)
and PACE award to verify changes on the corrleation strength. Table 90 shows the plan used
to run the analsyis.
Table 90
Customer Integration -Correlation Strength Analysis Plan
Variable Label
SDIC SDIC (CUSTINTE
"change")SDIC (PACE
"change")
PACE Award Involvement PACE - - -Customer Integration CUSTINTE Y N Y
Sum Technical Factors SUMTC Y Y YSum Managerial Factors SUMMF Y Y Y
Criterion Variable
Table 91 shows the results of correlation analysis using customer integration and
PACE to verify changes on the correlation strength. For the purpose of the analysis, the
customer integration and PACE variables were transformed and divided into two groups,
where the number 1 signifies less than 50% of overall variable spread in this case, indicating
neutral to strong disagreement with the survey instrument statement. In a similar way, the
number 2 signifies more than 50% of the overall variable spread in this case, indicating
neutral to strong agreement with the survey instrument statement.

128
Table 91
Summary Customer Integration – Correlation Strength Analysis Results
Variable Label Parameter
SDIC SDIC (CUSTINTE
"change") SDIC (PACE "change")
PACE Award Involvement PACE - - -Customer Integration CUSTINTE Pearson -0.330 N 1=-0.400; 2=0.422
Sig. (2-tailed) 0.061 N 1=0.111; 2=0.117Sum Technical Factors SUMTC Pearson 0.267 1=0.558; 2=0.197 1=0.052; 2=0.497
Sig. (2-tailed) 0.218 1=0.118; 2=0.519 1=0.878; 2=0.100Sum Managerial Factors SUMMF Pearson 0.496 1=0.697; 2=0.314 1=0.421; 2=0.486
Sig. (2-tailed) 0.009 1=0.012; 2=0.320 1=0.092; 2=0.1851= less than 50% , 2=more than 50%
Criterion Variable
The results of Table 91 suggest that customer integration and the PACE award
moderates the relationship between the technical factor and successful development of
innovative components. The correlation is higher with less customer integration (0.558) and
lower with more customer integration (0.197), and in both cases they are not significant (Sig
2-tailed 0.118 and 0.519). The PACE award involvement also moderates the relationship
between the technical factors and the successful development of innovative components, but
in an opposite way. Higher correlation is observed with higher involvement with the PACE
award and lower correlation with lower involvement, but in both cases they are not
significant (Sig 2-tailed 0.878 and 0.100).
The results of Table 90 also suggest that customer integration and the PACE award
moderates the relationship between the managerial factor and the successful development of
innovative components. The correlation is higher with less customer integration (0.697) and
it is significant (Sig 2-tailed 0.012). The correlation is lower with more customer integration
(0.314), but it is not significant (Sig 2-tailed 0.320).

129
Appendix P shows detailed correlations of successful development innovative
components, government regulations, customer integration, technical factors, and managerial
factors used in Table 90.
RQ6 – Do government regulations moderate the relationship between technical
and/or managerial factors’ contributions on the successful development of ICE
components at a Tier 1 supplier firm?
The following data analysis was performed to verify the correlation between the
criterion variable Successful Development of Innovative Components (SDIC) and the
Technical and/or Managerial Factors (predictior variables), using Government Regulations
(GR), and PACE award to verify changes on the correlation strength.Table 92 shows the plan
used to run the analsyis.
Table 92
Government Regulations - Correlation Strength Analysis Plan
Variable Label
SDIC SDIC (GR "change")SDIC (PACE
"change")
PACE Award Involvement PACE - - -Government Regulations GR Y N Y
Sum Technical Factors SUMTC Y Y YSum Managerial Factors SUMMF Y Y Y
Criterion Variable
Table 93 shows the result of correlation analysis using government regulations and
PACE to verify changes on the correlation strength. For the purpose of the analysis, the
government regulations and PACE variables were transformed and divided into two groups
where the number one (1) signifies less than 50% of overall variable spread in this case,
indicating neutral to strong disagreement with the survey instrument statement. In similar
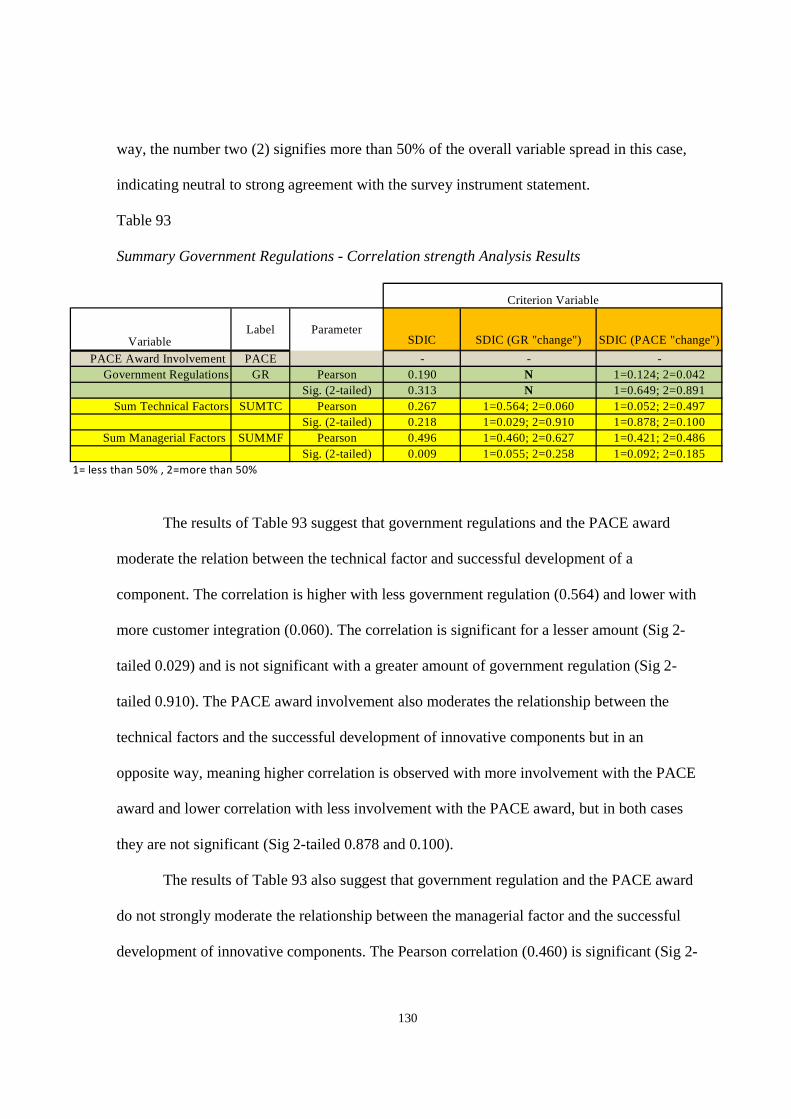
130
way, the number two (2) signifies more than 50% of the overall variable spread in this case,
indicating neutral to strong agreement with the survey instrument statement.
Table 93
Summary Government Regulations - Correlation strength Analysis Results
Variable Label Parameter
SDIC SDIC (GR "change") SDIC (PACE "change")
PACE Award Involvement PACE - - -Government Regulations GR Pearson 0.190 N 1=0.124; 2=0.042
Sig. (2-tailed) 0.313 N 1=0.649; 2=0.891Sum Technical Factors SUMTC Pearson 0.267 1=0.564; 2=0.060 1=0.052; 2=0.497
Sig. (2-tailed) 0.218 1=0.029; 2=0.910 1=0.878; 2=0.100Sum Managerial Factors SUMMF Pearson 0.496 1=0.460; 2=0.627 1=0.421; 2=0.486
Sig. (2-tailed) 0.009 1=0.055; 2=0.258 1=0.092; 2=0.1851= less than 50% , 2=more than 50%
Criterion Variable
The results of Table 93 suggest that government regulations and the PACE award
moderate the relation between the technical factor and successful development of a
component. The correlation is higher with less government regulation (0.564) and lower with
more customer integration (0.060). The correlation is significant for a lesser amount (Sig 2-
tailed 0.029) and is not significant with a greater amount of government regulation (Sig 2-
tailed 0.910). The PACE award involvement also moderates the relationship between the
technical factors and the successful development of innovative components but in an
opposite way, meaning higher correlation is observed with more involvement with the PACE
award and lower correlation with less involvement with the PACE award, but in both cases
they are not significant (Sig 2-tailed 0.878 and 0.100).
The results of Table 93 also suggest that government regulation and the PACE award
do not strongly moderate the relationship between the managerial factor and the successful
development of innovative components. The Pearson correlation (0.460) is significant (Sig 2-

131
tailed 0.055) with less involvement with government regulations and increases to 0.627 but is
still not significant (Sig 2-tailed = 0.258) with more involvement with government
regulations. The PACE award involvement does not moderate the relationship between the
managerial factors and the successful development of innovative components.
Appendix P shows detailed correlations of successful development innovative
components, government regulations, customer integration, technical factors, and managerial
factors used in Table 93.
RQ 7 – Is there an association between demographics and the successful
development of innovative ICE components at a Tier 1 supplier firm?
Age Group
Title
Function
Component application
Component type
PACE
A series of correlation analyses were performed in order to investigate this research
question. Table 94 displays the Pearson correlation results between the successful
development of innovative components and the demographics variables and the correlation
among the demographic variables.

132
Table 94
Summary of Demographic Correlations
The type of component shows the highest Pearson correlation (0.315) with the
successful development of innovative components with Sig 2-tailed of 0.058. The other
demographic variables did not show significant correlations with the successful development
of innovative components and, in three cases, slight negative correlation. The two highest
correlations among the demographics were found between the age group and title (manager
or engineer) - 0.480 with Sig 2-tailed 0.000 and between the PACE Award and product
application - 0.393 with Sig 2-tailed 0.003 both cases shown negative correlation.
RQ 8 – Are the automotive applications more or less frequent than truck
applications on the successful development of innovative ICE components at a Tier 1
supplier firm?

133
A descriptive analysis was performed to investigate the frequency in which
employees from the XYZ Tier 1 supplier firm work in one particular engine component
application or multiple engine component applications.
Table 95
Product Application Frequency
Product Application
Frequency Percent Valid Percent
Cumulative
Percent
Valid Auto Engines 12 20.3 21.8 21.8
Truck Engines 12 20.3 21.8 43.6
Both Auto and Truck Engines 31 52.5 56.4 100.0
Total 55 93.2 100.0
Table 95 illustrates that the majority of respondents are involved in both auto and
truck internal combustion engines components. The involvement in multiple product
applications can be considered typical in the power train supplier business because of close
interactions between power train engine components. Past experience has shown that
employees successfully handle multiple component applications. It has been found that the
synergy among different applications improves the employees’ performance since knowledge
acquired in one component application is naturally transferred to another application and
vice-versa, keeping in mind the differences between applications.

134
Figure 27. Product Application chart comparison.
Figure 28. Pie chart employee product application.

135
In summary, the frequency of employees working in automotive engine application
and truck engine application is the same (12). There are approximately three times more
employees working with both auto and engine than with auto or truck application
individually.
Table 96
Correlation Between the Engine Component Application and the SDIC
Correlations
SUMSDIC
Product
Application
SUMSDIC Pearson Correlation 1 -.010
Sig. (2-tailed) .953
Sum of Squares and Cross-
products 212.324 -.757
Covariance 5.898 -.021
N 37 37
Product Application Pearson Correlation -.010 1
Sig. (2-tailed) .953
Sum of Squares and Cross-
products -.757 36.436
Covariance -.021 .675
N 37 55
There is no correlation between the engine component application and the successful
development of innovative engine components.
Summary
In Chapter 4, a five-step approach was used to analyse the data. The first step was to
perform a demographic assessment in order to verify whether the number of returned survey
instruments had sufficient information to cover the different research questions of the study.
In the second step, analyses were performed to verify whether the Cronbach’s Alphas were

136
within an acceptable range. The transformed technical and managerial factors variables
showed good and excellent Cronbach’s Alpha, and the Successful Development of
Innovative engine components criterion variable showed acceptable values. The third and
fourth steps addressed the research questions individually by performing statistical analsyses:
descriptive analsyis, factor analysis, t-test analysis, correlation analysis, and the strength of
correlations using different variables. Finally, step five was to summarize the findings,
highlighing key points and contributions based on individual research questions.
Chapter 5 elaborated on the conclusions found from the data analysis,
recommendations for future studies, and implications based on the conclusions drawn from
the study.

137
Chapter 5: Conclusions and Recommendations
Introduction
Chapter 5 includes a synopsis of the purpose of the study and the methodology used
to form conclusions based on data analysis. Recommendations and implications have been
defined through this research study.
Summary
This study aimed to assess critical factors associated with the successful development
of innovative ICE components in a North American XYZ Tier 1 supplier firm. The study
focused on the technical and managerial organization subsystems, concentrating on technical
and managerial employees who work primarily in technical center facilities. The study was
designed to evaluate the topic of successful development of innovative components for ICE
from a Tier 1 supplier firm’s perspective. It is a broad-based exploratory study that attempts
to accomplish the following objectives:
1. Identify technical and managerial factors critical to the successful development of
innovative components for internal combustion engines.
2. Identify associations between the technical and managerial factors.
3. Determine whether technical factors are more or less significant to the successful
development of innovative components for internal combustion engines.
4. Establish a combination of factors that represents significant correlation with the
successful development of innovative components for IEC.
5. Determine associations between the PACE award and the successful development
of innovative components for an internal combustion engine.

138
6. Determine whether government regulations and/or customer integration has a
significant role in the successful development of innovative components for ICE.
Research questions will be restated one more time, followed by the conclusions
formed based on the individual analysis performed. At the end of the chapter an inclusive
summary is provided.
RQ1 – Is there a commonality of factors that is associated with successful
development of innovative ICE components at a Tier 1 supplier firm?
The use of a factor analysis statistical tool allowed the identification of clusters of
items well known as potential latent variables from managerial, technical, and customer
integration and government regulation nature. The latent variable is explained as “underlying
unobservable variables that are reflected in the observed variables” (Institute for Digital
Research and Education- UCLA, http://www.ats.ucla.edu/stat/spss/output/factor1.htm).
Although common items emerge repeatedly in different factor analysis interactions, the usage
of those items in correlation analysis did not provide the best association results with the
successful development of innovative components. In a nutshell, the perception from the
XYZ Tier 1 supplier firm respondents is that commonalities of factor exist but they are not
exclusive to the managerial or technical realm. The data analysis has shown “openness” and
“future orientation” items from the managerial constructs are significant and correlate with
the successful development of innovative components, in most cases entrenched in Factor 1
from factor analysis output. In the same way, the technical enabler items, from the technical
constructs, proved to be significant and also correlate with the successful development of
innovative components. Managerial and technical factors considered in isolation did not
produce the highest possible correlation with the successful development of innovative

139
components for ICE. The superior results were obtained using the highest correlation factors
from both managerial and technical. When combined, these provided the highest association
with the successful development of innovative components. It was found that it is not
possible to dissociate the items from both managerial and technical factors in this study in
order to obtain superior correlation with the successful development of innovative
components for ICE. The reasons why the managerial and technical items must be combined
might have different roots. One can be explained by the fact that engineering and managerial
employees work together in cross-functional teams, and in most cases current managers had
been working exclusively in technical fields and now became managers but still retained the
engineering background. In other words, most of the respondents in the survey instrument
had been exposed to or worked in both technical and managerial fields. The technical and
managerial factors are inherent core activities in the technical center operation, which
reinforces the theory that both are essential for the successful development of innovative
components for ICE. The composition between power that comes from the managerial
factors and knowledge that comes from the technical factors needs to be balanced in a way
that creates the superior correlation results reported in this study.
The perception from the respondents of XYZ Tier 1 supplier firm is that “openness”
items and “future orientation” items from the managerial factor standpoint are significant
contributors for the association with the successful development of innovative components.
The technical enabler items (knowledge management systems) and some technical capability
items are significant from the technical factors’ point of view and paramount for the
association with the successful development of innovative components for ICE. The items
related to risk-taking, creativity, and proactiveness were not significant from the managerial

140
point of view. The items related to technical strength construct proved not significant in the
association with the successful development of innovative components for ICE.
Another conclusion from the factor analysis was that the contribution of factors
related to government regulations and customer integration were not significant and showed
limited association results with successful development of innovative components for ICE.
The following items combined conveyed to a potential latent variable that is
significant for the successful development of innovative development components for this
particular XYZ Tier 1 supplier firm. The perception is that XYZ Tier 1 supplier firm should
be responsive to change and assist with new ideas while sharing goals and visions for the
future from the managerial perspective and while keeping stable knowledge management
systems, which support a mix of expertise personnel who use state-of-the-art technologies
from the technical perspective.
RQ2 – Are technical factors more or less relevant than managerial factors to the
successful development of ICE components at a Tier 1 supplier firm?
The t-test analysis used to answer this research question revealed that managerial
factors are significant with Sig (2-tailed) below 0.05 and could explain a 24.6% variation on
the successful development of innovative components for ICE. The sum of technical factors
could explain no more than 7%, and the correlation is not significant. The analysis also
indicated that managerial factors have higher correlations with the sum of successful
development of innovative components (SUMDIC) and a lower standard deviation in
comparisom with the technical factors. The inclusion of “smean” to replace technical and
managerial factors missed items (option available on the SPSS22) did not change the results
of the analysis.

141
RQ3 – What is the relationship between technical factors and the successful
development of an innovative ICE components firm?
A. Technical Capabilities
B. Technical Strength
C. Technical Enabler - Knowledge Management Systems (KMS)
The technical capabilities (TC) and technical enabler (TE) constructs from the
technical factors realm showed the best association with the successful development of
innovative components (SUMSDIC) with Sig (2-tailed) below 0.05 (significant). The
technical capability factor showed a Pearson correlation of 0.399, and the technical enabler
factor showed a Pearson of 0.353. The technical enabler factor and technical capability factor
were found to be significant, confirming the results found in the factor analysis discussed in
Research Question 1. Although significant correlations were found between the TC, TE, and
TS technical factors, the technical strength (TS) showed the lowest association with
SUMSDIC (0.190). The transformed sum of technical factors (SUMTF) explained
approximately 7% of the variation on the successful development of innovative components
for ICE.
RQ4 – What is the relationship between managerial factors and the successful
development of innovative ICE component firm?
A. risk-taking
B. future orientation
C. openness
D. creativity
E. proactiveness

142
The “creativity,” “openness,” and “future orientation” items from the managerial
factors showed Pearson correlations above 0.45 with successful development of innovative
components (SUMSDIC) and Sig (2-tailed) below 0.05 and therefore significant. The
creativity construct showed the highest correlations (0.599), followed by openness construct
(0.511) and future orientation constructs (0.459). The proactiveness factor showed an
association of 0.228, and risk-taking showed a negligible negative association (-0.053) with
the successful development of innovative components. The transformed managerial variables
showed an association of 0.496; therefore, the transformed sum of the managerial factor
(SUMMF) explained approximately 25% of the variation on the successful development of
innovative components for ICE.
RQ5 – Does customer integration moderate the relationship between technical
and/or managerial factors’ contribution on the successful development of ICE components
at a Tier 1 supplier firm?
The perception of respondents from the XYZ Tier 1 supplier firm is that the customer
integration variable moderated the relationship between the technical factors and the
successful development of innovative components, but it was not significant. In addition,
customer integration moderated the relationship between the managerial factor and the
successful development of innovative components for ICE, and it was significant.
The results of analysis indicated that the PACE award involvement moderated the
relationship between the technical factor and the successful development of innovative
components for ICE, but they were not significant. The PACE award involvement did not
moderate the relationship between the managerial factors and the successful development of
innovative components, and it was not significant.

143
RQ6 – Do government regulations moderate the relationship between technical
and/or managerial factors’ contribution on the successful development of ICE components
at a Tier 1 supplier firm?
The perception of respondents from the XYZ Tier 1 supplier firm is that government
regulations moderated the relationship between the technical factors and the successful
development of innovative components; results showed a significant relationship. The
government regulations slightly moderated the relationship between managerial factors and
the successful development of innovative components, and it was significant. In addition, the
results indicated that PACE award involvement moderated the relationship between the
technical factor and the successful development of innovative components, and it was not
significant. Moreover, the study showed that the PACE award did not moderate the
relationship between the managerial factors and the successful development of innovative
components for ICE.
RQ 7 – Is there an association between demographics and the successful
development of innovative ICE components at a Tier 1 supplier firm?
Age Group
Title
Function
Component application
Component type
PACE
The results of the analysis did not show a significant association between the
demographics variables (included on the survey instrument) and the successful development

144
of innovative components for ICE. The highest result indicated that the type of component—
meaning pistons (aluminum/steel), engine bearings, valve seats and guides, ignition systems
(spark plugs), liners, rings, pins, and sealing systems (gaskets)—could explain 10% of the
variation on the successful development of innovative components.
The analysis shows that there was no difference between the two identified groups of
employees, one that was involved with PACE award activities and the other that was not, in
relation to the successful development of innovative components for ICE. The results
indicated that there was no statistical significance (Tables 86/87). There was a positivte
correlation betwen the PACE and function and a negative correlation between the PACE and
the product application. It is important to mention that the PACE award is a post facto
evaluation, which provides recognition of a technology that has already been deployed and
recognized by the customer and the market.
RQ 8 – Are the automotive applications more or less frequent than truck
applications on the successful development of innovative ICE components at a Tier 1
supplier firm?
The number of respondents (employees) from the XYZ Tier 1 supplier firm working
in automotive engine application was twelve. There were an equivalent number of employees
working on truck engine application. The number of respondents (employees) working in
both automotive and/or truck applications was approximately three times more than with
individual application.
There was no correlation between the engine component application and the
successful development of innovative engine components for ICE.

145
Conclusions
The factor analysis was a powerful exploratory statistical tool used in this particular
study, which provided an approximation of structure that exists between variables. The factor
analysis revealed potential latent variables that helped in the investigation of the research
questions and subsequent data analysis.
The factors present from the managerial perspective can be summarized as follows:
several items of openness constructs consistently emerged from the analysis showing the
importance of expanding from individuals to an organizational environment with managers
who support innovation and encourage its adoption rather than resist it. The openness factor
was constantly coupled with future orientation elements supporting the organization’s
readiness for change and the positioning of the organization to work on changes; it represents
a clear sense of direction that managers have regarding the business and how it has been
shared with employees of the XYZ Tier 1 supplier firm. There was one item in the creativity
construct related to management that emerged isolated and appears to be significant. This is
related to how the organization provides an environment that promotes an employee’s ability
to function creatively, which results in respect from leadership. The combination of those
emerged managerial factors is significant but did not provide the highest association score
with the successful development of innovative products. The managerial transformed
variable shows a correlation of 0.496. The transformed sum of managerial factor (SUMMF)
can explain about a 25% variation on the successful development of innovative components
for ICE. It was necessary to couple the managerial factors with the technical factor in order
to obtain the best association results with the successful development of innovative
components for ICE.

146
The factors present from the technical perspective can be summarized as follows: the
items of technical enabler constructs related to the knowledge management systems
consistently showed up in the different analyses, confirming that the organization’s ability to
allow explicit knowledge to be created, stored, retrieved, and transferred to other members in
the organization is significant. Few items associated with the technical capabilities also
appear to be significant and are related to a good mix of technical expertise in the
organization with aptitude to use adequate state-of-the-art technologies. The transformed sum
of technical factors (SUMTF) can explain about 7% of the variation on the successful
development of innovative components for ICE. The adoption of technical factors isolated
did not draw the best association with the successful development of innovative components
for ICE. In order to achieve the best association results, it was necessary to couple the
technical factors with the managerial factor.
The fact that it was necessary to mix elements of managerial and technical constructs
to develop a combined latent variable that provided superior results with the successful
development of innovative components reinforces the principles of socio-technical theory
that organization subsystems must work in tandem for the best organization results.
The following factors from the managerial perspective did not appear to be
significant: risk-taking, which is the act of doing something that involves danger or risk in
order to achieve a goal, and proactiveness, which is an organization’s pursuit of business
opportunities, whether related or unrelated to its present product lines, coupled with the
aggressive posturing relative to competitors. Both cases showed a good association with the
other managerial factors but did not emerge as a noteworthy factor when correlated with the
successful development of innovative components for ICE. Most likely the risk-taking and

147
proactiveness would be more significant if the survey instrument were directed to
organization strategic assessment. The items related to technical strength associated with the
measurement of an organization’s technological investment in development, an
organization’s productive investment in R&D, and comparison against major competitors did
not appear to be significant. Arguably, the technical center’s respondents who work
specifically on the engineering daily technical challenges might not have the in-depth
knowledge related to the technological investments and a competitor’s full assessment.
The PACE award did not present a substantial correlation with the successful
development of innovative components; however, it changed the relationship between the
technical factors and successful development of innovative components for ICE. It is
essential to mention that the PACE award is a post facto evaluation, which provides
recognition of a technology that has already been deployed and recognized by the customer
and the market. The PACE award did not drive the innovation process development in the
front end of innovation; however, it collects information related to success technology
deployment in the back end and recognizes it. That said, it is irrefutable that the PACE award
creates an ongoing internal question dialogue among the technology cross function teams
looking for the next potential technology, suitable to compete in the next year’s PACE award
event. It confirmed the findings that the PACE changed the association between the
technical factors and the successful development of innovative components for ICE.
Customer integration did not show significant correlations with the successful
development of innovative components but moderated the relationship between the technical
or managerial factors’ association with the successful developoment of innovative
components for ICE. In the literature review (Chapter 2), it was found that the customer

148
integration impact on innovation, particularly in the automotive industry, can be positive or
negative, depending on the customer and supplier relationship. Even though the previous
studies had been conducted mostly using the customers’ perception, the present study based
on the supplier perception confirmed that the customer integration can indeed be not
effective and/or can be negative in nature. It supported the Lau et al. 2010 statement that
“external integration processes on product innovation are much more uncertain in literature.
Some suggest that supplier and customer integration are positively related”, but by contrast
“other argues that product innovation may be constrained by supplier and customer
integration (p. 762). Occasionally the response can be negative because it leads to limited
strategic choices in product development or engagement with customers that are not
embracing innovation.
The government regulations did not show significant correlation with the successful
development of innovative components but moderated the relationship between the technical
or managerial factors’ association with the successful development of innovative components
for ICE.
In summary, a number of statistical tools were used to narrow the technical and
managerial factor contributions to the succesful development of innovative components for
ICE. It was found that the contribution was not limited to one isolated factor but a
combination of factors that together promoted good correlation with the successful
development of innovative components for ICE. From the managerial perpsective, “openess”
and “future orientation” were important factors, but when combined with specific technical
enabler factors increased the correlation value and were statistically significant. The
combined items—openness 1 (“In this organization assistance in developing new ideas is

149
readily available”), openness 2 (“This organization is open to changes”), future orientation 2
(“This organization conveys a clear sense of future direction to employees”), creativity 4 (“In
this organization our ability to function creatively is respected by the leadership”), technical
enabler 4 (“In this organization the Knowledge Management System provides rapid
responses”), and technical capability 5 (“My work group has access to adequate state-of-the-
art technologies”)—suggested that it was possible to optimize the association that can explain
a 52.9% variation of successful development of innovative components for ICE.
Recommendation for Future Research
The results of this study are significant since it reinforces the existence of essential
items from the managerial and technical realm that are associated with the successful
development of innovative components. The following recommendation resulting from this
study should be considered:
1. Expand the application of the developed survey instrument to other similar Tier 1
suppliers that develop components for internal combustion engines in order to validate the
conclusions drawn from this case study.
2. Consider future studies also in Tier 1 suppliers abroad to verify and confirm
whether the identified factors are common between NA and other global Tier 1 suppliers that
work with similar ICE components.
3. Consider a similar study for Tier 1 suppliers who develop components not directly
related to ICE but part of the automotive application.
4. Expand the study to other subsystems in the organization; for example, include the
production subsystem, the maintenance subsystem, and the supportive subsystem, to compare

150
and contrast the organization’s perspective from different populations inside the
organization.
5. Expand the study to members of automotive supplier associations to understand the
typical trends in this industry.
6. Expand the study to confirm the impact of customer integration association with
the successful development of innovative components in other Tier 1 supplier firms.
7. Expand the study to confirm the impact of government regulations’ association
with the successful development of innovative components in other Tier 1 supplier firms.
8. Add additional questions/statements on the survey instrument that represent the
latent variable clustered on the significant items from the factors analysis and verify whether
the correlation is greater than the ones reported in this present study.
Implications
In general, the studies in the area of product development innovation are concentrated
on the automotive customer’s perception. Though this study was focused narrowly on the
managerial and technical subsystems of a XYZ Tier 1 supplier firm, the findings have
implications beyond this particular firm. They open the discussion to review and consolidate
the main combined factors from either the managerial or technical realm that drives the
process of innovation from the supplier’s perspective. The consolidation of such factors
would help to better understand the balance between power and knowledge in the Tier 1
supplier’s technical centers and promote the best association with the successful development
of innovative components for ICE.
In addition, the study opens the discussion to review the effect of customer
integration related to innovation within supplier perspective and verify whether the

151
correlations with the successful development of innovative components follow the same
expectations from the customer’s perspective.
The study also has implications related to the government regulation where the
correlation with the successful development of innovative components showed not being
significant from the supplier technical center perspective, raising the question of how
government needs might be better communicated to the Tier 1 supplier base

152
References
Afshan, N. (2013). The performance outcome of dimensions of supply chain Integration: A
conceptual framework. Business: Theory and Practice 14 (4), 323-331.
Amagoh, F. (2008). Perspective on organizational change: Systems and complexity theories.
The Innovation Journal: The Public Sector Innovation Journal, Vol 13 (3), 1-14.
Annotated SPSS Output Factor Analysis (2015). Institute of Digital Research and Education,
UCLA Retrieved September 06/2015 from
http://www.ats.ucla.edu/stat/spss/output/factor1.htm.
Baxter, G., & Sommerville, I. (2011). Socio-technical systems: From design methods to
systems engineering. Interacting with Computers 23, 4-7.
Beavers, Amy S., Lounsbury, J. W., Richards, J. K., Huck, S. W., Skolits, G. J., &
Esquivel, S. L. (2013). Practical considerations for using exploratory factor analysis
in educational research. Practical Assessment, Research & Evaluation, 18(6).
Available online: http://pareonline.net/getvn.asp?
Benedetto, C. (1999). Identifying the key success factors in new product launch. Journal
Product Innovation Management 16, 530-544.
Carbonell, P., & Rodriguez, A. (2006). Designing teams for speedy product development:
The moderating effect of technological complexity. Journal of Business Research 59,
225-232.
Caruso, L. (2009). Roads less traveled. (Urban Land Institute’s report on the strategies for the
reduction of greenhouse-gas emissions from transportation sources). National Journal
(September 11).

153
CEPA. (2008). California Environmental Protection Agency, Air Protection Board, News
Release 08-103. Retrieved February 20, 2014, from www.arb.ca.gov.
Choi, S., Kang, Y., & Lee, H. (2008). The effects of socio-technical enablers on knowledge
sharing: An exploratory examination. Journal of Information Science 34 (5), 742-754.
Cooper, R., Edgett, S., & Kleinschmidt, E. (2002). Optimizing the stage-gate process: What
best practice companies are doing (part one). Research Technology Management
(Industrial Research Institute), 45 (5).
Datta, A., Reed. R., & Jessup, L. (2012). Factors affecting the governance of innovation
commercialization: A theoretical model. Journal of Business and Management. 18 (1)
31-59.
Eason, K. (2008). Socio-technical systems theory in the 21st century: Another half-filled
glass? Sense in Social Science: A collection of essays in honor of Dr. Klein.
Environmental Protection Agency. (2011). Final rulemaking to establish greenhouse gas
emissions standards and fuel efficiency standards for medium- and heavy-duty
engines and vehicles. EPA 420-R-11-901.
EPA and NHTSA. (2010). Emissions and improved fuel regulatory announcement EPA-420-
F-10-901. Retrieved from www.epa.org.
Espallardo, M., Castillo, F., & Orejuela, A. (2012). Learning processes, their impact on
innovation performance and the moderating role of radicalness. European Journal of
Innovation Management 15 (1), 77-98.
Evanschitzky, H., Eisend, M., Calantone, R., & Jiang, Y. (2012). Success factors of product
innovation: An updated meta-analysis. Journal of Product Innovation Management
29 (S1) 21-37.

154
Federal Register /Vol. 75, No. 88 / Friday, May 7, 2010 /Rules and Regulations.
Environmental Protection Agency Department of Transportation National Highway
Traffic Safety Administration 40 CFR Parts 85, 86, and 600; 49 CFR Parts 531, 533,
536, et al.
Fields, D. (1991). A study of work environment factors associated with the transfer of
statistical process control training to shop-floor applications. UMI Dissertation ON
9208776.
Fitzgerald, C. (2003). Wanted: Lower tier supplier innovation. Automotive News, Vol. 183,
issue 4, 44.
Forcechange. (2013). California to implement strictest standards in US. Retrieved February
6, 2014, from forcechange.com.
Ford, C. (2002). The futurity of decisions as a facilitator of organizational creativity and
change. Journal of Organizational Change Management, Vol. 15 (6), 635-646
Geels, F. (2004). From sectoral systems of innovation to socio-technical systems insights
about dynamics and change from sociology and institutional theory. Research Policy
33, 897-920.
Gliem, J., & Glien, R. (2003). Calculating, interpreting, and reporting Cronbach’s Alpha
reliability coefficient for Likert-type scales. 2003 Midwest Research to Practice
Conference in Adult, Continuing, and Community Education.
Grant, R. (2014). Contemporary strategy analysis, eighth edition, E-Book text and cases
edition, ISBN 9781119941897. John Wiley & Sons Ltd.
Haddad, C. (2002). Managing Technological Change: a strategic partnership approach.
SAGE Publications Thousand Oaks, London.

155
Hanawalt, E., & Rouse, W. (2010). Car wars: Factors underlying the success or failure of
new car programs. Systems Engineering 13 (4), 389-404.
Haugen, D. (2014). IC engine improvements for future LD and HD GHG standards. SAE
High Efficiency IC Engine Symposium, April 6 and 7, 2014.
Holweg, M. (2014), Where firm-level innovation and industrial policy meet: Consensus
roadmaps for low-carbon powertrain technologies. Journal Product Innovation
Management 31 (1), 33-42.
Horbach, J., Rammer, C., & Rennings, K. (2011). Determinants of eco-innovations by types
of environment impact. The role of regulatory push/pull technology push pull market
pull. Discuss Paper Econstore, 1-33.
Hultink, E., & Robben, H. (1995). Measuring new product success: The difference that time
perspective makes. Journal Product Innovation Development Management 12, 392-
405.
Human Subjects Approval Request Form. (2012a). Eastern Michigan University. Retrieved
from http://www.ord.emich.edu/downloads/downloads_subdir
/humansubjects/emu_forms/UHSRC_app_iform.pdf.
Janakova, H. (2012). Creative management and innovation. Creative and Knowledge Society/
International Scientific Journal. 10.2478/v10212-011-0019-7.
Jean, R., Sinkovics, R., & Hibaum, T. (2014). The effects of supplier involvement and
knowledge protection on product innovation in customer-supplier relationships: A
study of global automotive suppliers in China. Journal Product Innovation
Management 31 (1), 98-113.

156
Johnson, T. (2014). Review of advance ICE technology. SAE High-Efficiency Engine
Symposium . Detroit MI. April 2014.
Kuo, L., Wei, H., Hu, W., & Yang, H. (2013). Applying innovation theory in observing
emerging technology acceptance. International Journal of Systems Applications
Engineering and Development Vol 7 (1), 56-65.
Kyrgidou, L., & Spyorpoulou, S. (2013). Drivers and performance outcomes of
innovativeness: An empirical study. British Journal of Management, 24(3), 281-298.
Lau, A., Tang, E., & Yam, R. (2010). Effects of supplier and customer integration on product
innovation and performance: Empirical evidence in Hong Kong manufacturers.
Journal Product Innovation Management 27, 761-777.
Leedy, P., & Ormrod, J. (2012). Practical research: Planning and design (10th ed.). Upper
Saddle River, NJ: Pearson Education, Inc.
Leyla, M. (2014). The effects of organizational culture on corporate entrepreneurship.
International Journal of Business and Social Science, 5(1), 35-44.
Lin H. (2014). The impact of socialization mechanisms and technological innovation
capabilities on partnership quality and supply chain integration. Inf. Syst. E- Bus
Manage 12, 285-306.
Lin, Y. & Chen, Y. (2014). Use of Automaker’s Technological Knowledge in Component
Supplier’s Innovations: Different Effects in Different Situations. Innovation:
Management, Policy and Practice, 16(1): 126:143.
Machado, C., & Davim, J. ( 2013). Management and Engineering Innovation. ISTE UK and
John Wiley & Sons, USA.
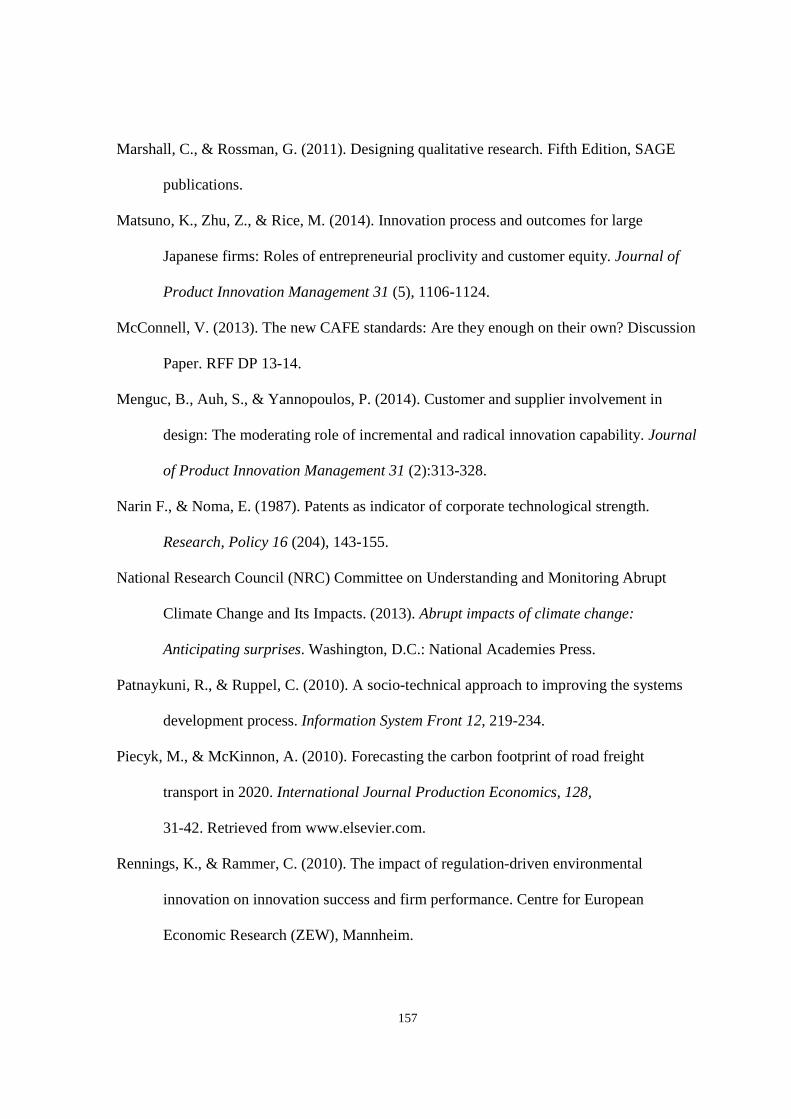
157
Marshall, C., & Rossman, G. (2011). Designing qualitative research. Fifth Edition, SAGE
publications.
Matsuno, K., Zhu, Z., & Rice, M. (2014). Innovation process and outcomes for large
Japanese firms: Roles of entrepreneurial proclivity and customer equity. Journal of
Product Innovation Management 31 (5), 1106-1124.
McConnell, V. (2013). The new CAFE standards: Are they enough on their own? Discussion
Paper. RFF DP 13-14.
Menguc, B., Auh, S., & Yannopoulos, P. (2014). Customer and supplier involvement in
design: The moderating role of incremental and radical innovation capability. Journal
of Product Innovation Management 31 (2):313-328.
Narin F., & Noma, E. (1987). Patents as indicator of corporate technological strength.
Research, Policy 16 (204), 143-155.
National Research Council (NRC) Committee on Understanding and Monitoring Abrupt
Climate Change and Its Impacts. (2013). Abrupt impacts of climate change:
Anticipating surprises. Washington, D.C.: National Academies Press.
Patnaykuni, R., & Ruppel, C. (2010). A socio-technical approach to improving the systems
development process. Information System Front 12, 219-234.
Piecyk, M., & McKinnon, A. (2010). Forecasting the carbon footprint of road freight
transport in 2020. International Journal Production Economics, 128,
31-42. Retrieved from www.elsevier.com.
Rennings, K., & Rammer, C. (2010). The impact of regulation-driven environmental
innovation on innovation success and firm performance. Centre for European
Economic Research (ZEW), Mannheim.

158
Roy, S., & Sivakumar, K. (2010). Innovation generation in upstream and downstream
business relationships. Journal of Business Research. JRB-07033.
Ruvio, A., Shoham, A., Gadot, E., & Schwabsky, N. (2014). Organizational innovativeness:
Construct development and cross-cultural validation. Journal of Product Innovation
Management 31(5), 1004-1022.
Saemundsson, R., & Candi, M. (2014). Antecedents of innovation strategies in new
technology-based firms: Interactions between the environment and founder team
composition. Journal Product Innovation Management 31 (5); 939-955.
Sewalk, S. (2010). Carbon and energy: The limitations of utility and building infrastructure.
Doctoral dissertation retrieved from http://gradworks.umi.com/34/03/3403980.html.
Simon, M. (2011). Conducting pilot studies – Excerpts adapted from Dissertation and
Scholarly Research: Recipes for Success (2011 ed.) Seattle, WA: Dissertation, LLC
http://dissertationrecipes.com/
SJSU (2015). Chapter 9 Factor Analysis (2015) . Retrieved from
http://www.sjsu.edu/people/james.lee/courses/JS203/s1/Online_4.pdf
Society of Automotive Analysts, (2013).13th Annual North American Automotive OEM –
Tier 1 Supplier Working Relations Index Study.
Song, M., & Chen, Y. (2014). Organizational attributes, market growth, and product
innovation. Journal of Product Innovation Management DOI:10.1111/jpim.12185.
Stanton, D., Charlton, S., & Vajapeyazula, P. (2013). Diesel engine technologies enabling
powertrain optimization to meet U.S. Greenhouse Gas Emissions. SAE International
2013-24-0094.

159
Steenberghen, T., & Lopez, E. (2012). Overcoming barriers to the implementation of
alternative fuels for road transport in Europe. Universidad Politecnica de Madrid.
Stewart, L. (2010). The impact of regulation on innovation in the United States: Across-
industry literaturerReview. Information and Innovation Foundation. Report can be
found http\www.iom.edu/hitsafety.
Stock, R., Totzauer F., & Zacharias, N. (2014). A closer look at cross-functional R&D
cooperation for innovativeness: Innovation-oriented leadership and human resource
practices as driving forces. Journal of Product Innovation Management 31 (5), 924-
938.
Stock, R., & Zacharias, N. (2013). Two sides of the same coin: How do different dimensions
of product program innovativeness affect customer loyalty? Journal of Product
Innovation Management 30 (3), 516-532.
Talke, K., & Heidenreich, S. (2014). How to overcome pro-change bias: Incorporating
passive and active innovation resistance in innovation decision models. Journal of
Product Innovation Management 31 (5), 894-907.
Thatcher, J., McKight, D., Baker, E., Arsal, R., & Roberts, N. (2011). The role of trust in
post adoption IT exploration: An empirical examination of knowledge management
systems. IEE Transitions on Engineering Management, Vol. 58, (1), 56-70.
Trochim, M., & Donnelly, J. (2008). The research methods knowledge base (3rd ed.).
Cengage Learning: Mason, OH.
United States Department of Transportation. http://climate.dot.gov/ghg-reduction-
strategies/fuels-technologies/alternative-fuels.html.

160
Van de Ven, A. (1986). Central problems in the management of innovation. Management
Science 32 (5); 590- 607.
Verworn, B., & Herstatt, C. (2002). The innovation process: An introduction to process
models. Department for Technology and Innovation Management, Technical
University of Hamburg (Harburg). Working paper 12.
The World Bank. (2014). Reducing black carbon emissions from diesel vehicles: Impacts,
control strategies, and cost-benefit analysis. International Bank for Reconstruction
and Development.
Wuyts, S., Dutta, S., & Stremersch, S. (2004). Portfolios of inter-firm agreements in
technology-intensive market: Consequences for innovation and profitability. Journal
of Marketing 68 (2), 88-100.
Xu, S., Wu, F., & Cavusgil, E. (2013). Complements or substitutes? Internal technological
strength, competitor alliance participation, and innovation development. Journal of
Product Innovation Management 30 (4); 750-762.

161
Appendices

162
Appendix A – Human Subjects Approval Request Form
The Eastern Michigan Human Subjects Approval Request Form is available for download at:
http://www.ord.emich.edu/downloads/downloads_subdir/humansubjects
/emu_forms/UHSRC_app_iform.pdf

163
Appendix B – UHSRC Approval

164
Appendix C – Survey Instrument Consent
Informed Consent Form
The person in charge of this study is Carmo Ribeiro. Carmo Ribeiro is a student at Eastern Michigan University. His faculty adviser is Dr. Daniel Fields. Throughout this form, this person will be referred to as the “investigator.”
Purpose of the study The purpose of this research study is to investigate the association of technical and managerial factors to the successful development of innovative ICE components at a Tier 1 supplier firm.
What will happen if I participate in this study?
Participation in this study involves answering a survey instrument that might take about 20 minutes.
What are the anticipated risks for participation?
There are no anticipated physical or psychological risks to participation. The primary risk of participation in this study is a potential loss of confidentiality. You not have to answer any questions that make you uncomfortable or that you do not want to answer.
Are there any benefits to participating?
You will not directly benefit from participating in this research.
The identification of critical managerial and or technical factors related to product innovation will benefit Tier 1 suppliers’ organization in regards to resources managing. The contribution of this research is that it will center on the supplier perspective and investigate the specific ways in which innovation occurs from inside out.
What are the alternatives to participation?
The alternative is not to participate.
How will my information be kept confidential?
We will keep your information confidential by using a code to label data with the code linked to identifiable information in a key stored separately from data. Your information will be stored in a password protected computer. We will make every effort to keep your information confidential; however, we cannot guarantee confidentiality. There may be instances where research oversight officials have access to ensure participant protections, but this should occurs, no personally identifying information would be provided.
The results of this research may be published or used for teaching. Identifiable information will not be used for these purposes.
Storing study information for future use

165
We would like to store your information from this study for future use related to Technology Management. Your information will be labeled with a code and not your name. Your information will be stored in a password-protected or locked file. Your de-identified information may also be shared with researchers outside of Eastern Michigan University. Please initial below whether or not you allow us to store your information:
__________Yes ___________No
Are there any costs to participation?
Participation will not cost you anything.
Will I be paid for participation?
You will not be paid to participate in this research study.
Study contact information
If you have any questions about the research, you can contact the Principal Investigator, Carmo Ribeiro, at [email protected] or by phone at 734 3554719. You can also contact Dr. Daniel Fields, at [email protected] or by phone at 734 487 3102.
For questions about your rights as a research subject, contact the Eastern Michigan University Human Subjects Review Committee (UHSRC) at [email protected] or by phone at 734-487-3090.
Voluntary participation
Participation in this research study is your choice. You may refuse to participate at any time, even after signing this form, with no penalty or loss of benefits to which you are otherwise entitled. You may choose to leave the study at any time with no loss of benefits to which you are otherwise entitled. If you leave the study, the information you provided will be kept confidential. You may request, in writing, that your identifiable information be destroyed. However, we cannot destroy any information that has already been published.
Statement of Consent
I have read this form. I have had an opportunity to ask questions and am satisfied with the answers I received. I give my consent to participate in this research study.
Signatures
Name of Subject
Signature of Subject Date
Name of Research Assistant
Signature of Research Assistant Date

166
Appendix D – Survey Instrument
Understanding the Relationship between Technical and Managerial
Factors and Product Innovation at a Tier 1 Engine Supplier
This is an anonymous survey instrument. Please complete each item to the best of your knowledge. Responses are neither right nor wrong, and no individual judgments will be made. Your responses will be kept in absolute confidence and used only to compile cumulative statistics for this study. Please highlight and check the box that best applies.
Age Group: under 25 26-35 36-50 51-65 over - 65
I am working as: Director/Manager
Engineer Technical Specialist Other: ____________________
I work in: Product
R&D/Technology Design Tests (lab/engine) Simulation/Analysis Materials Application Other: ____________________
I work in components for: Auto engine
Truck engine Both auto & truck engines
I work in: Engine Bearings
Lighting Ignition Systems Engine Rings Engine Liners Aluminum Pistons Steel Pistons Valve Seat and Guides Sealing Systems

167
Systems Protection Other: ____________________
I am/was involved in a PACE Award recognized component: Yes
No
For each statement below please high light and check the box that best applies.
Statement Strongly Disagree
Somewhat Disagree
Neutral Somewhat
Agree Strongly
Agree I Don’t Know
1 One of this organization greatest strength is the development of technically superior engine components.
2 In this organization the Knowledge Management System is easy for anyone to use.
3 In the last five years our firm has increased knowledge and skills for familiar products and technologies.
4 In this organization the Knowledge Management System is stable, without any interruption.
5 We have a good mix of technical expertise within our work group in our organization.
6 In this organization the Knowledge Management System is available whenever is needed.
7 One of our greatest strengths is the ability to use expertise in a technical or functional area.
8 In this organization the Knowledge Management System provides rapid responses.
9 My work group has access to adequate state-of-the-art technologies.
10 This organization has a higher level of annual R&D expenditures in comparison with the largest competitor.
11 This organization has higher proprietary technology strength in comparison with the largest competitor.
12 There is encouragement for patent initiatives in our organization.
13 This organization has the appropriate technical knowledge to compete.
14 In this organization creative solutions are often adopted.
15 This organization uses government regulations to develop component road maps.
16 In this organization we are constantly looking to develop and offer new or improved products.

168
17 Our products require integrating the customer into the value-creation process.
18 In this organization managers are expected to be resourceful problem solvers.
19
Our products require regular discussions with the customers during the development process.
Statement Strongly Disagree
Somewhat Disagree
Neutral Somewhat
Agree Strongly
Agree I Don’t Know
20 In this organization managers usually take the initiative by introducing new administrative techniques.
21 Most of the products introduced in the past few years relied on new technology.
22 In this organization managers are always searching for fresh new ways of looking at problems
23 Government regulations are discussed during component development meetings.
24 This organization effectively ensures that all managers and employees share the same vision of the future.
25 Most of the products introduced in the past few years have been well accepted by our customer.
26 This organization has a realistic vision of the future for all departments and employees.
27 Our recently developed product introductions have been successful in terms of market share.
28 This organization encourages innovative strategies, knowing well that some will fail.
29 Most of the people working in development are aware that components need to meet government regulations.
30 Our customers are involved in the value-creating process right from the start.
31 This organization likes to implement plans only if they are very certain that they will work.
32 Our recently developed product introductions have been successful in terms of customer satisfaction.
33
In this organization managers take the initiative in an effort to shape the environment to the organization’s advantage.
34 In this organization our ability to function creatively is respected by the leadership.
35 In this organization managers are often the first to introduce new ideas.

169
36
In this organization managers are encouraged to use original approaches when dealing with problems in the workplace.
37 In this organization managers are constantly seeking new opportunities for the organization.
38 This organization establishes a realistic set of future goals for itself.
Statement Strongly Disagree
Somewhat Disagree
Neutral Somewhat
Agree Strongly
Agree I Don’t Know
39 This organization is always moving toward the development of new concepts, ideas, and approaches.
40 This organization likes to take big risks.
41 In this organization assistance in developing new ideas is readily available.
42 This organization does not like to play it safe
43 This organization conveys a clear sense of future direction to employees.
44 This organization is open to changes.
45 This organization is responsive to changes.
46 This organization believes that higher risks are worth taking for higher payoffs.
47 This organization has a reputation of being innovative.
Thank you for your time and participation.
Technology Capability – based on Kyrgidou, (2013).
Technology Strength – based on Matsuno, (2014) (reflective construct).
Knowledge Management Systems (Technical Enabler) – based on Choi et.al (2008).
Managerial Innovation Climate – based on Ruvio et.al. (2014) plus Song (2014).
Customer integration – based on Stock (2013).
Successful development of innovative ICE component – scale based on Benedetto (1999) / Song (2014).
[Note: the construct names will be removed and the questions will be mixed up prior to survey administration].
170
Appendix E – PI - Research Study Introduction
Fellow,
As part of completing my PhD program in Technology Management, I need your assistance to provide information comprise of technical and managerial nature. The input will be used to address research questions associated with my dissertation on "Understanding the Relationship between Technical and Managerial Factors and Product Innovation at a Tier 1 Engine Supplier". The purpose of the study is to bring into perspective the way a “XYZ” Tier 1 supplier balances the participation of technical and managerial factors to be more innovative.
I need your input by completing a short internal survey. The survey does not require any identifying personal information and will be distributed electronically by a Research Assistant next few days including an informed consent form. I avoid to use the internet survey packages (e.g. survey Monkey) in order to preserve the email addresses.
Your input is important in this process and any information provided will
be kept confidential, and used exclusively for the purpose of the research. If you are interested in the results, please contact me and I will be glad to share the conclusions when become available.
Thank you for participating. I really appreciate your assistance in this process. Carmo Ribeiro, MLS, NPDP

171
Appendix F – RA - Research Study Introduction
Hello,
My name is XXX YYY and I am a summer intern working on the Steel Piston team at Plymouth Technical Center.
I am writing this as a follow up to the email Carmo Ribeiro sent out last week regarding his study concerning “Understanding the Relationship between Technical and Managerial Factors and Product Innovation at a Tier 1 Engine Supplier.” Attached to this email is a copy of a survey (for data collection purposes) and a consent form. Your input is very important in this process and any information provided will be kept strictly confidential and used solely for research purposes. The survey does NOT request any identifying personal information. If you choose to aid Carmo in this endeavor, you may send me your completed survey electronically by June 5th. I can also come to pick them personally if it is more convenient.
When filling out the survey keep the following in mind:
1. Mark your answers by selecting the box adjacent to the response you wish to choose, highlighting the desired box, and replacing it with an “x.”
2. By submitting a completed copy of the survey you are considered to be automatically agreeing with the information on the consent form and do NOT need to return a signed document.
Thank you for your support,
XXX YYY

172
Appendix G – Detailed Demographics Charts
Frequency Table
Frequency Percent Valid PercentCumulative
Percent
Director/Manager 22 40.0 40.0 40.0
Technical Specialist/Engineer 32 58.2 58.2 98.2
Other 1 1.8 1.8 100.0
Total 55 100.0 100.0
Frequency Percent Valid PercentCumulative
Percent
under 25 1 1.8 1.8 1.8
26-35 12 21.8 21.8 23.6
36-50 17 30.9 30.9 54.5
51-65 22 40.0 40.0 94.5
over 65 3 5.5 5.5 100.0
Total 55 100.0 100.0
Frequency Percent Valid PercentCumulative
Percent
Product 7 12.7 12.7 12.7
R&D/Technology 18 32.7 32.7 45.5
Design 1 1.8 1.8 47.3
Test (lab/engine) 4 7.3 7.3 54.5
Simulation/Analysis 1 1.8 1.8 56.4
Application 14 25.5 25.5 81.8
Multiple Function 10 18.2 18.2 100.0
Total 55 100.0 100.0
Frequency Percent Valid PercentCumulative
Percent
Auto Engines 12 21.8 21.8 21.8
Truck Engines 12 21.8 21.8 43.6
Both Auto and Truck Engines 31 56.4 56.4 100.0
Total 55 100.0 100.0
Frequency Percent Valid PercentCumulative
Percent
engine bearings 2 3.6 3.6 3.6
ignition systems 3 5.5 5.5 9.1
engine rings 2 3.6 3.6 12.7
aluminum pistons 3 5.5 5.5 18.2
steel pistons 14 25.5 25.5 43.6
valve seat and guides 1 1.8 1.8 45.5
sealing systems 11 20.0 20.0 65.5
multiple products 19 34.5 34.5 100.0
Total 55 100.0 100.0
Frequency Percent Valid PercentCumulative
Percent
YES 28 50.9 50.9 50.9
NO 26 47.3 47.3 98.2
99 1 1.8 1.8 100.0
Total 55 100.0 100.0
Valid
PACE Award involvment
Valid
Valid
Product Application
Valid
Type of Component
Age Group
Valid
Function
Management or Engineer
Valid

173
Appendix H – Detailed Cronbach’s Alpha Analysis
RELIABILITY VARIABLES=TECAPA1 TECAPA2 TECAPA3 TECAPA4 TECAPA5 TECAPA6 TECHSTREN1 TECHSTREN2 KMS1 KMS2 KMS3 KMS4 SCALE'ALL VARIABLES') ALL MODEL=ALPHA.
Case Processing Summary
N %
Cases Valid 27 49.1
Excludeda 28 50.9
Total 55 100.0
a. Listwise deletion based on all variables in the
procedure.
Reliability Statistics
Cronbach's Alpha N of Items
.831 12
---------------------------------------------------------------------------------------------------------------- RELIABILITY VARIABLES=MANCREATE1 MANCREATE2 MANCREATE3 MANCREATE4 MANCREATE5 MANCREATE6 MANCREATE7 MANOPEN1 MANOPEN2 MANOPEN3 MANOPEN4 MANORIENT1 MANORIENT2 MANORIENT3 MANORIENT4 MANRISKT1 MANRISKT2 MANRISKT3 MANRISKT4 MANPROACT1 MANPROACT2 MANPROACT3 MANPROACT4 SCALE'ALL VARIABLES') ALL MODEL=ALPHA.
Case Processing Summary
N %
Cases Valid 34 61.8
Excludeda 21 38.2
Total 55 100.0
a. Listwise deletion based on all variables in the
procedure.
Reliability Statistics
Cronbach's Alpha N of Items
.912 23
---------------------------------------------------------------------------------------------------------------- RELIABILITY VARIABLES=TECAPA1 TECAPA2 TECAPA3 TECAPA4 TECAPA5 TECAPA6 SCALE'ALL VARIABLES') ALL MODEL=ALPHA.

174
Scale: ALL VARIABLES Case Processing Summary
N %
Cases Valid 51 92.7
Excludeda 4 7.3
Total 55 100.0
a. Listwise deletion based on all variables in the
procedure.
Reliability Statistics
Cronbach's Alpha N of Items
.735 6
---------------------------------------------------------------------------------------------------------------- RELIABILITY VARIABLES=TECHSTREN1 TECHSTREN2 SCALE'ALL VARIABLES') ALL MODEL=ALPHA.
Case Processing Summary
N %
Cases Valid 33 60.0
Excludeda 22 40.0
Total 55 100.0
a. Listwise deletion based on all variables in the
procedure.
Reliability Statistics
Cronbach's Alpha N of Items
.644 2
----------------------------------------------------------------------------------------------------------------
RELIABILITY VARIABLES=KMS1 KMS3 KMS2 KMS4 SCALE'ALL VARIABLES') ALL/MODEL=ALPHA.
Scale: ALL VARIABLES Case Processing Summary
N %
Cases Valid 42 76.4
Excludeda 13 23.6
Total 55 100.0
a. Listwise deletion based on all variables in the
procedure.

175
Reliability Statistics
Cronbach's Alpha N of Items
.907 4
---------------------------------------------------------------------------------------------------------------- RELIABILITY VARIABLES=MANCREATE1 MANCREATE3 MANCREATE5 MANCREATE7 MANCREATE2 MANCREATE4 MANCREATE6 SCALE'ALL VARIABLES') ALL MODEL=ALPHA.
Scale: ALL VARIABLES Case Processing Summary
N %
Cases Valid 45 81.8
Excludeda 10 18.2
Total 55 100.0
a. Listwise deletion based on all variables in the
procedure.
Reliability Statistics
Cronbach's Alpha N of Items
.759 7
----------------------------------------------------------------------------------------------------------------
RELIABILITY VARIABLES=MANOPEN1 MANOPEN2 MANOPEN3 MANOPEN4 SCALE'ALL VARIABLES') ALL MODEL=ALPHA.
Scale: ALL VARIABLES Case Processing Summary
N %
Cases Valid 49 89.1
Excludeda 6 10.9
Total 55 100.0
a. Listwise deletion based on all variables in the
procedure.
Reliability Statistics
Cronbach's Alpha N of Items
.846 4
---------------------------------------------------------------------------------------------------------------- RELIABILITY VARIABLES=MANORIENT1 MANORIENT2 MANORIENT3 MANORIENT4 SCALE'ALL VARIABLES')

176
ALL MODEL=ALPHA.
Scale: ALL VARIABLES Case Processing Summary
N %
Cases Valid 48 87.3
Excludeda 7 12.7
Total 55 100.0
a. Listwise deletion based on all variables in the
procedure.
Reliability Statistics
Cronbach's Alpha N of Items
.813 4
---------------------------------------------------------------------------------------------------------------- RELIABILITY VARIABLES=MANRISKT2 MANRISKT3 MANRISKT4 MANRISKT1 SCALE'ALL VARIABLES') ALL MODEL=ALPHA.
Scale: ALL VARIABLES Case Processing Summary
N %
Cases Valid 50 90.9
Excludeda 5 9.1
Total 55 100.0
a. Listwise deletion based on all variables in the
procedure.
Reliability Statistics
Cronbach's Alpha N of Items
.723 4
---------------------------------------------------------------------------------------------------------------- RELIABILITY VARIABLES=MANPROACT1 MANPROACT2 MANPROACT3 MANPROACT4 SCALE'ALL VARIABLES') ALL MODEL=ALPHA.
Scale: ALL VARIABLES Case Processing Summary
N %
Cases Valid 47 85.5
Excludeda 8 14.5
Total 55 100.0

177
a. Listwise deletion based on all variables in the
procedure.
Reliability Statistics
Cronbach's Alpha N of Items
.678 4
---------------------------------------------------------------------------------------------------------------- RELIABILITY VARIABLES=GOVEREG1 GOVEREG2 SCALE'ALL VARIABLES') ALL MODEL=ALPHA.
Scale: ALL VARIABLES
Case Processing Summary
N %
Cases Valid 38 69.1
Excludeda 17 30.9
Total 55 100.0
a. Listwise deletion based on all variables in the
procedure.
Reliability Statistics
Cronbach's Alpha N of Items
.547 2
---------------------------------------------------------------------------------------------------------------- RELIABILITY VARIABLES=CUSTINTE1 CUSTINTE2 CUSTINTE3 SCALE'ALL VARIABLES') ALL MODEL=ALPHA.
Scale: ALL VARIABLES Case Processing Summary
N %
Cases Valid 44 80.0
Excludeda 11 20.0
Total 55 100.0
a. Listwise deletion based on all variables in the
procedure.
Reliability Statistics
Cronbach's Alpha N of Items
.542 3
----------------------------------------------------------------------------------------------------------------

178
RELIABILITY VARIABLES=DEVEINNO1 DEVEINNO2 DEVEINNO3 DEVEINNO4 SCALE'ALL VARIABLES') ALL MODEL=ALPHA.
Scale: ALL VARIABLES Case Processing Summary
N %
Cases Valid 37 67.3
Excludeda 18 32.7
Total 55 100.0
a. Listwise deletion based on all variables in the
procedure.
Reliability Statistics
Cronbach's Alpha N of Items
.687 4

179
Appendix I – Detailed one sample “t” test
Lower Upper
PACE Award involvement 21.586 53 .000 1.481 1.34 1.62
Age Group 26.028 54 .000 3.255 3.00 3.51
Function 11.965 54 .000 4.455 3.71 5.20
Management or Engineer 22.784 54 .000 1.618 1.48 1.76
Product Application 21.176 54 .000 2.345 2.12 2.57
Type of Component 22.048 54 .000 8.200 7.45 8.95
TC1 36.659 53 .000 4.315 4.08 4.55
TC2 44.022 53 .000 4.296 4.10 4.49
TC3 33.553 53 .000 3.963 3.73 4.20
TC4 49.939 54 .000 4.600 4.42 4.78
TC5 27.824 54 .000 3.636 3.37 3.90
TC6 35.761 52 .000 4.170 3.94 4.40
TS1 14.550 32 .000 2.606 2.24 2.97
TS2 21.118 42 .000 3.372 3.05 3.69
TS3 26.669 53 .000 4.019 3.72 4.32
TE1 18.323 45 .000 3.217 2.86 3.57
TE2 15.806 49 .000 2.740 2.39 3.09
TE3 17.191 44 .000 2.711 2.39 3.03
TE4 15.751 47 .000 2.667 2.33 3.01
MANCR1 28.678 53 .000 3.648 3.39 3.90
MANCR2 34.628 52 .000 4.094 3.86 4.33
MANCR3 46.449 54 .000 4.291 4.11 4.48
MANCR4 28.261 53 .000 3.815 3.54 4.09
MANCR5 37.121 53 .000 3.852 3.64 4.06
MANCR6 24.049 48 .000 3.163 2.90 3.43
MANCR7 34.189 54 .000 3.873 3.65 4.10
MANOP1 21.857 51 .000 3.327 3.02 3.63
MANOP2 21.533 52 .000 3.321 3.01 3.63
MANOP3 32.583 54 .000 3.564 3.34 3.78
MANOP4 21.951 52 .000 3.170 2.88 3.46
MANFO1 25.718 49 .000 3.540 3.26 3.82
MANFO2 23.601 54 .000 3.382 3.09 3.67
MANFO3 21.275 53 .000 3.185 2.88 3.49
MANFO4 26.185 51 .000 3.385 3.13 3.64
MANRT1 21.448 50 .000 2.706 2.45 2.96
MANRT2 24.908 51 .000 3.577 3.29 3.87
MANRT3 16.429 53 .000 2.130 1.87 2.39
MANRT4 19.261 53 .000 2.333 2.09 2.58
MANRT5 22.018 47 .000 3.167 2.88 3.46
MANPA1 29.258 50 .000 3.588 3.34 3.83
MANPA2 27.955 49 .000 3.580 3.32 3.84
MANPA3 22.299 51 .000 3.000 2.73 3.27
MANPA4 20.677 50 .000 2.980 2.69 3.27
GR1 27.486 40 .000 3.780 3.50 4.06
GR2 18.441 45 .000 2.913 2.59 3.23
GR3 28.365 46 .000 4.043 3.76 4.33
CUSTINTE1 30.589 47 .000 4.021 3.76 4.29
CUSTINTE2 41.729 52 .000 4.321 4.11 4.53
CUSTINTE3 25.221 48 .000 3.204 2.95 3.46
SDIC1 27.396 53 .000 3.722 3.45 3.99
SDIC2 41.994 51 .000 4.212 4.01 4.41
SDIC3 34.600 41 .000 4.119 3.88 4.36
SDIC4 42.836 48 .000 4.143 3.95 4.34
SUMTC 57.190 51 .000 17.13462 16.5331 17.7361
SUMTS 19.941 32 .000 5.90909 5.3055 6.5127
SUMTE 18.530 41 .000 11.47619 10.2255 12.7269
SUMMANCR 46.206 44 .000 26.91111 25.7373 28.0849
SUMMANOP 26.863 48 .000 13.26531 12.2724 14.2582
SUMMANFO 27.933 47 .000 13.37500 12.4117 14.3383
SUMMANRT 27.034 49 .000 10.64000 9.8491 11.4309
SUMMANPA 33.943 46 .000 13.29787 12.5093 14.0865
SUMGR 27.187 37 .000 6.84211 6.3322 7.3520
SUMCUSTINTE 40.791 43 .000 11.52273 10.9530 12.0924
SUMSDIC 40.413 36 .000 16.13514 15.3254 16.9449
SUMTF 32.552 26 .000 42.66667 39.9725 45.3609
SUMMF 34.334 33 .000 77.17647 72.6033 81.7496
Test Value = 0
t df Sig. (2-tailed) Mean Difference
95% Confidence Interval of the Difference

180
Appendix J – T test comparison Technical Factor versus Managerial Factors DATASET ACTIVATE DataSet1 T-TEST TESTVAL=0 MISSING=ANALYSIS VARIABLES=SUMTECHNICAL SUMMANAGERIAL CRITERIA=CI.95)
T-Test One-Sample Statistics
N Mean Std. Deviation Std. Error Mean
SUMTF 27 42.6667 6.81063 1.31071
SUMMF 34 77.1765 13.10672 2.24778
One-Sample Test
Test Value = 0
t df Sig. (2-tailed) Mean Difference
95% Confidence Interval of the
Difference
Lower Upper
SUMTF 32.552 26 .000 42.66667 39.9725 45.3609
SUMMF 34.334 33 .000 77.17647 72.6033 81.7496 T-TEST TESTVAL=0 MISSING=LISTWISE VARIABLES=SUMTECHNICAL SUMMANAGERIAL CRITERIA=CI.95)
T-Test One-Sample Statistics
N Mean Std. Deviation Std. Error Mean
SUMTF 17 41.4118 6.28549 1.52445
SUMMF 17 78.6471 11.31338 2.74390
One-Sample Test
Test Value = 0
t df Sig. (2-tailed) Mean Difference
95% Confidence Interval of the
Difference
Lower Upper
SUMTF 27.165 16 .000 41.41176 38.1801 44.6435
SUMMF 28.663 16 .000 78.64706 72.8303 84.4639

181
Appendix K – RQ 5 –Detailed Charts – Strength Correlation Analysis
Correlations
SUMSDIC SUMTF
SUMSDIC Pearson Correlation 1 .267
Sig. (2-tailed) .218
Sum of Squares and Cross-
products 212.324 80.391
Covariance 5.898 3.654
N 37 23
SUMTF Pearson Correlation .267 1
Sig. (2-tailed) .218
Sum of Squares and Cross-
products 80.391 1206.000
Covariance 3.654 46.385
N 23 27
Correlations
SUMSDIC SUMTF
SUMSDIC Pearson Correlation 1 .052
Sig. (2-tailed) .878
Sum of Squares and Cross-
products 116.200 5.364
Covariance 6.116 .536
N 20 11
SUMTF Pearson Correlation .052 1
Sig. (2-tailed) .878
Sum of Squares and Cross-
products 5.364 380.308
Covariance .536 31.692
N 11 13 USE ALL COMPUTE filter_$=(PACE = 2) VARIABLE LABELS filter_$ 'PACE = 2 (FILTER)' VALUE LABELS filter_$ 0 'Not Selected' 1 'Selected' FORMATS filter_$ (f1.0) FILTER BY filter_$ EXECUTE CORRELATIONS

182
VARIABLES=SUMDEVEINNO SUMTECHNICAL PRINT=TWOTAIL NOSIG STATISTICS DESCRIPTIVES XPROD MISSING=PAIRWISE
Correlations
SUMSDIC SUMTF
SUMSDIC Pearson Correlation 1 .497
Sig. (2-tailed) .100
Sum of Squares and Cross-
products 77.438 87.333
Covariance 5.163 7.939
N 16 12
SUMTF Pearson Correlation .497 1
Sig. (2-tailed) .100
Sum of Squares and Cross-
products 87.333 805.500
Covariance 7.939 61.962
N 12 14 EXECUTE. CORRELATIONS VARIABLES=SUMDEVEINNO SUMTECHNICAL PRINT=TWOTAIL NOSIG STATISTICS DESCRIPTIVES XPROD MISSING=PAIRWISE
Correlations
SUMSDIC SUMTF
SUMSDIC Pearson Correlation 1 .267
Sig. (2-tailed) .218
Sum of Squares and Cross-
products 212.324 80.391
Covariance 5.898 3.654
N 37 23
SUMTF Pearson Correlation .267 1
Sig. (2-tailed) .218
Sum of Squares and Cross-
products 80.391 1206.000
Covariance 3.654 46.385
N 23 27

183
Correlations
SUMSDIC SUMTF
SUMSDIC Pearson Correlation 1 .558
Sig. (2-tailed) .118
Sum of Squares and Cross-
products 86.438 52.556
Covariance 5.763 6.569
N 16 9
SUMTF Pearson Correlation .558 1
Sig. (2-tailed) .118
Sum of Squares and Cross-
products 52.556 344.727
Covariance 6.569 34.473
N 9 11 USE ALL COMPUTE filter_$=(SUMCUSTINTE = 2) VARIABLE LABELS filter_$ 'SUMCUSTINTE = 2 (FILTER)' VALUE LABELS filter_$ 0 'Not Selected' 1 'Selected' FORMATS filter_$ (f1.0) FILTER BY filter_$ EXECUTE CORRELATIONS VARIABLES=SUMDEVEINNO SUMTECHNICAL PRINT=TWOTAIL NOSIG STATISTICS DESCRIPTIVES XPROD MISSING=PAIRWISE
Correlations
SUMSDIC SUMTF
SUMSDIC Pearson Correlation 1 .197
Sig. (2-tailed) .519
Sum of Squares and Cross-
products 69.529 30.615
Covariance 4.346 2.551
N 17 13
SUMTF Pearson Correlation .197 1
Sig. (2-tailed) .519
Sum of Squares and Cross-
products 30.615 772.929
Covariance 2.551 59.456
N 13 14

184
FILTER OFF USE ALL EXECUTE CORRELATIONS VARIABLES=SUMDEVEINNO SUMMANAGERIAL PRINT=TWOTAIL NOSIG STATISTICS DESCRIPTIVES MISSING=PAIRWISE
Correlations
SUMSDIC SUMMF
SUMSDIC Pearson Correlation 1 .496**
Sig. (2-tailed) .009
N 37 27
SUMMF Pearson Correlation .496** 1
Sig. (2-tailed) .009
N 27 34
**. Correlation is significant at the 0.01 level (2-tailed). USE ALL COMPUTE filter_$=(PACE = 1) VARIABLE LABELS filter_$ 'PACE = 1 (FILTER)' VALUE LABELS filter_$ 0 'Not Selected' 1 'Selected' FORMATS filter_$ (f1.0) FILTER BY filter_$ EXECUTE. CORRELATIONS VARIABLES=SUMDEVEINNO SUMMANAGERIAL PRINT=TWOTAIL NOSIG STATISTICS DESCRIPTIVES MISSING=PAIRWISE
Correlations
SUMSDIC SUMMF
SUMSDIC Pearson Correlation 1 .421
Sig. (2-tailed) .092
N 20 17
SUMMF Pearson Correlation .421 1
Sig. (2-tailed) .092
N 17 22 USE ALL COMPUTE filter_$=(PACE = 2) VARIABLE LABELS filter_$ 'PACE = 2 (FILTER)' VALUE LABELS filter_$ 0 'Not Selected' 1 'Selected' FORMATS filter_$ (f1.0) FILTER BY filter_$ EXECUTE

185
CORRELATIONS VARIABLES=SUMDEVEINNO SUMMANAGERIAL PRINT=TWOTAIL NOSIG STATISTICS DESCRIPTIVES MISSING=PAIRWISE
Correlations
SUMSDIC SUMMF
SUMSDIC Pearson Correlation 1 .486
Sig. (2-tailed) .185
N 16 9
SUMMF Pearson Correlation .486 1
Sig. (2-tailed) .185
N 9 11 RECODE SUMCUSTINTE (8 thru 11=1) (12 thru 15=2) EXECUTE CORRELATIONS VARIABLES=SUMDEVEINNO SUMMANAGERIAL PRINT=TWOTAIL NOSIG STATISTICS DESCRIPTIVES MISSING=PAIRWISE
Correlations
SUMSDIC SUMMF
SUMSDIC Pearson Correlation 1 .486
Sig. (2-tailed) .185
N 16 9
SUMMF Pearson Correlation .486 1
Sig. (2-tailed) .185
N 9 11 CORRELATIONS VARIABLES=SUMDEVEINNO SUMMANAGERIAL PRINT=TWOTAIL NOSIG MISSING=PAIRWISE
Correlations
SUMSDIC SUMMF
SUMSDIC Pearson Correlation 1 .486
Sig. (2-tailed) .185
N 16 9
SUMMF Pearson Correlation .486 1
Sig. (2-tailed) .185
N 9 11

186
FILTER OFF USE ALL EXECUTE CORRELATIONS VARIABLES=SUMDEVEINNO SUMMANAGERIAL PRINT=TWOTAIL NOSIG MISSING=PAIRWISE
Correlations
SUMSDIC SUMMF
SUMSDIC Pearson Correlation 1 .496**
Sig. (2-tailed) .009
N 37 27
SUMMF Pearson Correlation .496** 1
Sig. (2-tailed) .009
N 27 34
**. Correlation is significant at the 0.01 level (2-tailed). RECODE SUMCUSTINTE (8 thru 11=1) (12 thru 15=2) EXECUTE USE ALL COMPUTE filter_$=(SUMCUSTINTE = 1) VARIABLE LABELS filter_$ 'SUMCUSTINTE = 1 (FILTER)' VALUE LABELS filter_$ 0 'Not Selected' 1 'Selected' FORMATS filter_$ (f1.0) FILTER BY filter_$ EXECUTE CORRELATIONS VARIABLES=SUMDEVEINNO SUMMANAGERIAL PRINT=TWOTAIL NOSIG MISSING=PAIRWISE
Correlations
SUMSDIC SUMMF
SUMSDIC Pearson Correlation 1 .697*
Sig. (2-tailed) .012
N 16 12
SUMMF Pearson Correlation .697* 1
Sig. (2-tailed) .012
N 12 15
*. Correlation is significant at the 0.05 level (2-tailed).

187
COMPUTE filter_$=(SUMCUSTINTE =2) VARIABLE LABELS filter_$ 'SUMCUSTINTE =2 (FILTER)' VALUE LABELS filter_$ 0 'Not Selected' 1 'Selected' FORMATS filter_$ (f1.0) FILTER BY filter_$ EXECUTE CORRELATIONS VARIABLES=SUMDEVEINNO SUMMANAGERIAL PRINT=TWOTAIL NOSIG MISSING=PAIRWISE
Correlations
SUMSDIC SUMMF
SUMSDIC Pearson Correlation 1 .314
Sig. (2-tailed) .320
N 17 12
SUMMF Pearson Correlation .314 1
Sig. (2-tailed) .320
N 12 15

188
Appendix L – RQ 6 –Detailed Charts – Strength Correlation Analysis
CORRELATIONS VARIABLES=SUMDEVEINNO SUMTECHNICAL PRINT=TWOTAIL NOSIG MISSING=PAIRWISE
Notes
Output Created 25-JUL-2015 14:24:56
Comments
Input Data C:\Users\admin\Desktop\undestand99SUM.
sav
Active Dataset DataSet1
Filter <none>
Weight <none>
Split File <none>
N of Rows in Working Data File 59
Missing Value Handling Definition of Missing User-defined missing values are treated as
missing.
Cases Used Statistics for each pair of variables are
based on all the cases with valid data for
that pair.
Syntax CORRELATIONS
/VARIABLES=SUMDEVEINNO
SUMTECHNICAL
/PRINT=TWOTAIL NOSIG
/MISSING=PAIRWISE.
Resources Processor Time 00:00:00.03
Elapsed Time 00:00:00.03
Correlations
SUMSDIC SUMTF
SUMSDIC Pearson Correlation 1 .267
Sig. (2-tailed) .218
N 37 23
SUMTF Pearson Correlation .267 1
Sig. (2-tailed) .218
N 23 27

189
FREQUENCIES VARIABLES=SUMGOVEREG TATISTICS=RANGE MINIMUM MAXIMUM MODE FORMAT=LIMIT50) ORDER=ANALYSIS COMPUTE filter_$=(SUMGOVEREG = 1) VARIABLE LABELS filter_$ 'SUMGOVEREG = 1 (FILTER)' VALUE LABELS filter_$ 0 'Not Selected' 1 'Selected' FORMATS filter_$ (f1.0) FILTER BY filter_$ EXECUTE CORRELATIONS VARIABLES=SUMDEVEINNO SUMTECHNICAL PRINT=TWOTAIL NOSIG MISSING=PAIRWISE
Correlations
SUMSDIC SUMTF
SUMSDIC Pearson Correlation 1 .564*
Sig. (2-tailed) .029
N 21 15
SUMTF Pearson Correlation .564* 1
Sig. (2-tailed) .029
N 15 16
*. Correlation is significant at the 0.05 level (2-tailed).
USE ALL COMPUTE filter_$=(SUMGOVEREG = 2) VARIABLE LABELS filter_$ 'SUMGOVEREG = 2 (FILTER)' VALUE LABELS filter_$ 0 'Not Selected' 1 'Selected' FORMATS filter_$ (f1.0) FILTER BY filter_$ EXECUTE CORRELATIONS VARIABLES=SUMDEVEINNO SUMTECHNICAL PRINT=TWOTAIL NOSIG MISSING=PAIRWISE
Correlations
SUMSDIC SUMTF
SUMSDIC Pearson Correlation 1 .060
Sig. (2-tailed) .910
N 9 6
SUMTF Pearson Correlation .060 1
Sig. (2-tailed) .910
N 6 8

190
RECODE SUMGOVEREG (3 thru 6=1) (7 thru 9=2). EXECUTE USE ALL COMPUTE filter_$=(SUMGOVEREG =1) VARIABLE LABELS filter_$ 'SUMGOVEREG =1 (FILTER)' VALUE LABELS filter_$ 0 'Not Selected' 1 'Selected' FORMATS filter_$ (f1.0) FILTER BY filter_$ EXECUTE CORRELATIONS VARIABLES=SUMDEVEINNO SUMTECHNICAL PRINT=TWOTAIL NOSIG MISSING=PAIRWISE
Correlations
SUMSDIC SUMTF
SUMSDIC Pearson Correlation 1 .564*
Sig. (2-tailed) .029
N 21 15
SUMTF Pearson Correlation .564* 1
Sig. (2-tailed) .029
N 15 16
*. Correlation is significant at the 0.05 level (2-tailed).
USE ALL COMPUTE filter_$=(SUMGOVEREG =2) VARIABLE LABELS filter_$ 'SUMGOVEREG =2 (FILTER)' VALUE LABELS filter_$ 0 'Not Selected' 1 'Selected' FORMATS filter_$ (f1.0) FILTER BY filter_$ EXECUTE CORRELATIONS VARIABLES=SUMDEVEINNO SUMTECHNICAL PRINT=TWOTAIL NOSIG MISSING=PAIRWISE
Correlations
SUMSDIC SUMTF
SUMSDIC Pearson Correlation 1 .060
Sig. (2-tailed) .910
N 9 6
SUMTF Pearson Correlation .060 1
Sig. (2-tailed) .910
N 6 8

191
FILTER OFF USE ALL EXECUTE CORRELATIONS VARIABLES=SUMDEVEINNO SUMTECHNICAL PRINT=TWOTAIL NOSIG MISSING=PAIRWISE
Correlations
SUMSDIC SUMTF
SUMSDIC Pearson Correlation 1 .267
Sig. (2-tailed) .218
N 37 23
SUMTF Pearson Correlation .267 1
Sig. (2-tailed) .218
N 23 27
CORRELATIONS VARIABLES=SUMDEVEINNO SUMMANAGERIAL PRINT=TWOTAIL NOSIG MISSING=PAIRWISE
Correlations
SUMSDIC SUMMF
SUMSDIC Pearson Correlation 1 .496**
Sig. (2-tailed) .009
N 37 27
SUMMF Pearson Correlation .496** 1
Sig. (2-tailed) .009
N 27 34
**. Correlation is significant at the 0.01 level (2-tailed).
RECODE SUMGOVEREG (3 thru 7=1) (8 thru 9=2) EXECUTE CORRELATIONS VARIABLES=SUMDEVEINNO SUMMANAGERIAL PRINT=TWOTAIL NOSIG MISSING=PAIRWISE.

192
Correlations
SUMSDIC SUMMF
SUMSDIC Pearson Correlation 1 .496**
Sig. (2-tailed) .009
N 37 27
SUMMF Pearson Correlation .496** 1
Sig. (2-tailed) .009
N 27 34
**. Correlation is significant at the 0.01 level (2-tailed).
USE ALL COMPUTE filter_$=(SUMGOVEREG =2) VARIABLE LABELS filter_$ 'SUMGOVEREG =2 (FILTER)' VALUE LABELS filter_$ 0 'Not Selected' 1 'Selected' FORMATS filter_$ (f1.0) FILTER BY filter_$ EXECUTE USE ALL COMPUTE filter_$=(SUMGOVEREG =1) VARIABLE LABELS filter_$ 'SUMGOVEREG =1 (FILTER)' VALUE LABELS filter_$ 0 'Not Selected' 1 'Selected' FORMATS filter_$ (f1.0) FILTER BY filter_$ EXECUTE CORRELATIONS VARIABLES=SUMDEVEINNO SUMMANAGERIAL PRINT=TWOTAIL NOSIG MISSING=PAIRWISE
Correlations
SUMSDIC SUMMF
SUMSDIC Pearson Correlation 1 .460
Sig. (2-tailed) .055
N 21 18
SUMMF Pearson Correlation .460 1
Sig. (2-tailed) .055
N 18 20
USE ALL COMPUTE filter_$=(SUMGOVEREG =2) VARIABLE LABELS filter_$ 'SUMGOVEREG =2 (FILTER)' VALUE LABELS filter_$ 0 'Not Selected' 1 'Selected' FORMATS filter_$ (f1.0) FILTER BY filter_$ EXECUTE CORRELATIONS VARIABLES=SUMDEVEINNO SUMMANAGERIAL

193
PRINT=TWOTAIL NOSIG MISSING=PAIRWISE
Correlations
SUMSDIC SUMMF
SUMSDIC Pearson Correlation 1 .627
Sig. (2-tailed) .258
N 9 5
SUMMF Pearson Correlation .627 1
Sig. (2-tailed) .258
N 5 7
FILTER OFF USE ALL EXECUTE RECODE SUMGOVEREG (3 thru 6=1) (7 thru 9=2) EXECUTE RECODE SUMGOVEREG (3 thru 6=1) (7 thru 9=2) EXECUTE USE ALL COMPUTE filter_$=(SUMGOVEREG = 1) VARIABLE LABELS filter_$ 'SUMGOVEREG = 1 (FILTER)' VALUE LABELS filter_$ 0 'Not Selected' 1 'Selected' FORMATS filter_$ (f1.0) FILTER BY filter_$ EXECUTE CORRELATIONS VARIABLES=SUMDEVEINNO SUMMANAGERIAL PRINT=TWOTAIL NOSIG MISSING=PAIRWISE
Correlations
SUMSDIC SUMMF
SUMSDIC Pearson Correlation 1 .460
Sig. (2-tailed) .055
N 21 18
SUMMF Pearson Correlation .460 1
Sig. (2-tailed) .055
N 18 20
USE ALL COMPUTE filter_$=(SUMGOVEREG = 2) VARIABLE LABELS filter_$ 'SUMGOVEREG = 2 (FILTER)' VALUE LABELS filter_$ 0 'Not Selected' 1 'Selected' FORMATS filter_$ (f1.0) FILTER BY filter_$ EXECUTE CORRELATIONS

194
VARIABLES=SUMDEVEINNO SUMMANAGERIAL PRINT=TWOTAIL NOSIG MISSING=PAIRWISE
Correlations
SUMSDIC SUMMF
SUMSDIC Pearson Correlation 1 .627
Sig. (2-tailed) .258
N 9 5
SUMMF Pearson Correlation .627 1
Sig. (2-tailed) .258
N 5 7 FILTER OFF USE ALL EXECUTE CORRELATIONS VARIABLES=SUMDEVEINNO SUMCUSTINTE PRINT=TWOTAIL NOSIG MISSING=PAIRWISE
Correlations
SUMSDIC SUMCUSTINTE
SUMSDIC Pearson Correlation 1 -.330
Sig. (2-tailed) .061
N 37 33
SUMCUSTINTE Pearson Correlation -.330 1
Sig. (2-tailed) .061
N 33 44
USE ALL COMPUTE filter_$=(PACE = 1) VARIABLE LABELS filter_$ 'PACE = 1 (FILTER)' VALUE LABELS filter_$ 0 'Not Selected' 1 'Selected' FORMATS filter_$ (f1.0) FILTER BY filter_$ EXECUTE CORRELATIONS VARIABLES=SUMDEVEINNO SUMCUSTINTE PRINT=TWOTAIL NOSIG MISSING=PAIRWISE
Correlations
SUMSDIC SUMCUSTINTE
SUMSDIC Pearson Correlation 1 -.400
Sig. (2-tailed) .111
N 20 17

195
SUMCUSTINTE Pearson Correlation -.400 1
Sig. (2-tailed) .111
N 17 22 USE ALL COMPUTE filter_$=(PACE = 2) VARIABLE LABELS filter_$ 'PACE = 2 (FILTER)' VALUE LABELS filter_$ 0 'Not Selected' 1 'Selected' FORMATS filter_$ (f1.0) FILTER BY filter_$ EXECUTE CORRELATIONS VARIABLES=SUMDEVEINNO SUMCUSTINTE PRINT=TWOTAIL NOSIG MISSING=PAIRWISE
Correlations
SUMSDIC SUMCUSTINTE
SUMSDIC Pearson Correlation 1 -.422
Sig. (2-tailed) .117
N 16 15
SUMCUSTINTE Pearson Correlation -.422 1
Sig. (2-tailed) .117
N 15 21 FILTER OFF USE ALL EXECUTE CORRELATIONS VARIABLES=SUMDEVEINNO SUMGOVEREG PRINT=TWOTAIL NOSIG MISSING=PAIRWISE
Correlations
SUMSDIC SUMGR
SUMSDIC Pearson Correlation 1 .190
Sig. (2-tailed) .313
N 37 30
SUMGR Pearson Correlation .190 1
Sig. (2-tailed) .313
N 30 38
USE ALL COMPUTE filter_$=PACE = 1) VARIABLE LABELS filter_$ 'PACE = 1 (FILTER)' VALUE LABELS filter_$ 0 'Not Selected' 1 'Selected' FORMATS filter_$ (f1.0)

196
FILTER BY filter_$ EXECUTE CORRELATIONS VARIABLES=SUMDEVEINNO SUMGOVEREG PRINT=TWOTAIL NOSIG MISSING=PAIRWISE
Correlations
SUMSDIC SUMGR
SUMSDIC Pearson Correlation 1 .124
Sig. (2-tailed) .649
N 20 16
SUMGR Pearson Correlation .124 1
Sig. (2-tailed) .649
N 16 20
USE ALL COMPUTE filter_$=(PACE = 2) VARIABLE LABELS filter_$ 'PACE = 2 (FILTER)' VALUE LABELS filter_$ 0 'Not Selected' 1 'Selected' FORMATS filter_$ (f1.0) FILTER BY filter_$ EXECUTE CORRELATIONS VARIABLES=SUMDEVEINNO SUMGOVEREG PRINT=TWOTAIL NOSIG MISSING=PAIRWISE
Correlations
SUMSDIC SUMGR
SUMSDIC Pearson Correlation 1 .042
Sig. (2-tailed) .891
N 16 13
SUMGR Pearson Correlation .042 1
Sig. (2-tailed) .891
N 13 17

197
Appendix M – Overall Factor Total variance explained
Rotation Sums of Squared
Loadingsa
Total % of Variance Cumulative % Total % of Variance Cumulative % Total
1 11.085 25.194 25.194 10.616 24.127 24.127 8.543
2 3.366 7.651 32.844 2.776 6.310 30.437 2.964
3 2.928 6.654 39.499 2.421 5.502 35.939 4.731
4 2.711 6.161 45.660 2.260 5.136 41.076 5.924
5 2.416 5.492 51.151 1.894 4.305 45.381 3.271
6 2.180 4.955 56.106
7 1.688 3.837 59.943
8 1.557 3.538 63.481
9 1.352 3.074 66.555
10 1.278 2.906 69.461
11 1.161 2.640 72.100
12 1.113 2.530 74.630
13 1.020 2.318 76.948
14 .978 2.222 79.170
15 .936 2.126 81.297
16 .858 1.951 83.247
17 .813 1.848 85.095
18 .734 1.669 86.764
19 .623 1.415 88.179
20 .600 1.364 89.543
21 .558 1.267 90.811
22 .530 1.204 92.015
23 .444 1.009 93.024
24 .417 .947 93.972
25 .342 .777 94.749
26 .305 .693 95.442
27 .292 .664 96.105
28 .264 .600 96.705
29 .244 .555 97.260
30 .203 .461 97.721
31 .165 .376 98.097
32 .149 .339 98.436
33 .138 .314 98.750
34 .108 .245 98.995
35 .092 .209 99.204
36 .072 .164 99.367
37 .069 .158 99.525
38 .053 .121 99.646
39 .048 .110 99.756
40 .037 .083 99.839
41 .024 .054 99.892
42 .020 .045 99.938
43 .016 .036 99.973
44 .012 .027 100.000
a. When factors are correlated, sums of squared loadings cannot be added to obtain a total variance.Extraction Method: Principal Axis Factoring.
Total Variance Explained
Factor
Initial Eigenvalues Extraction Sums of Squared Loadings

198
Appendix N – Technical Factor Total variance explained
Rotation Sums of Squared
Loadingsa
Total % of Variance Cumulative % Total % of Variance Cumulative % Total
1 4.658 23.288 23.288 4.194 20.972 20.972 3.752
2 2.379 11.895 35.183 1.882 9.408 30.380 2.660
3 2.303 11.514 46.697 1.690 8.452 38.832 1.857
4 1.484 7.418 54.115 .875 4.376 43.208 1.466
5 1.186 5.928 60.043
6 1.075 5.375 65.418
7 .953 4.766 70.184
8 .856 4.278 74.462
9 .832 4.161 78.623
10 .732 3.658 82.281
11 .628 3.140 85.422
12 .558 2.788 88.210
13 .535 2.676 90.886
14 .451 2.255 93.141
15 .367 1.833 94.974
16 .250 1.249 96.223
17 .240 1.201 97.423
18 .221 1.105 98.528
19 .172 .858 99.386
20 .123 .614 100.000
a. When factors are correlated, sums of squared loadings cannot be added to obtain a total variance.
Total Variance Explained
Factor
Initial Eigenvalues Extraction Sums of Squared Loadings
Extraction Method: Principal Axis Factoring.

199
Appendix O – Managerial Factor Total variance explained
Rotation Sums of Squared
Loadingsa
Total % of Variance Cumulative % Total % of Variance Cumulative % Total
1 8.655 27.920 27.920 8.187 26.411 26.411 7.775
2 2.962 9.553 37.473 2.400 7.741 34.152 2.267
3 2.528 8.156 45.629 1.954 6.302 40.454 3.583
4 1.958 6.317 51.946 1.424 4.593 45.046 2.110
5 1.641 5.294 57.240
6 1.502 4.845 62.085
7 1.277 4.120 66.205
8 1.119 3.608 69.814
9 1.064 3.433 73.246
10 1.017 3.281 76.527
11 .899 2.900 79.427
12 .742 2.394 81.822
13 .688 2.219 84.040
14 .656 2.115 86.156
15 .557 1.798 87.953
16 .544 1.754 89.707
17 .464 1.496 91.203
18 .403 1.300 92.503
19 .386 1.247 93.750
20 .307 .990 94.739
21 .280 .904 95.643
22 .254 .819 96.462
23 .237 .764 97.226
24 .180 .582 97.808
25 .158 .510 98.318
26 .127 .409 98.727
27 .119 .384 99.111
28 .101 .327 99.438
29 .080 .259 99.697
30 .059 .191 99.888
31 .035 .112 100.000
a. When factors are correlated, sums of squared loadings cannot be added to obtain a total variance.
Total Variance Explained
Factor
Initial Eigenvalues Extraction Sums of Squared Loadings
Extraction Method: Principal Axis Factoring.

200
Appendix P – Correlations of SDIC, GR, Customer integration, TF and MF
Descriptive Statistics
Mean Std. Deviation N
SUMSDIC 16.1351 2.42856 37
SUMGR 6.8421 1.55140 38
SUMCUSTINTE 11.5227 1.87379 44
SUMTF 42.6667 6.81063 27
SUMMF 77.1765 13.10672 34
Correlations
SUMSDIC SUMGR SUMCUSTINTE SUMTF SUMMF
SUMSDIC Pearson Correlation 1 .136 -.237 .267 .496**
Sig. (2-tailed) .473 .185 .218 .009
N 37 30 33 23 27
SUMGR Pearson Correlation .136 1 .399* .411* .265
Sig. (2-tailed) .473 .019 .046 .182
N 30 38 34 24 27
SUMCUSTINTE Pearson Correlation -.237 .399* 1 -.040 .001
Sig. (2-tailed) .185 .019 .851 .997
N 33 34 44 25 30
SUMTF Pearson Correlation .267 .411* -.040 1 .358
Sig. (2-tailed) .218 .046 .851 .158
N 23 24 25 27 17
SUMMF Pearson Correlation .496** .265 .001 .358 1
Sig. (2-tailed) .009 .182 .997 .158
N 27 27 30 17 34
**. Correlation is significant at the 0.01 level (2-tailed).
*. Correlation is significant at the 0.05 level (2-tailed).
Table – Correlation of SUMMF and SUMSDIC