understanding the factors that influence a metabolomics
TRANSCRIPT

Metabolomic Profiling in Drug Discovery: Understanding the Factors that Influence a Metabolomics Study and Strategies to Reduce Biochemical and Chemical Noise
Mark Sanders1;Serhiy Hnatyshyn2; Don Robertson2; Michael Reily2; Thomas McClure1; Michael Athanas3, Jessica Wang1, Pengxiang Yang1 and David Peake1
1Thermo Fisher Scientific, San Jose, CA; 2Bristol Myers Squibb, Princeton, NJ 3Vast Scientific, Boston, MA

Metabolomics in Drug Discovery
Pattern recognition “Good” profile verses “bad” profile
Identification and quantitation of endogenous “markers” Compound selection
Target effects – efficacy markers Off-target effects – toxicity/liability markers
Identification of markers provides mechanistic insights Target validation Mechanism of toxicity
Early evaluation of potential clinical markers

Targeted Analysis Metabolite target analysis Analysis restricted to metabolites of an enzyme system that
are known to be affected by a certain perturbation Metabolite profiling Analysis focused on a class of compounds associated with a
particular pathway (e.g. nucleoside triphosphates, lipids, steroids, etc.)
Only find what you are looking for
Untargeted Analysis A comprehensive analysis of all metabolites A measure of the fingerprint of biochemical perturbations Useful when you don’t know what to expect Hypothesis generation
Metabolomics in Drug Discovery

Metabolomics Analysis
• Goals • Quantitative assessment of the biochemical
makeup of the samples • Differential analysis between sample groups • Identify compounds responsible for changes
• Challenges
• Complexity of a biological sample • Diversity of small molecule metabolites • Wide range of metabolite concentration • Multiple sources of variability • Incomplete information – majority of
components seen by LC/MS are unknowns • Structure elucidation of unknowns is expensive
Need sophisticated data reduction tools and strategies to minimize “noise”

Sources of Noise in a Metabolomics Study • Instrumental
• Mass and retention time stability • Robust and stable detector response
• Sufficient resolution to resolve isobaric interference • Chemical (Data Processing)
• Background from column/solvents • Multiple signals per compound • Setting the threshold
• Biological • Different response rates to a stimulus between individuals • Stress status • Feeding status • Other health factors
• Study Design • Proper controls and randomized sampling/analysis to minimize systematic errors • Sampling, sample preparation and storage
• Statistical Analysis • Limited sampling, over fitting data

Q Exactive: Benchtop Quadrupole Orbitrap
• Quadrupole mass filter
• Quadrupole: hyperbolic rods • Isolation down to 0.4 amu
• HCD collision cell • Analogous to LTQ Orbitrap Velos
• Precursor ion selection for
SIM and MS/MS functionality
Instrumentation
• Higher scan speed
• S-lens • Stacked Ring Ion Guide • Analogous to LTQ Velos • Shorter inject times
• Parallel Processing • Ions collected in C-trap
while orbitrap is scanning
• Advanced Signal Processing • Improved resolution • Faster acquisition speed

Q Exactive: Speed
Peakwidth (FWHM) ~ 1 sec Scans/peak = 21
1.75 1.80 1.85 1.90 1.95 Time (min)
0
10
20
30
40
50
60
70
80
90
100
Rel
ativ
e Ab
unda
nce
1.75 1.80 1.85 1.90 1.95 Time (min)
0
10
20
30
40
50
60
70
80
90
100
Rel
ativ
e Ab
unda
nce
Peakwidth (FWHM) ~ 1 sec Scans/peak = 11
Resolution Setting: 35,000 Resolution Setting: 70,000
Instrumentation

311.0 311.5 312.0 312.5 313.0 313.5 m/z
311.1689
312.1715
313.1641
Q Exactive: Resolution Setting - 70,000
313.14 313.16 313.18 313.20 m/z
313.1641
313.1741
34S
13C2
Instrumentation
Calculated 35,000 Resolution
C17H27O3S
313.10 313.15 313.20 313.25 m/z
313.1669

185.5 186.0 m/z
185.0968
186.1003
185.0968
186.1002
185.0969
186.1003 185.0968
186.1002
4.28
4.27
4.28
4.27
XIC 185.0969 ± 5ppm
7:51pm
11:14pm
3:32am
8:08am
-0.45ppm
-0.72ppm
-0.24ppm
-0.72ppm
-0.04ppm
-0.31ppm
0.39ppm
-0.47ppm Ext.Cal + 65.13 hrs
4.15 4.20 4.25 4.30 4.35 4.40 Time (min)
FWHM = 1.86 sec
Q Exactive: Mass and Response Stability D5-hippuric acid, external calibration, resolution = 82,000
CV = 2.4%
Chromatograms Mass Spectra
Instrumentation

0 50 100 150 200 250 300 350 400 450 500 550 0.0 0.2 0.4 0.6 0.8 1.0 1.2 1.4 1.6 1.8 2.0 2.2 2.4 2.6 2.8 3.0 3.2 3.4 3.6 3.8 4.0 4.2 4.4 4.6 4.8
Are
a R
atio
Q Exactive: High Sensitivity Quantitation Testosterone 10pg/mL in Serum
Standard pg/mL
% Difference
10 0.97
20 7.45
50 -5.78
100 -0.29
250 -5.35
500 2.99
Testosterone 10 pg/mL in Serum
Instrumentation
Concentration (pg/mL)
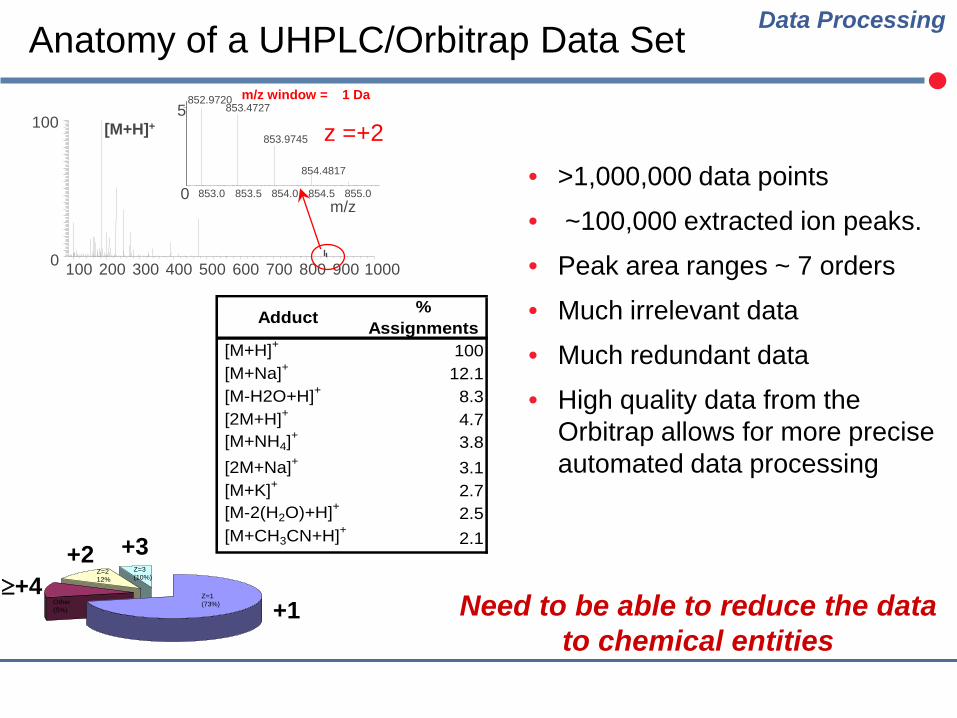
m/z window = 1 Da
100 200 300 400 500 600 700 800 900 1000 0
100 [M+H]+
m/z 853.0 853.5 854.0 854.5 855.0 0
852.9720 853.4727
853.9745
854.4817
z =+2 5
• >1,000,000 data points
• ~100,000 extracted ion peaks.
• Peak area ranges ~ 7 orders
• Much irrelevant data
• Much redundant data
• High quality data from the Orbitrap allows for more precise automated data processing
Need to be able to reduce the data to chemical entities
Anatomy of a UHPLC/Orbitrap Data Set
Z=1(73%)Other
(5%)
Z=212%
Z=3(10%)
Adduct % Assignments
[M+H]+ 100 [M+Na]+ 12.1 [M-H2O+H]+ 8.3 [2M+H]+ 4.7 [M+NH4]
+ 3.8 [2M+Na]+ 3.1 [M+K]+ 2.7 [M-2(H2O)+H]+ 2.5 [M+CH3CN+H]+ 2.1
+1
+2 +3 ≥+4
Data Processing

= Analyte signals Sample - Solvent blank
~98% of lower intensity signals are eliminated
Background Subtraction Data Processing

180.07
202.05 576.13 413.04
[M+H]+
[M+Na]+ [2M+H]+
100 150 200 250 300 350 400 450 500 550 600 m/z
359.12
m/z 180.0652 [M+H]+
2 3 4 5
3.37 4e7
3e5
1e6
9e5
m/z 576.1277 [3M+Ca-H]+
m/z 591.0930 [3M+Fe-2H]+
m/z 413.0427 [2M+Fe-H]+
Time (min)
Spectral Interpretation
Hippuric Acid
NH
OH
O
O
ESI+ 12 related ions ESI - 24 related ions
Data Processing
Rat Urine

180.07
202.05 576.13 413.04
[M+H]+
[M+Na]+ [2M+H]+
100 150 200 250 300 350 400 450 500 550 600 m/z
359.12
m/z 180.0652 [M+H]+
2 3 4 5
3.37 4e7
3e5
1e6
9e5
m/z 576.1277 [3M+Ca-H]+
m/z 591.0930 [3M+Fe-2H]+
m/z 413.0427 [2M+Fe-H]+
Time (min)
Spectral Interpretation
590 592 594 m/z
591.0929
592.0975
593.1014 589.0975
591.0935
592.0965
593.0987 589.0981
594.0981
594.1010
590.1034
590.1013
Measured
Theoretical C27H25N3O9Fe
Fe Isotope Pattern Detected
Data Processing
Rat Urine

Varying Response with Different Ion Species
Trp Phe415,983 2,574,163 420,085 2,614,732 410,093 2,494,727 427,342 2,479,608 423,358 2,448,543 416,844 2,439,600
418,951 2,508,562 6,047 70,659
1.4% 2.8%
Data Processing
M+H [2M+Fe-H]+ [3M+Ca]+ [3M+Fe-2H]+122,738,814 869,212 2,576,598 527,298 119,451,097 824,794 2,471,863 499,852 117,092,066 689,807 2,234,709 456,582 115,057,559 623,152 2,167,836 432,552 115,387,079 573,090 2,138,694 417,703 117,957,232 560,476 2,157,101 409,896
117,947,308 690,089 2,291,134 457,314 2,858,562 130,537 186,409 47,198
2.4% 19% 8% 10%
Hippuric Acid
Rat Urine

Varying Response with Different Ion Species
Trp PheM+H M+H415,983 2,574,163 420,085 2,614,732 410,093 2,494,727 427,342 2,479,608 423,358 2,448,543 416,844 2,439,600
418,951 2,508,562 6,047 70,659
1.4% 2.8%
Data Processing
M+H [2M+Fe-H]+ [3M+Ca]+ [3M+Fe-2H]+122,738,814 869,212 2,576,598 527,298 119,451,097 824,794 2,471,863 499,852 117,092,066 689,807 2,234,709 456,582 115,057,559 623,152 2,167,836 432,552 115,387,079 573,090 2,138,694 417,703 117,957,232 560,476 2,157,101 409,896
117,947,308 690,089 2,291,134 457,314 2,858,562 130,537 186,409 47,198
2.4% 19% 8% 10%
Hippuric Acid
Rat Urine
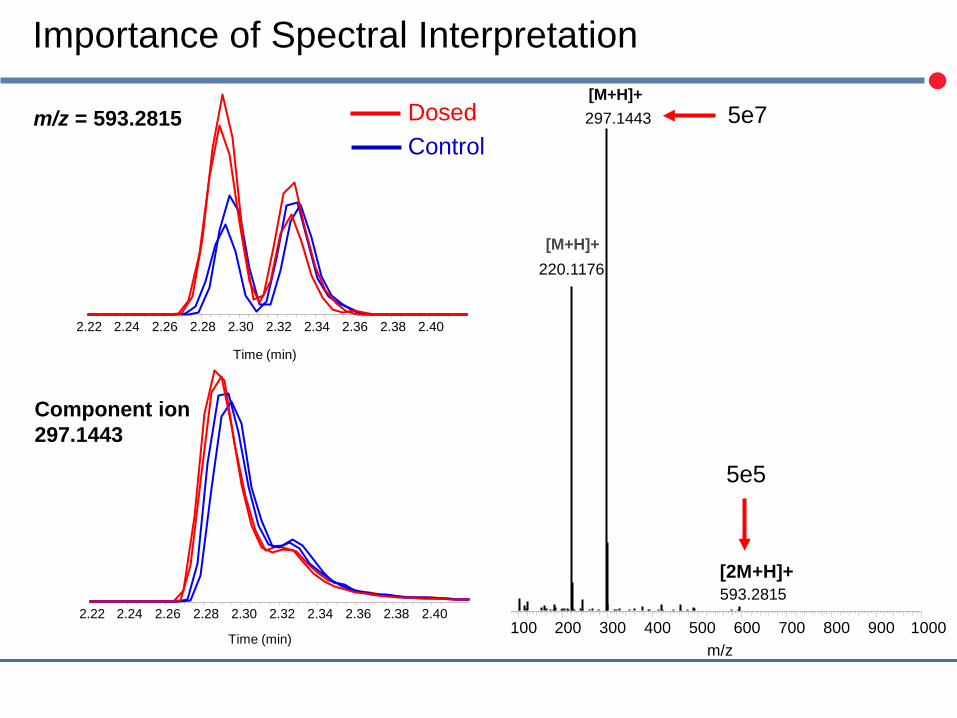
Importance of Spectral Interpretation
2.22 2.24 2.26 2.28 2.30 2.32 2.34 2.36 2.38 2.40
Time (min)
m/z = 593.2815
2.22 2.24 2.26 2.28 2.30 2.32 2.34 2.36 2.38 2.40
Time (min)
Component ion 297.1443
Dosed [M+H]+
[2M+H]+
[M+H]+
100 200 300 400 500 600 700 800 900 1000 m/z
297.1443
220.1176
593.2815
5e7
5e5
Control

Removing Noise from the Statistics
Fasted Fed
Female
Male
Components
No group separation
m/z Peaks
Large intra group variability
Data Processing

Statistically rigorous automated label-free LC/MS differential analysis platform
Applied to: peptide, protein, small molecule data
State 1 Raw file
State 2 raw file
State … raw file
Workflow
Align Detect Identify
Reports: •Components •Identification •Relative Quantitation •Statistical Analysis •Trend information
SIEVE Analysis Platform

Unaligned basepeaks
SIEVE Workflow – Alignment
Wine

Aligned basepeaks
Alignment scores
SIEVE Workflow – Alignment
Wine
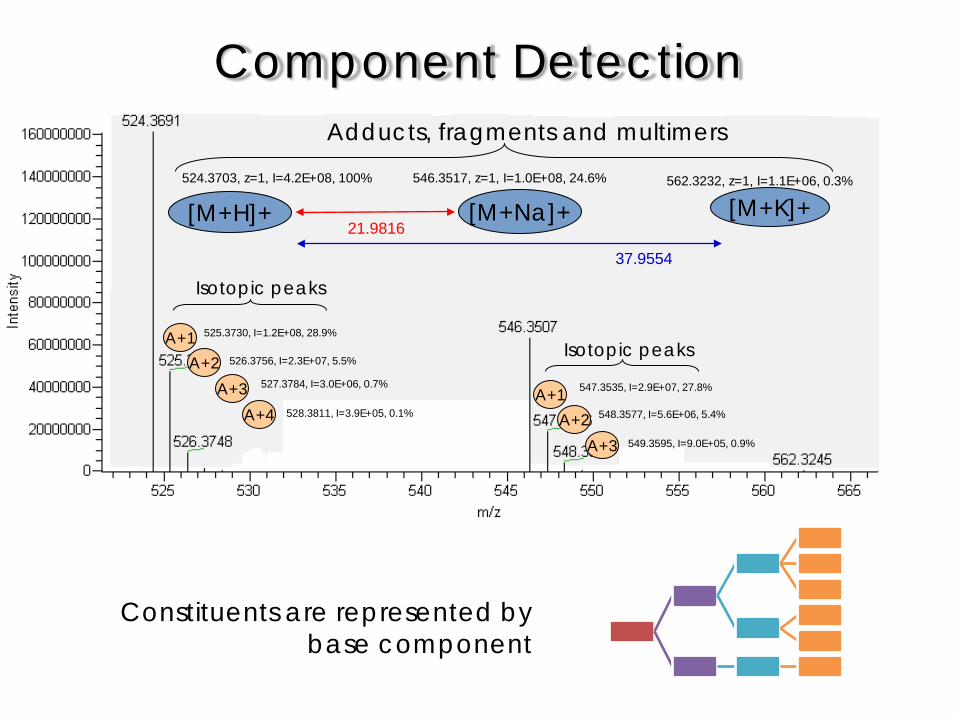
Adducts, fragments and multimers
[M+H]+ [M+Na]+ [M+K]+ 524.3703, z=1, I=4.2E+08, 100% 546.3517, z=1, I=1.0E+08, 24.6% 562.3232, z=1, I=1.1E+06, 0.3%
A+1
Isotopic peaks
525.3730, I=1.2E+08, 28.9%
527.3784, I=3.0E+06, 0.7%
528.3811, I=3.9E+05, 0.1%
A+2 526.3756, I=2.3E+07, 5.5%
A+3 A+4
547.3535, I=2.9E+07, 27.8%
548.3577, I=5.6E+06, 5.4%
549.3595, I=9.0E+05, 0.9%
A+1 A+2
A+3
Isotopic peaks
21.9816
37.9554
Component Detection
Constituents are represented by base component

Accurate Mass Identification
Local database
chemspider web service
Component MW
List of candidates
MolWt Expression Name290.079 L-Epicatechin306.074 Epigallocatechin
314.01 D-glycoside of vanillin380.1254 Vellokaempferol 3-5-dimethyl ether382.1047 Velloquercetin 4 -methyl ether426.0945 Epigallocatechin 3-O-(4-hydroxybenzoate)436.1153 Epigallocatechin 3-O-cinnamate450.0793 Quercetin 4 -galactoside468.1051 Epigallocatechin 3-O-caffeate
472.1 Epigallocatechin 3-O-(3-O-methylgallate)477.1266 Isorhamnetin 7-alpha-D-Glucosamine;Quercetin 3 -methyl ether 7-alpha-D-Glucosam478 0742 Q i 7 l id

Rat Fasting Study
• Study designed to monitor the effect of fasting on metabolic profiles
1 Rats fasted during a 6 p.m. to 6 a.m. dark cycle to capture peak feeding time
Biology
Group Male Fasting Time1
1: 1101-1105 5 Dark Cycle Control (no Fast)
2. 2101-2105 5 2 hr Fast 3. 3101-3105 5 4 hr Fast 4. 4101-4105 5 8 hr Fast 5. 5101-5105 5 12 hr Fast 6. 6101-6105 5 16 hr Fast
• Samples: 50uL Serum ppt with cold MeOH • MS: Q Exactive @ 70K resolution, ESI+ and ESI- • UHPLC: Accela 1250 • Column: Hypersil GOLD aQ 2.1x150mm, 1.9µ @ 600µL/min, 50ºC • Buffers: A: 0.1% formic acid in H2O, B: 0.1% formic acid in 98:2 ACN:H2O

Pooled Quality Controls
Pooled QC Treated Control
*Sangster, et. al., Analyst, 2006, 131, 1075 - 1078 QC Treated Control
…
Sample 1
Sample 2
Sample 3
Sample 52 Pooled QC
Component of Interest
IS citrulline Tyr Phe Trp 273.1479_1.07pooled QC 20,903,851 969,474 18,350,003 19,904,399 20,685,704 10,918,321pooled QC 22,076,315 1,041,539 20,227,547 20,984,429 22,968,636 9,599,500pooled QC 22,088,562 1,182,143 20,853,789 21,040,901 23,310,086 9,010,457pooled QC 22,052,324 1,205,426 20,390,553 21,477,887 23,583,964 8,213,523pooled QC 22,042,181 1,153,795 21,417,740 22,061,286 23,215,235 6,456,432pooled QC 22,778,779 1,244,100 21,862,115 21,822,323 23,765,745 3,499,156
3% 9% 6% 4% 5% 33%
Sam
e Sa
mpl
e Inj. # 3
14 25 36 47 53

Finding the Differences PCA, rat plasma negative mode
Control - Fed 16hr
4hr
12hr
Pooled Controls
Biology

-
200,000,000
400,000,000
600,000,000
800,000,000
1,000,000,000
1,200,000,000
QC Blank DC 2h 4h 8h 12h
-
50,000,000
100,000,000
150,000,000
200,000,000
250,000,000
300,000,000
350,000,000
400,000,000
450,000,000
QC Blank DC 2h 4h 8h 12h
Examples of Metabolite Changes on Fasting
-
50,000,000
100,000,000
150,000,000
200,000,000
250,000,000
QC Blank DC 2h 4h 8h 12h
-
20,000,000
40,000,000
60,000,000
80,000,000
100,000,000
120,000,000
140,000,000
QC Blank DC 2h 4h 8h 12h
Methionine
Arachidonic Acid Linoleoyl-lyso-PC (18:2)
Proline
Biology

Overall Method Robustness Uric Acid: Positive and Negative Data
50,000,000
100,000,000
150,000,000
200,000,000
250,000,000
300,000,000
QC Blank DC 2h 4h 8h 12h
10,000,000
20,000,000
30,000,000
40,000,000
50,000,000
60,000,000
70,000,000
80,000,000
90,000,000
100,000,000
QC Blank DC 2h 4h 8h 12h
Negative ion
Positive ion Time between analysis 30 hrs
Biology

Biological Variability: Sometimes Unavoidable Biology
-
1,000,000
2,000,000
3,000,000
4,000,000
5,000,000
6,000,000
QC Blank DC 2h 4h 8h 12h
-
1,000,000
2,000,000
3,000,000
4,000,000
5,000,000
6,000,000
QC Blank DC 2h 4h 8h 12h
-
1,000,000
2,000,000
3,000,000
4,000,000
5,000,000
6,000,000
QC Blank DC 2h 4h 8h 12h

Study Findings
• Fasting has profound impact on metabolomic profiles
• Most metabolic changes are modest in extent
• Fasting-status may exacerbate or obscure drug-induced metabolic effects.
• Fasting data help contextualize drug-induced changes in many metabolites
• As part of the study design, fasting is neither “right” or “wrong” but it is a significant variable in model design
Biology

Summary
• Metabolomics is very challenging. It is fraught with numerous sources of noise and the cost of going down the wrong path is high
• Instrumentation • Needs to be precise and robust – good quality in, good quality out • Q Exactive provides an ideal platform
• Excellent mass accuracy with external calibration • Ultra high resolution without loss of sensitivity • High performance quantitation • Discovery and validation on the same platform
• Chemical Noise (Data Processing) • The right software and the right controls can make all the difference • Intelligent data reduction tools can significantly reduce noise
• Biological Noise • Needs to be understood through systematic studies • Metabolomic prescreening can identify biological outliers
• Ensure homogeneity within the study

Comparison of Palm Oil Samples
Control
Adulterated
0 2 4 6 8 10 12 14 16 18 20 Time (min)
0
20
40
60
80
100
Rel
ativ
e A
bund
ance
0
20
40
60
80
100
Rel
ativ
e A
bund
ance
13.56 12.89 11.29 3.21
15.27 9.31 3.28
2.86 7.87
4.89 2.56 4.98
5.73 1.53
13.37 11.43 14.87 3.20
9.34
2.85 7.89
4.90 2.56 5.01
5.66 1.52
2.68E10
2.69E10

Comparison of Palm Oil Samples
0 1 2 3 4 5 6 7Time (min)
0
10
20
30
40
50
Rel
ativ
e A
bund
ance
0
10
20
30
40
50
Rel
ativ
e A
bund
ance 4.89 4.902.56
4.693.702.34 3.734.98
5.064.20 5.73 5.725.63 6.845.961.53
1.881.461.190.850.44
4.902.56 4.843.71 4.693.742.334.25 5.01
5.09 5.66 6.855.77 6.821.52
1.651.340.30 0.51
2T
2T gControl
Adulterated

Sieve for Differential Analysis
Easy to use wizard walks you through the process and parameters of a differential analysis and unknown identification

Sieve for Differential Analysis
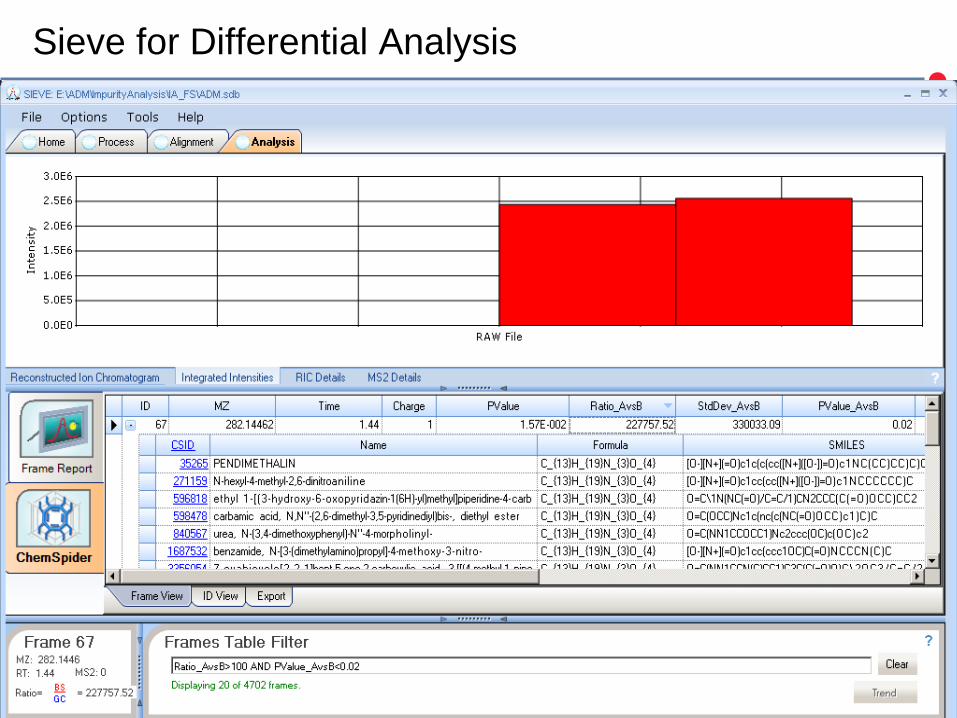
Sieve for Differential Analysis


Thanks!
• Serhiy Hnatyshyn
• Michael Reily
• Don Robertson
• Jessica Wang
• Pengxiang Yang
• Michael Athanas
• Thomas McClure
• David Peake
• Kate Comstock
• Yingying Huang
• Patrick Bennett
• Markus Kellmann • Catharina Crone
• Thomas Moehring
• Alexander Makarov
• Eugen Democ
• Frank Czemper
• Sebastian Kanngiesser
• Andreas Wieghaus