understanding teacher labor markets: an update don boydhamp lankford university at albany susanna...
TRANSCRIPT

Understanding Teacher Labor Markets:An Update
Don Boyd Hamp Lankford
University at Albany University at Albany
Susanna Loeb Jim Wyckoff
Stanford University University at Albany

Teacher Labor Markets and the Behavior of Teachers
How are the qualifications of teachers sorted?
How do teacher’s careers progress?
What is the geography of teacher labor markets?
What determines the initial match of teachers to jobs?
Who enters teaching?
What factors affect teacher quit and transfer decisions?
Several papers are available at www.teacherpolicyresearch.org .

Workforce Database
Universe TIME SOURCE:
Personnel data (BEDS)
All public school teachers, administrators and staff
1970-2002 NYSED
Certification and exam data
All those taking certification exams
1985-2002 NYSED
SUNY student data
All SUNY applicants 1990-2000 SUNY
School and district data
All public schools & districts 1970-2002 NYSED
Sorting of Teachers
• What is the distribution of teacher qualifications within and between districts?
• How do these qualifications vary with student attributes?
Teachers are sorted such that low-performing, non-white and poor students are most likely to be taught by the least qualified teachers.

What Explains These Between- and Within-District Differences in the Qualifications of Teachers?
What are the choices key in explaining the sorting of teachers?
• Initial job matches• Job transfers• Quits
What are the key determinants of each of these choices?
• Preferences of teachers • Factors considered by school officials • Institutional constraints

Teacher Qualifications by Proportion Failing Student Achievement Test, School Level, 2000
Percent of Students in
Level 1 4th Grade ELA
0 0 – 5% 5 - 20% >20%
Not Certified 0.03 0.04 0.09 0.22
Failed Gen. Exam 0.09 0.10 0.19 0.35
Most Comp. Coll. 0.11 0.11 0.09 0.08
Least Comp. Coll. 0.10 0.11 0.16 0.26
Factor 0.98 0.86 -0.30 -2.82

Select Teacher Qualifications by Student Attributes, 2000
Not certified in any subject taught
Failed LAST exam
Attended least comp. college
New York State
Non-White 0.17 0.21 0.21
White 0.04 0.07 0.10
Poor 0.21 0.28 0.25
Non-Poor 0.16 0.20 0.24
New York City
Non-White 0.21 0.26 0.25
White 0.15 0.16 0.25
Poor 0.22 0.30 0.27
Non-Poor 0.17 0.21 0.26

1995 Cohort of NYC Teachers Failing Certification Exam by Quartile of Student Performance
Initial match is 43% of gap after 6 years; transfers and quits make up 57% (Quartile 4 – Quartile 1)
15%
20%
25%
30%
35%
40%
1995 1996 1997 1998 1999 2000
% 1
995
Coh
ort
Fai
led
Exa
m
Quartile 1 Quartile 2 Quartile 3 Quartile 4

Percent of 1995 Cohort of NYC Teachers Failing Certification Exam by District Geography
Initial match is 75% of gap after 6 years , transfers and quits 25% (NYC Urban – NYC Suburban)
0%
5%
10%
15%
20%
25%
30%
1995 1996 1997 1998 1999 2000
% F
ail
ed
Ex
am
NYC - Urban NYC - SuburbanOther - Urban Other - Suburban

Proportion of NYC Teachers Who Transferred to Another District by Cohort
and Number of Years Teaching
0
0.02
0.04
0.06
0.08
0.1
0.12
0 2 4 6 8 10
number of years teaching
pro
po
rtio
n t
ran
sfe
rrin
g
(in
to
tal)
1990
1999
19931996

The Geography of Teacher Labor Markets
What defines the geography of the regions within which teachers look for jobs? How big are teacher labor markets?
How does geographical proximity affect the job choices of teachers?

Distance from Home to First Job, First Time Teachers, 1999-2002
85 percent of teachers take a first job within 40 miles of home
Region of First Job 0 to 15 miles
15 to 40 miles
40 to 100 miles
100 or more miles
Buffalo City 76.0 10.3 3.7 9.9Buffalo suburbs 71.0 18.3 4.3 6.3New York City 63.4 26.9 6.6 3.1New York City Sub 71.0 22.7 3.6 2.8Rochester City 54.2 11.4 18.7 15.8Rochester Suburbs 44.8 25.9 18.2 11.2All 60.8 23.9 8.6 6.7
Distance from Home to First Job

Distance from Home to First Job for Those Who Go Away to College, First Time Teachers, 1999-2002
Most who go away to college come home to take a first job.
Home to CollegeHome to Job 100 or more
miles0 to 15 miles 48.015 to 40 miles 24.040 to 100 miles 8.9100 or more miles 19.1All 23.9

Determinants of Employment Location of New Teachers
Multivariate analysis of location choice among 16 regions (separate urban and suburban areas of six MSAs and three rural areas).
• Distance from high school has largest effect on choice of region.
• Teachers are 4 times more likely to locate in a region that is five miles from home as one that is 40 miles from home.
• The effect of distance from college is smaller.
• Similarity of region is important, even holding distance constant.
• A teacher having a suburban home is 4.5 times as likely to teach in that suburban area as opposed to teaching in the adjacent urban district.

Urbanicity of Home and Urbanicity of First Job, First Time Teachers, 1999-2002
• Urban districts are net importers of teachers.
• The geographical distribution of teachers and their preferences for job proximity disadvantage urban schools.
Region
of Home Urban Suburban Rural All
Urban % Row 87.8 10.4 1.8 100.0%Col 59.9 6.4 2.9 27.1
Suburban % Row 25.7 66.9 7.4 100.0%Col 36.1 85.7 24.6 55.8
Rural % Row 9.2 20.0 70.9 100.0%Col 4.0 7.9 72.4 17.1
All PctN 39.7 43.6 16.7 100.0
Region of First Job

Initial Matches of Teachers and Jobs
• What preferences by teachers and employers determines the initial match of teachers to jobs?
• What additional monetary and non-monetary compensation would be needed to attract sufficient numbers of highly qualified teachers to traditionally hard to staff schools?

Estimating Compensating Differentials
(salary premiums needed to attract more qualified teachers to hard-to-staff schools)
The traditional approach has been to employ hedonic wage models.
Problems with the hedonic approach:
• Conceptual (theoretical) problems.
• Empirical results typically are inconsistent.
These difficulties have lead us to develop an alternative approach that accounts for important features of teacher labor markets.

Two-sided matching model
Initial results are very encouraging.
• Disentangle the factors affecting the separate choices of teachers and school officials responsible for hiring.
• Preliminary estimates of some compensating differentials
• Inferences regarding what attributes of teachers are important to school officials in their hiring decisions?

Some Major Findings and Implications
• There is extensive sorting of teachers such that the lowest-achieving, minority and poorest students typically are taught by the least qualified teachers.
• Initial job matches, transfers and quits each significantly contribute to this sorting.
• The unfolding retirement of large numbers of current teachers is likely to exacerbate current difficulties in attracting highly able teachers to hard-to-staff schools.
• Teachers' preferences for job proximity and the geographical distribution of teachers disadvantage urban schools and underscore the importance of teacher preparation.
• Many questions remain regarding how best to attract more qualified teachers to hard-to-staff schools.


Identifying the Next Generation of School Leaders Hamp Lankford, Ray O’Connell and Jim Wyckoff
University at Albany, SUNY
We appreciate the advice and support of Dr. Kevin McGuire, Leadership Project, NYSED

Age Distribution of New York State Principals, 1990-2000
Age Distribution of Principals 1990, 1995, 2000
0
100
200
300
400
500
35 40 45 50 55 60 65
Age
Pri
ncip
als
1990
1995
2000

Cumulative Number of Individuals Certified to be Principals by Age, NYS 2000
0
4000
8000
12000
20 25 30 35 40 45 50
Age
Num
be
r o
f In
div
iduals
# Certified Principals

Research Questions
Why did they seek administrative certification?
What were their experiences in searching for administrative positions?
What are their career aspirations?
Are they interested in pursuing school leadership positions?
Do they feel prepared for an administrative position?
What conditions would they assume an administrative position?

Data
Mail survey of all 7809 individuals with administrative certification, not older than 50 who are working NYS public schools and not currently serving as principals or superintendents.
Useable response rate of 39 percent.
Results reported here are for 1170 individuals who are currently non-administrators; separate results for those currently serving in administrative positions are presented in the paper.
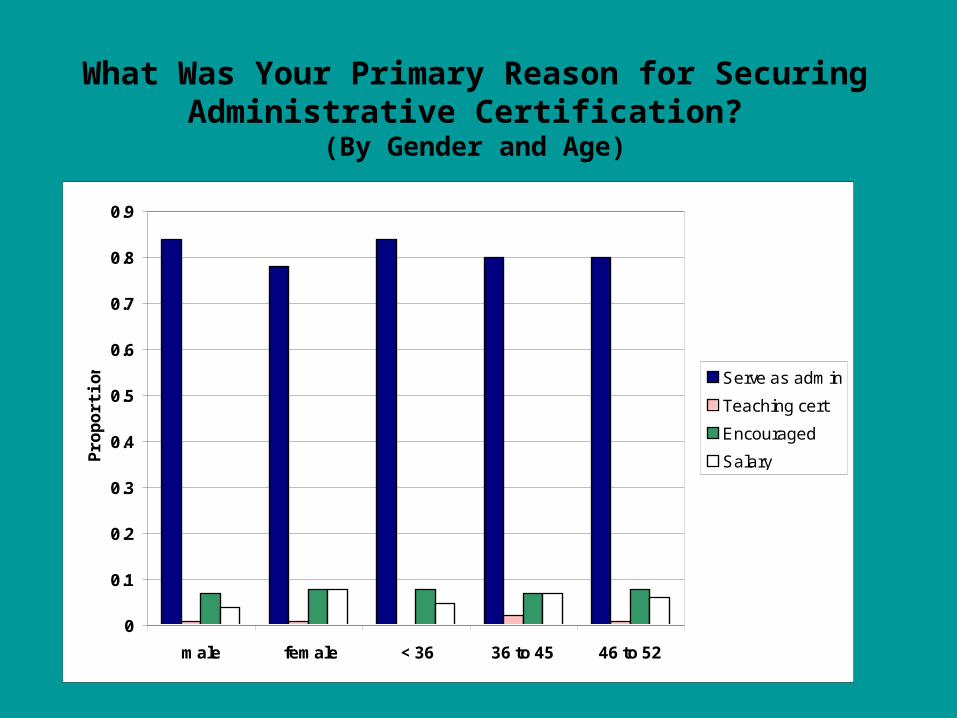
What Was Your Primary Reason for SecuringAdministrative Certification?
(By Gender and Age)
0
0.1
0.2
0.3
0.4
0.5
0.6
0.7
0.8
0.9
male female < 36 36 to 45 46 to 52
Pro
po
rtio
n Serve as admin
Teaching cert
Encouraged
Salary

Have You Ever Applied for anAdministrative Position?
(By Gender and Age, Proportion Yes)
0
0.1
0.2
0.3
0.4
0.5
0.6
0.7
0.8
male female < 36 36 to 45 46 to 52

For How Many Years Following Certification Did You Apply for Administrative Positions?
(by Gender and Age)
0
0.1
0.2
0.3
0.4
male female < 36 36 to 45 46 to 52
Less than 1
1 to 2
3 to 5
6 or more

Were You Offered an Administrative Position You Turned Down?
(by Gender and Age, Proportion Yes)
0
0.1
0.2
0.3
0.4
0.5
male female < 36 36 to 45 46 to 52

What Factors Affected Your Decision to Turn Down an Administrative Position?
(by Gender)
0
0.1
0.2
0.3
0.4
0.5
0.6
0.7
0.8
0.9
Relocation Salary Tenure Personal Workingconditions
Pro
po
rtio
n
male
female

If Ever Applied for Administrative Positions, Have You Stopped?
(by Gender and Age, Proportion Yes)
0
0.1
0.2
0.3
0.4
0.5
0.6
0.7
male female < 36 36 to 45 46 to 52

If Stopped Applying for Administrative Positions, Why?
(by Gender and Age)
0
0.1
0.2
0.3
0.4
0.5
0.6
0.7
0.8
0.9
1
male female < 36 36 to 45 46 to 52
Pro
po
rtio
n Tenured
Compensation
Working conditions
Stress

If Stopped Applying for Administrative Positions, Why (con’t)?
0
0.1
0.2
0.3
0.4
0.5
0.6
0.7
0.8
0.9
1
male female < 36 36 to 45 46 to 52
Pro
po
rtio
n Unsuccessful
Not prepared
Competition
Few positions

What Are Your Feelings About Pursuing First Administrative Position
(by Gender and Age)
0
0.1
0.2
0.3
0.4
0.5
0.6
0.7
male female < 36 36 to 45 46 to 52
Interested now
No longer interested
Never interested
Alw ays interested

Are There Conditions Under Which You Would be Willing to Assume First Administrative Position?
(by Gender and Age, Proportion Yes)
0
0.1
0.2
0.3
0.4
0.5
0.6
0.7
0.8
0.9
1
male female < 36 36 to 45 46 to 52

Factors that Would Encourage You to Consider First Administrative Position
(by Gender and Age)
0
0.1
0.2
0.3
0.4
0.5
0.6
0.7
0.8
0.9
1
male female < 36 36 to 45 46 to 52
Approached
Compensation
Prepared
Mentoring

Minimum Additional Compensation Required to Induce You to Take First Administrative Position
(by Gender and Age)
0
0.1
0.2
0.3
0.4
0.5
0.6
0.7
0.8
male female < 36 36 to 45 46 to 52
Up to $5000
$5001-$10,000
More than $10,000
No amount

Implications
Although there a large number of individuals certified to be school leaders, only 27 percent of non-administrators continue to apply for administrative positions.
Compensation, working conditions and stress are factors frequently cited for reduced interest in administrative positions.
However, most individuals indicate that they would be interested in administrative positions under the right conditions.
Compensation, being encouraged by an administrator, and being mentored are factors that would induce individuals to consider administrative positions.