understanding pump curves sulzer pumps - swowea curves.pdf · sulzer pumps the heart of your...
TRANSCRIPT

Sulzer Pumps
The Heart of Your Process
Understanding Pump Curves Presenter: Michael Stroh – Application & Project Engineer, Sulzer Pumps
June 4th, 2015
OWEA-S: Understanding Pump Curves
Sulzer Pumps
Customer presentation | May 2012 Copyright © Sulzer Pumps | Slide 2
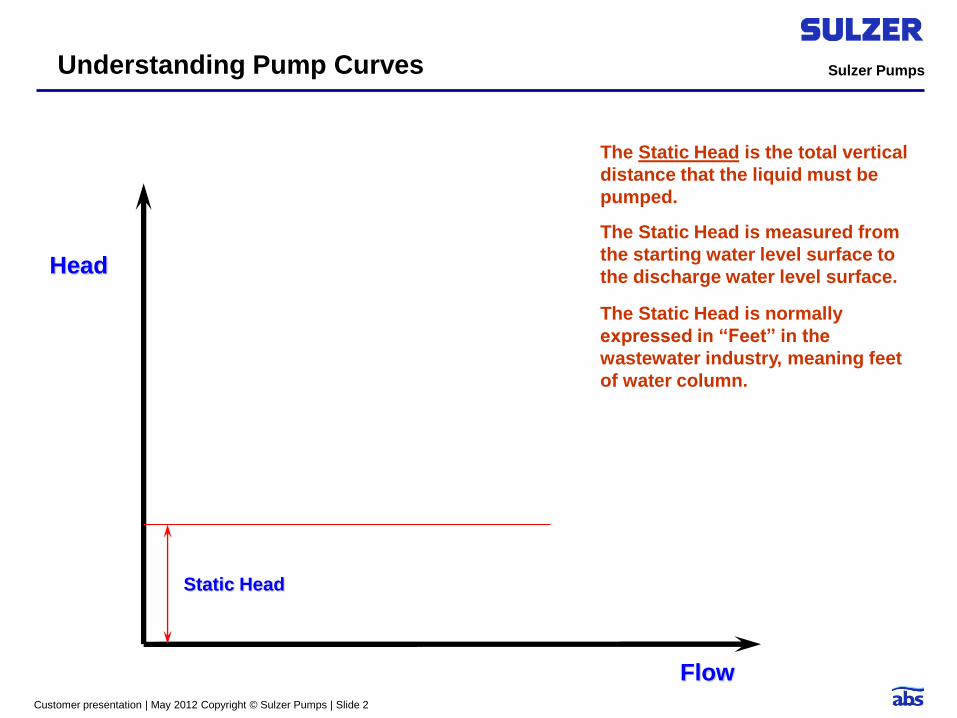
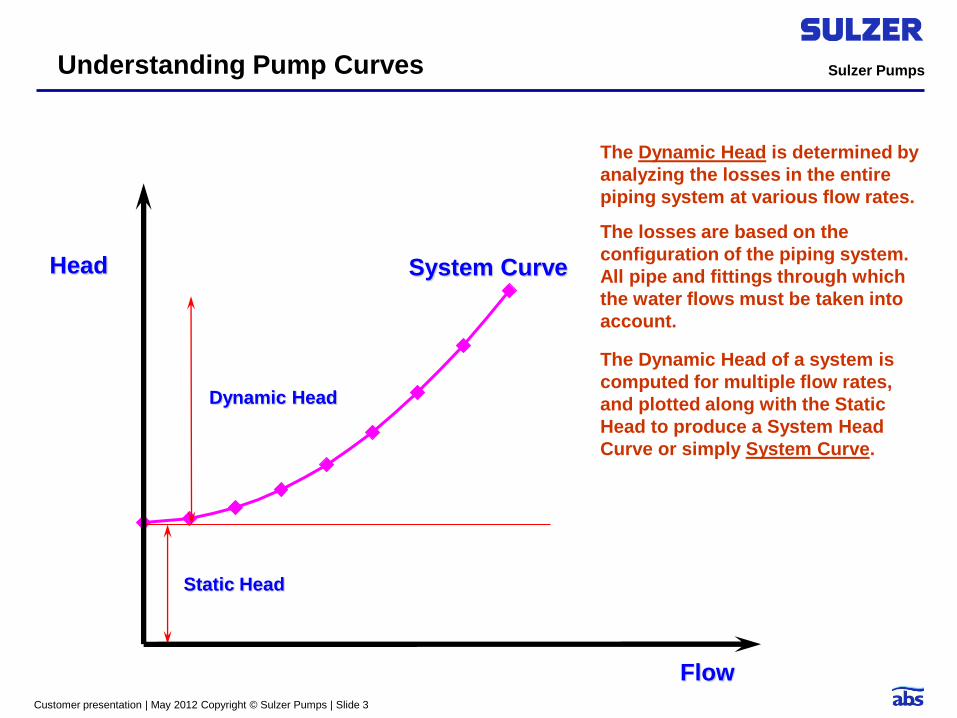
Head
Flow
Static Head
The Static Head is the total vertical
distance that the liquid must be
pumped.
The Static Head is measured from
the starting water level surface to
the discharge water level surface.
The Static Head is normally
expressed in “Feet” in the
wastewater industry, meaning feet
of water column.
Understanding Pump Curves
Sulzer Pumps
Customer presentation | May 2012 Copyright © Sulzer Pumps | Slide 3
System Curve
The Dynamic Head of a system is
computed for multiple flow rates,
and plotted along with the Static
Head to produce a System Head
Curve or simply System Curve.
Dynamic Head
The Dynamic Head is determined by
analyzing the losses in the entire
piping system at various flow rates.
The losses are based on the
configuration of the piping system.
All pipe and fittings through which
the water flows must be taken into
account.
Head
Flow
Static Head
Understanding Pump Curves
Sulzer Pumps
Customer presentation | May 2012 Copyright © Sulzer Pumps | Slide 4
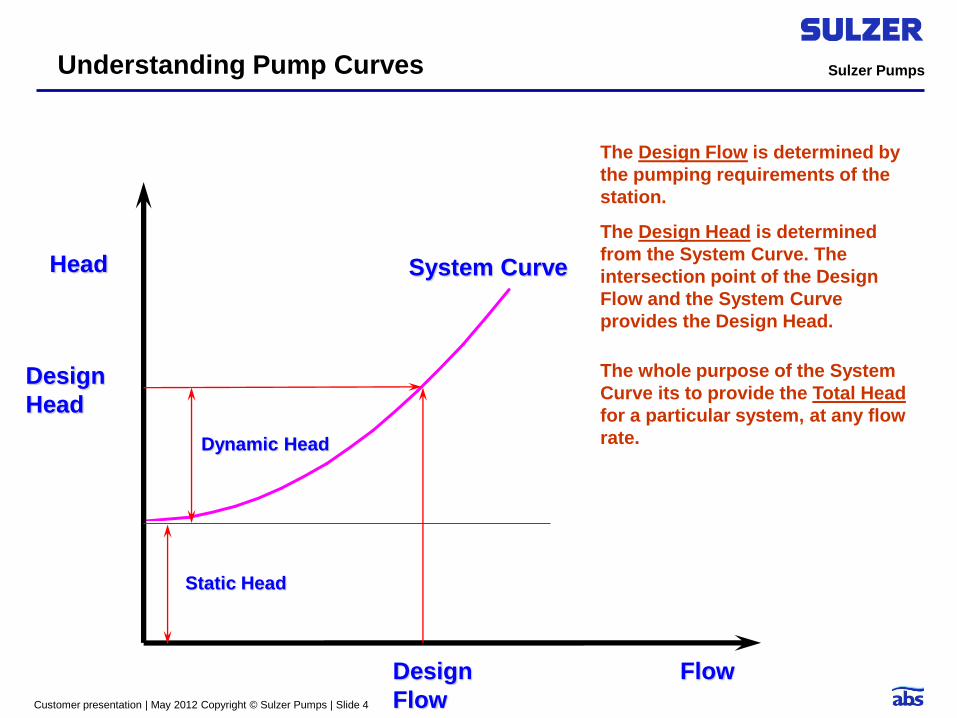
Head
Flow
System Curve
Static Head
Dynamic Head
Design
Flow
The Design Flow is determined by
the pumping requirements of the
station.
Design
Head
The Design Head is determined
from the System Curve. The
intersection point of the Design
Flow and the System Curve
provides the Design Head.
The whole purpose of the System
Curve its to provide the Total Head
for a particular system, at any flow
rate.
Understanding Pump Curves

Sulzer Pumps
Customer presentation | May 2012 Copyright © Sulzer Pumps | Slide 5
Head
Flow
Static Head
Dynamic Head
Design
Flow
Design
Head
The pump will always runs at this
intersection point. It is physically
impossible for the pump to operate
at any other point.
System Curve
The Pump Curve is then plotted on
the same graph as the System
Curve.
Pump Curve
The intersection point of the Pump
Curve and the System Curve
defines the Flow and Head at which
the pump will operate in this
particular system.
Understanding Pump Curves
Sulzer Pumps
Customer presentation | May 2012 Copyright © Sulzer Pumps | Slide 6
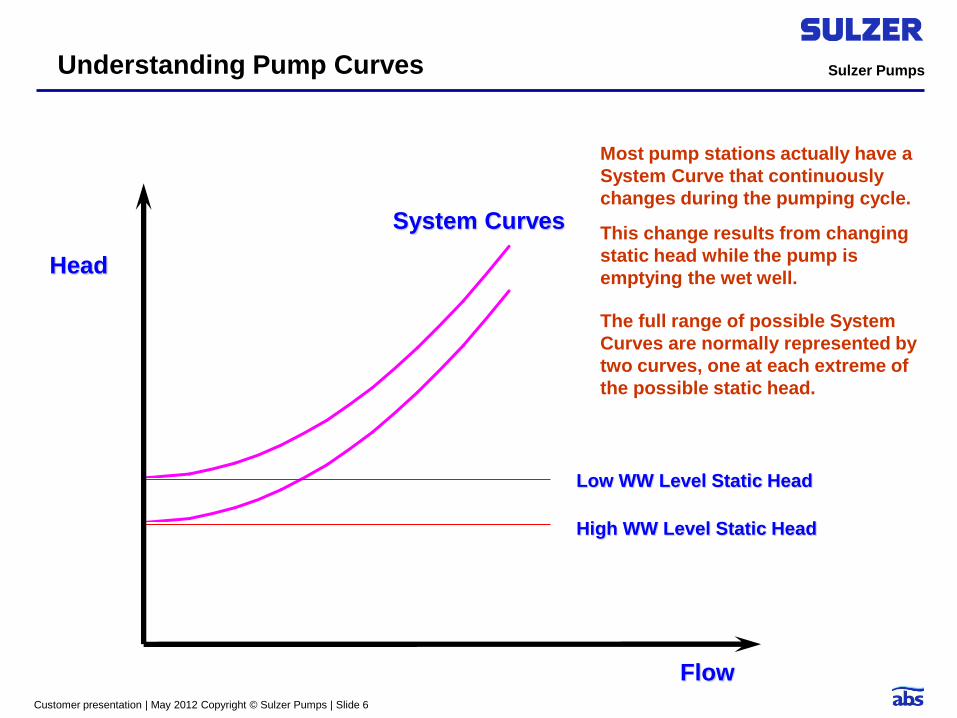
Most pump stations actually have a
System Curve that continuously
changes during the pumping cycle.
System Curves
The full range of possible System
Curves are normally represented by
two curves, one at each extreme of
the possible static head.
This change results from changing
static head while the pump is
emptying the wet well.
High WW Level Static Head
Low WW Level Static Head
Head
Flow
Understanding Pump Curves
Sulzer Pumps
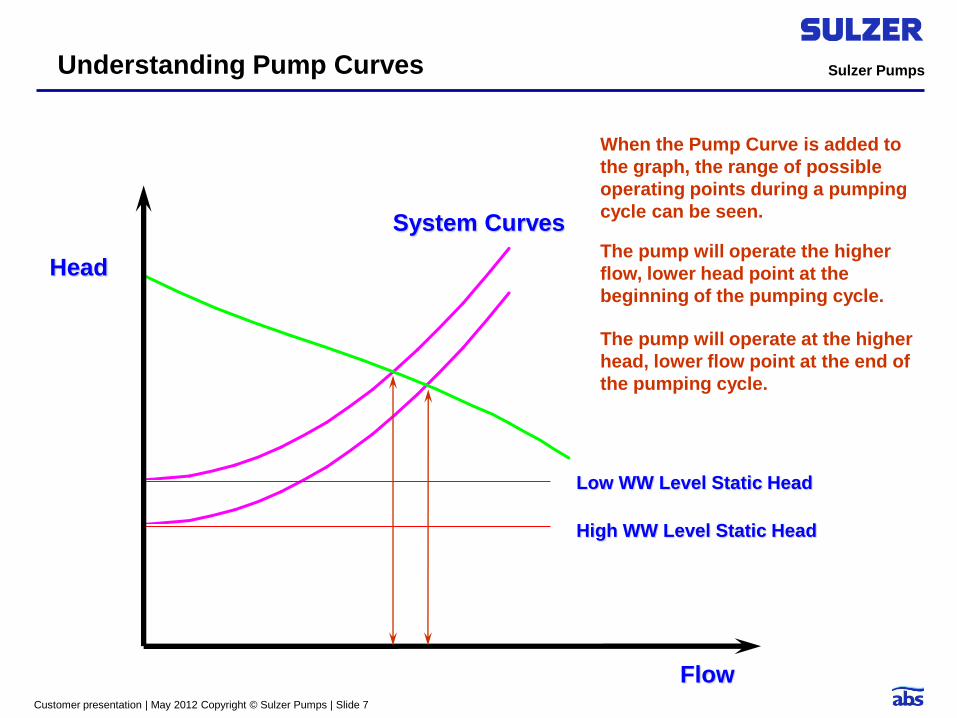
Customer presentation | May 2012 Copyright © Sulzer Pumps | Slide 7
Head
Flow
System Curves
High WW Level Static Head
Low WW Level Static Head
When the Pump Curve is added to
the graph, the range of possible
operating points during a pumping
cycle can be seen.
The pump will operate the higher
flow, lower head point at the
beginning of the pumping cycle.
The pump will operate at the higher
head, lower flow point at the end of
the pumping cycle.
Understanding Pump Curves
Sulzer Pumps
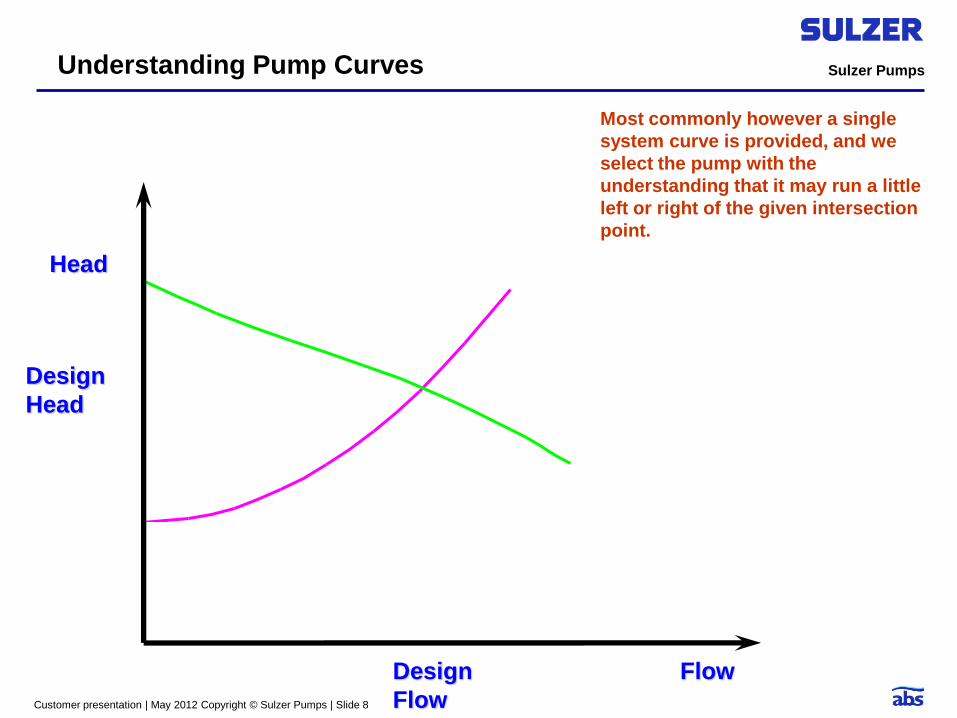
Customer presentation | May 2012 Copyright © Sulzer Pumps | Slide 8
Head
Flow Design
Flow
Design
Head
Most commonly however a single
system curve is provided, and we
select the pump with the
understanding that it may run a little
left or right of the given intersection
point.
Understanding Pump Curves
Sulzer Pumps
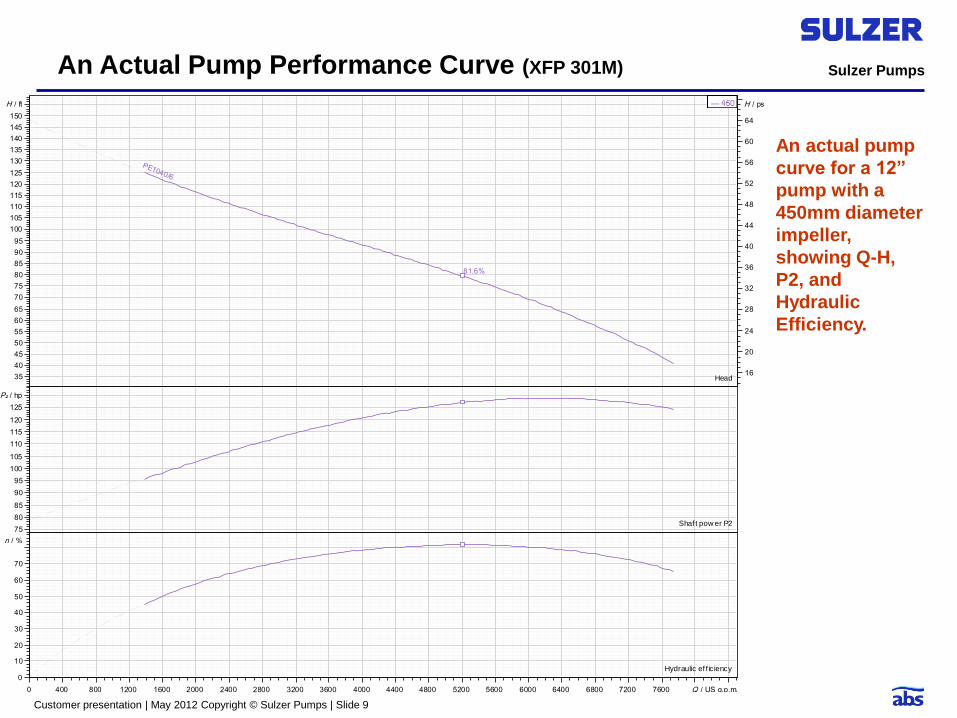
Customer presentation | May 2012 Copyright © Sulzer Pumps | Slide 9
An actual pump
curve for a 12”
pump with a
450mm diameter
impeller,
showing Q-H,
P2, and
Hydraulic
Efficiency.
An Actual Pump Performance Curve (XFP 301M)
81.6%
PE1040/6
Head
Shaf t pow er P2
Hydraulic ef f ic iency
H / ft
35
40
45
50
55
60
65
70
75
80
85
90
95
100
105
110
115
120
125
130
135
140
145
150
H / psi
16
20
24
28
32
36
40
44
48
52
56
60
64
P₂ / hp
75
80
85
90
95
100
105
110
115
120
125
Q / US g.p.m.0 400 800 1200 1600 2000 2400 2800 3200 3600 4000 4400 4800 5200 5600 6000 6400 6800 7200 7600
η / %
0
10
20
30
40
50
60
70
Sulzer Pumps
Customer presentation | May 2012 Copyright © Sulzer Pumps | Slide 10
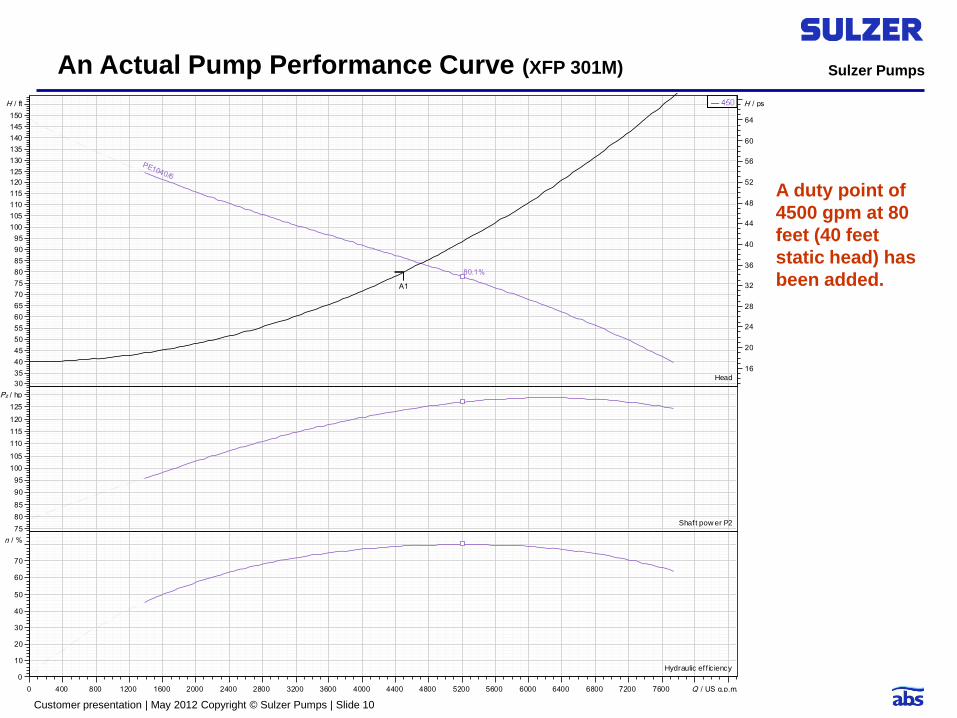
A duty point of
4500 gpm at 80
feet (40 feet
static head) has
been added.
An Actual Pump Performance Curve (XFP 301M)
80.1%
PE1040/6
Head
Shaf t pow er P2
Hydraulic ef f ic iency
H / ft
30
35
40
45
50
55
60
65
70
75
80
85
90
95
100
105
110
115
120
125
130
135
140
145
150
H / psi
16
20
24
28
32
36
40
44
48
52
56
60
64
P₂ / hp
75
80
85
90
95
100
105
110
115
120
125
Q / US g.p.m.0 400 800 1200 1600 2000 2400 2800 3200 3600 4000 4400 4800 5200 5600 6000 6400 6800 7200 7600
η / %
0
10
20
30
40
50
60
70
A1
Sulzer Pumps
Customer presentation | May 2012 Copyright © Sulzer Pumps | Slide 11
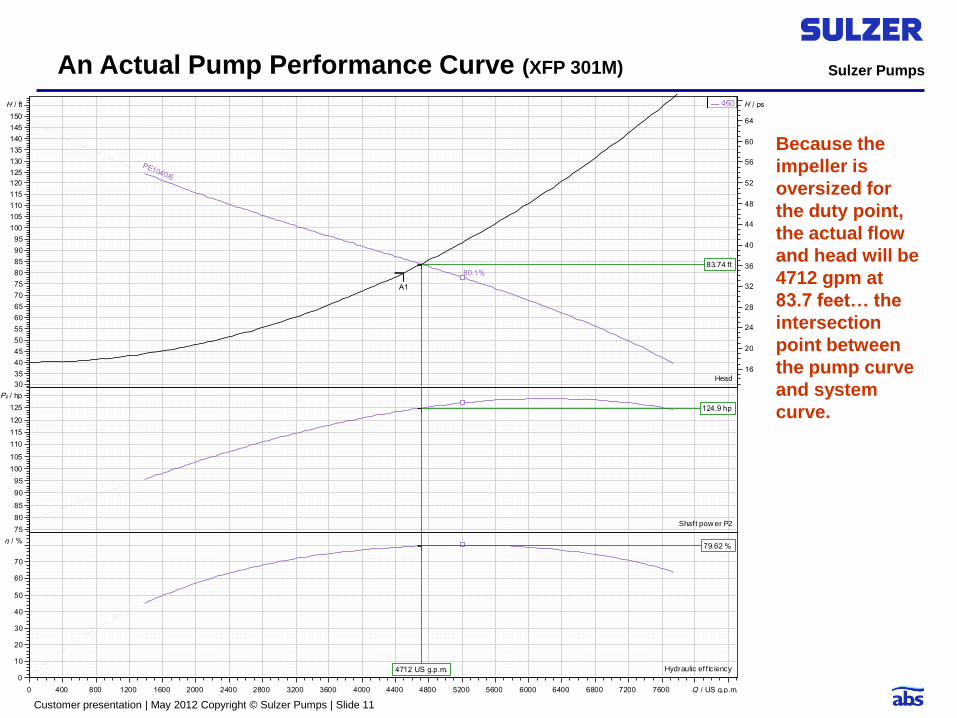
Because the
impeller is
oversized for
the duty point,
the actual flow
and head will be
4712 gpm at
83.7 feet… the
intersection
point between
the pump curve
and system
curve.
An Actual Pump Performance Curve (XFP 301M)
80.1%
PE1040/6
Head
Shaf t pow er P2
Hydraulic ef f ic iency
H / ft
30
35
40
45
50
55
60
65
70
75
80
85
90
95
100
105
110
115
120
125
130
135
140
145
150
H / psi
16
20
24
28
32
36
40
44
48
52
56
60
64
P₂ / hp
75
80
85
90
95
100
105
110
115
120
125
Q / US g.p.m.0 400 800 1200 1600 2000 2400 2800 3200 3600 4000 4400 4800 5200 5600 6000 6400 6800 7200 7600
η / %
0
10
20
30
40
50
60
70
A1
83.74 ft
124.9 hp
4712 US g.p.m.
79.62 %
Sulzer Pumps
Customer presentation | May 2012 Copyright © Sulzer Pumps | Slide 12
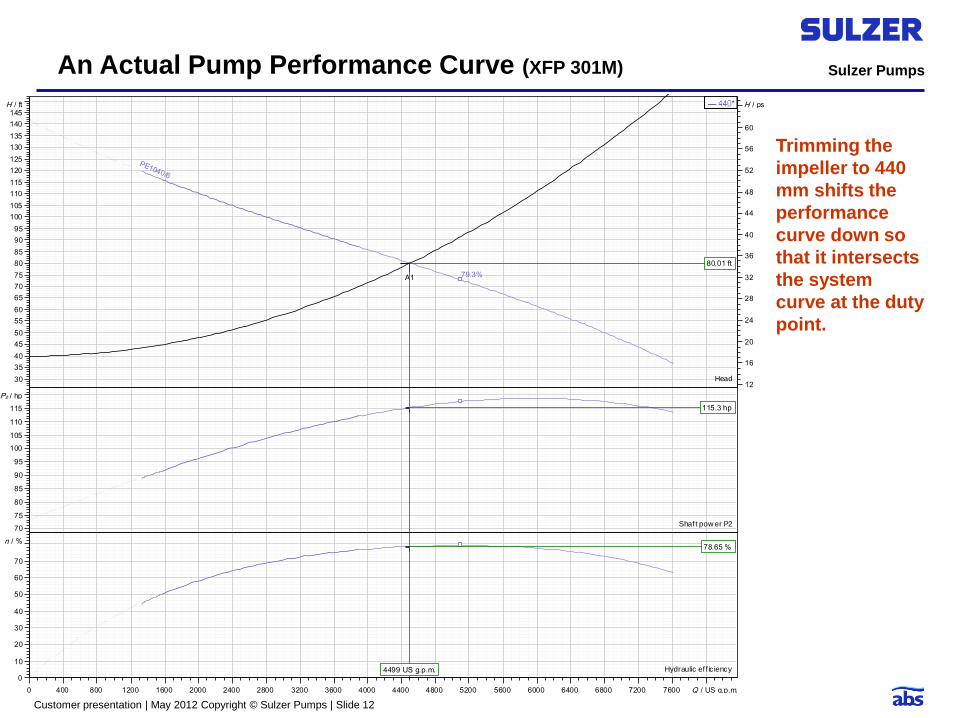
Trimming the
impeller to 440
mm shifts the
performance
curve down so
that it intersects
the system
curve at the duty
point.
An Actual Pump Performance Curve (XFP 301M)
79.3%
PE1040/6
Head
Shaf t pow er P2
Hydraulic ef f ic iency
H / ft
30
35
40
45
50
55
60
65
70
75
80
85
90
95
100
105
110
115
120
125
130
135
140
145H / psi
12
16
20
24
28
32
36
40
44
48
52
56
60
P₂ / hp
70
75
80
85
90
95
100
105
110
115
Q / US g.p.m.0 400 800 1200 1600 2000 2400 2800 3200 3600 4000 4400 4800 5200 5600 6000 6400 6800 7200 7600
η / %
0
10
20
30
40
50
60
70
A1
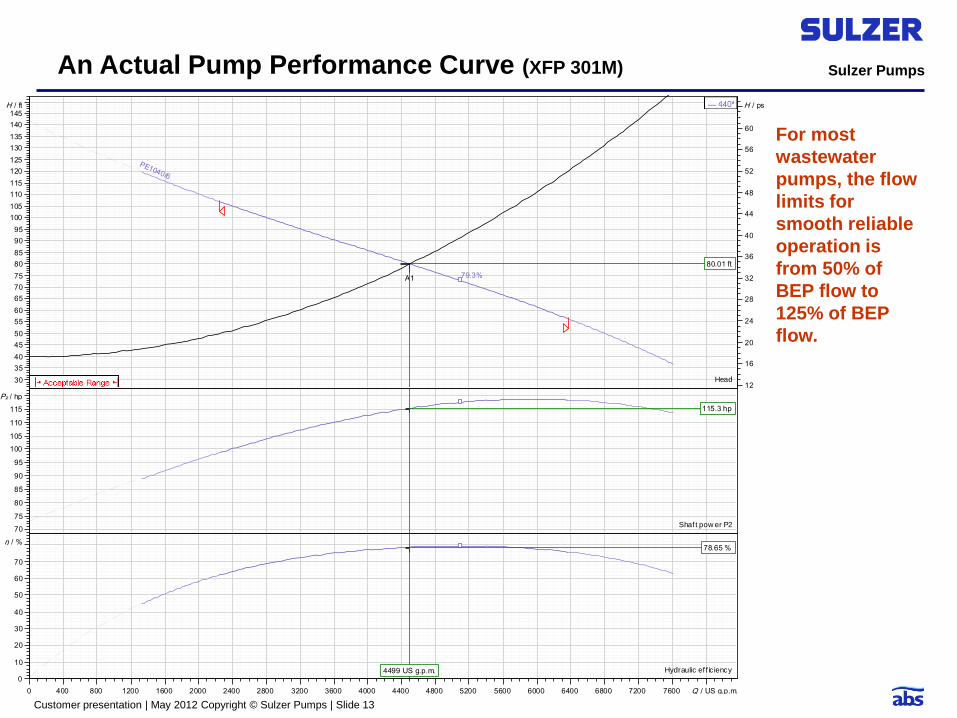
80.01 ft
115.3 hp
4499 US g.p.m.
78.65 %
Sulzer Pumps
Customer presentation | May 2012 Copyright © Sulzer Pumps | Slide 13
For most
wastewater
pumps, the flow
limits for
smooth reliable
operation is
from 50% of
BEP flow to
125% of BEP
flow.
An Actual Pump Performance Curve (XFP 301M)
79.3%
PE1040/6
Head
Shaf t pow er P2
Hydraulic ef f ic iency
H / ft
30
35
40
45
50
55
60
65
70
75
80
85
90
95
100
105
110
115
120
125
130
135
140
145H / psi
12
16
20
24
28
32
36
40
44
48
52
56
60
P₂ / hp
70
75
80
85
90
95
100
105
110
115
Q / US g.p.m.0 400 800 1200 1600 2000 2400 2800 3200 3600 4000 4400 4800 5200 5600 6000 6400 6800 7200 7600
η / %
0
10
20
30
40
50
60
70
A1
80.01 ft
115.3 hp
4499 US g.p.m.
78.65 %
Sulzer Pumps
Customer presentation | May 2012 Copyright © Sulzer Pumps | Slide 14
Summary
The System Curve is a combination of static and dynamic head.
It provides a means of selecting pumps by predicting the Total
Head at any flow rate.
The pump always operates at the head and flow corresponding to the
intersection of the System Curve and the Pump Curve
The static component is based on the vertical distance that the
liquid must be pumped (change in elevation)
The dynamic component is based on pipe and fitting size, quantity,
and interior roughness of the material.
When selecting wastewater pumps, the rule of thumb is stay in the
range of 50%-125% of BEP flow. Going outside this range is possible,
but more detailed analysis of the application is necessary.
Sulzer Pumps
Customer presentation | May 2012 Copyright © Sulzer Pumps | Slide 15
Understanding VFD Curves

Sulzer Pumps
Customer presentation | May 2012 Copyright © Sulzer Pumps | Slide 16
Primary Benefits of Variable Speed Pumping
There are three primary reasons to use a VFD to control pump speeds:
Control the output of the pump for process reasons (flow or pressure)
Reduce energy consumption
Manage starting current
Secondary reasons to use a VFD can include:
Manage water hammer
Improve Power Factor
Precision control of wet well levels
Managing stations with wet wells that are too small
Understanding VFD Curves
Sulzer Pumps
Customer presentation | May 2012 Copyright © Sulzer Pumps | Slide 17
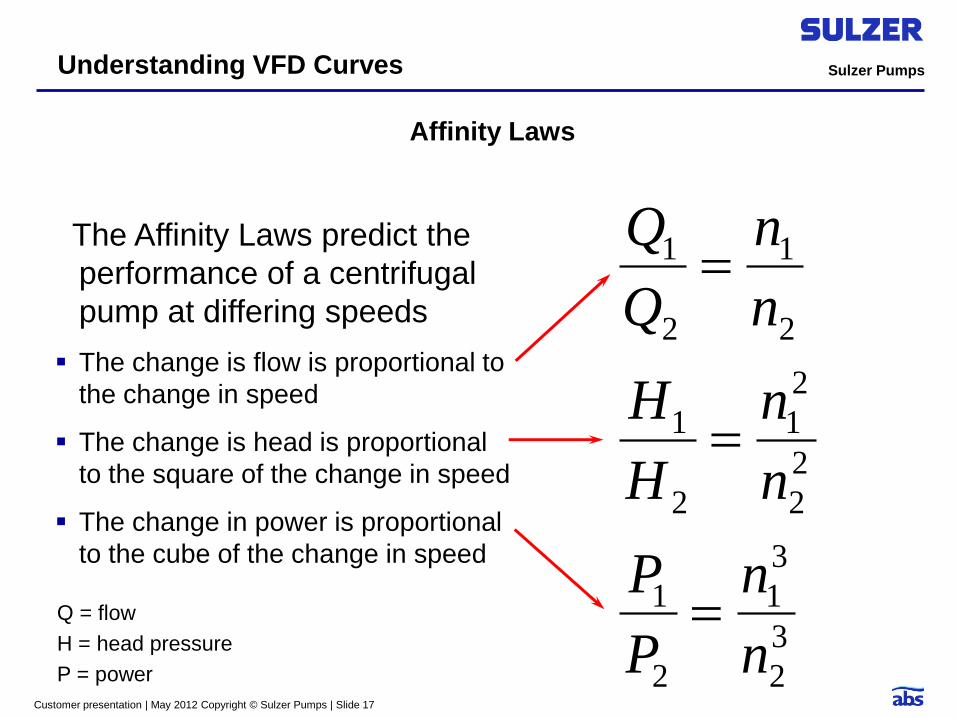
Affinity Laws
The Affinity Laws predict the
performance of a centrifugal
pump at differing speeds
The change is flow is proportional to
the change in speed
The change is head is proportional
to the square of the change in speed
The change in power is proportional
to the cube of the change in speed
3
2
3
1
2
1
2
2
2
1
2
1
2
1
2
1
n
n
P
P
n
n
H
H
n
n
Q
Q
Q = flow
H = head pressure
P = power
Understanding VFD Curves
Sulzer Pumps
Customer presentation | May 2012 Copyright © Sulzer Pumps | Slide 18
Affinity Laws
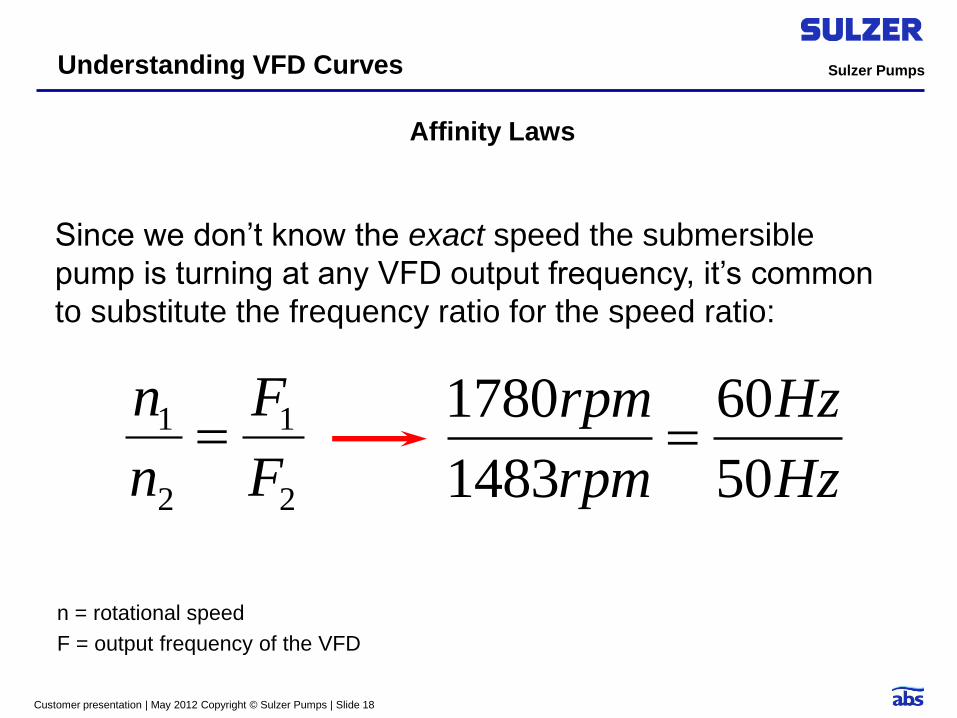
Since we don’t know the exact speed the submersible
pump is turning at any VFD output frequency, it’s common
to substitute the frequency ratio for the speed ratio:
Hz
Hz
rpm
rpm
50
60
1483
1780
n = rotational speed
F = output frequency of the VFD
2
1
2
1
F
F
n
n
Understanding VFD Curves
Sulzer Pumps
Customer presentation | May 2012 Copyright © Sulzer Pumps | Slide 19
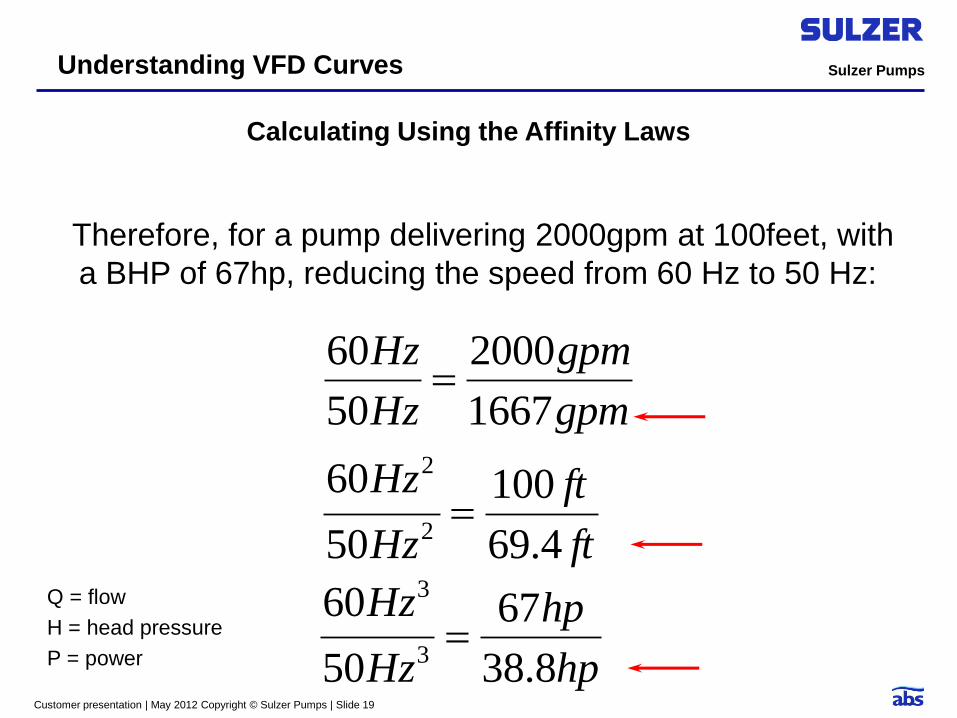
Calculating Using the Affinity Laws
Therefore, for a pump delivering 2000gpm at 100feet, with
a BHP of 67hp, reducing the speed from 60 Hz to 50 Hz:
Q = flow
H = head pressure
P = power hp
hp
Hz
Hz
8.38
67
50
603
3
ft
ft
Hz
Hz
4.69
100
50
602
2
gpm
gpm
Hz
Hz
1667
2000
50
60
Understanding VFD Curves
Sulzer Pumps
Customer presentation | May 2012 Copyright © Sulzer Pumps | Slide 20
Calculating Using the Affinity Laws
Reducing the frequency (and rotational speed) from 60Hz
to 50 Hz, or about 16.7% results in:
A flow reduction of 16.7% to 1667 gpm
A head reduction of 30.6% to 69.4 feet
A power reduction of 42.1% to 38.8 hp
Of course the pump will not necessarily run at this new flow and
head. The actual new operating point depends on where the system
curve intersects with the reduced speed pump curve.
Understanding VFD Curves
Sulzer Pumps
Customer presentation | May 2012 Copyright © Sulzer Pumps | Slide 21
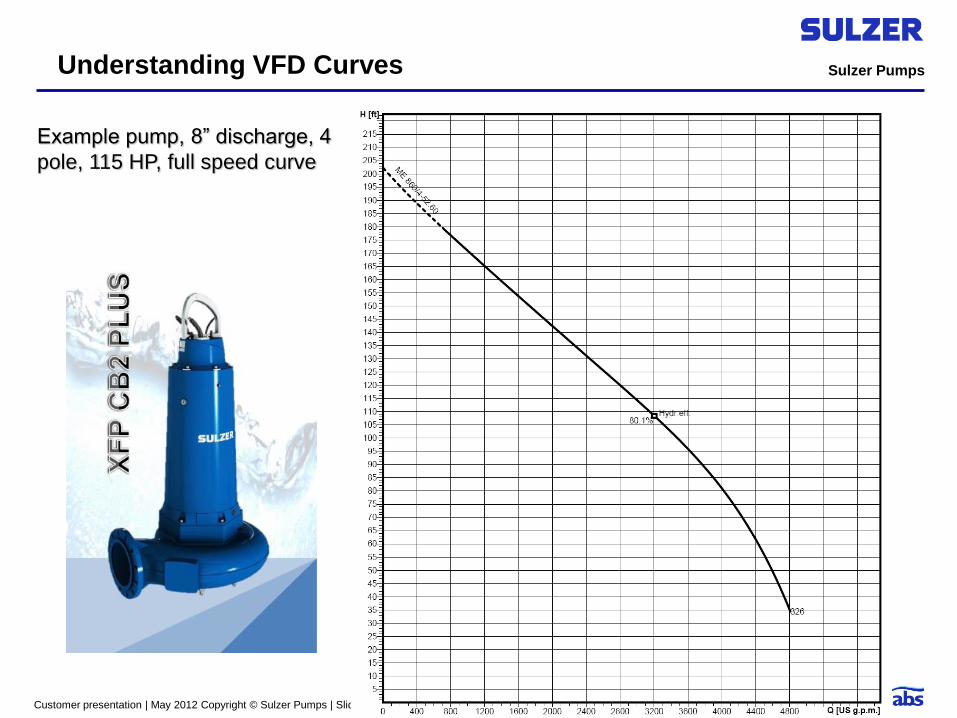
Example pump, 8” discharge, 4
pole, 115 HP, full speed curve
Understanding VFD Curves

Sulzer Pumps
Customer presentation | May 2012 Copyright © Sulzer Pumps | Slide 22
Flow reduction is directly
proportional to the speed
reduction
Head reduction is
proportional to the square
of the speed reduction
Reduced speed curves are
parallel to the full speed
curve, and follow the
affinity laws
Reduced speed curves
shown in 5 Hz increments
Understanding VFD Curves

Sulzer Pumps
Customer presentation | May 2012 Copyright © Sulzer Pumps | Slide 23
Lines of constant efficiency
added to the curve
Understanding VFD Curves
Sulzer Pumps
Customer presentation | May 2012 Copyright © Sulzer Pumps | Slide 24
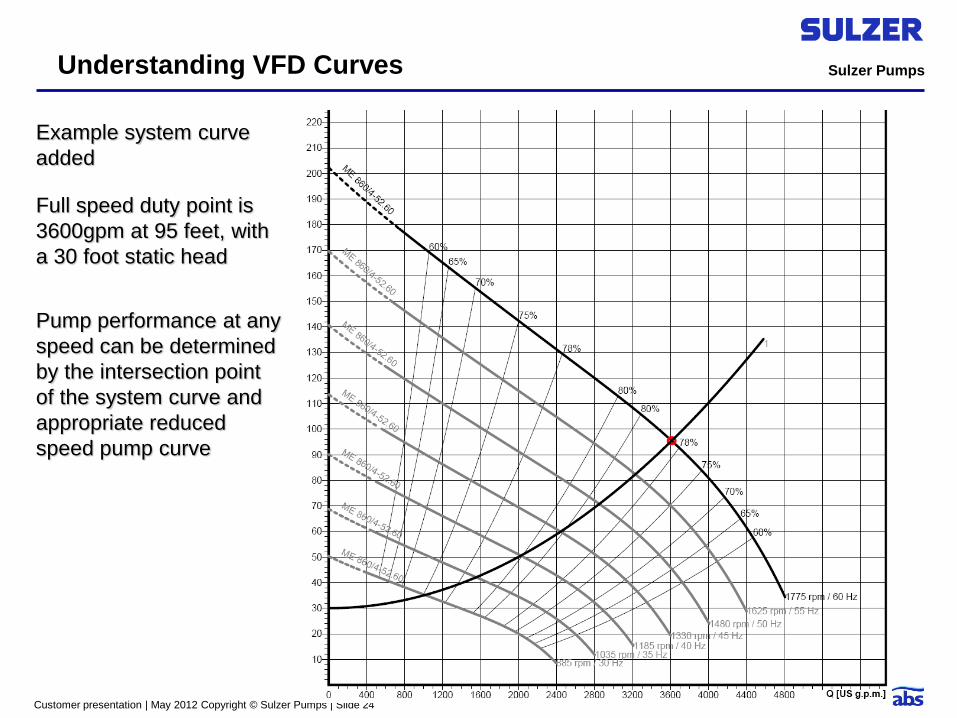
Example system curve
added
Full speed duty point is
3600gpm at 95 feet, with
a 30 foot static head
Pump performance at any
speed can be determined
by the intersection point
of the system curve and
appropriate reduced
speed pump curve
Understanding VFD Curves
Sulzer Pumps
Customer presentation | May 2012 Copyright © Sulzer Pumps | Slide 25
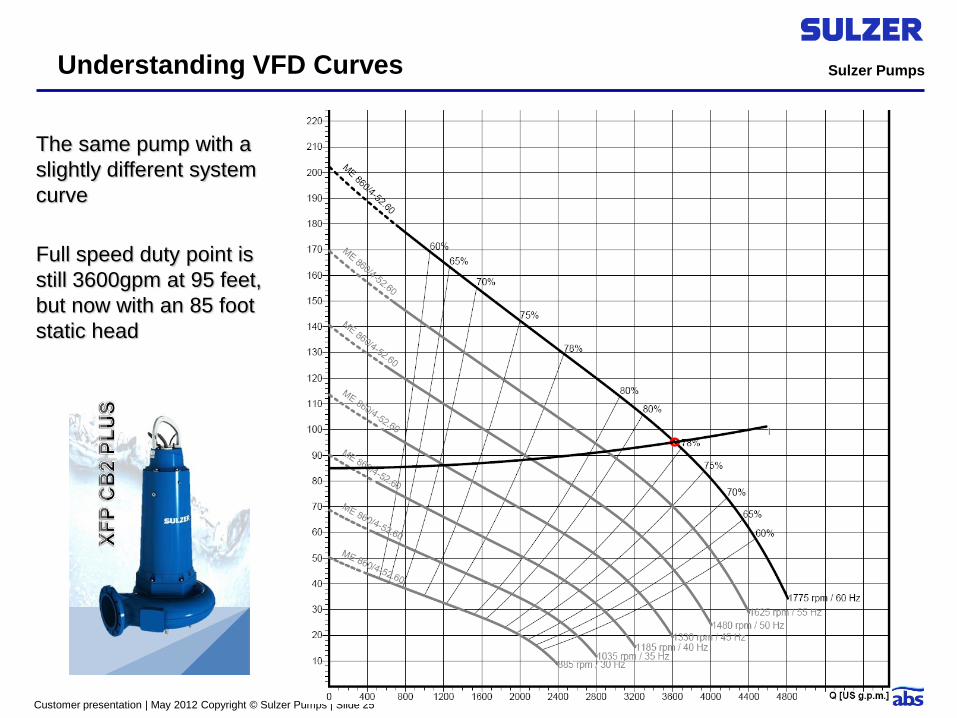
The same pump with a
slightly different system
curve
Full speed duty point is
still 3600gpm at 95 feet,
but now with an 85 foot
static head
Understanding VFD Curves
Sulzer Pumps
Customer presentation | May 2012 Copyright © Sulzer Pumps | Slide 26
First Rule of Thumb
First rule of thumb:
Applications where the static head is greater than 50% of the total head are not usually good applications for VFD variable speed pumping. This is because:
Since the system curve is very flat, the pump efficiency at the
reduced speed operating point falls off rapidly. The opportunity for
energy savings at reduced speed is minimal.
Since the system curve is very flat, there is very little useable
speed reduction range.
Pump rotational speed at reduced speed, lower flow conditions
remains very high, resulting in high energy recirculation
cavitation, which can damage the pump.
Understanding VFD Curves
Sulzer Pumps
Customer presentation | May 2012 Copyright © Sulzer Pumps | Slide 27
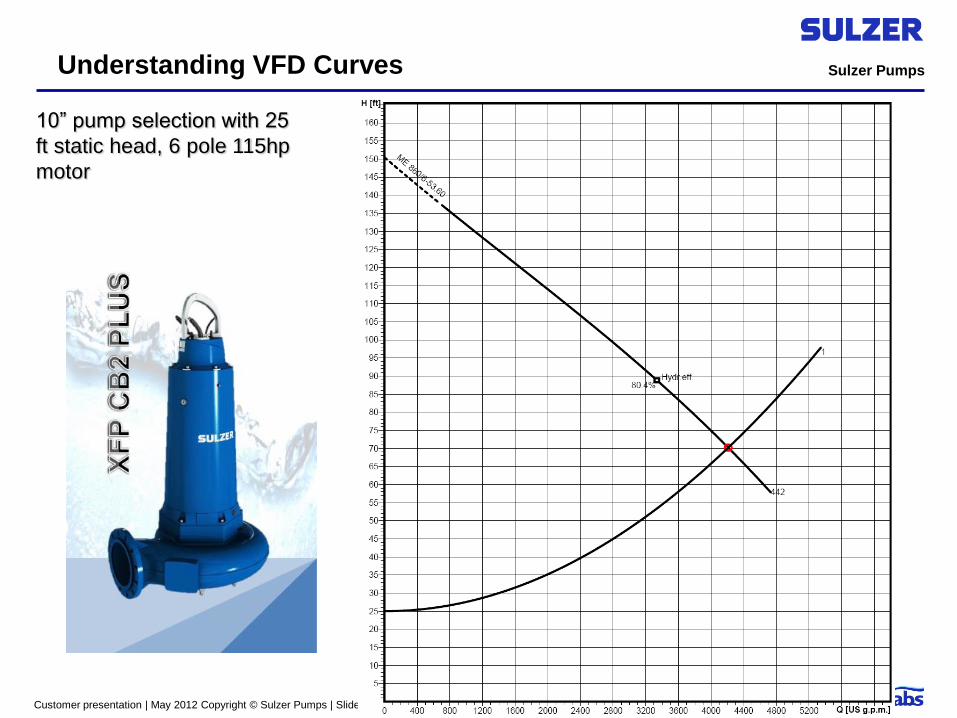
10” pump selection with 25
ft static head, 6 pole 115hp
motor
Understanding VFD Curves
Sulzer Pumps
Customer presentation | May 2012 Copyright © Sulzer Pumps | Slide 28
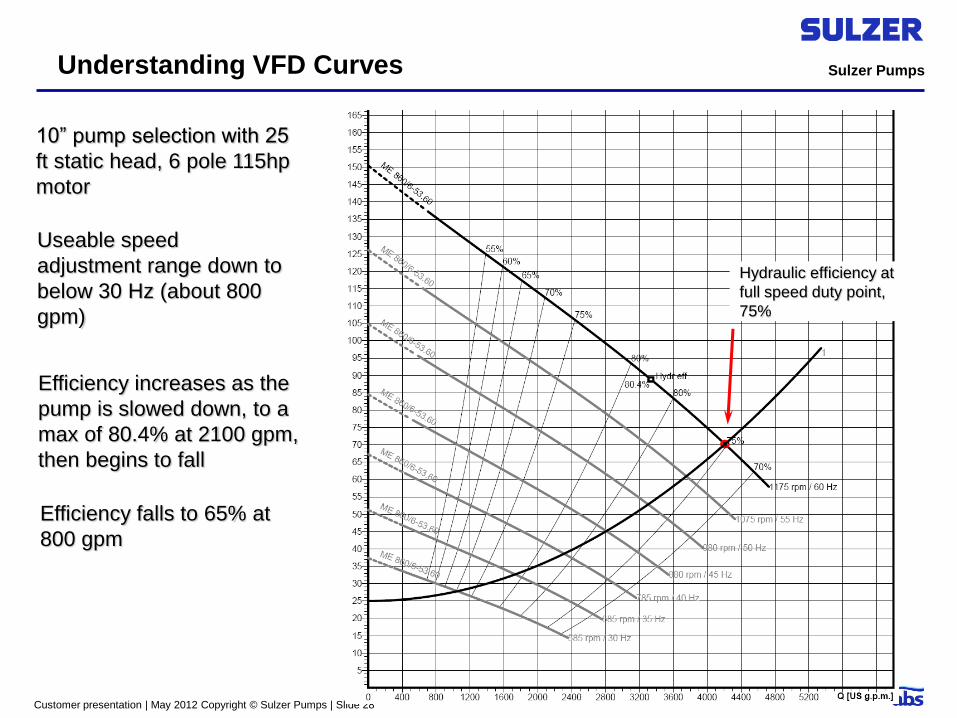
10” pump selection with 25
ft static head, 6 pole 115hp
motor
Useable speed
adjustment range down to
below 30 Hz (about 800
gpm)
Efficiency falls to 65% at
800 gpm
Efficiency increases as the
pump is slowed down, to a
max of 80.4% at 2100 gpm,
then begins to fall
Hydraulic efficiency at
full speed duty point,
75%
Understanding VFD Curves

Sulzer Pumps
Customer presentation | May 2012 Copyright © Sulzer Pumps | Slide 29
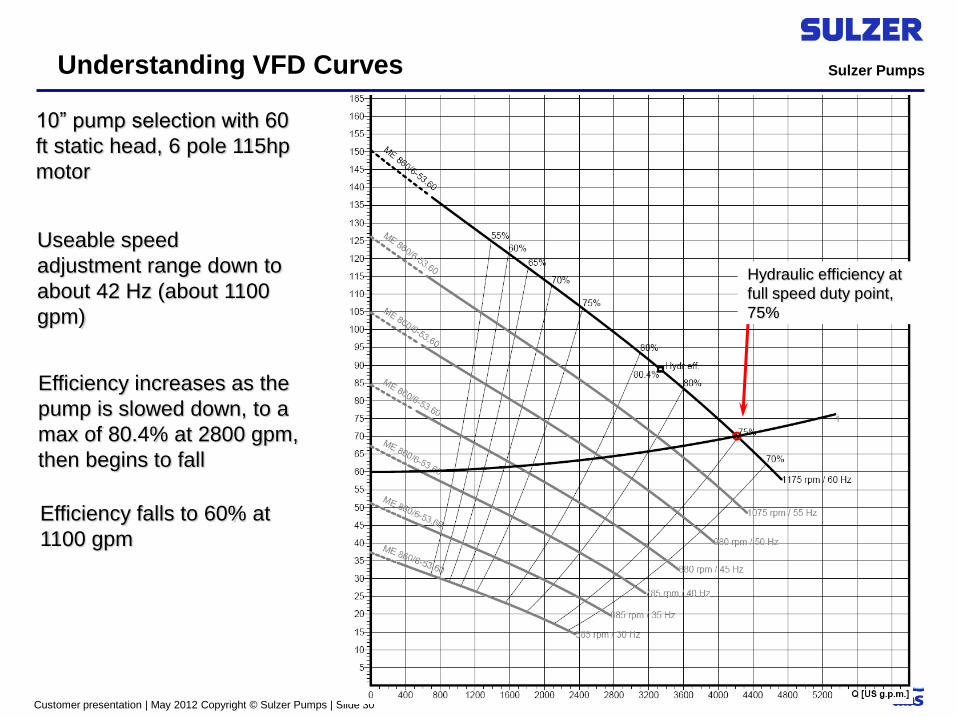
10” pump selection with 60
ft static head, 6 pole 115hp
motor
Understanding VFD Curves
Sulzer Pumps
Customer presentation | May 2012 Copyright © Sulzer Pumps | Slide 30
10” pump selection with 60
ft static head, 6 pole 115hp
motor
Useable speed
adjustment range down to
about 42 Hz (about 1100
gpm)
Hydraulic efficiency at
full speed duty point,
75%
Efficiency falls to 60% at
1100 gpm
Efficiency increases as the
pump is slowed down, to a
max of 80.4% at 2800 gpm,
then begins to fall
Understanding VFD Curves
Sulzer Pumps
Customer presentation | May 2012 Copyright © Sulzer Pumps | Slide 31
Second Rule of Thumb
Second rule of thumb:
For variable speed applications, select pumps with the full speed operating point to the right of BEP whenever possible.
Selecting to the right of BEP improves efficiency at reduced
speed since the intersection point with the system curve moves
toward BEP when slowing down.
Variable speed applications often allow the use of smaller, less
expensive pumps.
Smaller pumps and selections right of BEP provide the best
opportunity for energy savings at reduced speed (where the
pumps run most of the time).
Check NPSH margin for all selections, especially when selecting
to the right of BEP!
Understanding VFD Curves
Sulzer Pumps
Customer presentation | May 2012 Copyright © Sulzer Pumps | Slide 32
Establishing Minimum Speeds
The minimum speed the pump can run in a VFD application is dependant on several factors:
Fluid velocities through the pump and the piping systems. For
normal wastewater you must maintain 2.5ft/sec in horizontal runs
and 3ft/sec in vertical runs to keep solids suspended.
Meet the pump manufacturer’s minimum flow requirements for
the selected pump to avoid damaging recirculation cavitation.
This can range from 20% of BEP flow to 50% of BEP flow,
depending on the impeller design and operating speed.
Maintaining high enough rotational speed to keep the motor’s
cooling system functioning. The min speed for proper cooling
system operation depends on the type of cooling system
provided.
Understanding VFD Curves
Sulzer Pumps
Customer presentation | May 2012 Copyright © Sulzer Pumps | Slide 33
Clogging issues with pumps on VFDs
Pumps running on VFDs are more prone to clogging than constant speed pumps. This is because:
At reduced speed, fluid velocities through the impeller and in the
piping can drop significantly allowing rag material to build up
At reduced speed, material moves more slowly through the impeller
and volute and can build up, creating a clog.
In the impeller, the natural scouring action which aids in rag handling
can be greatly reduced
Material can build up in the discharge piping, and eventually back up
into the pump
In dry pit, material can build up in the suction piping, and overwhelm
the pump with solids when the speed is ramped up
Understanding VFD Curves
Sulzer Pumps
Customer presentation | May 2012 Copyright © Sulzer Pumps | Slide 34
Other Important VFD setting and operational
parameters
Modern VFDs have many configuration options that must be set during startup. Setting these parameters properly can make the difference between a good VFD pumping system, and a poor one.
Constant torque/variable torque: Centrifugal pumps are variable
torque machines, so this parameter should always be set to
variable torque.
Acceleration and deceleration ramp: Initial ramp setting should be
10 sec for both accel and decel. This should be tuned to field
conditions with the understanding that shorter ramp times are
usually preferable (especially with systems that have a high
percentage of static head). If water hammer is not an issue,
coast to stop is preferred over controlled deceleration.
Understanding VFD Curves
Sulzer Pumps
Customer presentation | May 2012 Copyright © Sulzer Pumps | Slide 35
Slip compensation: This parameter should be turned OFF unless
the pump manufacturer specifically states that it should be on for
the particular application. Slip compensation attempts to run the
motor at full synchronous speed by increasing the max frequency
above 60 Hz. This can cause overload and overheating of the
motor.
Minimum frequency: This must be set to an appropriate
frequency to meet the minimum flow requirements of the system
as previously discussed. Failure to set the minimum frequency to
an acceptable level can cause the level controls or an
unsuspecting operator to run the pump continuously at shutoff
head; damaging the pump.
Maximum frequency: This should be set to the name plate
frequency of the motor (60Hz in N. America) to prevent over
speeding of the pump. Only set the max frequency above 60Hz if
recommended and approved by the pump manufacturer.
Other Important VFD setting and operational
parameters
Understanding VFD Curves

Sulzer Pumps
Customer presentation | May 2012 Copyright © Sulzer Pumps | Slide 36
Speed control settings: The control system should be set to ramp
up the pump to full speed and allow it to stabilize before dropping
it down to level control speed. This is normally accomplished
through the PLC or controller rather than through the VFD
settings. Systems that ramp up to control speed directly without a
short run at full speed are more likely to clog.
Parallel pumps on VFDs: When multiple identical pumps are run
in parallel on VFDs, all pumps must be run at the same speed. If
a VFD pump is to be run in parallel with a constant speed pump,
the VFD pump must be run at full speed. Exceptions can be
made to the above rule if a detailed analysis of the pump curves
and system curve has been performed, and it is found that the
slower running pump will be running at an acceptable point on the
curve.
Other Important VFD setting and operational
parameters
Understanding VFD Curves
Sulzer Pumps
Customer presentation | May 2012 Copyright © Sulzer Pumps | Slide 37
Summary
The general rules of thumb for selecting variable speed pumping systems are:
Applications where the static head exceeds 50% of the
duty head are not usually good applications for variable
speed pumping
Select pumps so that the primary, full speed duty point is to
the right of the pump’s BEP (but watch NPSH margin)
Understanding VFD Curves
Sulzer Pumps
Customer presentation | May 2012 Copyright © Sulzer Pumps | Slide 38
Summary
Some other guidelines:
Allow about a 5-10 percent motor power reserve at full speed to account
for extra heat generated in the motor
Use motors that are acceptable for VFD service, and use appropriate
filters for long cable runs to prevent damage to the motor
Size and select VFD and Motor combinations with an emphasis on
current, not horsepower, to be sure the VFD has adequate output
capability for the application.
Carefully consider operational parameters for VFD stations to minimize
the possibility of clogging.
Apply VFDs only where there is a real benefit in efficiency or process
control. Don’t fall for the argument that VFDs always improve the
efficiency and performance of pump systems, it’s simply not true. Some
systems can benefit, but many cannot.
Sulzer Pumps
The Heart of Your Process
The End