understanding populations how do populations change in size? georgia performance standard: sev3d
TRANSCRIPT
Understanding Populations
How Do Populations Change in Size?Georgia Performance Standard:
SEV3d
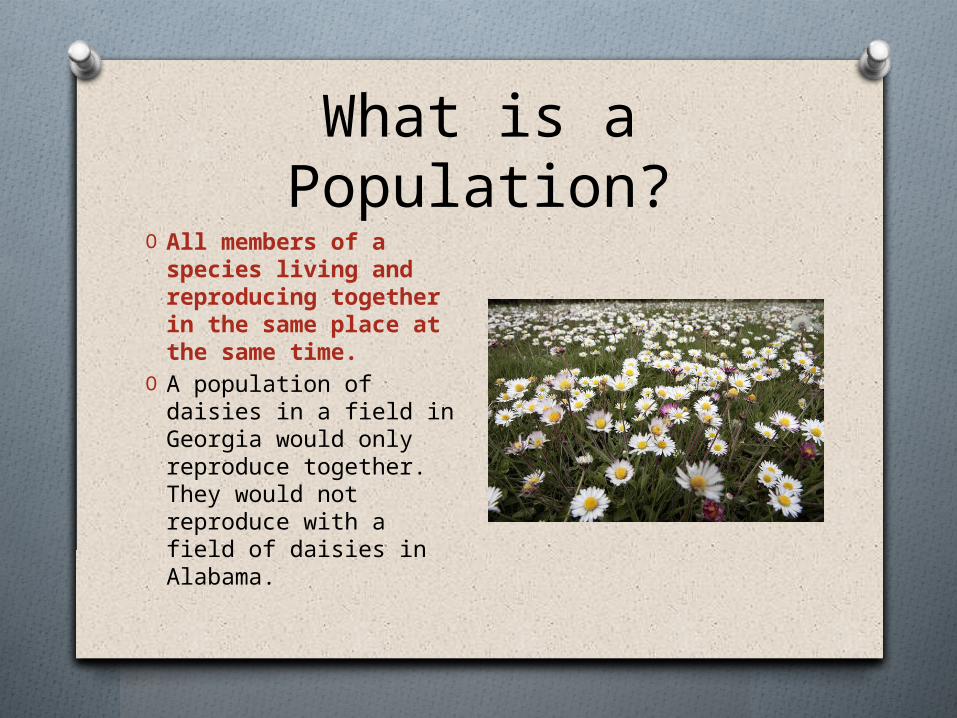
What is a Population?O All members of a
species living and reproducing together in the same place at the same time.
O A population of daisies in a field in Georgia would only reproduce together. They would not reproduce with a field of daisies in Alabama.
What are the 3 properties of a population?
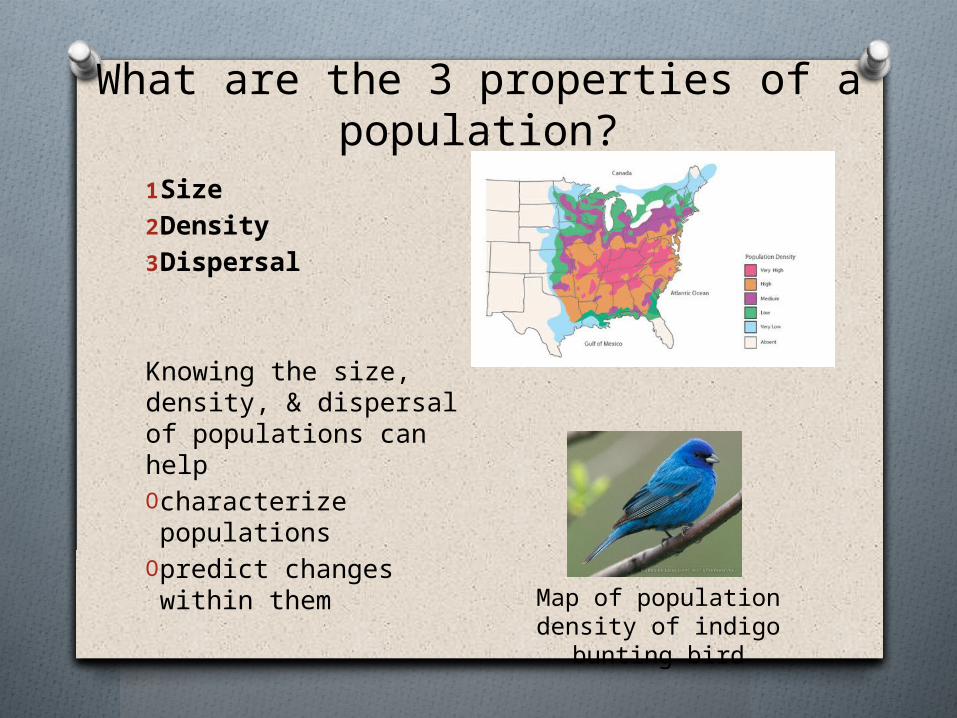
1.Size2.Density3.Dispersal
Knowing the size, density, & dispersal of populations can helpO characterize
populations O predict changes
within them Map of population density of indigo
bunting bird

What are the 3 properties of a population?
1.Size- the number of members present
What are the 3 properties of a population?
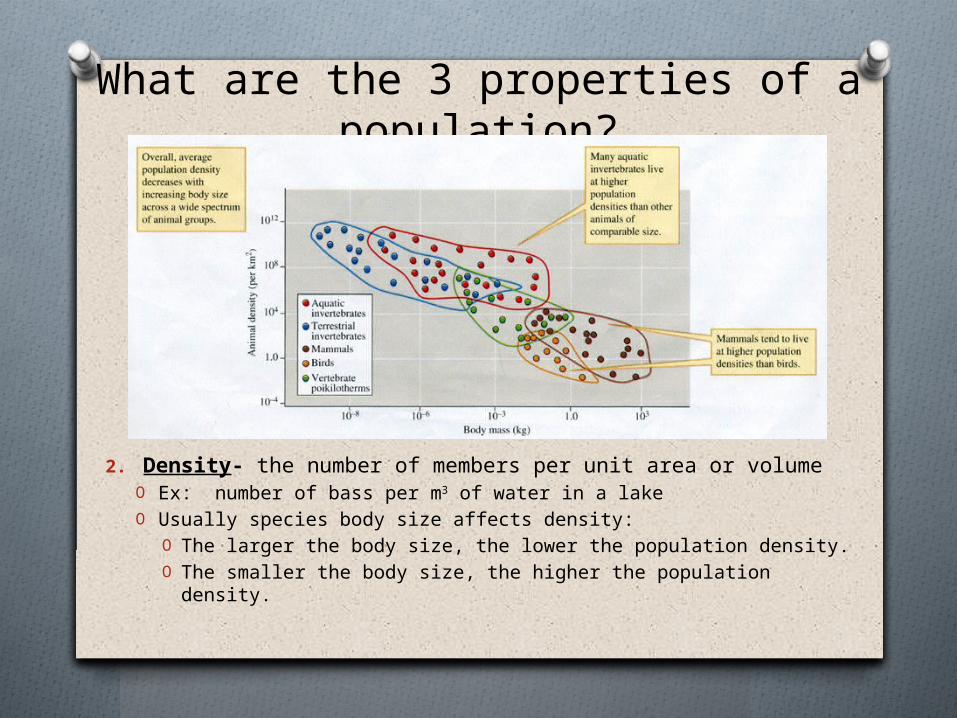
2. Density- the number of members per unit area or volumeO Ex: number of bass per m3 of water in a lakeO Usually species body size affects density:
O The larger the body size, the lower the population density.O The smaller the body size, the higher the population density.
What are the 3 properties of a population?
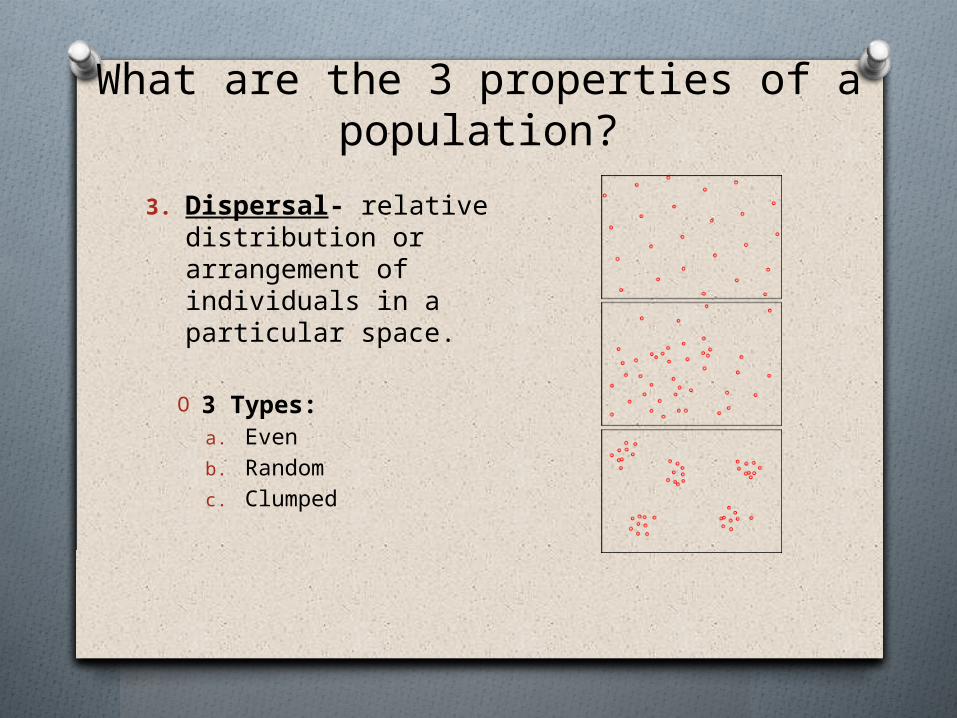
3. Dispersal- relative distribution or arrangement of individuals in a particular space.
O 3 Types:a. Evenb. Randomc. Clumped

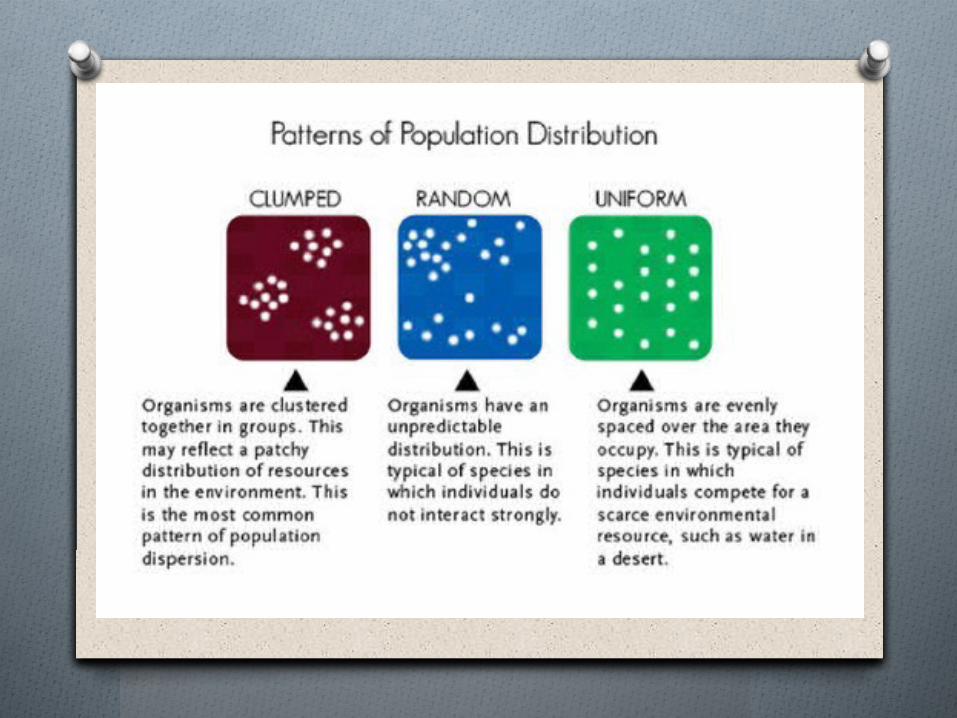
3 Types of Dispersal Patterns
a. EvenO Evenly spacedO Not common type of dispersalO Ex: creosote bushes in desert
b. RandomO Unpredictable spacingO Most rare type of dispersalO Ex: oyster larvae, dandelion
seeds
c. ClumpedO Live in groupsO Most common type b/c
resources are also clumpedO Ex: school of fish, herd of
zebra
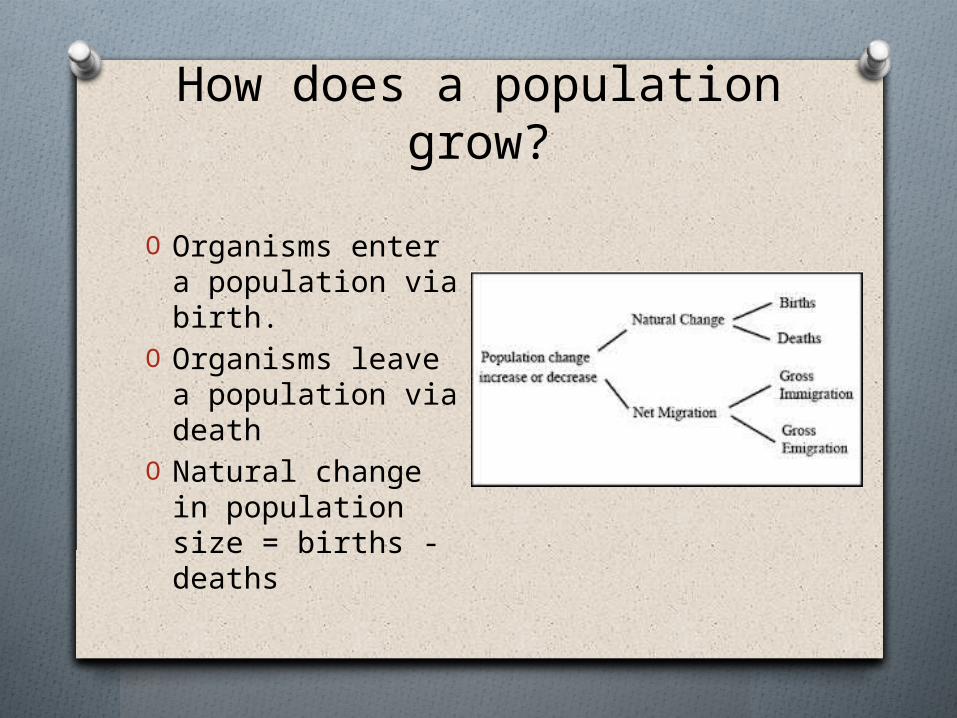
How does a population grow?
O Organisms enter a population via birth.
O Organisms leave a population via death
O Natural change in population size = births - deaths

What is a Population’s Growth Rate (PGR)?
O Change in a population over a given period of time.
O Equation for PGR:
O How to use the equation:1. First calculate change in
populationO New pop. Size – Old pop. size
2. Next divide change in population by the original population size
3. Multiply answer x 100 to get %O If answer is positive the population
grewO If answer is negative the population
declinedO If the answer is 0 the population did
not change.
In the year 2000, the population of Douglasville was 20,065.In the year 2010, the population of Douglasville was 30,961.How much did the population grow during this 10 year period?Use the Population Growth Rate equation to figure this out!
Answer:= +54%30961−20065
20065𝑋 100=¿

How fast can a population grow?
O Reproductive potential- maximum number of offspring that each member of the population can produce.
O Usually the smaller the animal, the higher the reproductive potential.O Ex: insects, rodents, bacteria
O Affected by:O How often organism
reproduces in their lifetimeO How early in life they start
reproducingO How many offspring they
produce in a single reproductive cycle (pregnancy)

How fast can a population grow?
O If an organism reproduces when it is young, has a lot of babies in one cycle, and can have many cycles in its life then it has a HIGH reproductive potential.
O Ex: RabbitsO Start breeding at 6 months and live
for 7-10 yearsO Produce 6-14 babies in one litterO Gestation is 14-31 days so can have
1 litter per month.O An 8 year old rabbit could produce
1,344 babies in her life. AND if she gives birth to females they will also have babies.
O RabbitHealth.com predicts 1 rabbit can be the progenitor of 95 million rabbits if you include all the female babies and their births.
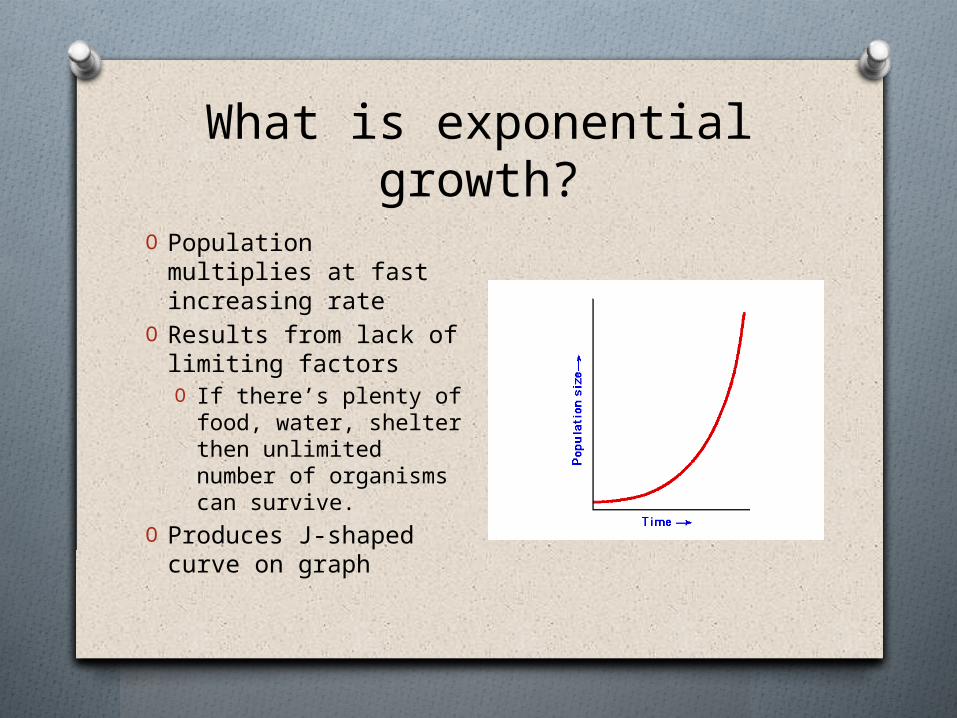
What is exponential growth?
O Population multiplies at fast increasing rate
O Results from lack of limiting factorsO If there’s plenty of
food, water, shelter then unlimited number of organisms can survive.
O Produces J-shaped curve on graph
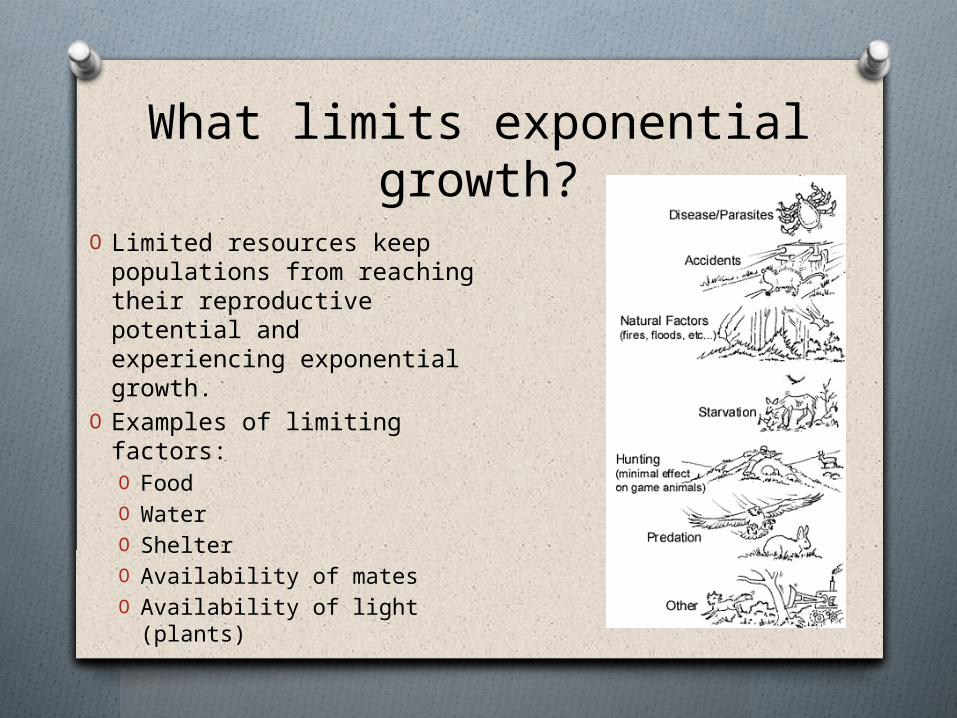
What limits exponential growth?
O Limited resources keep populations from reaching their reproductive potential and experiencing exponential growth.
O Examples of limiting factors:O FoodO WaterO ShelterO Availability of matesO Availability of light
(plants)
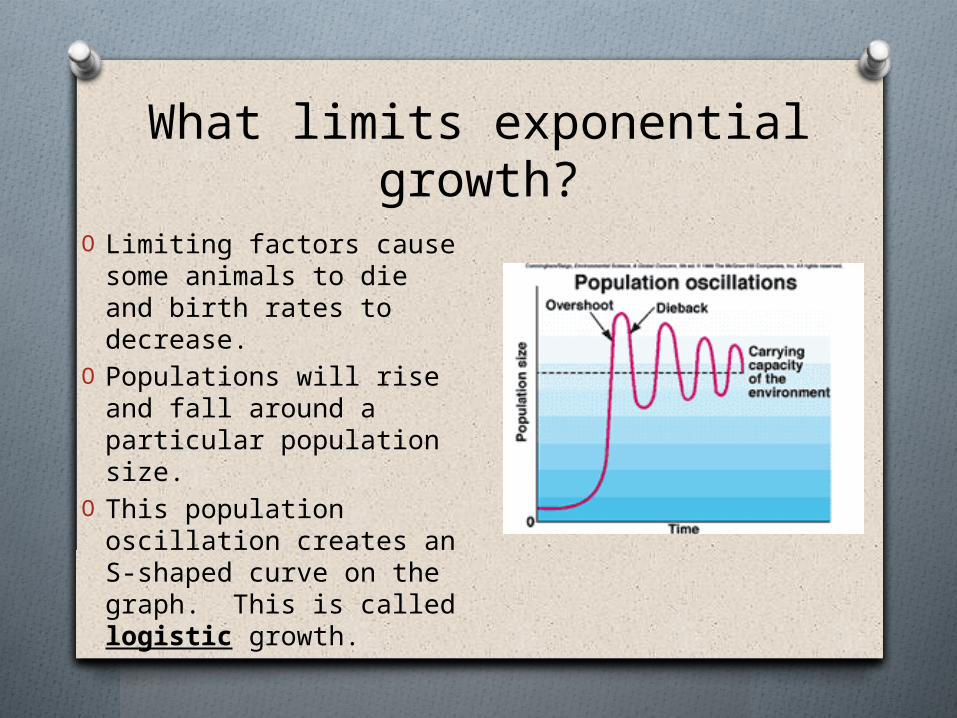
What limits exponential growth?
O Limiting factors cause some animals to die and birth rates to decrease.
O Populations will rise and fall around a particular population size.
O This population oscillation creates an S-shaped curve on the graph. This is called logistic growth.
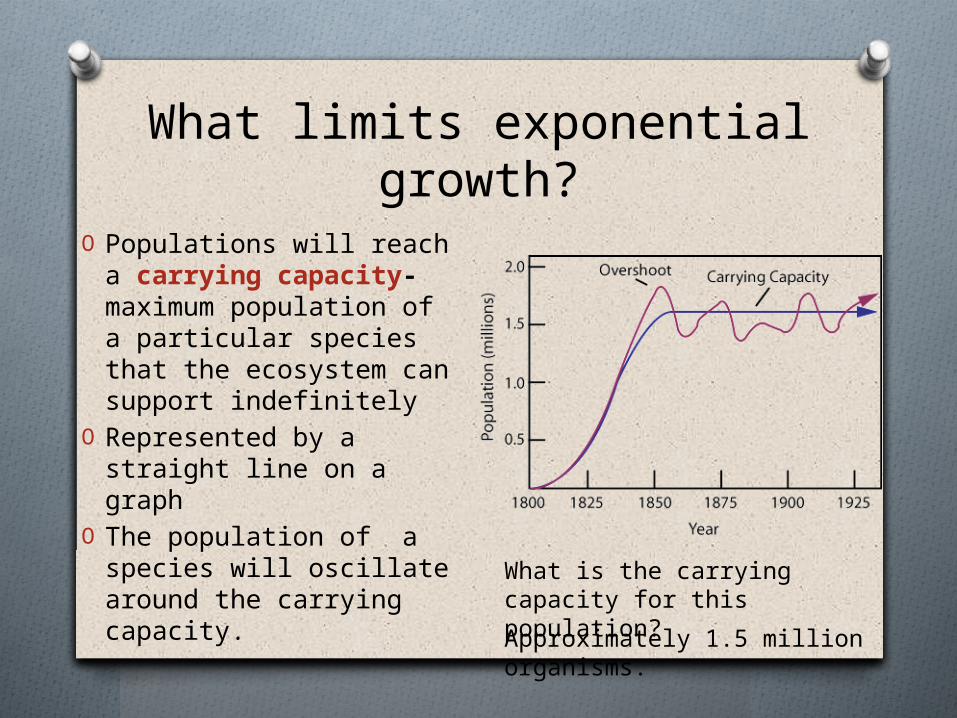
What limits exponential growth?
O Populations will reach a carrying capacity- maximum population of a particular species that the ecosystem can support indefinitely
O Represented by a straight line on a graph
O The population of a species will oscillate around the carrying capacity.
What is the carrying capacity for this population?
Approximately 1.5 million organisms.

What limits exponential growth?
O As population approaches its carrying capacity, there is competition for resources.
O Organisms will compete indirectly for social dominance or for a territory to claim resources.
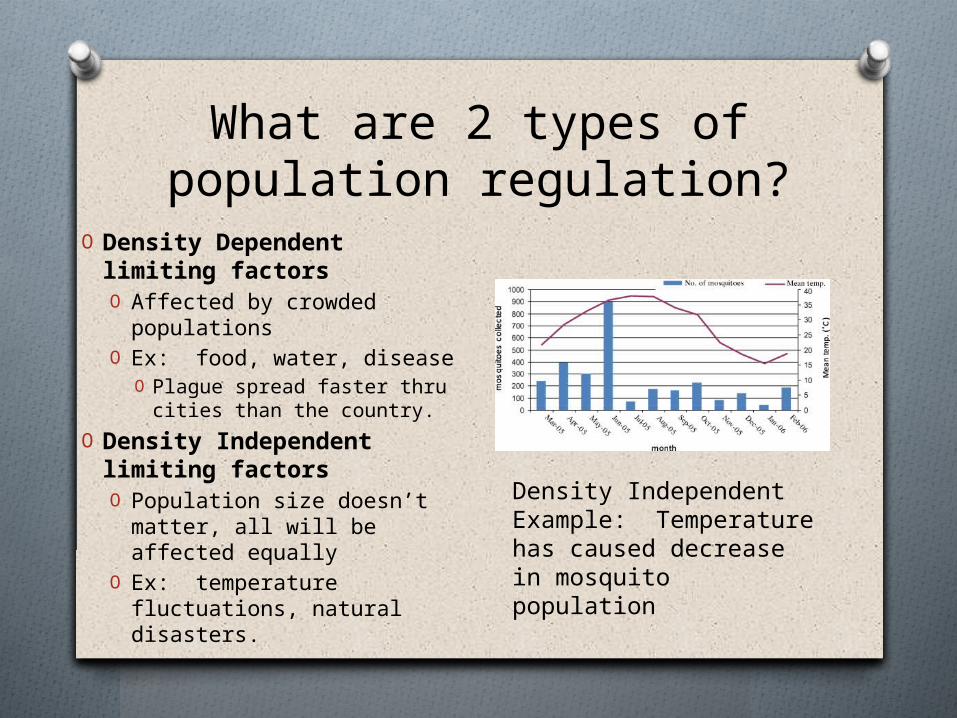
What are 2 types of population regulation?
O Density Dependent limiting factorsO Affected by crowded
populationsO Ex: food, water, disease
O Plague spread faster thru cities than the country.
O Density Independent limiting factorsO Population size doesn’t
matter, all will be affected equally
O Ex: temperature fluctuations, natural disasters.
Density Independent Example: Temperature has caused decrease in mosquito population
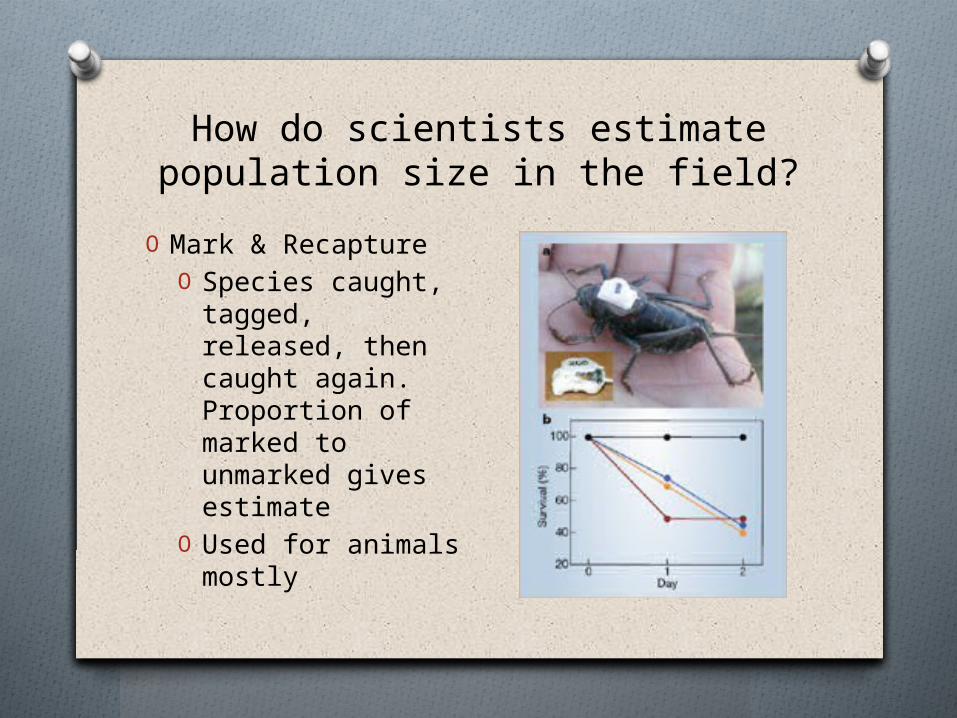
How do scientists estimate population size in the field?O Mark & Recapture
O Species caught, tagged, released, then caught again. Proportion of marked to unmarked gives estimate
O Used for animals mostly
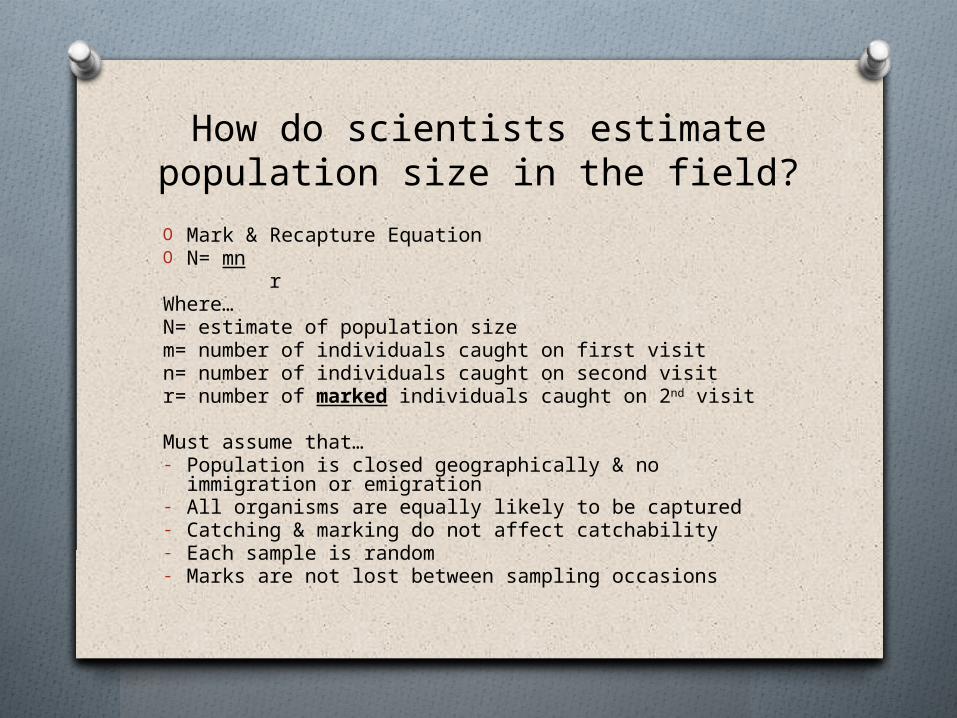
How do scientists estimate population size in the field?
O Mark & Recapture EquationO N= mn
rWhere…N= estimate of population sizem= number of individuals caught on first visitn= number of individuals caught on second visitr= number of marked individuals caught on 2nd visit
Must assume that…- Population is closed geographically & no immigration or
emigration- All organisms are equally likely to be captured- Catching & marking do not affect catchability- Each sample is random- Marks are not lost between sampling occasions

How do scientists estimate population size in the field?
O A biologist wants to estimate the size of a population of turtles in a lake. She captures 10 turtles on her first visit to the lake, and marks their backs with paint. A week later she returns to the lake and captures 15 turtles. Five of these 15 turtles have paint on their backs, indicating that they are recaptured animals. What is the estimated size of the population?
m = #originally marked = 10n = total # caught in 2nd sample = 15r = # caught in 2nd sample that were marked = 5
O N= mn = 10 x 15 = 30 turtles in this lake (approximate)
r 5