understanding p-values and the controversy surrounding them
TRANSCRIPT

Understanding p-values and the Controversy Surrounding Them
Professor Jessica UttsUniversity of California, Irvine
2016 President, American Statistical AssociationJoint with Ron Wasserstein
ASA Executive Director
April 24, 2018
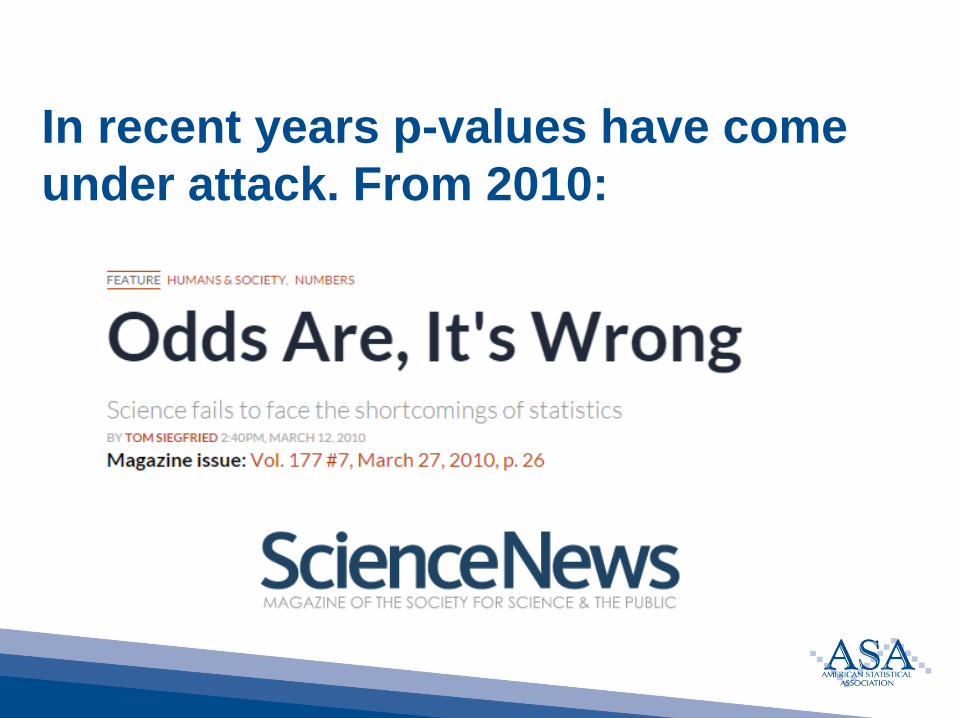
In recent years p-values have come under attack. From 2010:
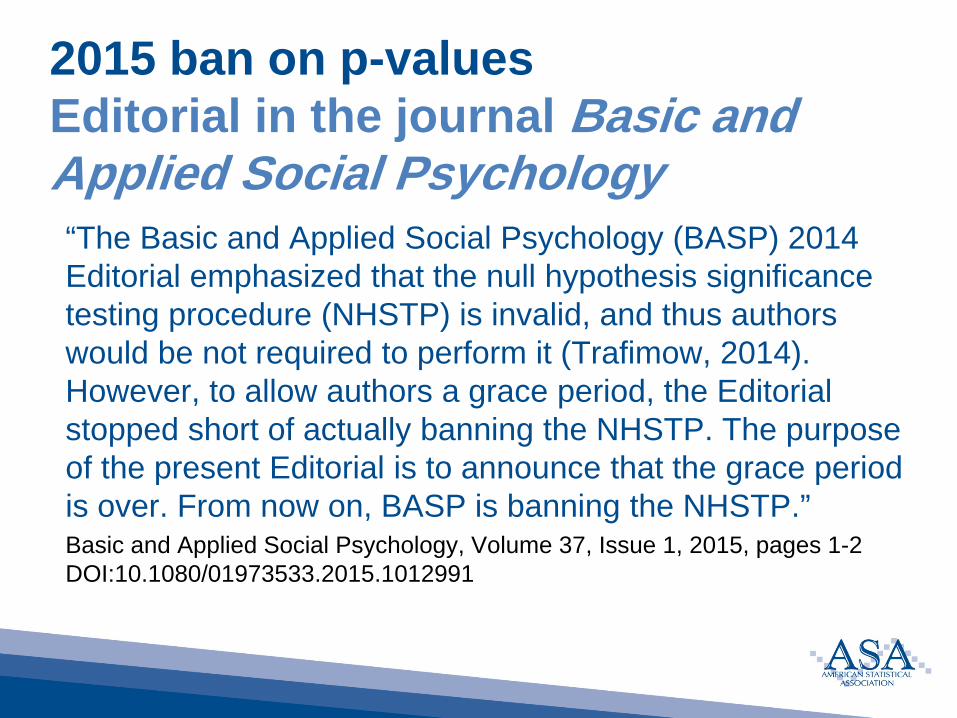
2015 ban on p-valuesEditorial in the journal Basic and Applied Social Psychology“The Basic and Applied Social Psychology (BASP) 2014 Editorial emphasized that the null hypothesis significance testing procedure (NHSTP) is invalid, and thus authors would be not required to perform it (Trafimow, 2014). However, to allow authors a grace period, the Editorial stopped short of actually banning the NHSTP. The purpose of the present Editorial is to announce that the grace period is over. From now on, BASP is banning the NHSTP.”Basic and Applied Social Psychology, Volume 37, Issue 1, 2015, pages 1-2 DOI:10.1080/01973533.2015.1012991

One reaction to the ban in 2015 (quote on next slide)
https://www.sciencenews.org/blog/context/p-value-ban-small-step-journal-giant-leap-science

“Imagine, if you dare, a world without P values. Perhaps you’re already among the lucky participants in the human race who don’t know what a P value is. Trust me, you don’t want to. P stands for pernicious, and P values are at the root of all (well, most) scientific evil.

“Imagine, if you dare, a world without P values. Perhaps you’re already among the lucky participants in the human race who don’t know what a P value is. Trust me, you don’t want to. P stands for pernicious, and P values are at the root of all (well, most) scientific evil.Of course, I don’t mean evil in the sense of James Bond’s villains. It’s an unintentional evil, but nevertheless a diabolical conspiracy of ignorance that litters the scientific literature with erroneous results. P values are supposed to help scientists decide whether an apparently meaningful experimental result is really just a fluke. But in fact, P values confuse more than they clarify. They are misused, misunderstood and misrepresented. But now somebody is finally trying to do something about it.”

My reaction:There is nothing wrong with p-values, but…

My reaction:There is nothing wrong with p-values, but…
…the humans who use them could benefit from some guidance on how to interpret them and what can go wrong.

American Statistical AssociationP-value statement released March 7, 2016,
then published in The American Statistician*• Response to controversy over use of p-values• Over 60,000 views in the first week and close
to 200,000 views so far• News articles in many places, including:
– Nature, Science, FiveThirtyEight, Retraction Watch, ScienceNews
*Ronald L. Wasserstein & Nicole A. Lazar (2016) The ASA's Statement on p-Values: Context, Process, and Purpose, The American Statistician, 70:2, 129-133.

Article started with Q and A posed by George Cobb in ASA forum:Q: Why do so many colleges and grad schools teach p ≤ 0.05?
A: Because that’s what the scientific community and journal editors use.

Article started with Q and A posed by George Cobb in ASA forum:Q: Why do so many colleges and grad schools teach p ≤ 0.05?
A: Because that’s what the scientific community and journal editors use.
Q: Why do so many people still use p ≤ 0.05?
A: Because that’s what they were taught in college or grad school.

What was in the AmStat editorial?• Introduction, starting with George
Cobb’s questions and answers• Explanation of the (long!) process used
to create the statement• Six bullet points that comprise the
statement, each with an explanation• 22 thoughtful discussion papers (online)
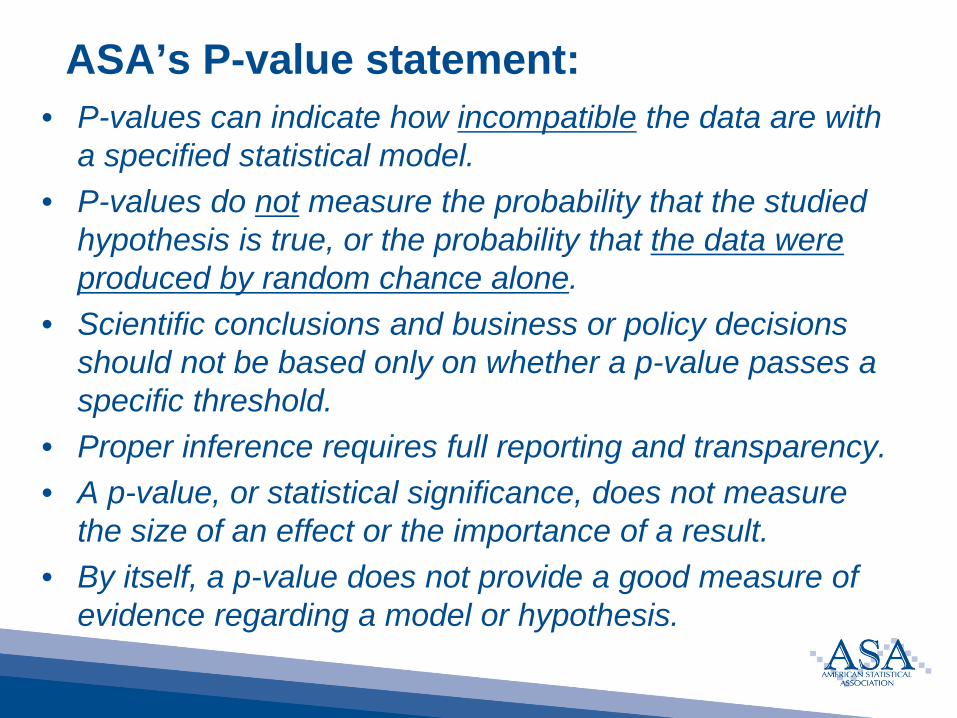
ASA’s P-value statement:• P-values can indicate how incompatible the data are with
a specified statistical model.• P-values do not measure the probability that the studied
hypothesis is true, or the probability that the data were produced by random chance alone.
• Scientific conclusions and business or policy decisions should not be based only on whether a p-value passes a specific threshold.
• Proper inference requires full reporting and transparency.• A p-value, or statistical significance, does not measure
the size of an effect or the importance of a result.• By itself, a p-value does not provide a good measure of
evidence regarding a model or hypothesis.

The p-value is the probability of observing data (or a test statistic value) as extreme as that observed or more so, if the null hypothesis is true.
But that’s not enough!
How would you define p-value?Often used definition:
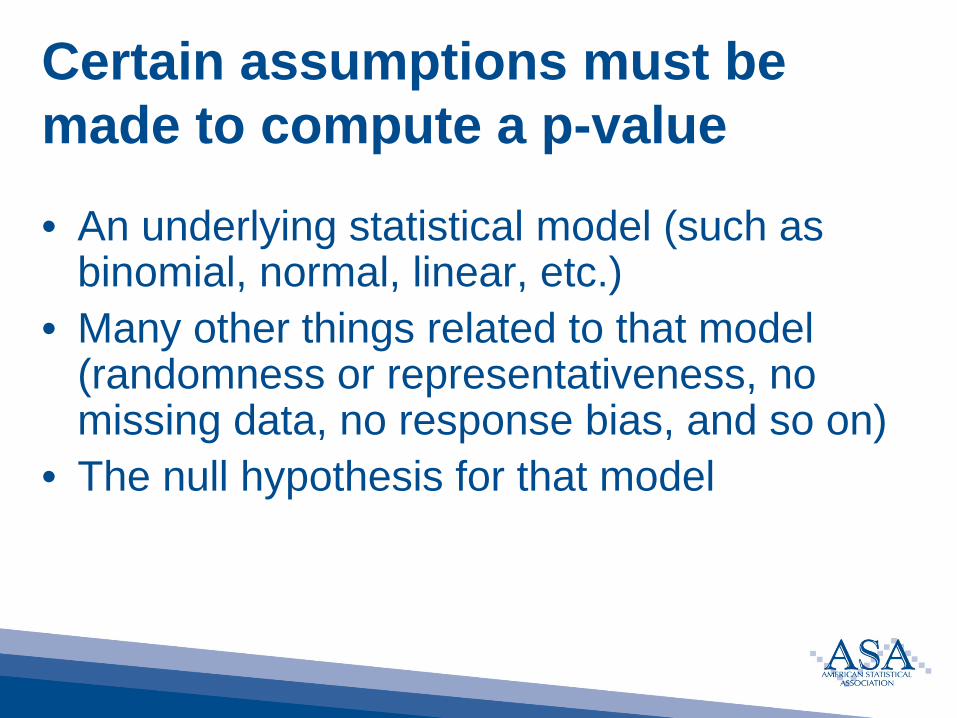
Certain assumptions must be made to compute a p-value
• An underlying statistical model (such as binomial, normal, linear, etc.)
• Many other things related to that model (randomness or representativeness, no missing data, no response bias, and so on)
• The null hypothesis for that model

Informally, a p-value is the probability under a specified statistical model that a statistical summary of the data (e.g., the sample mean difference between two compared groups) would be equal to or more extreme than its observed value.
“That definition is about as clear as mud”Christie Aschwanden, lead writer for science, FiveThirtyEight
Simple definition from ASA statement

Perhaps this is clearer?
(Stark, TAS, 2016)
Just try getting that definition across in an introductory statistics class!

Example from Christensen, 2005If [we assume] y1, y2, . . . , yn are independent N(μ, σ2) and we perform a t test of H0 : μ = 0, a rejection could mean that μ ≠ 0, or it could mean that the data are not independent, or it could mean that the data are not normal, or it could mean that the variances of the observations are not equal. In other words, rejecting a Fisherian test suggests that something is wrong with the model. It does not specify what is wrong.

Use and logic of p-values• If the p-value is “small enough,” the researcher
concludes there is a “significant effect.”• “Small enough” commonly means p<.05.• If the p-value is small, this means that it is
relatively unlikely that we would have seen the data we saw if all the assumptions were true.
• So, we either had bad luck (random error), or one or more of the assumptions may not be true.
• The null hypothesis assumption of no effect, is commonly THE assumption that is thought to be untrue.

Simple hypothesis test example• Are college women taller, on average than
their mothers? (Better diets, health care, etc)• Measure n pairs and find differences.• Hypotheses:
– Null: Mean of population of differences = 0– Alternative: Mean of population is > 0

Example, continued, data from my class
• n = 93 pairs (daughter – mother height)– mean difference = 1.30 inches– standard deviation = 2.6 inches
• Test statistic is t = 93 × 0.5 = 4.8• p-value = P(test stat > 4.8 if null is true) ≈ 0• Traditional hypothesis testing would say we
can conclude women students today are taller than their mothers, on average.

Some reasons other than a false null hypothesis that could lead to this result
• Do my students represent all college women?• Do students know how tall their mothers are?• Are reported heights accurate or precise?
– Rounded to nearest ½ inch?– Know height in cm, but not inches?
• Are differences normally distributed (if small n)?All of those assumptions are part of the p-value computation.

Example, continuedAnd what if n = 10 instead, but same sample mean (1.30) and standard deviation (2.60)?• Test statistic is t = 10 × 0.5 = 1.58• p-value = P(test stat > 1.58 if null is true) = 0.074 • Cannot conclude women students today are taller
than their mothers, on average.• Would we conclude that there is no difference??
– “No evidence of a difference does not equal evidence of no difference!”
This example illustrates one problem with p-values: Importance of sample size
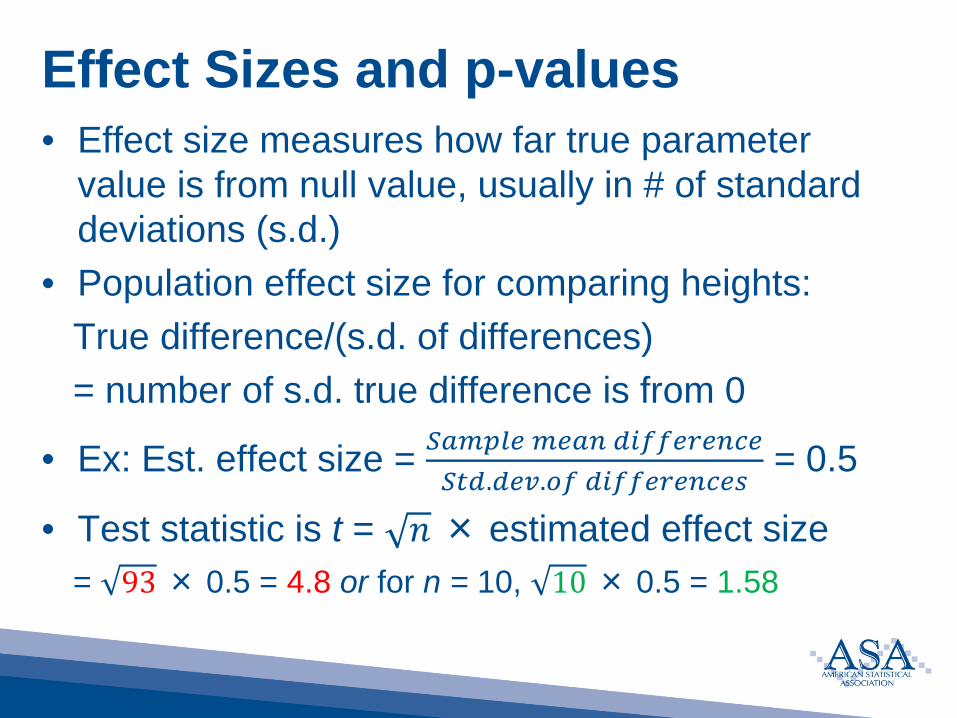
Effect Sizes and p-values• Effect size measures how far true parameter
value is from null value, usually in # of standard deviations (s.d.)
• Population effect size for comparing heights:True difference/(s.d. of differences) = number of s.d. true difference is from 0
• Ex: Est. effect size = 𝑆𝑆𝑆𝑆𝑆𝑆𝑆𝑆𝑆𝑆𝑆𝑆 𝑆𝑆𝑆𝑆𝑆𝑆𝑚𝑚 𝑑𝑑𝑑𝑑𝑑𝑑𝑑𝑑𝑆𝑆𝑑𝑑𝑆𝑆𝑚𝑚𝑑𝑑𝑆𝑆𝑆𝑆𝑆𝑆𝑑𝑑.𝑑𝑑𝑆𝑆𝑑𝑑.𝑜𝑜𝑑𝑑 𝑑𝑑𝑑𝑑𝑑𝑑𝑑𝑑𝑆𝑆𝑑𝑑𝑆𝑆𝑚𝑚𝑑𝑑𝑆𝑆𝑑𝑑
= 0.5
• Test statistic is t = 𝑛𝑛 × estimated effect size = 93 × 0.5 = 4.8 or for n = 10, 10 × 0.5 = 1.58

Hypothesis testing paradox:• Researcher conducts test with n = 100 and finds t
= 2.50, p-value = 0.014, reject null hypothesis• Just to be sure, repeats with n = 25• Uh-oh, finds t = 1.25, p-value = 0.22, cannot reject
null! The effect has disappeared!• To salvage, decides to combine data, so n = 125.
Finds t = 2.795, p-value = 0.006!• Paradox: The 2nd study alone did not replicate
finding, but when combined with 1st study, the effect seems even stronger than 1st study!

What’s going on?• Both studies have the same effect size!• Combined data also has that effect size• The value of the test statistic and p-value depend
on the sample size through 𝑛𝑛. • Effect size is t / 𝑛𝑛 and t = 𝑛𝑛 (effect size)Study n Effect size Test stat P-value
1 100 0.25 2.50 0.014
2 25 0.25 1.25 0.22
Combined 125 0.25 2.795 0.006

Why Effect Sizes are Important• Unlike p-values, they don’t depend on sample
size (but accuracy of estimating them does).• They are a measure of the true effect or
difference in the population.• They can be compared even when different
units or different tests are used.• Replication should be defined as getting
approximately the same effect size, not as getting approximately the same p-value!

More p-value misunderstandings• Wrong: The p-value is the probability that the null
hypothesis is true.– Instead: The p-value indicates the degree to which the
data are incompatible with what’s expected if the null hypothesis and all the other assumptions used in the test are true.
• Wrong: The p-value is the probability that the observation (or data) occurred by chance.– Instead: The p-value is not the probability of chance
given the data, it is the probability of the data given chance!

Misunderstandings, continued• Wrong: A significant test result (p<0.05) means that
the null hypothesis is false and should be rejected.– Instead: A small P-value simply flags the data as being
unusual if all the assumptions used to compute it (including the null hypothesis) were correct.
• Wrong: A non-significant test result (p>0.05) means that the null hypothesis is true or should be accepted.– Instead: A large P-value simply flags the data as not
unusual if all the assumptions used to compute it (including the null hypothesis) were correct. Particularly tricky with small n, because only very extreme results would seem “unusual!” Perhaps none extreme enough!
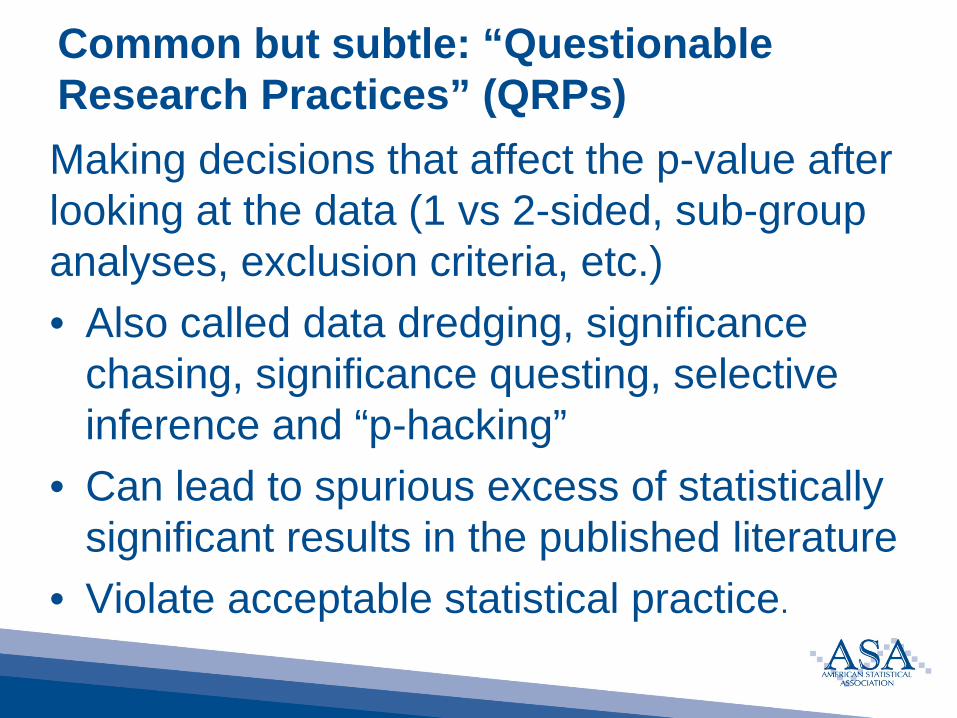
Common but subtle: “Questionable Research Practices” (QRPs)Making decisions that affect the p-value after looking at the data (1 vs 2-sided, sub-group analyses, exclusion criteria, etc.)• Also called data dredging, significance
chasing, significance questing, selective inference and “p-hacking”
• Can lead to spurious excess of statistically significant results in the published literature
• Violate acceptable statistical practice.

Probably the most common misuse: Multiple tests
• Researchers look at dozens (or hundreds of thousands) of individual hypothesis
• Focus only on the “significant” ones and might not report how many were examined.
• But if you test enough things, some are bound to be “significant”!
• Subtle version of this: Variable selection in regression and other models

There are many other problems with relying on p-values alone• Let’s look at a more complicated
example, published in a peer-reviewed journal. – Thanks to Ron Wasserstein for this
example and some of the slides.• It is not my intention to criticize this
particular study or this article – it is fairly representative!

Does “screen time” affect sleep habits of school age children?

The researchers had hypotheses based on previous research• “We hypothesized that use of any form of electronic
media would be negatively associated with sleep duration.
• Furthermore, we expected that the strength of the association would vary based on the level of interactivity of the screen type.
• More specifically, we hypothesized that interactive forms of screen time, such as computer use and video gaming, would be associated with shorter bedtime sleep duration compared to passive forms of screen time, such as watching television.”

Why were they interested? More quotes from the paper:• Lack of sleep (insufficient sleep duration) is
associated with increased risk of poor academic performance as well as certain adverse health outcomes
• We examined the association between nighttime sleep duration and 3 types of screen exposure: television, chatting, and video gaming.

Who were the participants in the study?
• A national birth cohort of 3,269 nine-year-olds, and their primary caregivers (2,770)
• “The FFCW* is a longitudinal cohort study that has followed approximately 5000 children, born between 1998 and 2000, since birth. Data were collected in 20 cities with populations of at least 200,000 across the United States. The sample was designed to include a high number of unmarried parents and racial minorities, along with a high proportion of low socioeconomic status.”
*FFCW = Fragile Families and Child Wellbeing Study


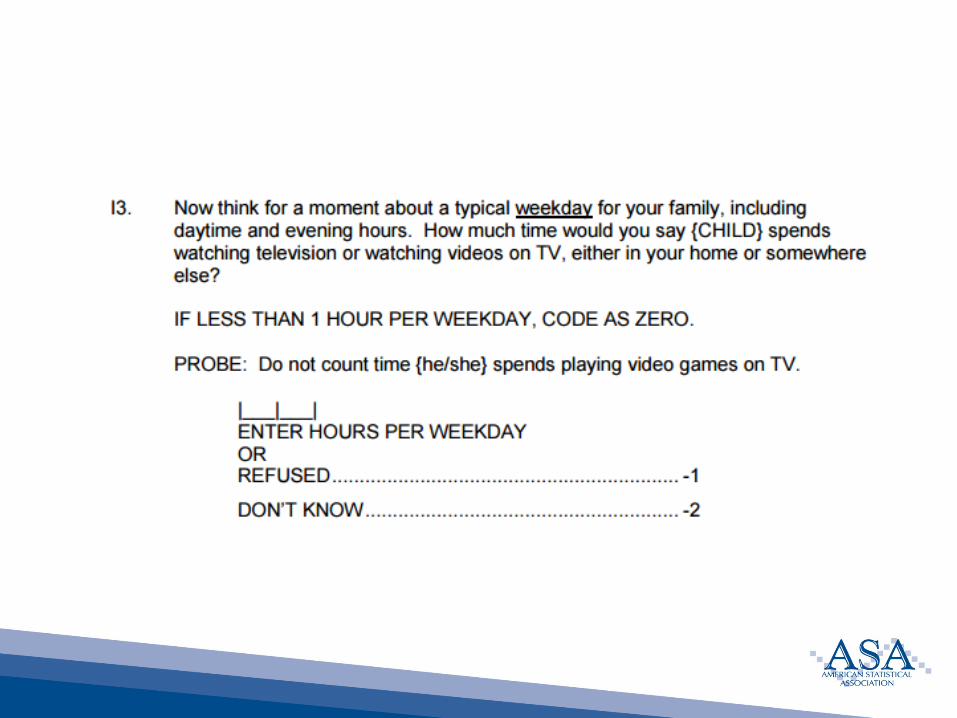
Caregivers were asked a separate set of questions. The researchers combined the caregivers responses with the children’s responses from the other survey.

What the researchers found:• Children who watched more than 2 hours/day of TV had
shorter average sleep duration than those who watched less than 2 hours/day (P<.001) by about 11 minutes.
• Children who spent more than 2 hours per day of chattingon the computer had shorter average sleep duration than those who chatted less than 2 hours/day (P<.05) by about 16 minutes.
• The researchers did not find a significant associationbetween playing videogames/working on the computer for more than 2 hours per day and weekday nighttime sleep duration

When the researchers adjusted for other (parental) factors• Children who watched more than 2 hours/day
of TV had shorter sleep duration compared with those who watched less than 2 hours/day (P<.05) by about 6 minutes (instead of 11 minutes).
• No other significant associations found.
This is a fairly typical type of study• Typical scientifically• Typical statistically• Atypical communication
– Very carefully explains everything they did and why. Authors are to be commended for that!
• And unfortunately, it makes all too typical mistakes

Typical logic for this type of study• If p-value is small, this means it is relatively
unlikely that we would have seen the data we saw if all the assumptions were true.
• So, we either had bad luck (random error), or one or more of the assumptions may not be true.
• One of the assumptions, the null hypothesis assumption of no effect, is commonly THE assumption that is thought to be untrue.

In the example:• Children who watched more than 2 hours/day of
TV had shorter sleep duration compared with those who watched less than 2 hours/day (P<.001) by about 11 minutes, on average.
• This means that, if all of the assumptions are correct, including the null hypothesis, there is less than a 1 in 1000 chance that the researchers would have observed the result they did or one even larger. (The result they observed is an average difference of about 11 minutes from one group to the other.)

Fisher called such results “significant”• He meant that the result was worth further scrutiny• Unfortunately, the word “significant” is loaded with
meaning• Statisticians draw the distinction between
“statistical significance” and “practical significance”• But the public generally does not!

Likely media interpretation:• Research shows that children who watch TV more during
weekdays sleep less than those who don’t. • Therefore, “TV is not good for kids and should be limited”
or (worse) “TV is causing poor performance in school because it makes kids sleep less.”
• Authors’ conclusion in abstract: “Screen time from televisions and computers is associated with reduced sleep duration among 9-year-olds, using 2 sources of estimates of screen time exposure (child and parent reports). No specific type or use of screen time resulted in significantly shorter sleep duration than another, suggesting that caution should be advised against excessive use of all screens.”

Whoa! There is no “p-value transitivity property”• They argue (in effect):
– Watching TV results in less sleep in this study (statistically significant)
– Effect of TV = chatting = video games in this study (no significant differences for those three activities)
– Therefore, we should watch out for all of these• But the study does not and cannot prove the
assertion in the 2nd bullet!

What is scientifically appropriate to conclude?• The children in this study who watched more
than 2 hours/day of TV had shorter average sleep duration compared with those who watched less than 2 hours/day, by about 11 minutes.
• If all of our assumptions, including those about the representativeness of the sample, are correct, and if this was the only question asked, the study suggests that nine year old children from this population who watch more than 2 hours/day of TV….
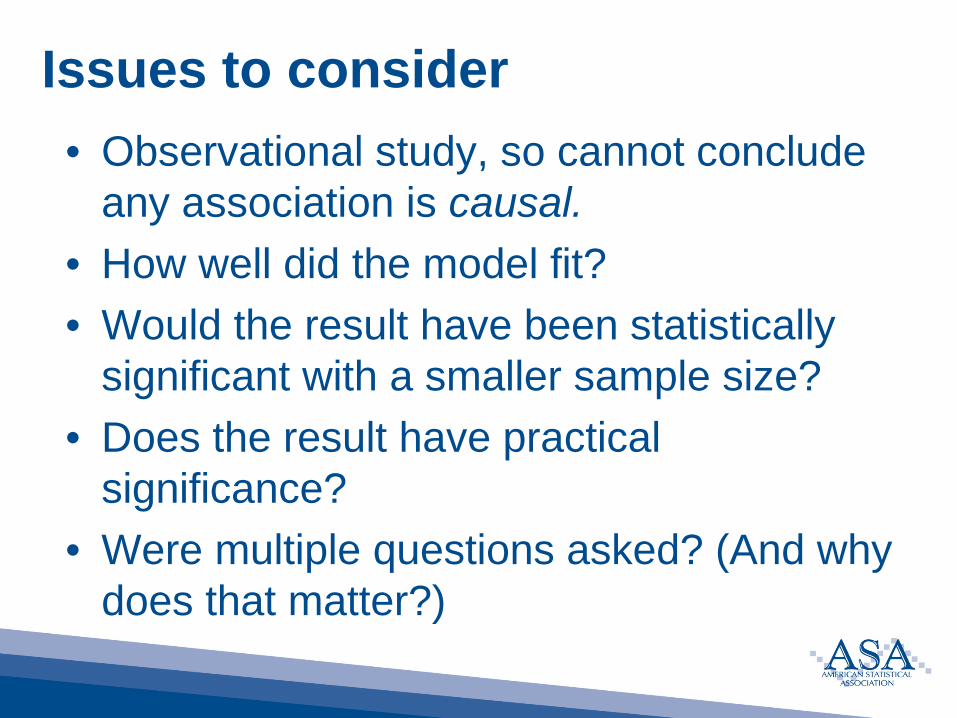
Issues to consider• Observational study, so cannot conclude
any association is causal. • How well did the model fit?• Would the result have been statistically
significant with a smaller sample size?• Does the result have practical
significance?• Were multiple questions asked? (And why
does that matter?)

Observational study, so cannot conclude any association is causal.
• Respondents were not randomly assigned to differing screen times, so confounding variables are quite likely.
• Perhaps common cause of both less sleep and more screen time is lack of parental control.

Issues to consider, continued• How well did the model fit?
– Not very well! R2 = 0.01, so only about one 100th of the variability in sleep hours was “explained” by the variables in the model.
– After adjusting for various maternal covariates, p-value was closer to .05 than to .001, and average difference was 6 minutes (not 11 minutes)
• Does the result have practical significance?– Does a difference of 11 (or 6) minutes of sleep matter?
• Would the result have been statistically significant with a smaller sample size?– Not likely. Here n = 3269.

In the sleep research, even if all of our assumptions are correct…
• Does 11 minutes less sleep really matter? • Furthermore, the “11 minutes” measure is an
estimate that has variance – we learn nothing about that variance from the way the data summary is reported (i.e., via a p-value).
• A confidence interval for the difference would be more informative.
• Should kids only be allowed 1 hr and 59 min? ☺

And what if THIS had happened:• Suppose a study with much smaller n
showed that children who watched 2 or more hours of TV slept on average 90 minutes per night less than those who did not, but the p-value was 0.09.
• Is this result “insignificant”?
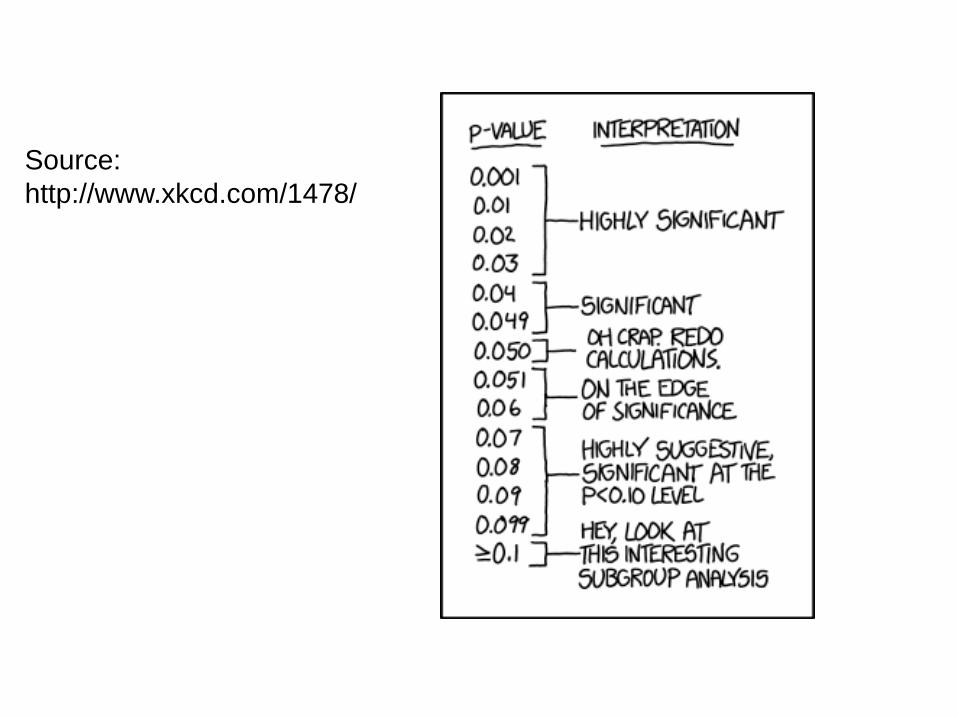
Source:http://www.xkcd.com/1478/

So far, we have seen some of the ways p-values are misused:
• Failing to recognize that a small p-value can be the result of failure of any of the assumptions, not just the assumed truth of the null hypothesis value
• Failing to distinguish between statistical significance and practical significance (failing to consider the effect size)
• Deciding the scientific merit of an experimental result solely on the basis of whether the p-value is above or below a certain threshold

Unfortunately, there are many more. Here is one of the most common:
• Researchers look at dozens (or hundreds of thousands) of individual hypothesis and focus only on the “significant” ones. But of course if you test enough things, some are bound to be “significant”!


After 14 more "not significant" results,
Source: http://www.xkcd.com/882/

This leads to all kinds of problems for science• Publication bias: When only the statistically
significant results are published, we never see all the research that might suggest something else (the file-drawer effect)
• Reproducibility: What’s going to happen when someone else tests the link for green jelly beans to acne?
• Ioannides, J. 2005. Why Most Published Research Findings Are False. PLoS Medicine 2 (8): 696-701.

Revisiting p-hacking• Making decisions that affect the p-value
based on the data• These procedures, known by such terms
as data dredging, significance chasing, significance questing, selective inference and “p-hacking,” can lead to a spurious excess of statistically significant results in the published literature and violate acceptable statistical practice.

Researcher degrees of freedomSimmons, J., Nelson, L., and Simonsohn, U. (2011), False-Positive Psychology: Undisclosed Flexibility in Data Collection and Analysis Allows Presenting Anything as Significant, Psychological Science, 22(11) 1359–1366

Researcher degrees of freedom• “In the course of collecting and analyzing data,
researchers have many decisions to make: Should more data be collected? Should some observations be excluded? Which conditions should be combined and which ones compared? Which control variables should be considered? Should specific measures be combined or transformed or both?”
• “It is rare, and sometimes impractical, for researchers to make all these decisions beforehand. Rather, it is common (and accepted practice) for researchers to explore various analytic alternatives, to search for a combination that yields “statistical significance,” and to then report only what ‘worked.’”
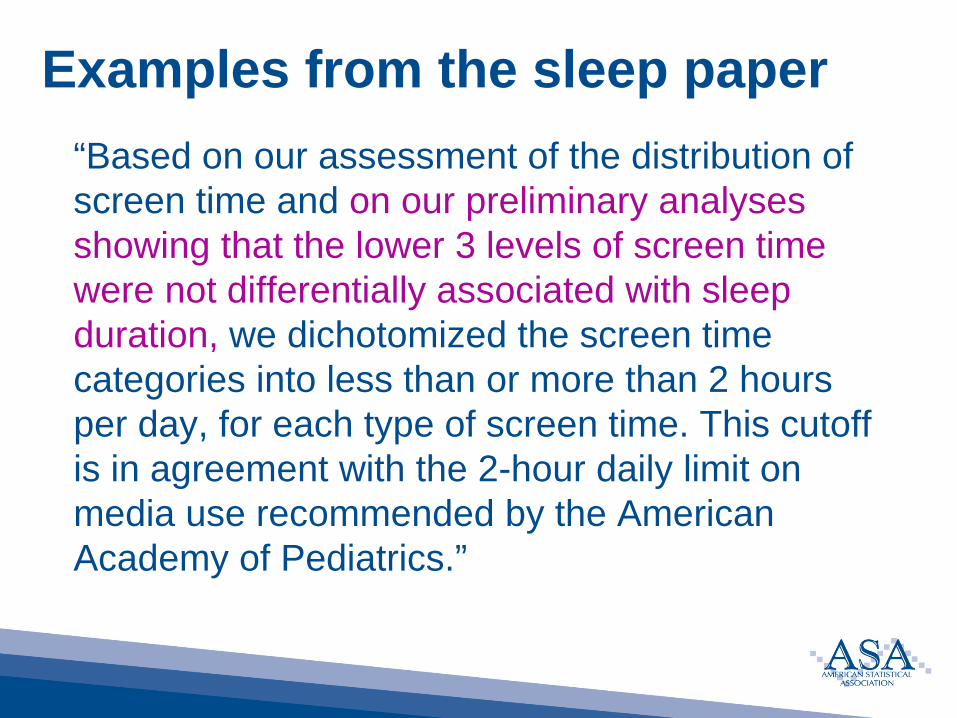
Examples from the sleep paper“Based on our assessment of the distribution of screen time and on our preliminary analyses showing that the lower 3 levels of screen time were not differentially associated with sleep duration, we dichotomized the screen time categories into less than or more than 2 hours per day, for each type of screen time. This cutoff is in agreement with the 2-hour daily limit on media use recommended by the American Academy of Pediatrics.”

Examples from this paper“Within parental relationship, we consolidated visiting and friendly and hardly talk, never talk, and unknown father. We also combined the categories of less than high school and education equivalent to high school, within the mother's education variable. We chose to combine these categories based on the distribution of the data and our initial analyses.”
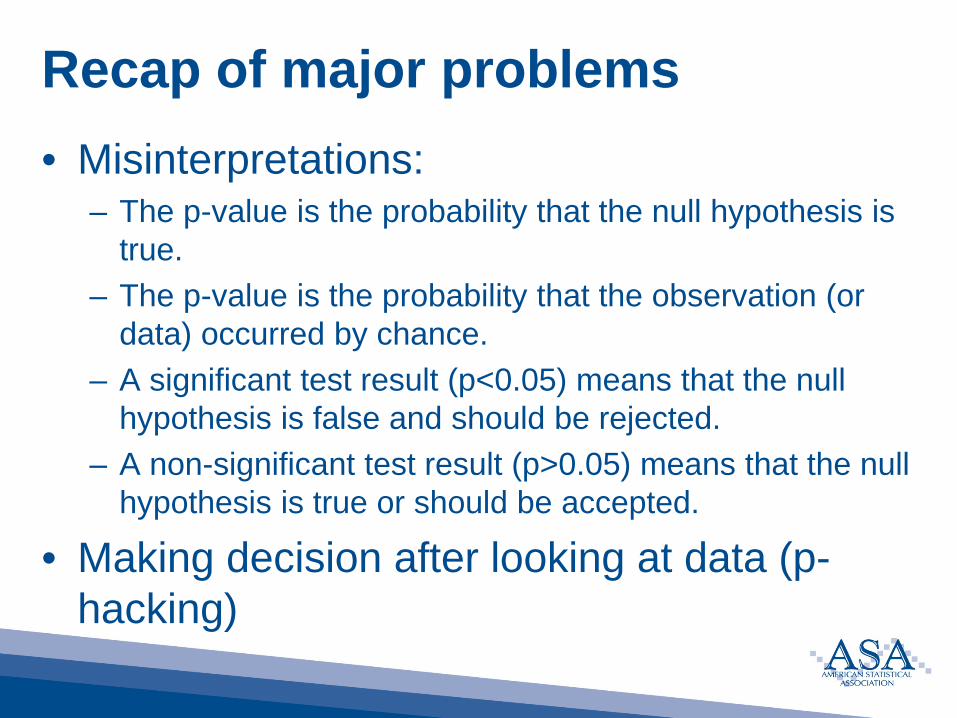
Recap of major problems• Misinterpretations:
– The p-value is the probability that the null hypothesis is true.
– The p-value is the probability that the observation (or data) occurred by chance.
– A significant test result (p<0.05) means that the null hypothesis is false and should be rejected.
– A non-significant test result (p>0.05) means that the null hypothesis is true or should be accepted.
• Making decision after looking at data (p-hacking)

Major problems, continued• Multiple testing, but not reporting all results• Failing to recognize that a small p-value can be the
result of failure of any of the assumptions, not just the assumed truth of the null hypothesis value
• Failing to distinguish between statistical significance and practical significance (failing to consider the effect size)
• Deciding the scientific merit of an experimental result solely on the basis of whether the p-value is above or below a certain threshold

Alternatives to p-values; each with strengths and limitations• Estimation rather than testing
– confidence intervals – effect sizes
• Bayesian alternatives – Bayes factors– highest posterior density intervals
• Decision-theoretic approaches

The change needed is not technical. It is cultural.• Journals and research funders• Researchers and authors• Educators
All these groups will need to make a cultural shift

Realizations needed in this shift• Bright lines don’t exist• Tell the whole story• Be clear about the basics• Consider alternatives• For journal editors: Don’t make publication
decisions based solely on p-values

Biggest takeaway message from the ASA statement – bright line thinking is bad for science“(S)cientists have embraced and even avidly pursued meaningless differences solely because they are statistically significant, and have ignored important effects because they failed to pass the screen of statistical significance…It is a safe bet that people have suffered or died because scientists (and editors, regulators, journalists and others) have used significance tests to interpret results, and have consequently failed to identify the most beneficial courses of action.” (Rothman)
Change of culture for all of us• Journal editors and reviewers: Make decisions based on
the design, conduct, and analysis of studies, not on p-values. Authors and editors should move away from the belief that low p-values confer scientific significance and that only results with low p-values are worth reporting.
• Researchers and authors: Realize that once one has completed the data collection for a study, one has an obligation to report the study regardless of the statistical results. They should transparently report all factors that may have affected the results of their data analysis.
• Statistical educators: Evaluate how effectively we are communicating the proper use and interpretation of estimates and p-values. Change focus.

Notice the date:
1988!
Statisticians have been worried about these issues for a long time…
Follow-up by ASA• Symposium on statistical inference Oct 2017• Upcoming special issue of American Statistician• Topics covered:
– Conducting research in the 21st century– Using research in the 21st century– Sponsoring, disseminating, reproducing, and
replicating research in the 21st century– Statistical Education and Training in the 21st
Century– Prescriptions for a Post-P < 0.05 Era
