understanding organizational wellness: the impact …
TRANSCRIPT

UNDERSTANDING ORGANIZATIONAL WELLNESS: THE IMPACT OF PERCEIVED
ORGANIZATIONAL SUPPORT, MOTIVATION, AND BARRIERS ON THE
EFFECTIVENESS OF WELLNESS PROGRAMS
By
Aaron Owsley Manier
Approved:
Christopher J. L. Cunningham Bart L. Weathington
UC Foundation Associate Professor UC Foundation Associate Professor
(Thesis Chair) (Committee Member)
Brian J. O’Leary Jeff Elwell
Associate Professor Dean of the College of Arts and Sciences
(Committee Member)
A. Jerald Ainsworth
Dean of the Graduate School

ii
UNDERSTANDING ORGANIZATIONAL WELLNESS: THE IMPACT OF PERCEIVED
ORGANIZATIONAL SUPPORT, MOTIVATION, AND BARRIERS ON THE
EFFECTIVENESS OF WELLNESS PROGRAMS
By
Aaron Owsley Manier
A Thesis
Submitted to the Faculty of the
University of Tennessee at Chattanooga
in Partial Fulfillment of the Requirements
of the Degree of Master of Science
in Psychology
The University of Tennessee at Chattanooga
Chattanooga, TN
May 2013

iii
Copyright © 2013
By Aaron Owsley Manier
All Rights Reserved
iv
ABSTRACT
Organizational wellness programs can serve as a powerful tool for organizations to
improve the health and well-being of employees. As organizational wellness grows in popularity
and implementation, organizations should seek to understand employee perceptions of these
programs to maximize their effectiveness and use. The present study examined the effect of
perceived organizational support of wellness, core self-evaluation, and motivation/interest for
wellness programs on wellness program use and satisfaction. This effect was tested with barriers
to use and participative wellness design as possible mediators. Motivation and interest had a
strong and direct effect on program use and satisfaction, while both organizational support and
core self-evaluation were mediated by resource-related barriers. Organizations can use these
findings to develop strategies to improve program effectiveness through increasing employee
motivation, showing support for wellness, and limiting the impact of barriers to program
effectiveness.

v
DEDICATION
I would like to dedicate this work to my mother for her support and presence during my
time at UTC.

vi
ACKNOWLEDGEMENTS
I extend my deepest gratitude to Dr. Chris Cunningham for his guidance throughout my
thesis process. Moving from stage to stage in the process, from uncertainty to certainty and back
again, Dr. Cunningham has extended himself in an open and supportive way. His sharp
intelligence and genuine concern for the well-being of others has been the anchor that has sailed
the ship of this thesis into port. I would additionally like to acknowledge the rest of the
Industrial-Organizational Psychology graduate faculty for their support and teachings throughout
my time at UTC. Whatever the future may bring, I feel well prepared to continue my
development as a researcher, practitioner, and student.
Many thanks are due to the participating organizations and employees who made this
study possible. While the experience of true field research can get a bit mucky, I have learned a
tremendous amount from the process of engaging the business world in collaborative endeavors
with the Ivory Tower. I would also like to acknowledge the strength and energy of the
miraculous Camellia sinensis for its unending support during the preparation of this thesis.

vii
TABLE OF CONTENTS
DEDICATION ................................................................................................................... iv
ACKNOWLEDGEMENTS .................................................................................................v
LIST OF TABLES ........................................................................................................... viii
LIST OF FIGURES ........................................................................................................... ix
CHAPTER
I. INTRODUCTION AND REVIEW OF THE LITERATURE.................................1
The Benefits of Organizational Wellness Programs ..........................................4
Barriers to Organizational Wellness Program Use ............................................5
Personal barriers...........................................................................................6
Environmental barriers.................................................................................8
Organizational barriers.................................................................................8
Facilitators of Organizational Wellness Program Use .......................................9
Organizational support .................................................................................9
Participative design ....................................................................................10
Employee motivation .................................................................................10
The Present Study ............................................................................................11
Organizational right and responsibility to promote wellness ....................12
Wellness program effectiveness ................................................................13
Individual demographic and personality covariates ..................................15
II. METHOD ..............................................................................................................18
Participants .......................................................................................................18
Materials ..........................................................................................................19
Demographics ............................................................................................19
Perceived organizational right and responsibility to promote wellness.....20
Wellness program offerings .......................................................................20
Wellness offering availability ..............................................................20
Wellness offering interest ....................................................................20
Wellness offering motivation ...............................................................20
Wellness offering use ...........................................................................21
viii
Wellness offering satisfaction ..............................................................21
Overall program effectiveness .............................................................21
Desire for inclusion in program design and perceived say in design ........21
Perceived organizational support of wellness ............................................22
Barriers to Program Effectiveness .............................................................24
Core self-evaluation ...................................................................................26
Health locus of control ...............................................................................26
Coordinator survey.....................................................................................26
Procedure .........................................................................................................27
III. RESULTS ..............................................................................................................28
Data Cleaning and Preparation ........................................................................28
Correlations and Descriptive Statistics of Key Study Variables .....................29
Tests of Hypotheses .........................................................................................31
Coordinator Survey Qualitative Analysis ........................................................36
IV. DISCUSSION ........................................................................................................38
The Impact of Study Variables on Wellness Program Effectiveness ..............39
Limitations .......................................................................................................46
Directions for Future Research ........................................................................47
Practical Implications.......................................................................................49
Conclusion .......................................................................................................50
REFERENCES ..................................................................................................................52
APPENDIX
A. PARTICIPANT DEMOGRAPHICS .....................................................................57
B. MEASURES USED IN STUDY ...........................................................................60
C. WELLNESS PROGRAM LISTINGS AND AVAILABILITY ............................63
D. QUALITATIVE DATA FROM WELLNESS PROGRAM COORDINATORS .66
E. EMPLOYEE SURVEY .........................................................................................71
F. INSTITUTIONAL REVIEW BOARD APPROVAL LETTER ............................83
VITA ..................................................................................................................................85
ix
LIST OF TABLES
1. Loadings for Exploratory Factor Analysis with Varimax Rotation for POS-W ..........23
2. Factor Loadings for Exploratory Factor Analysis for BHWW ....................................25
3. Descriptive Statistics and Correlations for Key Study Variables ................................30
4. Results of Tests of Indirect Effects and Summaries of Multiple Mediation Models...32
5. Full Models of Dependent Variables, Independent Variables, and Covariates ...........33
6. Full Models Including Dependent Variables, Independent Variables, and
Covariate with Multi-dimensional BHWW ...........................................................40
7. Results of Tests of Indirect Effects and Summaries of Multiple Mediation Models
with Multi-dimensional BHWW............................................................................42
x
LIST OF FIGURES
1. Theoretical model guiding the present study. ..............................................................17
2. Multiple mediation model with representative beta weights .......................................34
3. Multi-dimensional BHWW multiple mediation model with representative beta
weights ...................................................................................................................44

1
CHAPTER I
INTRODUCTION AND REVIEW OF THE LITERATURE
Organizational wellness programs show great promise for increasing employee and
organizational health and general effectiveness. These types of programs typically attempt to
improve employee wellness through interventions that target fitness, nutrition, stress
management, and other lifestyle behaviors or activities. Results of one recent study indicate that
65% of small employers (3-199 workers) and 90% of large employers (200+ workers) in
America offered at least one wellness program to their employees (Claxton et al., 2011).
Wellness programs are becoming an important element of organizational branding and strategy,
as a “healthy workplace” yields better safety outcomes, performance, and quality of life (Merrill,
Aldana, Pope, et al., 2011; Renaud et al., 2008; Sainforth, Karsh, Bookse, & Smith, 2001).
In considering the relevance of these programs, it is helpful to consider the ethical
implications of organizations promoting and encouraging the health of employees. Often
wellness programs rely on external incentives to motivate employees and encourage
participation, including financial benefits extending from program use (Schmidt, 2012).
Unfortunately, this strategy can create equity disparities among employees who use the programs
and are rewarded versus those who do not use the programs and receive no incentive. Programs
designed with these types of external motivators are by default limited in their ability to motivate
employees at all levels as many employees lack the intrinsic motivation to engage in these
programs or perceive them as inappropriate. Perhaps external incentives, despite their
2
prevalence, should not be the foundation for wellness promotion due to the inherent imbalance in
fairness and equity among groups with differing levels of motivation (Schmidt, 2012). Because
of the limitations of external motivators and potential challenges in how these programs are
perceived, some key questions about the importance of these programs beg the asking, including:
Do employees feel organizations have the right to promote their health? Do employees also feel
that it is an organization’s responsibility to promote their health?
If employees do feel that an organization has the right and/or responsibility to promote
their health, what are some of the other factors that impact program participation by employees
when the organization offers programming? Despite the strategic importance of wellness
programs, it is estimated that only 9% of organizations with wellness offerings actively promote
these offerings through health fairs and workforce education efforts (Claxton et al., 2011). To
increase employee awareness of and, by extension, the impact of wellness programs in the
workplace, it has been suggested that coordinators and facilitators of such programs make the
programs relevant to employees by tailoring these programs around employee wellness needs
and interests (Harden, Peersman, Oliver, Mauthner, & Oakley, 1999). A recent survey regarding
wellness programs supports this idea as employees suggested that a broader wellness strategy
needs to be employed along with improved communication and a more detailed consideration of
how these programs operate and are administered to increase program use. Despite the need for
new strategies to increase program use, this survey found that spending on wellness programs
per employee doubled from 2009 to 2011 (National Business Groups on Health & Fidelity
Investments, 2011).
As “health promotion interventions in the workplace more often address disease
prevention issues guided by epidemiological data than needs identified by the recipients
3
themselves” (Harden et al., 1999, p. 545), it can be surmised that coordinators of organizational
wellness programs often do not receive specific and person-level input from employees.
Employee-specific input could be studied and used to guide optimal wellness programs that have
strong potential to positively impact employees and the broader organization.
At present, there are several approaches organizations can take to assess the needs of
employees in relation to wellness. One approach is simply to design programs without any real
input from employees, making design choices based on cost and availability concerns. As
programs that factor in the importance of employee needs or interests have better health and
wellness outcomes (McLeroy, Bibeau, Steckler, & Glanz, 1988), programs designed with no
input are likely to see the least use and, therefore, the lowest return on investment.
Another common wellness program design approach begins with a traditional
physiological health risk assessment (HRA) as a starting point for health education and
promotion. Unfortunately, the impact of HRAs and programs resulting from HRAs has yet to be
established (Soler et al., 2010). Traditional HRAs usually examine attitudes and willingness to
engage in health related behaviors through questions about medical history, lifestyle, and general
health (Claxton et al., 2011). HRAs often influence the development of individual wellness
programs to meet the needs of employees (Zimmerman, 2003), with 35% of organizations who
offer HRAs using the information to attempt to increase participation (Claxton et al., 2011).
While the information gathered by HRAs is important for individual wellness planning,
traditional physiological assessments can be supplemented with assessments of specific
employee wellness programming needs and interests. The design of programs based on
employee needs and interests might provide a more holistic compass with which to guide
program design, resulting in increased perceived organizational support of wellness and a feeling

4
of participation in program design. Wellness programs that utilize a participative design and are
tailored to meet the wellness interests and needs of an organization’s actual workforce could
minimize barriers to use and by extension improve individual and organizational performance.
The Benefits of Organizational Wellness Programs
Organizational wellness programs can improve the health and wellbeing of employees.
Studies indicate that employees who actively engage in wellness offerings like fitness programs
(Clancy, 2012; Hughes, Girolami, Cheadle, Harris, & Patrick, 2007), smoking cessation (Renaud
et al., 2008), and stress management (Bhui, Dinos, Stansfeld, & White, 2012) experience positive
physiological health outcomes. Such programs can also improve psychological and emotional
well-being (Anshel, Brinthaupt, & Kang, 2010; Merrill, Aldana, Garrett, & Ross, 2011).
Despite these empirical findings, it is estimated that only 65% of employers who provide
wellness offerings believe such offerings will significantly improve employee health, and 53% of
organizations with wellness offerings believe these programs can significantly improve
employee health and reduce healthcare-related costs for the organization (Claxton et al., 2011).
This lack of belief in the potential return on investment (ROI) helps to explain the reluctance of
some organizations to implement comprehensive wellness programs (Cherniack & Lahiri, 2010),
with a tendency instead to take a piece-meal or a la carte approach to wellness that targets
specific behaviors linked to epidemiological data without a holistic consideration of unique
individual or organizational contexts and needs.
Recent meta-analytic data suggest that employees who take advantage of company-
sponsored wellness programs report higher levels of job satisfaction, reduced levels of
absenteeism (Parks & Steelman, 2008), and lower levels of presenteeism, or limited on-the-job
5
performance due to health impairments or other factors (Cancelliere, Cassidy, Ammendolia, &
Côté, 2011). Through these mechanisms and others, organizational wellness programs impact a
company’s bottom line. Some research suggests that organizations may experience reductions in
overall healthcare costs because employees who participate in wellness programs are at lower
risk for developing serious and potentially costly medical conditions, resulting in lower
healthcare costs for the organization (Goetzel, Jacobson, Aldana, Vardell, & Yee, 1998).
In addition to long-term considerations, some research suggests significant ROI within
four years of initial capital outlays for wellness programs (e.g., Naydeck, Pearson, Ozminkowski,
Day, & Goetzel, 2008), ranging between $3.50 to $5.93 for every $1 spent (Aldana, Merrill,
Price, Hardy, & Hager, 2001; Chapman, 2003). These figures are based on behavioral measures
like reductions in absenteeism due to illness and increased performance, thus adding to the
overall ROI via increased organizational performance and effectiveness (Aldana, Merrill, Price,
Hardy, & Hager, 2005).
Barriers to Organizational Wellness Program Use
Despite these powerful ROI estimates, several reasons remain for skepticism on the part
of organizational decision-makers regarding the benefits and value of wellness programs. Chief
among these reasons is the fact that on average, less than half of a typical organization’s
workforce participates in such programs (Robroek, Van Lenthe, Van Empelen, & Burdorf,
2009). These low levels of employee participation are likely due to multiple factors, many of
which are not fully under the control of the organization. Unfortunately, there is limited
empirical work in this area to inform targeted efforts to improve employee participation. This is
largely because few empirical studies have examined the influences of person-level factors such

6
as personal views of health, lifestyle, and perceived workload on program use (e.g., Langille et
al., 2011; Robroek et al., 2009).
It can be argued that effective wellness program design should integrate individual,
environmental, and organizational perspectives to ensure the most comprehensive plan for
generating ROI in such programs. Studies regarding health promotion in the workplace suggest
that this type of integrated design, which considers barriers to wellness program use among
individuals, within the working environment, and at the level of the organization as a whole has
the greatest potential for addressing barriers that function on these multiple levels (Shain &
Kramer, 2004).
Personal barriers. Individual characteristics like trait and state affect and personality
can impact the regularity of health-related behaviors and the personal importance placed on
health-related activities (Chatzisarantis & Hagger, 2008; Kiviniemi, Voss-Humke, & Seifert,
2007). Employees’ use of more physical on-site wellness programs can also be limited by other
attitudinal or self-perception related barriers, such as embarrassment about one’s health or a lack
of motivation to engage in wellness activities (Schwetschenau, O’Brien, Cunningham, & Jex,
2008). In addition, many employees choose not to participate in available wellness initiatives
due to a lack of interest or the feeling that what is being presented to them is not personally
relevant (Bull, Gillette, Glasgow, & Estabrooks, 2003; Langille et al., 2011).
In terms of personality, self-efficacy has been positively linked to motivation and
learning (Colquitt, LePine, & Noe, 2000). In general, high self-esteem has been shown to relate
with a higher overall value of health (Abood & Conway, 1992). From these findings, it can be
expected that a person’s self-efficacy and self-esteem are related to a person’s interest in learning

7
about wellness and motivation to engage in wellness activities. In contrast to these more positive
personality traits, an individual’s degree of neuroticism has been shown to negatively correlate
with health behavior self-efficacy and health-relevant cognitions (Williams, O’Brien, & Colder,
2004).
The construct of core self-evaluation integrates the important personality constructs of
self-esteem, self-efficacy, emotional stability, and internal locus of control into a single
integrated personality trait (Judge & Kammeyer-Mueller, 2011). As previous research indicates
a correlation between core self-evaluation and wellness program outcomes (Clancy, 2012), it can
be inferred that various aspects of core self-evaluation are in some way associated with
promoting or hindering wellness program use.
Finally, the construct of health locus of control, or an individual’s perceptions of what
factors influence health behaviors, can influence program use, particularly among individuals
who believe their health is based on chance or fate (Grotz, Hapke, Lampert, & Baumeister,
2011). Chance-based health locus of control is important in designing programs as addressing
this orientation can empower employees to feel more in control of their own health behaviors.
Although there is some research to build upon regarding the influence of personality
traits on exercise behaviors and wellness program participation, less is understood regarding the
ways in which wellness program participation is influenced by individual differences that are
demographic in nature. Limited evidence indicates higher levels of wellness program
participation for female and married employees (Person, Colby, Bulova, & Eubanks, 2010), but
there are few other clear linkages between demographic factors and program use outcomes
(Robroek et al., 2009). This lack of clarity is due in part to weaknesses in the design of studies
in this area, which have often failed to include clear measures of critical demographic factors

8
such as education level and income, of which low levels are associated with generally poor
health (Sorensen, Glasgow, & Corbett, 1990).
Environmental barriers. The work environment can also significantly affect the impact
of organizational wellness programs. Participation rates for worksite wellness programs tend to
be especially low when employees must either travel to take advantage of such programs or do
not have enough flexibility in their work schedule to participate (Person et al., 2010). Exposure
to environmental stressors in the work domain can also limit the effectiveness of wellness
programs, as individuals experiencing high general life stress, including stress caused by work,
may be less likely to use or commit to participating in wellness programs and generally perceive
themselves as unsupported or unable to engage in a healthy lifestyle (Clark et al., 2011;
Schwetschenau et al., 2008).
While some common interventions like flex-time give employees control over their own
schedules during key periods of the day, potentially limiting the health-related impacts of some
stressors within the work environment (Barney & Elias, 2010), a comprehensive wellness
program should both assess and implement programs and strategies to reduce employee stress
and minimize environmental barriers that could prevent employees from taking advantage of
available wellness offerings.
Organizational barriers. Apart from general environmental factors, organizational
wellness programs also require financial and leadership-related resources to impact the well-
being of the workforce. Harden et al. (1999) advocate enthusiastic support of a wellness
program from the top-down, as management-level enthusiasm can increase participation from all
9
employees at all levels and facilitate the best program design for an organization. Despite the
importance of managerial support, Linnan, Weiner, Graham, and Emmons (2007) found that
while 75% of managers believed that wellness programs are important, management feelings
about strategy, organizational responsibility, and how to most effectively address barriers varied
widely. Given potential discrepancies in management perceptions of how to appropriately
improve wellness program effectiveness, wellness program coordinators may experience this
limited sense of responsibility especially when they perceive only a moderate degree of support
from management for their efforts (e.g., Velez, 2011). A lack of clear support and strategic
communication from leadership could limit the motivation of wellness coordinators needed to
create an appropriate and responsive organizational wellness program.
Facilitators of Organizational Wellness Program Use
While a variety of barriers can limit the impact of organizational wellness efforts, many
other factors play an important role in facilitating program effectiveness. Potential wellness
facilitators include organizational support for wellness, participative wellness program design,
and employee motivation. The presence of these facilitators can limit the negative impact of
some of the barriers described above.
Organizational support. Organizations can play a significant role in the health and
well-being of employees. Employees sense the level of support that they received from their
employing organization and this support can in turn impact a number of personal and job factors.
This sense of being supported is traditionally referred to as perceived organizational support
(POS) (Eisenberger, Huntington, Hutchison, & Sowa, 1986). POS has been shown to positively

10
impact organizational commitment, performance, job satisfaction, and turnover rates (Rhoades &
Eisenberger, 2002). As a more specific application of POS theory, perceived organizational
support for employee health and wellness specifically should have a positive impact as well.
Because management-level enthusiasm for wellness programs has been shown to relate with
wellness program participation and effective program design (Harden et al., 1999), a lack of
clear and direct support from upper management for employee wellness can limit the
effectiveness of these programs (e.g., Velez, 2011).
Participative design. One POS-related work characteristic that could impact employee
engagement is participative work design. Often referred to as employee involvement (EI),
participative work environments have been an increasing trend in Fortune 500 companies
(Lawler, Mohrman, & Ledford, 1995). Organizations that support EI experience higher levels of
positive work attitudes and participation in work activities, resulting in stronger performance and
healthier attitudes about the workplace (Tesluk, Vance, & Mathieu, 1999). By extension,
organizations that involve employees in the design and implementation of organizational
wellness programming can expect to experience greater levels of satisfaction with these
programs and see higher levels of participation in the programs over other organizations that do
not involve employees in the process.
Employee motivation. Personal motivation can also play a strong role in an individual’s
ability to work through personal, environmental, and organizational barriers towards health-
related behaviors. Intrinsic motivation is essential for an individual to both engage with
organizational wellness programs and to maintain a level of regular use of the programs (Bhui et

11
al., 2012). Additionally, self-motivation can both influence engagement with worksite wellness
programs and minimize perceptions of barriers that limit health-related behaviors (Bungum,
Orsak, & Chng, 1997). An individual’s level of motivation towards wellness and interest in
wellness offerings should therefore influence program engagement along with perceived
organizational support and participative employee involvement in wellness program design.
The Present Study
While wellness programs within organizations have the potential to yield many benefits
for employees and organizations, there are many barriers operating at multiple levels that can
prevent such benefits from developing. The present study was designed to gather information
that can be used by wellness program coordinators to better design and promote wellness
programs to the benefit of their organizations’ workers and general bottom-line. The driving
question was whether participative wellness program design might increase employee utilization
of such programming.
Because of the potential barriers to wellness program use, the most effective wellness
programs are those that are designed with careful consideration given to the various individual,
environmental, and organizational factors that limit program use. Addressing wellness program
preferences and perceived barriers has been shown to increase the likelihood of better health and
well-being outcomes among employees (McLeroy et al., 1988). As employees’ preferences can
help organizations with strategies to reduce barriers to participation, organizational wellness
programs should be designed with consideration given to genuine employee needs and interests.
Another key goal of the present study was to gather information from employees
regarding perceptions of the organization’s right and/or responsibility to promote employee
12
wellness. Understanding employee perspectives on this issue can help to explain perceptions of
the overall utility and appropriateness of such programs. The expectation was that employees
who perceived that the organization does in fact have the right and responsibility to promote
worker health would report stronger interest in wellness programming, higher motivation and
willingness to participate in such programming, and desire to be included in the designing of
such programs through wellness program interest and needs assessments. Better understanding
employee needs and interests can likely improve eventual employee participation rates and
facilitate more effective program-related communications, marketing, and evaluations. Actual
participative program design could also lead to greater perceptions of organizational support for
employee wellness.
By gathering information regarding individual difference factors at the employee level
that might influence perceptions of wellness programs, the present study was also designed to
provide wellness coordinators with a much better understanding of the people they are expected
to serve with the wellness program offerings they coordinate. Considering these overarching
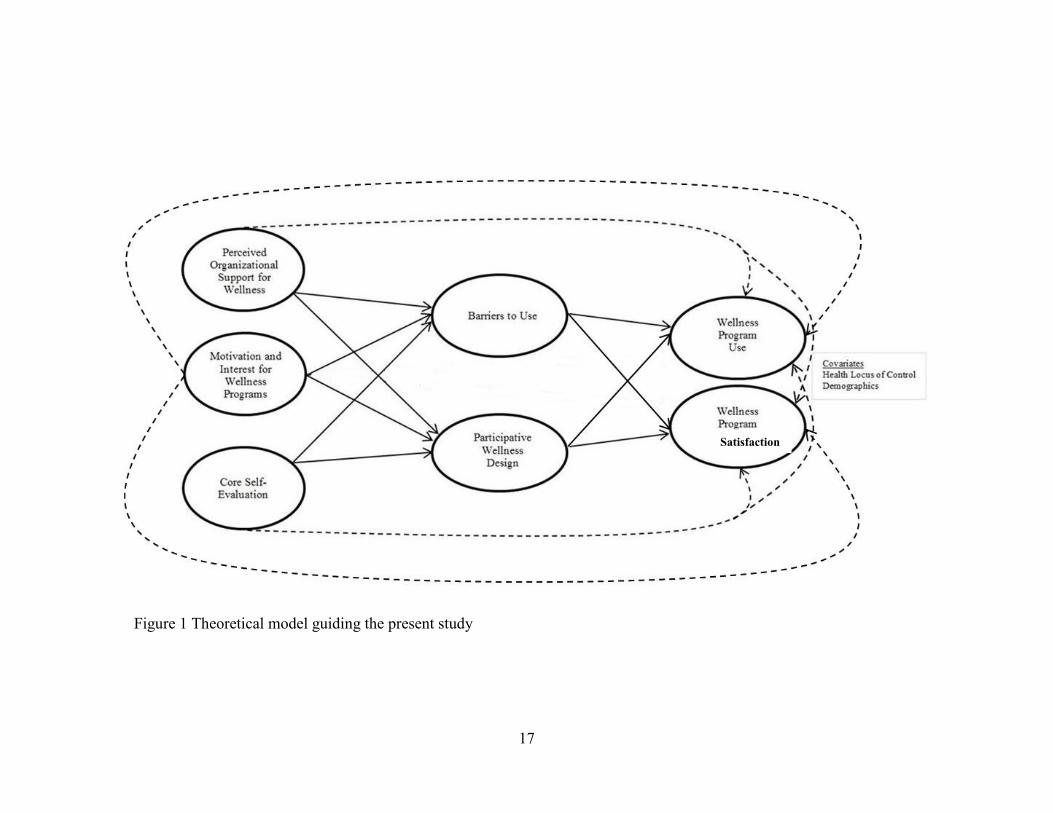
objectives and the preceding literature review, this study tested a series of hypotheses, detailed
below and summarized in Figure 1.
Organizational right and responsibility to promote wellness. Because
organizational wellness programs are relatively new features of many work environments
and justifications for programs range from the altruistic to purely financial, one
exploratory objective of the present study was to better understand whether employees
perceive organizations as having the right and responsibility to influence employee health
behavior. If employees feel that an organization does indeed have the right and
13
responsibility to promote employee health and well-being, they should in turn have both
interest and motivation to participate in these programs and their design.
Hypothesis 1: There is a positive relationship between employee perceptions of an
organization’s (a) right and (b) responsibility to promote employee health and
well-being, and employee desire to participate in the design of wellness
programs.
Wellness program effectiveness. As organizational wellness programs designed with
consideration given to employee needs and interests should reduce barriers to participation
(McLeroy et al., 1988), participative wellness program design should also promote greater
participation and use than programs designed without addressing employee needs and interests.
Wellness programs designed with the needs and interests of employees in mind should
experience greater employee use and satisfaction in program offerings (indicators of effective
wellness programs).
As explained above, employee perceptions of organizational support for wellness are
important for strengthening organizational outcomes (Rhoades & Eisenberger, 2002).
Organizational support for wellness can play a key role in supporting and encouraging active
employee engagement with wellness programs. Even with support, however, individuals
experience a variety of potential individual, environmental, and organizational barriers (as
already highlighted) that can limit program use and program effectiveness, effective wellness
programs should address and reduce these barriers in order to increase program use (Shain &
Kramer, 2004).
14
While perceived support is important for positive perceptions of organizational wellness,
employee involvement can supplement support and lead to healthier workplace attitudes and
stronger performance outcomes (Tesluk et al., 1999). By extension, participative wellness
program design with active employee involvement in program offerings and decisions should
have an impact on employee perceptions and attitudes towards wellness activities in the
workplace. However, the positive benefits of participative design could be strengthened or
weakened by personal and environmental barriers described above. Strong organizational
support for wellness would only increase the importance of participation. Personal and
environmental barriers, however, could limit an individual’s ability to enjoy the benefits of
participative design. The study proposes the following hypotheses around perceptions of
organizational wellness.
Hypothesis 2a: A positive relationship exists between perceived organizational support
for wellness and employee wellness program effectiveness.
Hypothesis 2b: The relationship between perceived organizational support for wellness
and program effectiveness is mediated by barriers to participation.
Hypothesis 2c: The relationship between perceived organizational support for wellness
and program effectiveness is mediated by participative wellness program design.
In addition to organizational factors, individuals must be invested in their own health and
have a strong positive sense of self to improve or maintain their own wellness. Relevant
individual personality characteristics and individual demographic variables can act as key
predictors for wellness behaviors and cognitions. High self-esteem has been linked with a higher
overall perceived value of health (Abood & Conway, 1992) while self-efficacy has been
positively linked to motivation and learning (Colquitt et al., 2000). Neuroticism has been shown

15
to negatively correlate with health behavior self-efficacy and health-relevant cognitions
(Williams et al., 2004). The personality of trait of core self-evaluation integrates self-esteem,
self-efficacy, emotional stability, and internal locus of control (Judge & Kammeyer-Mueller,
2011). Some preliminary research supports a linkage between core self-evaluation and wellness
program outcomes (Clancy, 2012). Because of these findings, there should be a significant and
positive relationship between employees’ core self-evaluations with wellness program use.
Strong barriers could limit an individual’s ability to behave in accordance with his or her core
self-evaluation.
Hypothesis 3a: A positive relationship exists between an individual’s core self-evaluation
and wellness program effectiveness.
Hypothesis 3b: The relationship between an individual’s core self-evaluation and
program effectiveness is mediated by barriers to participation.
Hypothesis 3c: The relationship between an individual’s core self-evaluation and
program effectiveness is mediated by participation in wellness program design.
Finally, because personal motivation is essential for wellness program engagement (Bhui
et al., 2012; Bungum et al., 1997), an individual’s personal motivation should also play a role in
the relationship between wellness program perceptions and program effectiveness.
Hypothesis 4a: A positive relationship exists between an individual’s motivation and
interest for wellness programs and program effectiveness.
Hypothesis 4b: The relationship between an individual’s motivation and interest for
wellness programs and program effectiveness mediated by barriers to participation.

16
Hypothesis 4c: The relationship between an individual’s motivation and interest for
wellness programs and program effectiveness is mediated by is mediated by participation
in wellness program design.
Individual demographic and personality covariates. To provide a more realistic test
of the proposed model, a variety of personal demographic characteristics also are likely to
influence health-related decision making and behaviors. Demographic factors like education,
income, sex, and marital status have all been linked to health-related behaviors (Person et al.,
2010; Sorensen et al., 1990). However, the lack of clear linkages between individual
demographics and program use outcomes (Robroek et al., 2009) requires further exploration. A
comprehensive demographic assessment that includes relevant job information number (hours
worked per week, job title, department, salary, etc.) in the context of wellness program
effectiveness can provide a stronger picture of the factors that impact employee engagement with
wellness offerings. Added to the preceding list of demographic characteristics, a person’s health
locus of control has been shown to influence program use, particularly among individuals who
believe their health is based on chance or fate (Grotz et al., 2011). These findings suggest that
there is a significant negative relationship between chance health locus of control and wellness
program use and satisfaction.
17
Figure 1. Theoretical model guiding the present study.
Satisfaction
Figure 1 Theoretical model guiding the present study

18
CHAPTER II
METHOD
The present study utilized a mixed method approach to data collection. This
integrative research approach combines qualitative and quantitative data collection and
data analysis within a single study (Johnson & Onwuegbuzie, 2012). The mixed methods
research paradigm represents a “third methodological movement” in the social sciences,
extending beyond the traditional paradigms of quantitative- or qualitative-only
methodology. The mixed method paradigm has been likened to the phoenix emerging
from the ashes of previous paradigms of science in order to blaze a new trail for potent
organizational research (Cameron, 2011, p. 100). By combining these two streams of
research methodology, researchers can address complex workplace behavior while
maximizing the strengths and limiting the weaknesses of either quantitative or qualitative
mono-method designs(Sale, Lohfeld, & Brazil, 2002).
Participants
Participants were recruited broadly from many organizations representing a variety of
industries (healthcare, manufacturing, government, non-profit) across a range of geographic
locations. The recruitment strategy was two-fold. Social media groups (LinkedIn) associated
with organizational health and wellness were a primary source of participants. The researcher
posted listings on these various groups’ discussion boards and communicated directly with
19
coordinators regarding interest in participation. The other strategy involved contacting various
Wellness Councils across the United States. All interested participants were provided with a
brief description of the study and what would be required from participants.
Participants included coordinators for organizational wellness programs and employees
of the organizations. Twelve organizations were involved during the recruitment phase.
Employees and coordinators from three of these organizations participated in the actual data
collection. In addition, participants without specific organizational affiliation were recruited
through social media outlets (Facebook and LinkedIn). These participants included both general
employees and wellness program coordinators. A total of 218 employees completed the general
survey, while 19 wellness coordinators completed the coordinator survey. Employee
demographics are summarized in Appendix A.
Materials
Two different surveys were distributed, one to the wellness program coordinators and
another to the employees within the coordinator’s organization. The following measures were
contained in the employee survey, while the coordinator survey is described at the end of this
section. Items from the various psychological measures discussed below can be found in
Appendix B.
Demographics. Participants were asked to report age, sex, job title, job position
(hourly/salary, supervisor/non-supervisor), number of hours worked per week, annual household
income (as indicator of socioeconomic status), race/ethnicity, marriage status, and total number
of dependents. A full demographic summary is available in Appendix A

20
Perceived organizational right and responsibility to promote wellness. Participants
rated their level of agreement with two statements regarding the organization’s right and
responsibility to promote wellness among its employees. Responses were on a seven-point
Likert scale (1 = strongly disagree, 7 = strongly agree), with higher scores reflecting stronger
agreement with each statement. The first statement was “An employer has the right to promote
the health and wellness of its workers.” The second statement was “An employer has the
responsibility to promote the health and wellness of its workforce?”
Wellness program offerings. Both the employee survey and the program coordinator
survey contained a list of common wellness program offerings (e.g., fitness, stress reduction,
etc.). The complete listing of program offerings included in this research is provided in
Appendix C. This list was generated based on common programs according to wellness program
coordinators and various councils for organizational wellness. Participants completed a series of
measures related to each possible wellness program offering.
Wellness offering availability. Participants identified current offerings provided by their
organization with an answer of No or Yes in response to current availability through their
organizational wellness program.
Wellness offering interest. Participants identified interest in the various possible
wellness program offerings using a seven-point scale of interest (1 = not interested, 7 =
extremely interested). A mean of interest across all available programs was taken for use in
analysis.

21
Wellness offering motivation. Assuming it was offered in their organization, participants
stated their perceived level of motivation to participate in each wellness offering using a seven-
point scale of motivation (1 = not at all motivated, 7 = extremely motivated). A mean of
motivation across all available programs was taken for use in analysis.
Wellness offering use. Participants identified current use of their organizational wellness
program by indicating the approximate number of days in a given month that they use available
wellness offerings. Days of use were divided into clusters of three on the employee survey (i.e.,
1 = 0-3 days, 2 = 4-6 days, etc.). A mean of approximate days of use was calculated across all
available programs for use in analysis.
Wellness offering satisfaction. Participants rated their level of satisfaction with current
wellness offerings using a 7-point scale of satisfaction (1 = not at all satisfied, 7 = extremely
satisfied). Means satisfaction levels for available and used programs were taken for use in the
analysis.
Overall program effectiveness. Program effectiveness was assessed by examining both
program satisfaction and program use. Both of these measures are indicators of effective
wellness program design.
Desire for inclusion in program design and perceived say in design. Employees were
assessed on their desire to be included in the designing of organizational wellness programming.
Employees also rated their level of agreement with the statements “I have a desire to be included
22
in the design of my organization’s wellness program” and “I feel like I have a say in the design
of my organization's wellness program.” Participants responded on a seven-point Likert scale of
agreement (1 = strongly disagree, 7 = strongly agree).
These items were used to calculate an Index of Participative Wellness Design (IPWD).
The IPWD score is an indicator of the level of participation that an employee perceives in the
development and design of an organization’s wellness program. The IPWD is calculated using
the employee’s agreement on the “say in the design” item minus the reverse of the “desire to be
included” item. A high positive IPWD, therefore, indicates that an employee has both a desire to
be included in wellness program design and perceives that he or she has a say in this design. A
high negative IPWD suggests that an employee experiences little desire for inclusion and feels
like he or she has little say in wellness program design. Low negative or positive IPWD scores,
as well as scores of zero, indicate either moderate scores for both say and desire or a high score
for one question and a low score for the other.
Perceived organizational support of wellness. Perceived organizational support (POS)
of wellness programming was assessed using a modified version of existing POS items
(Eisenberger, Cummings, Armeli, & Lynch, 1997; Eisenberger et al., 1986) that were tailored to
address wellness programming perceptions. The wording of existing measures has been changed
to specifically address employee perceptions of organizational support of health and wellness.
The resulting 13-item scale has been labeled the Perceived Organizational Support of Wellness
scale (POS-W). Participants completed the measure using a seven-point Likert scale (1 =
strongly disagree, 7 = strongly agree) based on agreement with each individual item.
23
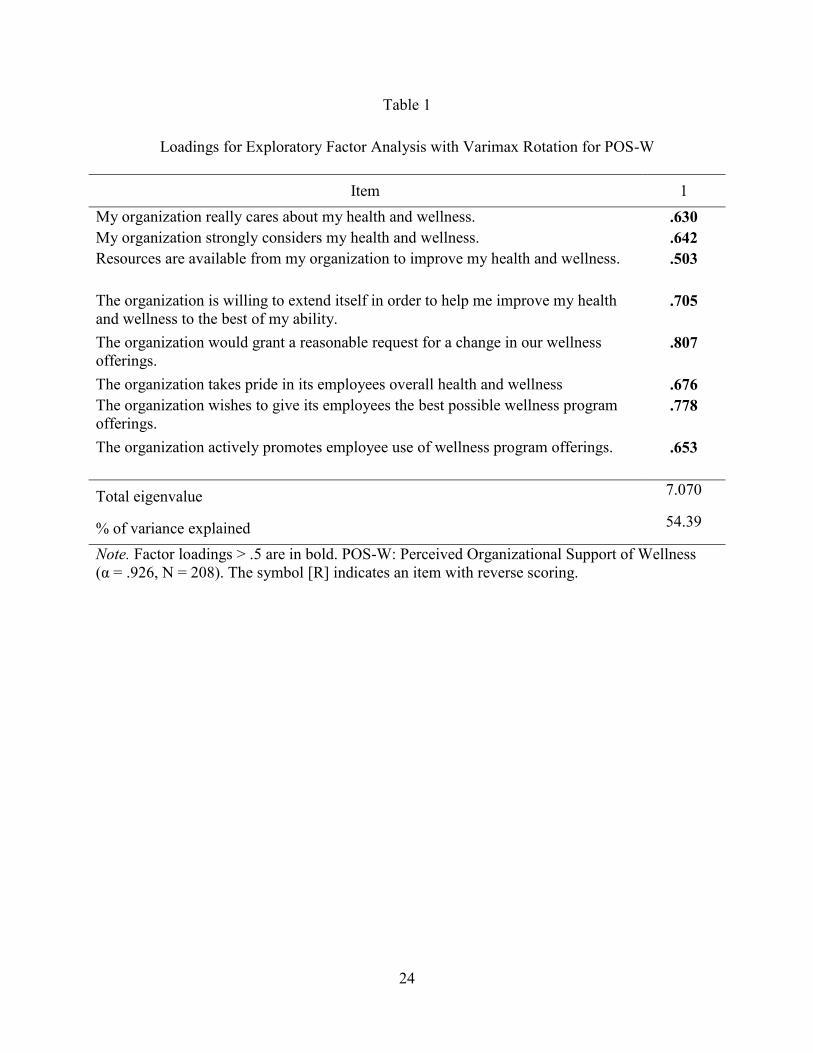
A factor analysis revealed that the five negatively scored items in the scale were not
fitting well with the other items in this measure (Table 1). These items were removed, leaving
an eight-item scale of positively scored items. The mean score of participants across all
remaining items was calculated for use in the analytic process. The final POS-W scale displayed
strong reliability (α = .914).
24
Table 1
Loadings for Exploratory Factor Analysis with Varimax Rotation for POS-W
Item 1
My organization really cares about my health and wellness. .630
My organization strongly considers my health and wellness. .642
Resources are available from my organization to improve my health and wellness. .503
The organization is willing to extend itself in order to help me improve my health
and wellness to the best of my ability. .705
The organization would grant a reasonable request for a change in our wellness
offerings. .807
The organization takes pride in its employees overall health and wellness .676
The organization wishes to give its employees the best possible wellness program
offerings. .778
The organization actively promotes employee use of wellness program offerings. .653
Total eigenvalue 7.070
% of variance explained 54.39
Note. Factor loadings > .5 are in bold. POS-W: Perceived Organizational Support of Wellness
(α = .926, N = 208). The symbol [R] indicates an item with reverse scoring.
25
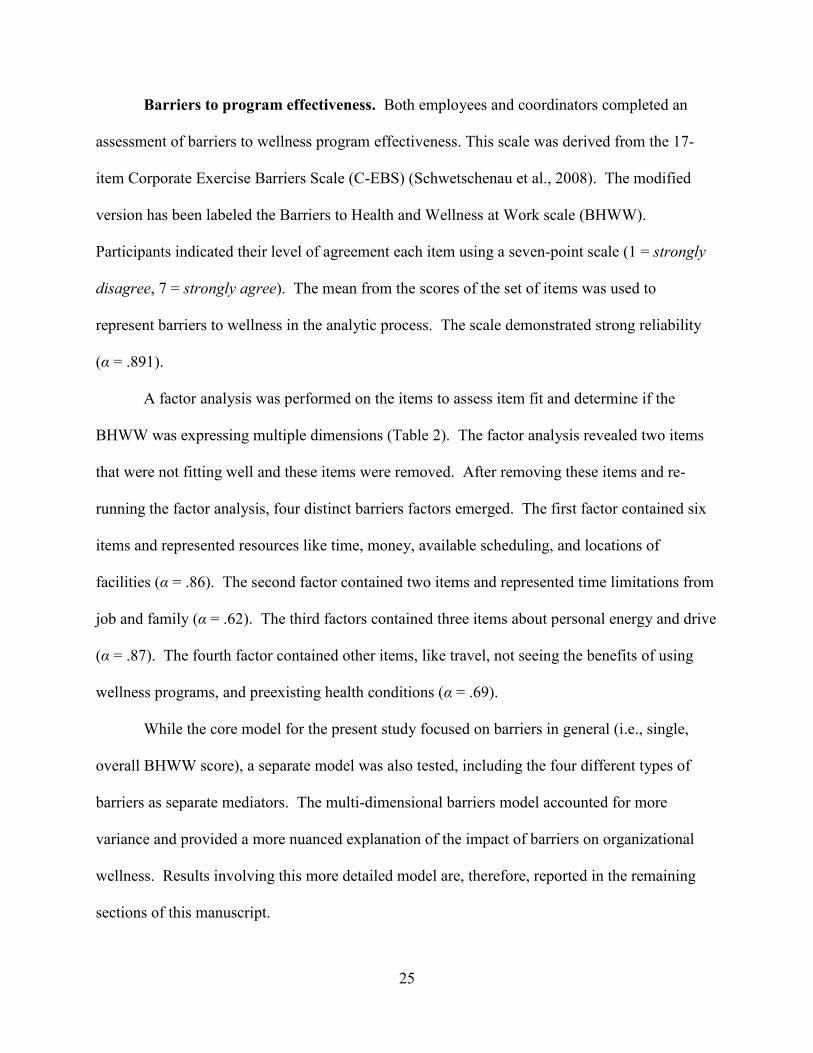
Barriers to program effectiveness. Both employees and coordinators completed an
assessment of barriers to wellness program effectiveness. This scale was derived from the 17-
item Corporate Exercise Barriers Scale (C-EBS) (Schwetschenau et al., 2008). The modified
version has been labeled the Barriers to Health and Wellness at Work scale (BHWW).
Participants indicated their level of agreement each item using a seven-point scale (1 = strongly
disagree, 7 = strongly agree). The mean from the scores of the set of items was used to
represent barriers to wellness in the analytic process. The scale demonstrated strong reliability
(α = .891).
A factor analysis was performed on the items to assess item fit and determine if the
BHWW was expressing multiple dimensions (Table 2). The factor analysis revealed two items
that were not fitting well and these items were removed. After removing these items and re-
running the factor analysis, four distinct barriers factors emerged. The first factor contained six
items and represented resources like time, money, available scheduling, and locations of
facilities (α = .86). The second factor contained two items and represented time limitations from
job and family (α = .62). The third factors contained three items about personal energy and drive
(α = .87). The fourth factor contained other items, like travel, not seeing the benefits of using
wellness programs, and preexisting health conditions (α = .69).
While the core model for the present study focused on barriers in general (i.e., single,
overall BHWW score), a separate model was also tested, including the four different types of
barriers as separate mediators. The multi-dimensional barriers model accounted for more
variance and provided a more nuanced explanation of the impact of barriers on organizational
wellness. Results involving this more detailed model are, therefore, reported in the remaining
sections of this manuscript.

26
Table 2
Factor Loadings for Exploratory Factor Analysis for BHWW
Item
Factor
resources energy other time
I do not have time due to my job demands. .285 .275 -.077 .781
I do not have time due to family. -.098 .312 .216 .714
I am too stressed. .330 .752 .006 .205
I am too tired. .135 .871 .003 .214
I do not feel motivated enough. .089 .818 .108 .196
I do not want to improve my health or wellness. .051 .143 .793 .017
I do not see the benefits of these programs. .421 .058 .644 .093
I have a health condition that prevents me from
participating in these programs.
.210 .405 .608 -.281
Regular travel prevents me from using these
programs.
.304 -.122 .719 .239
It costs too much money to participate in these
programs. .571 .269 .333 -.139
The physical facilities in which these programs are
held are poor. .741 -.018 .143 .100
These programs are offered at inconvenient times. .640 .356 .061 .286
I don’t know how to participate in these programs. .713 .277 .303 -.055
I am not happy with the quality of current program
offerings. .823 .025 .197 -.009
The locations for these programs are inconvenient. .805 .199 .063 .112
% of variance explained 22.946 19.183 15.263 9.515
27
Core self-evaluation. The core self-evaluation scale (CSES, Judge & Kammeyer-
Mueller, 2011) integrates personality constructs of self-esteem, self-efficacy, emotional stability,
and internal locus of control into a single personality assessment. The scale contains 12 items
that use a seven-point Likert scale (1 = strongly disagree, 7 = strongly agree) to assess
agreement with the items presented. The mean score across the items was used for analysis. The
CSES expressed strong reliability among the participants (α = .87).
Health locus of control. The construct of health locus of control (HLOC) was assessed
using the multidimensional health locus of control measure (Wallston, Wallston, & DeVellis,
1978). Specifically, both chance health locus of control (HLOC-C) and internal locus of control
(HLOC-I) dimensions were measured as high HLOC-C and low HLOC-C have previously been
shown to relate to health behaviors (Wallston, 1997). Participants responded to these items using
a seven-point Likert scale (1 = strongly disagree, 7 = strongly agree) based on agreement with
each individual item. Means of scores for both the chance and internal scales were computed for
use in analysis. The HLOC-C showed good reliability (α = .78), as did the HLOC-I (α = .79).
Coordinator survey. The coordinator survey was completed by individuals who self-
identified as responsible for the implementation of wellness programs in an organizational
context. To broadly assess program use, the coordinator survey asked wellness program
coordinators “what percentage of your workforce is enrolled in your wellness program in some
capacity?” and “what percentage of those enrolled actively participate in your wellness program
in some form or another?” The survey then drew from the same list of program offerings
contained in the employee survey. Coordinators were asked to assess current program
28
availability and perceived employee interest in these programs. They were then asked if
“employees at your organization are open to participating in your wellness programs?” and if
“Your employees care about their health and wellness?” Both of these questions were completed
using a 7-point Likert scale (1 = strongly disagree, 7 = strongly agree).
The coordinator survey also contained the BHWW as well as a series of open-ended
qualitative questions. Specific questions included “Are there any other factors that you feel limit
employee use of your organization's wellness program?”, “What are the biggest challenges you
experience as a wellness coordinator in making your programs a success?”, “What are your most
successful programs and why?”, “What are your least successful programs and why?”, and “Do
you have any other thoughts on organizational wellness programs that you would like to add?”
Responses to open-ended questions on the coordinator survey are summarized in Appendix D
Procedure
All procedures were first approved by the university’s Institutional Review Board. Both
employee and program coordinator surveys were distributed in internet form via
SurveyMonkey.com. The employee survey took about 20 minutes to complete. The coordinator
survey took approximately 10 minutes to complete. The wellness program coordinators
distributed the employee surveys internally through emails constructed by the researchers that
described the study and contained webpage links for access. Coordinators managed the
distribution of follow-up emails also composed by the researchers in an effort to increase overall
participation per company. Participants were given the chance to enter into a drawing for
Amazon.com gift codes in exchange for their participation.

29
CHAPTER III
RESULTS
The following sections describe the process of data cleaning and preparation, hypothesis
testing, and qualitative analysis of coordinator responses
Data Cleaning and Preparation
When data collection was closed, all responses were compiled into a working spreadsheet
for cleaning. Responses with missing data were handled in two ways. Participants missing a
significant portion of the survey and incomplete surveys were flagged for case-wise deletion.
Participants who completed the majority of the survey but skipped or missed a very small
number of responses (i.e., one or two per scale, seemingly at random) were flagged for missing
values. Missing values for Likert scale-type items were imputed with a neutral scale response,
imposing no assumptions about the nature of a participant’s missing response.
Data were also examined for skewness. While most of the distributions of responses did
not possess significant skewness, the responses for program were significantly skewed. These
results were not surprising due to the wording of the item (clusters of days, like 0-3 days of use)
and generally minimal use of the programs among the participants. To partially correct for this
skew and permit more standard statistical tests of the hypotheses, participants’ mean use of
programs score was transformed by taking its natural log. Additionally, after performing
bivariate correlation on all key study variables, both motivation and interest in programs revealed
30
nearly complete overlap (r = .97). This strong relationship indicated that participants either did
not understand the difference between motivation towards using a program and interest in the
program in general based on the wording of the items, or that the two factors are not particularly
distinct from each other as dimensions of perceptions of wellness programs. Because of this
relationship, these scores were averaged together and included as a single variable in the
subsequent analyses as motivation/interest toward wellness programs
Correlations and Descriptive Statistics
Means and standard deviations were calculated for each study variable involved in the
analysis. Bivariate correlations were also calculated for all study variables. A summary of these
descriptive statistics is presented in Table 3.
31
Variable M SD 1 2 3 4 5 6 7 8 9 10 11 12 13 14 15 16 17
1. Inclusion in design 4.802 1.649
2. Say in design 3.480 1.709 .32**
3. Org. right 5.907 1.312 .03 .02
4. Org. responsibility 4.426 1.907 .149* .08 .00
5. Program use 1.816 1.080 .10 .10 -.11 -.02
6. Program satisfaction 3.762 1.322 .15*
.28** .00 .10 .27
**
7. Motivation/Interest 3.620 1.080 .34** .13 .02 .18
* .31
** .36
**
8. IPWD 0.279 2.733 .81**
.82** .03 .14 .13 .26
** .29
**
9. POS-W 5.073 1.201 .17*
.47** .11 .04 .03 .41
** .06 .39**
10. BHWW 3.014 1.060 -.22**-.17* -.16
* .01 -.21** -.24
** -.09 -.24** -.42
**
11. CSES 5.148 0.980 .13 .12 .14 .07 -.06 .08 .10 .15*
.22**
-.40**
12. HLOC-I 5.219 0.996 .12 -.01 .04 .09 -.03 .15*
'.17* .07 .08 -.13 .30
**
13. HLOC-C 3.189 1.085 .00 -.04 -.03 -.08 -.07 -.05 -.10 -.02 -.11 .34**
-.53**
-.39**
14. BHWW: Time 4.099 1.624 -.12 .08 .05 -.04 -.27** -.11 -.16
* -.02 -.14 .54**
-.17*
-.16* .10
15. BHWW: Energy 3.941 1.739 -.19**
-.17* .03 -.01 -.152
* -.10 -.06 -.23**
-.27**
.73**
-.44** -.11 .36
**.49
**
16. BHWW: Other 2.259 1.167 -.29** -.13 -.22
** .00 -.10 -.17*
-.17*
-.26**
-.26**
.79**
-.31** -.13 .26
**.25
**.42
**
17. BHWW: Resources 2.957 1.406 -.06 -.18*
-.21** .04 -.16
*-.27
** .06 -.15*
-.49**
.85**
-.26** -.04 .24
**.28
**.42
**.59
**
Note. IPWD: Index of Participative Wellness Design; POS-W: Perceived Organizational Support - Wellness; BHWW: Barriers to Health and Wellness at
Work; CSES: Core Self-evaluation Scale; HLOC-I: Health Locus of Control - Internal; HLOC-C: Health Locus of Control - Chance. * = p < .05; ** = p
< .01.
Table 3
Descriptive Statistics and Correlations for Key Study Variables
32
Tests of Hypotheses
The study model was tested using a multiple mediation procedure (MEDIATE; Hayes &
Preacher, 2012) with bias-corrected bootstrapping to assess both direct and indirect effects of the
key study variables (Preacher & Hayes, 2008). This procedure uses a non-parametric analysis of
10,000 bootstrapping samples to statistically evaluate the hypothesized indirect effects using
bias-corrected 95% confidence intervals. The results of the analysis provide indicators of
specific indirect effects of each independent variable – mediator path along with the total indirect
effect of the set of independent variables and mediators on the dependent variable while allowing
for covariates to increase the strength of the model. This analytic process is a powerful tool for
discovering indirect effects under many conditions and is especially suited for organizational
research due to regularity of small sample sizes in quasi-experimental field research. The results
of the tests of indirect effects for the theoretical model of the present study are presented in Table
4. The full model results including beta weights and significance values per variable are reported
in Table 5. A detailed model with representative beta weights taking into account the multiple
mediation model is displayed in Figure 2.

33
Table 4
Results of Tests of Indirect Effects and Summaries of Multiple Mediation Models
Model Point
estimate SE Lower Upper
Program Use
Org. Support - Participative Design - Use -0.0006 0.0118 -0.0263 0.0215
Core self-evaluation - Participative Design - Use -0.0002 0.0046 -0.0117 0.0081
Motivation/Interest - Participative Design - Use -0.0005 0.0098 -0.0209 0.0193
TOTAL -0.0002 0.0031 -0.0069 0.0058
Org. Support - Barriers- Use 0.0335 0.0122 0.0133 0.0624
Core self-evaluation - Barriers - Use 0.0275 0.0172 0.0039 0.0728
Motivation/Interest - Barriers - Use 0.0066 0.0097 -0.0079 0.0319
TOTAL -0.0189 0.0093 -0.043 -0.0059
Program Satisfaction
Org. Support - Participative Design - Satisfaction 0.0302 0.0429 -0.0552 0.1135
Core self-evaluation - Participative Design - Satisfaction 0.0101 0.0201 -0.0135 0.0802
Motivation/Interest - Participative Design - Satisfaction 0.0186 0.0277 -0.0293 0.0857
TOTAL 0.0072 0.0104 -0.0129 0.0295
Org. Support - Barriers - Satisfaction 0.0308 0.0389 -0.0431 0.1128
Core self-evaluation - Barriers - Satisfaction 0.0177 0.0297 -0.0169 0.1114
Motivation/Interest - Barriers - Satisfaction 0.0135 0.021 -0.0118 0.0796
TOTAL 0.013 0.0163 -0.01 0.0579
Note. The above mediations were performed using a multiple mediation model for SPSS
designed by Preacher and Hayes (2008) with a bias-corrected bootstrapping procedure of 10,000
samples.
34
Table 5
Full Models of Dependent Variables, Independent Variables, and Covariates
Model
Program Use β SE t p
Constant 1.1891 .5284 2.2505 .0259
Index of Participative Wellness Design (IPWD) -.0007 .0126 -.0583 .9536
Barriers to Health and Wellness at Work (BHWW) -.1184 .0355 -3.3306 .0011
Perceived Organizational Support of Wellness (POS-W) .0222 .0296 .7485 .4554
Core Self-Evaluation (CSES) -.0810 .0396 -2.0457 .0426
Motivation/Interest towards Wellness .1499 .0312 4.7971 .0000
Age -.0004 .0032 -.1335 .8940
Total Weekly Work Hours .0016 .0044 .3635 .7168
Biological Sex -.0832 .0699 -1.1907 .2357
Hourly/Salary Employment .0132 .0722 .1827 .8553
Supervisor/Non-supervisor -.0321 .0704 -.4561 .3886
Annual Household Income -.0083 .0181 -.4573 .6481
Marital Status -.0431 .0744 -.5793 .5633
Number of Dependents .0248 .0289 .8581 .3922
Health Locus of Control - Internal (HLOC-I) -.0533 .0332 -1.6048 .1107
Health Locus of Control - Chance (HLOC-C) -.0281 .0342 -.8212 .4129
R2 Adj R
2 F (df1, df2) p
Model Summary .2707 .1968 3.6630(15, 148) .0000
Program Satisfaction β SE t p
Constant -1.9193 1.6186 -1.1858 .2379
Index of Participative Wellness Design (IPWD) .0311 .0399 .7797 .4370
Barriers to Health and Wellness at Work (BHWW) -.1146 .1142 -1.0033 .3176
Perceived Organizational Support of Wellness (POS-W) .3484 .0978 3.5609 .0005
Core Self-Evaluation (CSES) -.0968 .1220 -.7935 .4290
Motivation/Interest towards Wellness .4744 .0998 4.7514 .0000
Age -.0253 .0098 -2.5882 .0108
Total Weekly Work Hours .0460 .0137 3.3646 .0010
Biological Sex .0670 .2242 .2986 .7657
Hourly/Salary Employment .1650 .2186 .7547 .4518
Supervisor/Non-supervisor .2771 .2197 1.2615 .2094
Annual Household Income .0086 .0605 .1414 .8878
Marital Status .1211 .2408 .5030 .6158
Number of Dependents .0523 .0889 .5883 .5574
Health Locus of Control - Internal (HLOC-I) .0932 .1090 .8548 .3943
Health Locus of Control - Chance (HLOC-C) .1337 .1078 1.2402 .2171
R2 Adj R
2 F (df1, df2) p
Model Summary .3765 .3040 5.1929 (15, 148) .0000
Note. The above mediations were performed using a multiple mediation model for SPSS designed by
Preacher and Hayes (2008) with a bootstrapping procedure of 10,000 samples.

35
Figure 2. Multiple mediation model with representative beta weights (* = p < .05, ** = p < .01, *** = p < .001)
36
Hypothesis 1 considered the relationship between employee perceptions that an
organization has the right and responsibility to promote employee health and wellness and
employee interest in participating in wellness programs. This hypothesis was tested by
examining the relationship between right and responsibility perceptions and the Index of
Participative Wellness Design factor (IPWD). Right and responsibility were not significantly
related to IPWD. As this element of the study was primarily exploratory, a paired-samples t-test
was performed to determine if there was a significant difference in employee perceptions of
organizational right and responsibility. The two perceptions were not correlated and there was a
significant difference between the two items (t = 8.39, p < .05), with employees perceiving that
an organization has the right to promote wellness (M = 5.91, SD = 1.31) to a greater degree than
the responsibility to do so (M = 4.47, SD = 1.90).
The second set of hypotheses tested the effect of perceived organizational support of
wellness (POS-W) on program effectiveness. Hypothesis 2a was partially supported by the
significant correlation between POS-W and satisfaction (r = .41, p < .05) but there was not a
significant relationship between POS-W and use (r = .03, p > .05). However, POS-W had a
direct effect on both program use (β = .0550, p < .05) and program satisfaction (β = .4094, p <
.05) in the full model. Mediation analyses revealed significant findings for the indirect effect
tests of POS-W. Hypothesis 2b was partially supported as the indirect effect of POS-W on
program use was fully mediated by barriers to use (β = .0222, p > .05) while there was no
indirect effect on satisfaction. Hypothesis 2c was not supported as there was no meditation
present through participative wellness. While POS-W did have a significant direct effect on
participative design for both satisfaction and use, no significant indirect effect was present.
37
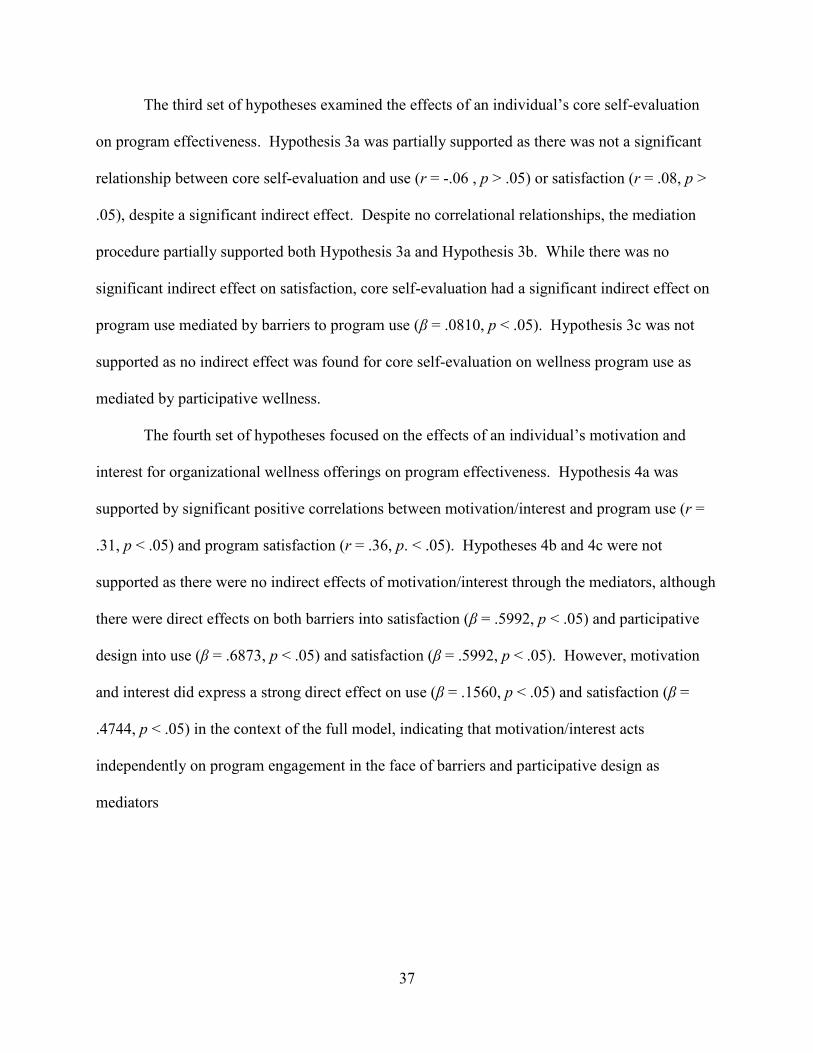
The third set of hypotheses examined the effects of an individual’s core self-evaluation
on program effectiveness. Hypothesis 3a was partially supported as there was not a significant
relationship between core self-evaluation and use (r = -.06 , p > .05) or satisfaction (r = .08, p >
.05), despite a significant indirect effect. Despite no correlational relationships, the mediation
procedure partially supported both Hypothesis 3a and Hypothesis 3b. While there was no
significant indirect effect on satisfaction, core self-evaluation had a significant indirect effect on
program use mediated by barriers to program use (β = .0810, p < .05). Hypothesis 3c was not
supported as no indirect effect was found for core self-evaluation on wellness program use as
mediated by participative wellness.
The fourth set of hypotheses focused on the effects of an individual’s motivation and
interest for organizational wellness offerings on program effectiveness. Hypothesis 4a was
supported by significant positive correlations between motivation/interest and program use (r =
.31, p < .05) and program satisfaction (r = .36, p. < .05). Hypotheses 4b and 4c were not
supported as there were no indirect effects of motivation/interest through the mediators, although
there were direct effects on both barriers into satisfaction (β = .5992, p < .05) and participative
design into use (β = .6873, p < .05) and satisfaction (β = .5992, p < .05). However, motivation
and interest did express a strong direct effect on use (β = .1560, p < .05) and satisfaction (β =
.4744, p < .05) in the context of the full model, indicating that motivation/interest acts
independently on program engagement in the face of barriers and participative design as
mediators
38
Coordinator Survey Qualitative Analysis
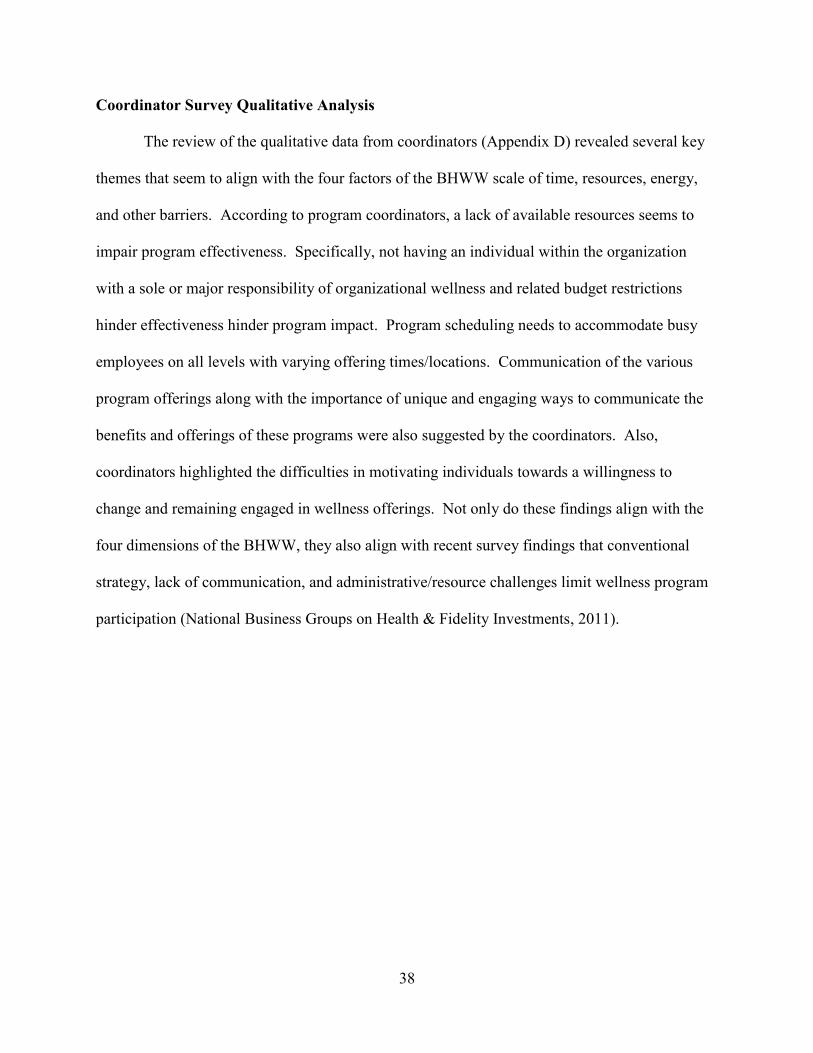
The review of the qualitative data from coordinators (Appendix D) revealed several key
themes that seem to align with the four factors of the BHWW scale of time, resources, energy,
and other barriers. According to program coordinators, a lack of available resources seems to
impair program effectiveness. Specifically, not having an individual within the organization
with a sole or major responsibility of organizational wellness and related budget restrictions
hinder effectiveness hinder program impact. Program scheduling needs to accommodate busy
employees on all levels with varying offering times/locations. Communication of the various
program offerings along with the importance of unique and engaging ways to communicate the
benefits and offerings of these programs were also suggested by the coordinators. Also,
coordinators highlighted the difficulties in motivating individuals towards a willingness to
change and remaining engaged in wellness offerings. Not only do these findings align with the
four dimensions of the BHWW, they also align with recent survey findings that conventional
strategy, lack of communication, and administrative/resource challenges limit wellness program
participation (National Business Groups on Health & Fidelity Investments, 2011).

39
CHAPTER IV
DISCUSSION
The main goal of this study was to assess a variety of factors that can impact the
effectiveness of organizational wellness programs. As effective wellness programs can lead to
positive results like improved employee health and well-being (Anshel et al., 2010; McLeroy et
al., 1988; Merrill, Aldana, Vyhlidal, et al., 2011) and stronger organizational outcomes (Aldana
et al., 2005; Cancelliere et al., 2011; Claxton et al., 2011; Parks & Steelman, 2008; Soler et al.,
2010), organizations should seek to understand the psychological processes involved in
promoting employee wellness.
Previous research suggests that organizational factors like support and participative
design can improve program effectiveness (Harden et al., 1999; Tesluk et al., 1999), leading to
higher usage rates and satisfaction with the program among employees and a stronger ROI for
the organization. An individual’s level of motivation towards wellness is also a key determinant
of how engaged an employee will be with any organizational wellness program (Bhui et al.,
2012; Bungum et al., 1997). Even if strong organizational support and motivated employees are
in place, wellness programs are still subject to barriers at the personal, environmental, or
organizational level can limit their effectiveness (Robroek et al., 2009; Shain & Kramer, 2004).
40
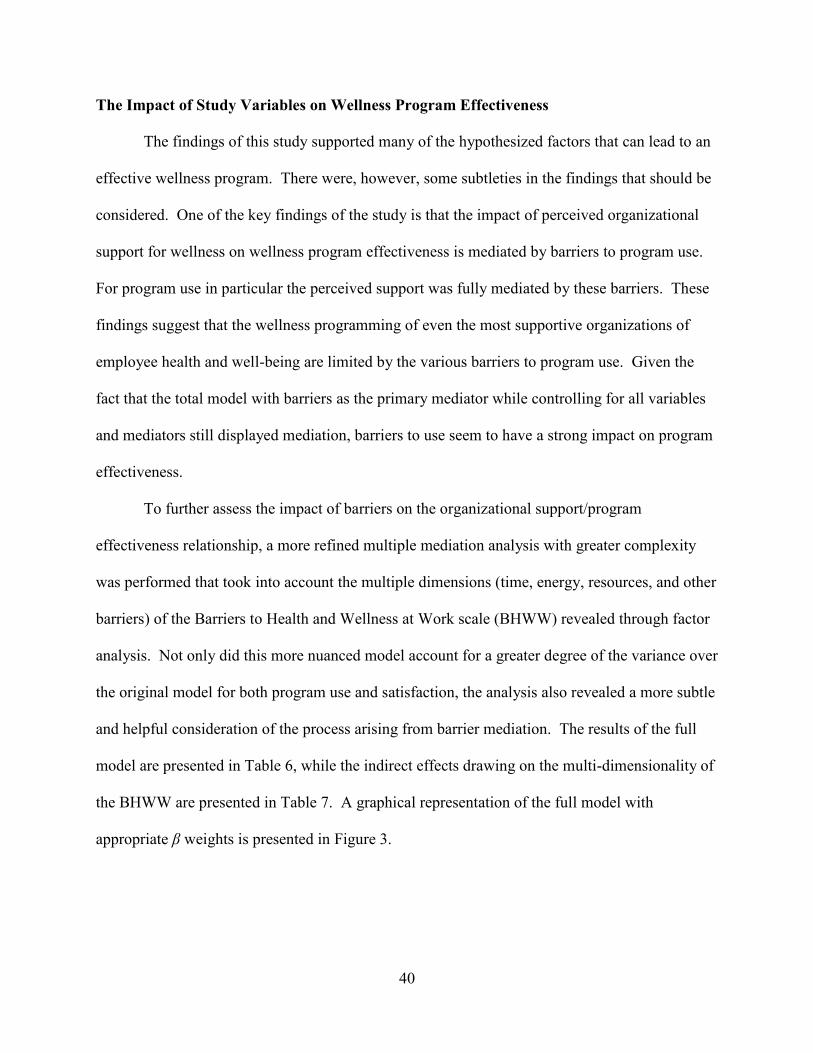
The Impact of Study Variables on Wellness Program Effectiveness
The findings of this study supported many of the hypothesized factors that can lead to an
effective wellness program. There were, however, some subtleties in the findings that should be
considered. One of the key findings of the study is that the impact of perceived organizational
support for wellness on wellness program effectiveness is mediated by barriers to program use.
For program use in particular the perceived support was fully mediated by these barriers. These
findings suggest that the wellness programming of even the most supportive organizations of
employee health and well-being are limited by the various barriers to program use. Given the
fact that the total model with barriers as the primary mediator while controlling for all variables
and mediators still displayed mediation, barriers to use seem to have a strong impact on program
effectiveness.
To further assess the impact of barriers on the organizational support/program
effectiveness relationship, a more refined multiple mediation analysis with greater complexity
was performed that took into account the multiple dimensions (time, energy, resources, and other
barriers) of the Barriers to Health and Wellness at Work scale (BHWW) revealed through factor
analysis. Not only did this more nuanced model account for a greater degree of the variance over
the original model for both program use and satisfaction, the analysis also revealed a more subtle
and helpful consideration of the process arising from barrier mediation. The results of the full
model are presented in Table 6, while the indirect effects drawing on the multi-dimensionality of
the BHWW are presented in Table 7. A graphical representation of the full model with
appropriate β weights is presented in Figure 3.

41
Table 6
Full Models including Dependent Variables, Independent Variables, and Covariates with Multi-
dimensional BHWW
Model β SE t p
Program Use
Constant 1.3971 .5253 2.6598 .0087
Perceived Organizational Support of Wellness
(POS-W) .0047 .0303 .1546 .8773
Core Self-Evaluation (CSES) -.0750 .0394 -1.9020 .0592
Motivation/Interest towards Wellness .1618 .0316 5.1179 .0000
Barriers to Health and Wellness at Work
(BHWW): Resources -.0919 .0305 -3.0150 .0030
Barriers to Health and Wellness at Work
(BHWW): Time -.0447 .0240 -1.8624 .0646
Barriers to Health and Wellness at Work
(BHWW): Energy -.0179 .0258 -.6940 .4888
Barriers to Health and Wellness at Work
(BHWW): Other .0588 .0359 1.6389 .1034
Index of Participative Wellness Design (IPWD) .0070 .0129 .5434 .5877
Health Locus of Control - Chance (HLOC-C) -.0371 .0348 -1.0646 .2888
Health Locus of Control - Internal (HLOC-I) -.0572 .0338 -1.6925 .0927
Age -.0028 .0033 -.8697 .3859
Total Weekly Work Hours .0008 .0043 .1803 .8572
Biological Sex -.0615 .0711 -.8647 .3886
Hourly/Salary Employment .0186 .0710 .2618 .7938
Supervisor/Non-supervisor -.0541 .0700 -.7723 .4412
Annual Household Income -.0031 .0183 -.1689 .8661
Marital Status -.0568 .0732 -.7759 .4391
Number of Dependents .0326 .0289 1.1306 .2601
R
2 Adj R
2 F (df1, df2) p
Model Summary .3127 .2273 3.6644 (18, 145) .0000
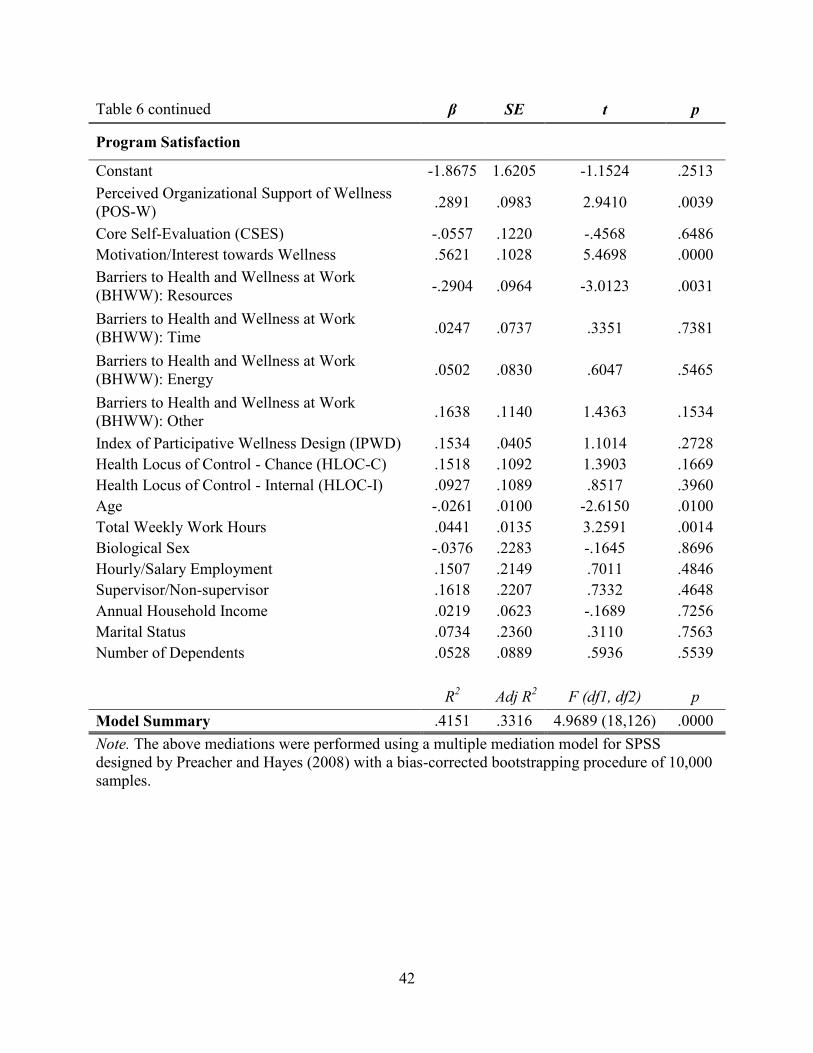
42
Table 6 continued β SE t p
Program Satisfaction
Constant -1.8675 1.6205 -1.1524 .2513
Perceived Organizational Support of Wellness
(POS-W) .2891 .0983 2.9410 .0039
Core Self-Evaluation (CSES) -.0557 .1220 -.4568 .6486
Motivation/Interest towards Wellness .5621 .1028 5.4698 .0000
Barriers to Health and Wellness at Work
(BHWW): Resources -.2904 .0964 -3.0123 .0031
Barriers to Health and Wellness at Work
(BHWW): Time .0247 .0737 .3351 .7381
Barriers to Health and Wellness at Work
(BHWW): Energy .0502 .0830 .6047 .5465
Barriers to Health and Wellness at Work
(BHWW): Other .1638 .1140 1.4363 .1534
Index of Participative Wellness Design (IPWD) .1534 .0405 1.1014 .2728
Health Locus of Control - Chance (HLOC-C) .1518 .1092 1.3903 .1669
Health Locus of Control - Internal (HLOC-I) .0927 .1089 .8517 .3960
Age -.0261 .0100 -2.6150 .0100
Total Weekly Work Hours .0441 .0135 3.2591 .0014
Biological Sex -.0376 .2283 -.1645 .8696
Hourly/Salary Employment .1507 .2149 .7011 .4846
Supervisor/Non-supervisor .1618 .2207 .7332 .4648
Annual Household Income .0219 .0623 -.1689 .7256
Marital Status .0734 .2360 .3110 .7563
Number of Dependents .0528 .0889 .5936 .5539
R
2 Adj R
2 F (df1, df2) p
Model Summary .4151 .3316 4.9689 (18,126) .0000
Note. The above mediations were performed using a multiple mediation model for SPSS
designed by Preacher and Hayes (2008) with a bias-corrected bootstrapping procedure of 10,000
samples.

43
Table 7
Results of Tests of Indirect Effects and Summaries of Multiple Mediation Models with
Multi-dimensional BHWW
Model Point
estimate SE Lower Upper
Program Use
Org. Support - Participative Design - Use 0.006 0.0123 -0.0181 0.0309
Core self-evaluation - Participative Design - Use 0.0015 0.0054 -0.0046 0.0204
Motivation/Interest - Participative Design - Use 0.0048 0.0104 -0.0134 0.0092
TOTAL 0.0015 0.0033 -0.0045 0.0092
Org. Support - Barriers: Resources - Use 0.0435 0.0163 0.0175 0.0831
Core self-evaluation - Barriers: Resources - Use 0.0122 0.0134 -0.0089 0.0449
Motivation/Interest - Barriers: Resources - Use -0.0099 0.0101 -0.0332 0.0074
TOTAL -0.0158 0.0077 -0.0364 -0.0051
Org. Support - Barriers: Time - Use 0.0053 0.0068 -0.0033 0.025
Core self-evaluation - Barriers: Time - Use 0.011 0.0115 -0.0031 0.0451
Core self-evaluation - Barriers: Time - Use 0.0062 0.0071 -0.0028 0.0275
TOTAL -0.0009 0.0021 -0.0054 0.0009
Org. Support - Barriers: Energy - Use 0.0048 0.0077 -0.0067 0.0252
Core self-evaluation - Barriers: Energy - Use 0.0089 0.0143 -0.0154 0.0436
Motivation/Interest - Barriers: Energy - Use 0.0436 0.0032 -0.0101 0.0034
TOTAL -0.0018 0.0032 -0.0101 0.0034
Org. Support - Barriers: Other - Use -0.0093 0.0077 -0.0325 0.0004
Core self-evaluation - Barriers: Other - Use -0.0122 0.0113 -0.0499 0.0006
Motivation/Interest - Barriers: Other - Use -0.0089 0.0078 -0.0335 0.0006
TOTAL 0.0042 0.0041 -0.0006 0.016
44
Table 7 continued
Program Satisfaction
Point
estimate SE Lower Upper
Org. Support - Participative Design - Satisfaction 0.0434 0.0428 -0.0374 0.1335
Core self-evaluation - Participative Design –
Satisfaction 0.0145 0.0222 -0.0111 0.0851
Motivation/Interest - Participative Design –
Satisfaction 0.0268 0.0281 -0.0168 0.0979
TOTAL 0.0103 0.0105 -0.0081 0.0346
Org. Support - Barriers: Resources - Satisfaction 0.1236 0.0548 0.0385 0.2577
Core self-evaluation - Barriers: Resources –
Satisfaction 0.0163 0.0426 -0.0622 0.1147
Motivation/Interest - Barriers: Resources –
Satisfaction -0.0283 0.0378 -0.1226 0.0319
TOTAL -0.0334 0.0205 -0.0861 -0.0067
Org. Support - Barriers: Time - Satisfaction -0.0038 0.0171 -0.0622 0.0178
Core self-evaluation - Barriers: Time - Satisfaction -0.0039 0.0211 -0.0842 0.0198
Core self-evaluation - Barriers: Time - Satisfaction -0.006 0.0218 -0.0696 0.026
TOTAL 0.0008 0.0055 -0.0068 0.0181
Org. Support - Barriers: Energy - Satisfaction -0.0126 0.0216 -0.0709 0.0209
Core self-evaluation - Barriers: Energy - Satisfaction -0.0227 0.0402 -0.1202 0.0456
Motivation/Interest - Barriers: Energy - Satisfaction -0.0126 0.0233 -0.0766 0.0208
TOTAL 0.0051 0.0102 -0.0109 0.0312
Org. Support - Barriers: Other - Satisfaction -0.0314 0.0358 -0.132 0.0157
Core self-evaluation - Barriers: Other - Satisfaction -0.0174 0.0318 -0.1376 0.0136
Motivation/Interest - Barriers: Other - Satisfaction -0.0355 0.0369 -0.1409 0.0162
TOTAL 0.013 0.0163 -0.01 0.0579
Note. The above mediations were performed using a multiple mediation model for SPSS
designed by Preacher and Hayes (2008) with a bias-corrected bootstrapping procedure of
10,000 samples.
45
Figure 3 Multi-dimensional BHWW multiple mediation model with representative beta weights (* = p < .05,
** = p < .01, *** = p < .001).
46
The key results of the simpler model are still in place in the multi-dimensional barriers
model. The key finding of this complex model revealed that the indirect effect of perceived
organizational support of wellness is now fully mediated by the resource-related barriers without
any mediation present in the other three barrier factors. The more refined model now expresses
the finding that resources also mediate the relationship between organizational support of
wellness and program satisfaction, a mediation that was not present in the original model.
Additionally, core self-evaluation no longer has an indirect effect on program use in this model,
indicating that the role of core self-evaluation in this process is somewhat limited. Interestingly,
core self-evaluation had a negative relationship to program effectiveness, suggesting that
individuals with high self-evaluations are less likely to use wellness programs. While counter-
intuitive, this finding makes sense in that individuals with high self-esteem might feel that they
do not need to engage in wellness behaviors because they feel comfortable with their current
level of health. These results present a more nuanced understanding of the relationship between
the study variables and program use/satisfaction and highlight a key barrier dimension mediating
the indirect effect of support on program effectiveness.
The other interesting discovery of this study was the relative independence of employee
motivation/interest for wellness programs as an independent predictor of program
use/satisfaction. Motivation/interest had the largest impact of any of the factors in both the
simple and the multi-dimensional model on program use and program satisfaction. These
findings resonate with one of the key insights of organizational science: employee motivation is
an essential element for any type of behavior change or continuation. Organizations can provide
an abundance of support for wellness, eliminate barriers by ensuring adequate resources, and
improve the communication and administration of wellness programs through employee
47
involvement and participative design. Despite these organization-level efforts at facilitating
wellness activities, if employees do not have an inherent drive to improve their own health, they
will most likely let the opportunity of organizationally-sponsored wellness offerings pass them
by.
Limitations
The most immediate limitation of this study is the sample size. While 12 organizations
had initially agreed to participate in this study, only 2 followed through with participation while
a third additional organization joined the study towards the end of the data collection stage. The
study was initially designed to accommodate a multi-level analysis, taking into account both
employee and wellness coordinator perceptions of programs to create a more robust image of the
impact of participative wellness. Future studies in this area should address this limitation by
drawing from a greater number of organizations to increase the overall number of participants
and open up the use of multi-level modeling.
This study was a preliminary one, with a strong exploratory component. Because of this,
some of the hypotheses/research questions may not be strongly linked with theory or previous
findings as is typically desired, particularly with regards to the right and responsibility of
organizations to promote employee wellness. The findings of this study should be bolstered by
stronger theory for future examination of wellness programs that focuses on some of the themes
that emerged from the analysis, including the effects of motivation and resources on wellness
program effectiveness.
Another potential limitation is associated with the self-report data collection method used
in this study. As the surveys were delivered entirely online through SurveyMonkey.com, the
48
study was inherently limited by the need for access to a computer and the internet as well as the
necessity of computer skills like accessing email, opening the survey in a web browser, and
completing it with minimal difficulties. This procedure limits the study’s reach to older
employees in particular as they are not as accustomed to using new technology on the whole.
This limitation is important to address as the aging population can experience tremendous benefit
from access to and the use of organizational wellness programs.
The procedure was also limited in its ability to draw strong conclusions about causality
because data was only collected at one point per participant. The cross-sectional nature of the
data collection provided a glimpse into employee perceptions at one given time, but ideally
longitudinal data should be collected over time to strengthen inferences about the causal chains
discussed in the study’s models.
Directions for Future Research
Future research should target the key study variables that had an impact on wellness
program effectiveness in a more direct fashion. While organizational support of wellness played
a key role in the design of this study, future research should consider the relationship of this
important factor to outcome variables with more detail. Future studies can examine the
relationship between perceived organizational support and other outcomes like improved
organizational commitment from individuals who value health and wellness. Organizational
wellness programs can act as a recruitment tool for individuals that value these types of benefits
and can serve to improve commitment to the organization and both employee and organizational
performance. Additionally, while the POS-W scale can act as a strong foundation for future
research, the lack of any clear multi-dimensionality of the scale could be a weakness. Future

49
research should consider adding additional items to the scale in an effort to create a multi-
dimensional assessment of perceived organizational support of wellness (i. e., peer,
supervisor/manager/organization level items).
The importance of barriers as a mediator for this study prompts a continued examination
of the impact of these barriers on organizational wellness outcomes as well as other outcomes
related to employee health and wellness. Each of three concrete dimensions of time, energy, and
resources could benefit from more in depth study of their unique impact on employee health
behaviors. The “other” factor should also be studied in greater depth to tease out more concrete
descriptors for this dimension, possibly through the addition of more items that seem to relate to
some of the elements described in this dimension or by rewording them to tie them in to the other
dimension more directly. Travel is specifically mentioned and this item could be reworked to
load more directly into the time dimension. A lack of seeing the benefits of wellness programs
could be attributed to either individual denial or a lack of effective communication of the
wellness programs, while not wanting to improve one’s health and wellness seems to clearly fall
towards the individual. This distinction could be clarified. Finally, while a previously existing
medical condition would certainly act as barrier, this item could be too specific and should be
generalized to address a variety of life conditions that would hinder an individual’s ability to
engage in health-related behaviors. As this scale was based on a previously existing scale that
focused exclusively on fitness (Schwetschenau et al., 2008), future research should sharpen the
effectiveness of the scale for targeting individual, environmental, and organizational barriers to
wellness.
Future study can also examine the role that motivation and interest in wellness programs
play in wellness program effectiveness and health-related outcomes. In this study motivation to

50
use wellness programs and interest in specific programs were strongly related, but this finding
could have been a result of how the survey was designed. Future research should consider
whether or not these two dimensions of employee engagement with wellness are truly this
strongly related with more detailed measures of program motivation and overall program
interest. While an employee might be strongly motivated towards wellness, if he or she is not
interested in what is being offered, then program effectiveness could suffer. Additionally,
because motivation/interest had the strongest impact on program effectiveness of all the study
variables, future research should examine the nature of health-related motivation in greater detail
to unpack some of the dimensions and subtleties of this process. A better understanding of
employee motivation towards wellness design will empower future program coordinators with a
greater understanding of what drives program engagement
Practical Implications
Effective organizational wellness program design can have a significant impact on the
health and well-being of employees and the organizations in which they work. As wellness
programs are on the rise and consume considerable human and monetary resources to implement
and support in a meaningful way, coordinators and managers of organizational wellness
programs should consider a variety factors when designing programs. Because of the importance
of perceived organizational support of wellness, the most effective wellness programs should
emerge from organizations that value their employee’s overall health and well-being. While
offering wellness programs expresses this sense of valuing employees, management should also
adopt a stance that the needs of employees are important and that their well-being comes before
the company bottom line. This approach will encourage program use as employees will

51
genuinely feel that the organization wants to help them improve their own health as opposed to
feeling like the programs are aimed at reducing insurance costs and long-term medical payments.
Additionally, wellness coordinators and management must target barriers to wellness as
part of their program design. Programs should be affordable and adaptable, meeting any income
level or schedule. They should also be located in convenient and well-maintained areas or
facilities. These small details in the execution of wellness programs extend beyond simply what
is offered into how it is offered to address some of the challenges employees face in engaging
wellness programs.
Lastly, motivating employees to use wellness programs, while essential for program
effectiveness, is a tremendous challenge. Langille et al. (2011) suggest individualized attention
for each employee as no two employees have the same thoughts, feelings, or emotions around
their own wellness and how it relates with their organization’s intention towards their health and
well-being. Generating motivation effectively in a one-on-one fashion would be extremely
resource intensive, however, so perhaps a balance can be struck between individualized attention
towards an employee’s attitudes about wellness and a more standardized approach that can be
generalized across a larger working population. One way to do this could be the use of some
type of adaptive software that quickly assesses where employees are generally in their
relationship to their own health and wellness. The system could then group employees with
other employees with similar attitudes and interests around health and wellness. As a “gym
buddy” can be a strong motivator for maintaining a fitness routine, perhaps some type of
voluntary grouping of employees around organizational wellness interests could balance a less
resource-intensive, systematized approach with the individualized approach of wellness buddies.
These grouping should also be supported by the wellness coordinator or manager to improve
52
dialogue and address concerns about wellness program design as they arise.
Conclusion
Organizational wellness programs are here to stay. They are quickly becoming an
important part of organizational strategy and can have a powerful impact on both employee well-
being and the organizational bottom line. As these programs demand considerable time and
money to do right, researchers and practitioners alike should continue to collaborate to consider
ways to make life at work a supportive and healthy endeavor that promotes and values the health
of all employees at all levels.
53
REFERENCES
Abood, D. A., & Conway, T. L. (1992). Health value and self-esteem as predictors of wellness
behavior. Health Values: The Journal of Health Behavior, Education & Promotion, 16(3),
20–26. Retrieved from
https://proxy.lib.utc.edu/login?url=http://search.ebscohost.com/login.aspx?direct=true&db=
psyh&AN=1992-40401-001&site=ehost-live
Aldana, S. G., Merrill, R. M., Price, K., Hardy, A., & Hager, R. (2001). Financial impact of
health promotion programs: A comprehensive review of the literature. American Journal of
Health Promotion, 15(5), 296–320. doi:10.4278/0890-1171-15.5.296
Aldana, S. G., Merrill, R. M., Price, K., Hardy, A., & Hager, R. (2005). Financial impact of a
comprehensive multisite workplace health promotion program. Preventive Medicine, 40(2),
131–7. doi:10.1016/j.ypmed.2004.05.008
Anshel, M. H., Brinthaupt, T. M., & Kang, M. (2010). The disconnected values model improves
mental well-being and fitness in an employee wellness program. Behavioral Medicine,
36(4), 113–22. doi:10.1080/08964289.2010.489080
Barney, C. E., & Elias, S. M. (2010). Flex-time as a moderator of the job stress-work motivation
relationship: A three nation investigation. Personnel Review, 39(4), 487–502.
doi:10.1108/00483481011045434
Bhui, K. S., Dinos, S., Stansfeld, S. a., & White, P. D. (2012). A synthesis of the evidence for
managing stress at work: A review of the reviews reporting on anxiety, depression, and
absenteeism. Journal of Environmental and Public Health, 2012, 1–21.
doi:10.1155/2012/515874
Bull, S. S., Gillette, C., Glasgow, R. E., & Estabrooks, P. (2003). Work site health promotion
research: To what extent can we generalize the results and what is needed to translate
research to practice? Health Education & Behavior, 30(5), 537–549. Retrieved from
http://heb.sagepub.com/cgi/content/abstract/30/5/537
Bungum, T. J., Orsak, K. C., & Chng, C. L. (1997). Factors affecting exercise adherence at a
worksite wellness program. American Journal of Health Behavior, 21(1), 60–66. Retrieved
from
https://proxy.lib.utc.edu/login?url=http://search.ebscohost.com/login.aspx?direct=true&db=
psyh&AN=1997-02786-008&site=ehost-live
54
Cameron, R. (2011). Mixed methods research : The five Ps framework. The Electronic Journal
of Business Research Methods, 9(2), 96–108.
Cancelliere, C., Cassidy, J. D., Ammendolia, C., & Côté, P. (2011). Are workplace health
promotion programs effective at improving presenteeism in workers? A systematic review
and best evidence synthesis of the literature. BMC public health, 11(1), 395.
doi:10.1186/1471-2458-11-395
Chapman, L. S. (2003). Meta-evaluation of worksite health promotion economic return studies:
2012 update. American Journal of Health Promotion, 26(4), TAHP1–TAHP12.
doi:10.4278/ajhp.26.4.tahp
Chatzisarantis, N. L. D., & Hagger, M. S. (2008). Influences of personality traits and
continuation intentions on physical activity participation within the theory of planned
behaviour. Psychology & Health, 23(3), 347–367. doi:10.1080/14768320601185866
Cherniack, M., & Lahiri, S. (2010). Barriers to implementation of workplace health
interventions: an economic perspective. Journal of Occupational and Environmental
Medicine, 52(9), 934–42. doi:10.1097/JOM.0b013e3181f26e59
Clancy, S. S. (2012). Evaluating the sustained psychological benefits of on-site employee health
programs. The University of Tennessee at Chattanooga.
Clark, M. M., Warren, B. a, Hagen, P. T., Johnson, B. D., Jenkins, S. M., Werneburg, B. L., &
Olsen, K. D. (2011). Stress level, health behaviors, and quality of life in employees joining
a wellness center. American Journal of Health Promotion, 26(1), 21–5.
doi:10.4278/ajhp.090821-QUAN-272
Claxton, G., Rae, M., Panchal, N., Lundy, J., Damico, A., Osei-Anto, A., Kenward, K., et al.
(2011). Employer health benefits 2011. Menlo Park, CA & Chicago, IL: Henry J. Kaiser
Family Foundation & Health Research & Educational Trust.
Colquitt, J. A., LePine, J. A., & Noe, R. A. (2000). Toward an integrative theory of training
motivation: A meta-analytic path analysis of 20 years of research. Journal of Applied
Psychology, 85(5), 678–707. Retrieved from 10.1037/0021-9010.85.5.678
Eisenberger, R., Cummings, J., Armeli, S., & Lynch, P. (1997). Perceived organizational
support, discretionary treatment, and job satisfaction. The Journal of applied psychology,
82(5), 812–20. Retrieved from http://www.ncbi.nlm.nih.gov/pubmed/9337610
Eisenberger, R., Huntington, R., Hutchison, S., & Sowa, D. (1986). Perceived organizational
support. Journal of Applied Psychology, 71(3), 500–507. Retrieved from
http://www.sciencedirect.com/science/article/pii/S0021901007601848
55
Goetzel, R. Z., Jacobson, B. H., Aldana, S. G., Vardell, K., & Yee, L. (1998). Health care costs
of worksite health promotion participants and non-participants. Journal of Occupational
and Environmental Medicine, 40(4), 341–346.
Grotz, M., Hapke, U., Lampert, T., & Baumeister, H. (2011). Health locus of control and health
behaviour: results from a nationally representative survey. Psychology, Health & Medicine,
16(2), 129–40. doi:10.1080/13548506.2010.521570
Harden, a, Peersman, G., Oliver, S., Mauthner, M., & Oakley, A. (1999). A systematic review of
the effectiveness of health promotion interventions in the workplace. Occupational
Medicine, 49(8), 540–8. Retrieved from http://www.ncbi.nlm.nih.gov/pubmed/10658308
Hayes, A. F., & Preacher, K. J. (2012). Statistical mediation analysis with a multicategorical
independent variable. Manuscript submitted for publication., 1–51.
Health, N. B. G. on, & Investments, F. (2011). Employer investments in improving employee
health survey. Washington, DC.
Hughes, M. C., Girolami, T. M., Cheadle, A. D., Harris, J. R., & Patrick, D. L. (2007). A
lifestyle-based weight management program delivered to employees: Examination of health
and economic outcomes. Journal of Occupational and Environmental Medicine, 49(11).
Retrieved from
http://journals.lww.com/joem/Fulltext/2007/11000/A_Lifestyle_Based_Weight_Manageme
nt_Program.8.aspx
Johnson, R. B., & Onwuegbuzie, A. J. (2012). Mixed methods research : A research paradigm
whose time has come. Educational Researcher, 33(7), 14–26.
Judge, T. A., & Kammeyer-Mueller, J. D. (2011). Implications of core self-evaluations for a
changing organizational context. Human Resource Management Review, 21(4), 331–341.
Kiviniemi, M. T., Voss-Humke, A. M., & Seifert, A. L. (2007). How do I feel about the
behavior? The interplay of affective associations with behaviors and cognitive beliefs as
influences on physical activity behavior. Health Psychology, 26(2), 152–8.
doi:10.1037/0278-6133.26.2.152
Langille, J.-L. D., Berry, T. R., Reade, I. L., Witcher, C., Loitz, C. C., & Rodgers, W. M. (2011).
Strength of messaging in changing attitudes in a workplace wellness program. Health
Promotion Practice, 12(2), 303–311. doi:10.1177/1524839909336650
Lawler, E. E., Mohrman, S. A., & Ledford, G. E. (1995). Creating high performance
organizations: Practices and results of employee involvement and total quality management
in Fortune 1000 companies. San Francisco, CA: Jossey-Bass.
56
Linnan, L., Weiner, B., Graham, A., & Emmons, K. (2007). Manager beliefs regarding worksite
health promotion: Findings from the working healthy project 2. American Journal of Health
Promotion, 21(6), 521–528. doi:10.4278/0890-1171-21.6.521
McLeroy, K. R., Bibeau, D., Steckler, A., & Glanz, K. (1988). An ecological perspective on
health promotion programs. Health Education Quarterly, 15(4), 351–377. Retrieved from
10.1177/109019818801500401
Merrill, R. M., Aldana, S. G., Garrett, J., & Ross, C. (2011). Effectiveness of a workplace
wellness program for maintaining health and promoting healthy behaviors. Journal of
Occupational and Environmental Medicine, 53(7), 782–7.
doi:10.1097/JOM.0b013e318220c2f4
Merrill, R. M., Aldana, S. G., Pope, J. E., Anderson, D. R., Coberley, C. R., Vyhlidal, T. P.,
Howe, G., et al. (2011). Evaluation of a best-practice worksite wellness program in a small-
employer setting using selected well-being indices. Journal of Occupational and
Environmental Medicine, 53(4), 448–54. doi:10.1097/JOM.0b013e3182143ed0
Merrill, R. M., Aldana, S. G., Vyhlidal, T. P., Howe, G., Anderson, D. R., & Whitmer, R. W.
(2011). The impact of worksite wellness in a small business setting. Journal of
Occupational and Environmental Medicine, 53(2), 127–31.
doi:10.1097/JOM.0b013e318209e18b
Naydeck, B. L., Pearson, J. a, Ozminkowski, R. J., Day, B. T., & Goetzel, R. Z. (2008). The
impact of the highmark employee wellness programs on 4-year healthcare costs. Journal of
Occupational and Environmental Medicine, 50(2), 146–56.
doi:10.1097/JOM.0b013e3181617855
Parks, K. M., & Steelman, L. a. (2008). Organizational wellness programs: A meta-analysis.
Journal of Occupational Health Psychology, 13(1), 58–68. doi:10.1037/1076-8998.13.1.58
Person, A. L., Colby, S. E., Bulova, J. A., & Eubanks, J. W. (2010). Barriers to participation in a
worksite wellness program. Nutrition Research and Practice, 4(2), 149–54.
doi:10.4162/nrp.2010.4.2.149
Preacher, K. J., & Hayes, A. F. (2008). Asymptotic and resampling strategies for assessing and
comparing indirect effects in multiple mediator models. Behavior Research Methods, 40(3),
879–891. doi:10.3758/BRM.40.3.879
Renaud, L., Kishchuk, N., Juneau, M., Nigam, A., Téreault, K., & Leblanc, M.-C. (2008).
Implementation and outcomes of a comprehensive worksite health promotion program.
Canadian Journal of Public Health, 99(1), 73–7. Retrieved from
http://www.ncbi.nlm.nih.gov/pubmed/18435397
57
Rhoades, L., & Eisenberger, R. (2002). Perceived organizational support: A review of the
literature. Journal of Applied Psychology, 87(4), 698–714. doi:10.1037//0021-
9010.87.4.698
Robroek, S. J. W., Van Lenthe, F. J., Van Empelen, P., & Burdorf, A. (2009). Determinants of
participation in worksite health promotion programmes: a systematic review. The
International Journal of Behavioral Nutrition and Physical Activity, 6(26), 1–12.
doi:10.1186/1479-5868-6-26
Sainforth, F., Karsh, B.-T., Bookse, B. C., & Smith, M. J. (2001). Applying quality improvement
principles to achieve healthy owrk organizations. Journal on Quality Improvement, 27(9),
469–483.
Sale, J. E. M., Lohfeld, L. H., & Brazil, K. (2002). Revisiting the quantitative-qualitative debate :
Implications for mixed-methods research. Quality & Quantity, 36(1), 43–53.
Schmidt, H. (2012). Wellness incentives, equity, and the 5 groups problem. American Journal of
Public Health, 102(1), 49–54. doi:10.2105/AJPH.2011.300348
Schwetschenau, H. M., O’Brien, W. H., Cunningham, C. J. L., & Jex, S. M. (2008). Barriers to
physical activity in an on-site corporate fitness center. Journal of Occupational Health
Psychology, 13(4), 371–80. doi:10.1037/1076-8998.13.4.371
Shain, M., & Kramer, D. M. (2004). Health promotion in the workplace: Framing the concept;
reviewing the evidence. Occupational and Environmental Medicine, 61(7), 643–648.
doi:10.1136/oem.2004.013193
Soler, R. E., Leeks, K. D., Razi, S., Hopkins, D. P., Griffith, M., Aten, A., Chattopadhyay, S. K.,
et al. (2010). A systematic review of selected interventions for worksite health promotion:
The assessment of health risks with feedback. American Journal of Preventive Medicine,
38(2, Suppl), S237–S262. Retrieved from 10.1016/j.amepre.2009.10.030
Sorensen, G., Glasgow, R. E., & Corbett, K. (1990). Involving work sites and other
organizations. In N. Bracht (Ed.), Health promotion at the community level. (pp. 158–184).
Thousand Oaks, CA US: Sage Publications, Inc. Retrieved from
https://proxy.lib.utc.edu/login?url=http://search.ebscohost.com/login.aspx?direct=true&db=
psyh&AN=1990-98817-008&site=ehost-live
Tesluk, P. E., Vance, R. J., & Mathieu, J. E. (1999). Examining employee involvement in the
context of participative work environments. Group & Organization Management, 24(3),
271–299. doi:10.1177/1059601199243003
Velez, M. C. (2011). Wellness coordinators’ perceived organizational and managerial support
in relation to program practices. Ball State University.
58
Wallston, K. A. (1997). Perceived control and health behaviour. In A. Baum, C. McManus, S.
Newman, J. Weinman, & R. West (Eds.), Cambridge Handbook of Psychology, Health, and
Medicine (Vol. 1) (pp. 151–154). Cambridge, England: Cambridge University Press.
Wallston, K. A., Wallston, B. S., & DeVellis, R. (1978). Development of the multidimensional
health locus of control (MHLC) scales. Health Education Monographs, 6, 160–170.
Williams, P. G., O’Brien, C. D., & Colder, C. R. (2004). The effects of neuroticism and
extraversion on self-assessed health and health-relevant cognition. Personality and
Individual Differences, 37(1), 83–94. doi:10.1016/j.paid.2003.08.001
Zimmerman, E. (2003). Taking health-risk assessments to the next level. Workforce
Management, 83–84.
59
APPENDIX A
PARTICIPANT DEMOGRAPHICS

60
Frequency Distributions of Participant Demographics
N M SD
Age 197 38.92 10.62
Work hours per
week 198 42.15 7.58
Number of
dependents 197 1.107 1.15
N %
Biological sex Male 63 31.3
Female 138 68.7
Employment type Hourly 87 43.9
Salaried 111 56.1
Supervisor Yes 75 37.5
No 125 62.5
Income level $0 - $14,999 5 2.6
$15,000 - $24,999 16 8.3
$25,000 - $34,999 23 11.9
$35,000 - $49,999 35 18.1
$50,000 - $64,999 26 13.5
$65,000 - $79,999 22 11.4
$80,000 - $99,999 26 13.5
$100,000 - $124,999 16 8.3
$125,000+ 24 12.4
Race White 176 90.3
African-American 2 1.0
Asian 6 3.1
Two or More Races 11 5.6
Ethnicity Non-Hispanic 187 94.0
Hispanic 12 6.0
Married No 78 38.8
Yes 123 61.2
61
N %
Job type Account management 16 7.3
IT Specialist 8 3.7
MD/Physician's assistant 4 1.8
Nurse 7 3.2
Operations management 22 10.0
Receptionist 8 3.7
Supervisor/Manager 16 7.3
Other 8 3.7
Administrative assistant 15 6.8
Analyst 8 3.7
Biller/Collector 15 6.8
Claims management 6 2.7
515 1 .5
Customer Service
Representative/Sales
16 7.3
Director/President/VP 11 5.0
Dispatcher 4 1.8
HR practitioner 22 10.0
Not identified 32 14.6
Department type Accounting 9 4.1
Nursing 5 2.3
Operations 28 12.8
Risk management 8 3.7
Safety 7 3.2
Other 9 4.1
Administration 19 8.7
Billing 23 10.5
Customer Service/Sales 22 10.0
Human Resources 21 9.6
IT 12 5.5
Maintenance 8 3.7
Management 9 4.1
Medicine 7 3.2
Not identified 32 14.6

62
APPENDIX B
MEASURES USED IN STUDY
63
Perceived Organizational Support of Wellness Scale (POS-W
Item 1 My organization really cares about my health and wellness.
Item 2 My organization strongly considers my health and wellness.
Item 3 Resources are available from my organization to improve my health and wellness.
Item 4 The organization is willing to extend itself in order to help me improve my health and
wellness to the best of my ability.
Item 5 The organization would grant a reasonable request for a change in our wellness
offerings.
Item 6 The organization takes pride in its employees overall health and wellness
Item 7 The organization wishes to give its employees the best possible wellness program
offerings.
Item 8 The organization actively promotes employee use of wellness program offerings.
Barriers to Health and Wellness at Work (BHWW)
Dimension
Item 1 Time I do not have time due to my job demands.
Item 2 Time I do not have time due to family.
Item 3 Energy I am too stressed.
Item 4 Energy I am too tired.
Item 5 Energy I do not feel motivated enough.
Item 6 Other I do not want to improve my health or wellness.
Item 7 Other I do not see the benefits of these programs.
Item 8 Other I have a health condition that prevents me from participating in these programs.
Item 9 Other Regular travel prevents me from using these programs.
Item 10 Resources It costs too much money to participate in these programs.
Item 11 Resources The physical facilities in which these programs are held are poor.
Item 12 Resources These programs are offered at inconvenient times.
Item 13 Resources I don’t know how to participate in these programs.
Item 14 Resources I am not happy with the quality of current program offerings.
Item 15 Resources The locations for these programs are inconvenient.

64
Core self-evaluation (Judge & Kammeyer-Mueller, 2011)
Item 1 I am confident I get the success I deserve in life. Reverse coding
Item 2 Sometimes I feel depressed.
Item 3 When I try, I generally succeed Reverse coding
Item 4 Sometimes, when I fail I feel worthless.
Item 5 I complete tasks successfully Reverse coding
Item 6 Sometimes, I do not feel in control of my work.
Item 7 Overall, I am satisfied with myself. Reverse coding
Item 8 I am filled with doubts about my competence.
Item 9 I determine what will happen in my life. Reverse coding
Item 10 I do not feel in control of my success in my career.
Item 11 I am capable of coping with most of my problems. Reverse coding
Item 12 There are times when things look pretty bleak and
hopeless to me.
HLOC-I (Wallston, Wallston, & DeVellis, 1978)
Item 1 If I become sick, I have the power to make myself well again.
Item 2 I am directly responsible for my health.
Item 3 Whatever goes wrong with my health is my own fault.
Item 4 My physical well-being depends on how well I take care of myself.
Item 5
When I feel ill, I know it is because I have not been taking care of myself
properly.
Item 6 I can pretty much stay healthy by taking good care of myself.
HLOC-C (Wallston, Wallston, & DeVellis, 1978)
Item 1 Often I feel that no matter what I do, if I am going to get sick, I will get sick.
Item 2 It seems that my health is greatly influenced by accidental happenings
Item 3 When I am sick, I just have to let nature run its course.
Item 4 When I stay healthy, I am just plain lucky.
Item 5 Even when I take care of myself, it is easy to get sick.
Item 6 When I become ill, it's a matter of fate.
65
APPENDIX C
WELLNESS PROGRAM LISTINGS AND AVAILABILITY
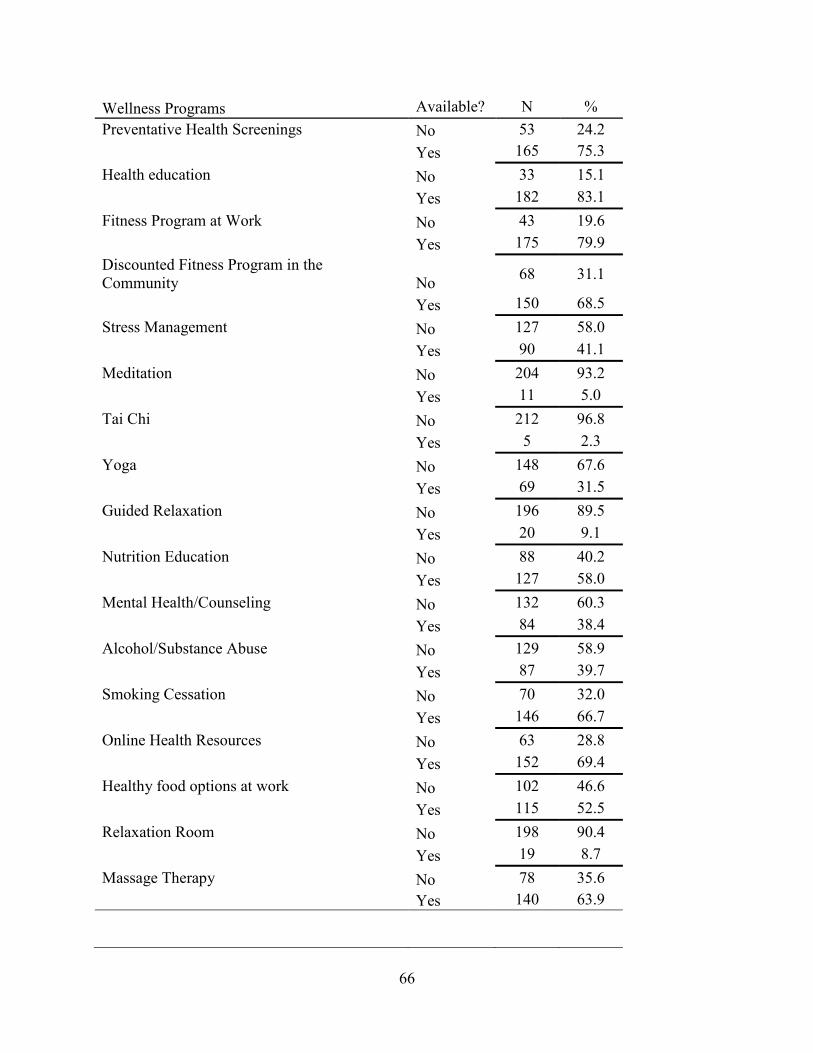
66
Wellness Programs Available? N %
Preventative Health Screenings No 53 24.2
Yes 165 75.3
Health education No 33 15.1
Yes 182 83.1
Fitness Program at Work No 43 19.6
Yes 175 79.9
Discounted Fitness Program in the
Community No 68 31.1
Yes 150 68.5
Stress Management No 127 58.0
Yes 90 41.1
Meditation No 204 93.2
Yes 11 5.0
Tai Chi No 212 96.8
Yes 5 2.3
Yoga No 148 67.6
Yes 69 31.5
Guided Relaxation No 196 89.5
Yes 20 9.1
Nutrition Education No 88 40.2
Yes 127 58.0
Mental Health/Counseling No 132 60.3
Yes 84 38.4
Alcohol/Substance Abuse No 129 58.9
Yes 87 39.7
Smoking Cessation No 70 32.0
Yes 146 66.7
Online Health Resources No 63 28.8
Yes 152 69.4
Healthy food options at work No 102 46.6
Yes 115 52.5
Relaxation Room No 198 90.4
Yes 19 8.7
Massage Therapy No 78 35.6
Yes 140 63.9

67
Continued from previous page
Wellness Program Available? N %
Wellness Support Groups No 126 57.5
Yes 88 40.2
Maternity Management No 173 79.0
Yes 37 16.9
68
APPENDIX D
QUALITATIVE DATA FROM WELLNESS PROGRAM COORDIATORS
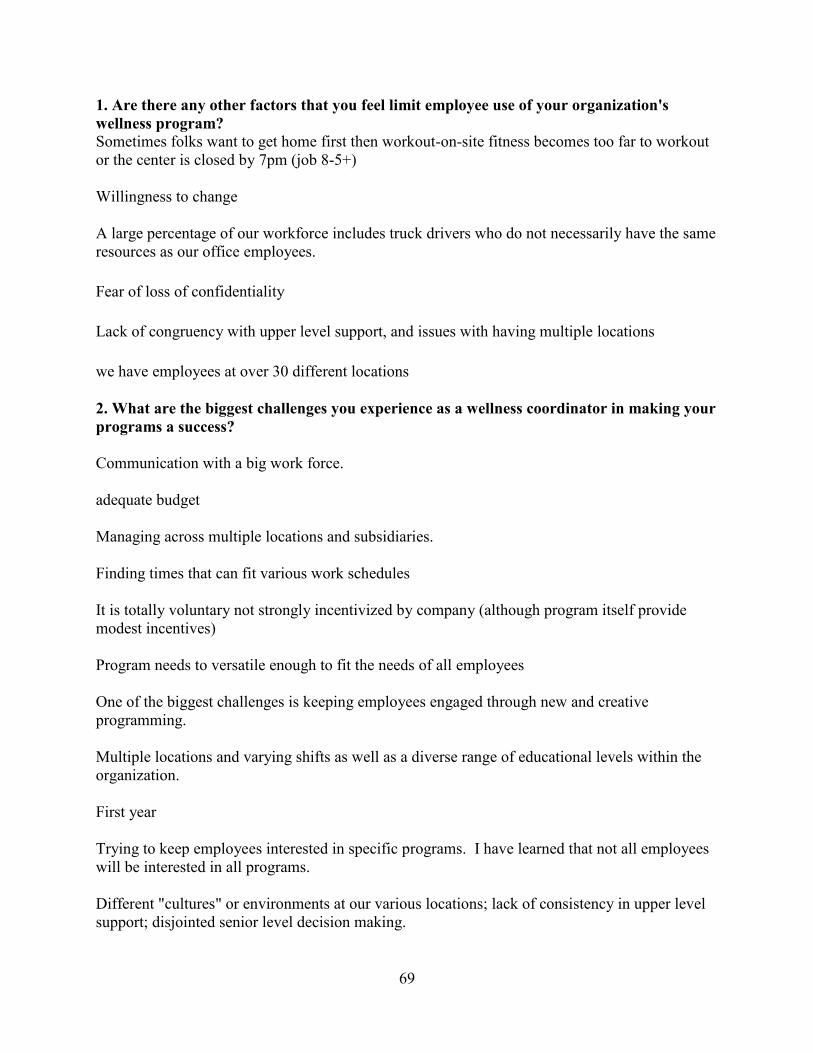
69
1. Are there any other factors that you feel limit employee use of your organization's
wellness program?
Sometimes folks want to get home first then workout-on-site fitness becomes too far to workout
or the center is closed by 7pm (job 8-5+)
Willingness to change
A large percentage of our workforce includes truck drivers who do not necessarily have the same
resources as our office employees.
Fear of loss of confidentiality
Lack of congruency with upper level support, and issues with having multiple locations
we have employees at over 30 different locations
2. What are the biggest challenges you experience as a wellness coordinator in making your
programs a success?
Communication with a big work force.
adequate budget
Managing across multiple locations and subsidiaries.
Finding times that can fit various work schedules
It is totally voluntary not strongly incentivized by company (although program itself provide
modest incentives)
Program needs to versatile enough to fit the needs of all employees
One of the biggest challenges is keeping employees engaged through new and creative
programming.
Multiple locations and varying shifts as well as a diverse range of educational levels within the
organization.
First year
Trying to keep employees interested in specific programs. I have learned that not all employees
will be interested in all programs.
Different "cultures" or environments at our various locations; lack of consistency in upper level
support; disjointed senior level decision making.
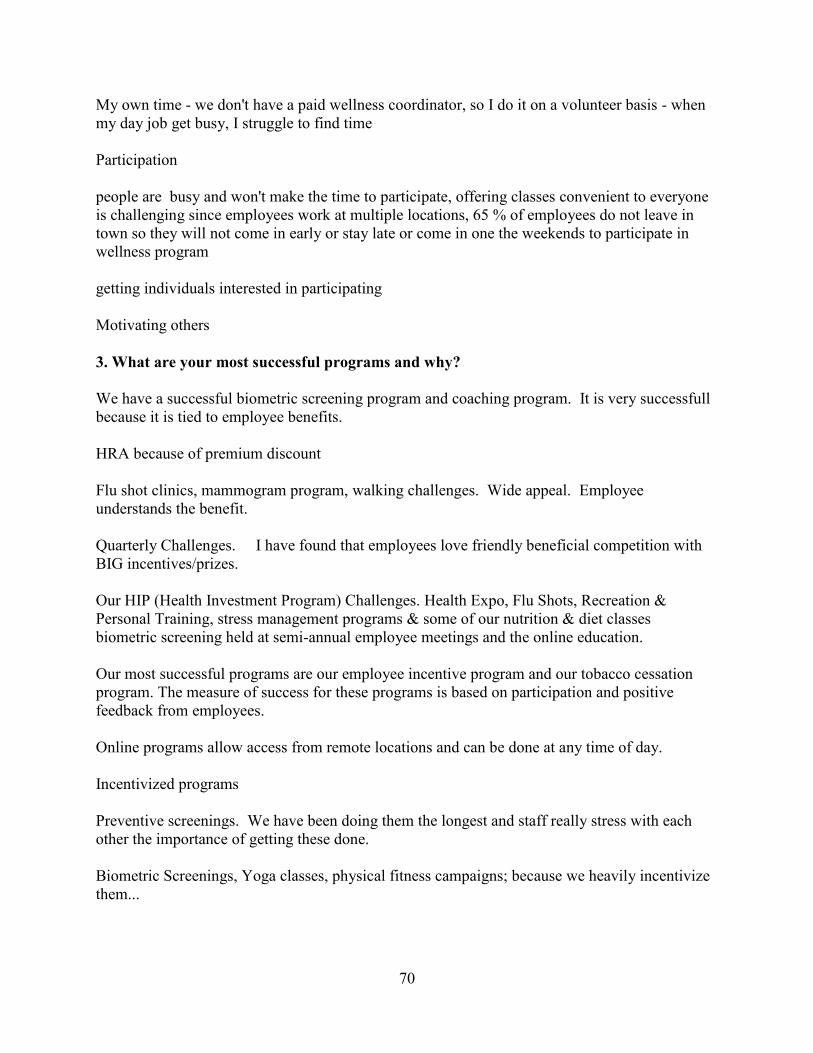
70
My own time - we don't have a paid wellness coordinator, so I do it on a volunteer basis - when
my day job get busy, I struggle to find time
Participation
people are busy and won't make the time to participate, offering classes convenient to everyone
is challenging since employees work at multiple locations, 65 % of employees do not leave in
town so they will not come in early or stay late or come in one the weekends to participate in
wellness program
getting individuals interested in participating
Motivating others
3. What are your most successful programs and why?
We have a successful biometric screening program and coaching program. It is very successfull
because it is tied to employee benefits.
HRA because of premium discount
Flu shot clinics, mammogram program, walking challenges. Wide appeal. Employee
understands the benefit.
Quarterly Challenges. I have found that employees love friendly beneficial competition with
BIG incentives/prizes.
Our HIP (Health Investment Program) Challenges. Health Expo, Flu Shots, Recreation &
Personal Training, stress management programs & some of our nutrition & diet classes
biometric screening held at semi-annual employee meetings and the online education.
Our most successful programs are our employee incentive program and our tobacco cessation
program. The measure of success for these programs is based on participation and positive
feedback from employees.
Online programs allow access from remote locations and can be done at any time of day.
Incentivized programs
Preventive screenings. We have been doing them the longest and staff really stress with each
other the importance of getting these done.
Biometric Screenings, Yoga classes, physical fitness campaigns; because we heavily incentivize
them...
71
Free fruit twice weekly - easy to participants in, no vending machines with unhealthy alternatives
available in our office. Subsidised sports club scheme.
4 week challenges which focus on a specific topic or activity
health screening because it is required, insurance discount, HSA and recreation center
membership as an incentive
coaching, know you number programs
Fitness Program because fitness seems to be important for the majority of the employees and
they would take part in fitness whether or not the company offered a program.
4. What are your least successful programs and why?
Stress Management and Smoking Cessation programs. Why? Hard to communicate and
employees want things for free.
lunch n learns because of a lack of attendance despite topics being those employees listred on
interest survey
Online wellness website hosted by outside vendor. Not top of mind. Have to leave the intranet
to get there.
Lunch & Learns due to lack of time in employee's day
Medical oriented programs addressing mens or womens health issues, smoking cessation
Activities at or after work - too many competing priorities
One of our areas of least success is employees being compliant with preventive screening. We
communicate to our employees the importance of preventive care screenings and screenings are
covered 100%, but we still have a low percentage of compliance. I believe the inconvenience of
having to make a doctor's appointment and schedule time off from work to go may be part of the
reason behind this.
Behavior change programs require more committment and are successful for those who engage
but there are many who have the risks but don't engage due to the committment or their stage of
readiness to change.
Smoking cessation programs that feel "forced" on the employee
Fitness - the individual needs to be motivated to get this accomplished.
Educational presentations and other "less mandatory components of the program"; lack of time to
promote; limited ability to communicate programs to everyone, etc.
72
behavior changing from tobacco use or nutrition
lunch and learns- employees won't take the time out their day to attend
online resources. Not all people have access and use these.
5. Do you have any other thoughts on organizational wellness programs that you would like
to add?”
none at this time
Need to increase the use of social media. Develop online challenges that can be open to "chats"
Most of my challenges have to do with time and juggling 3 different jobs within the company.
The wellness position needs to be a primary job responsibility to grow and to be consistently
successful.
The importance of keeping the program offerings fresh. Constant communication and continued
wellness presence all year.
Wellness needs to be approached as a change management initiative. Many programs don't
address the mental roadblocks of putting a program like this in place and then only touch those
that are already focused on wellness
A supportive culture is the main component that will enable sustainable health improvement over
time.
The adoption of a healthy meetings policy has changed the thinking of all staff in planning food
choices for meetings.
We need to make my position full time and appoint members to the wellness committee as part
of their job description. We need to offer less total programming, but retain the amount of
options that are available for participation so that promotion and communication will be more
successful. Senior level management needs to embrace wellness as a different thing than
healthcare. Other than that, we're doing pretty good!
information on what other companies use for incentives is always interesting / helpful

73
APPENDIX E
EMPLOYEE SURVEY

74
75
76

77
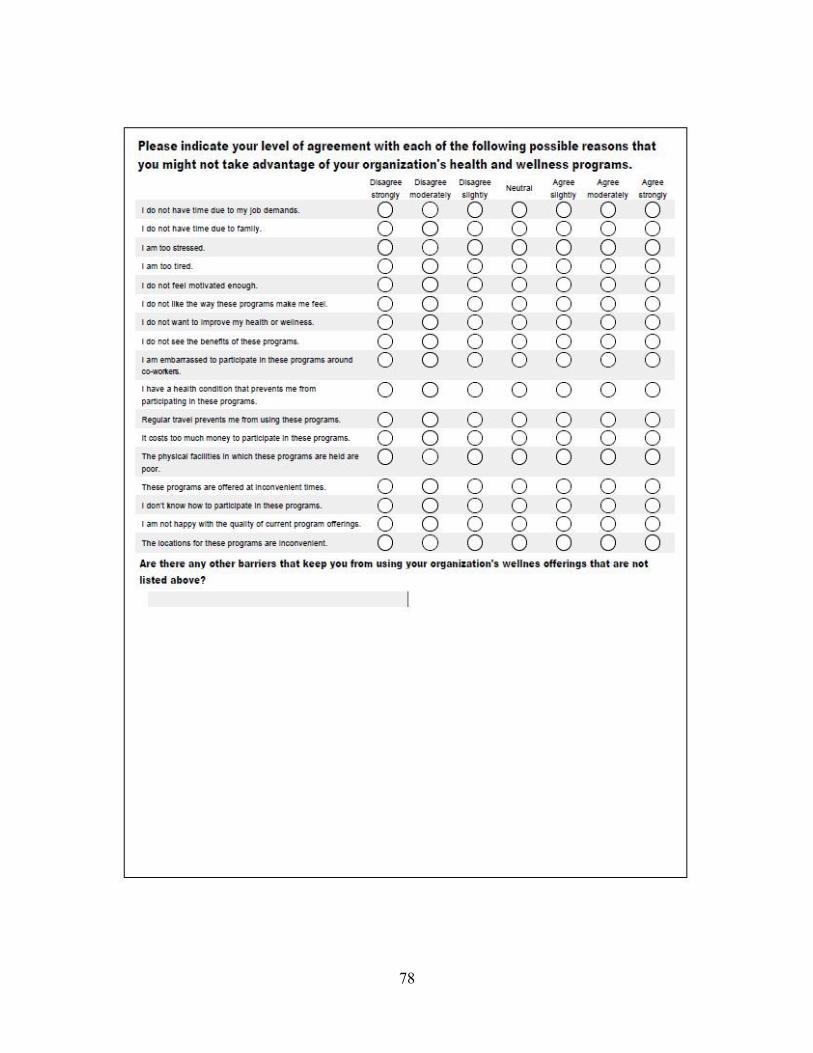
78
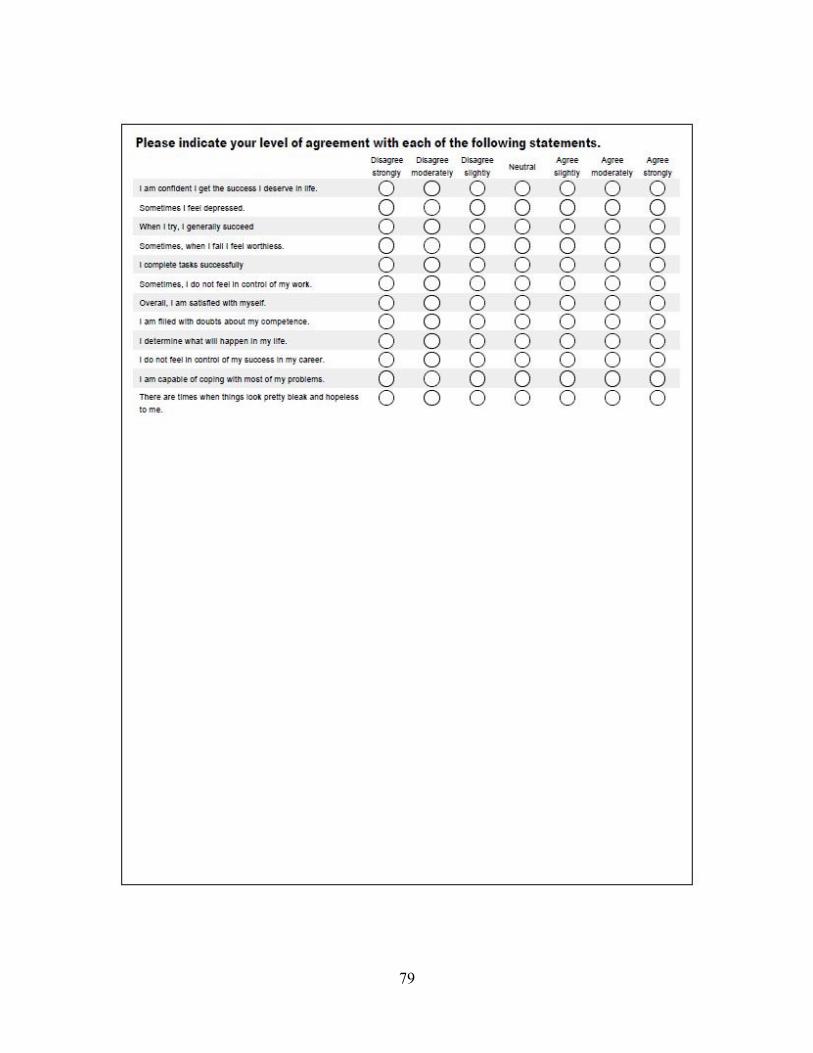
79
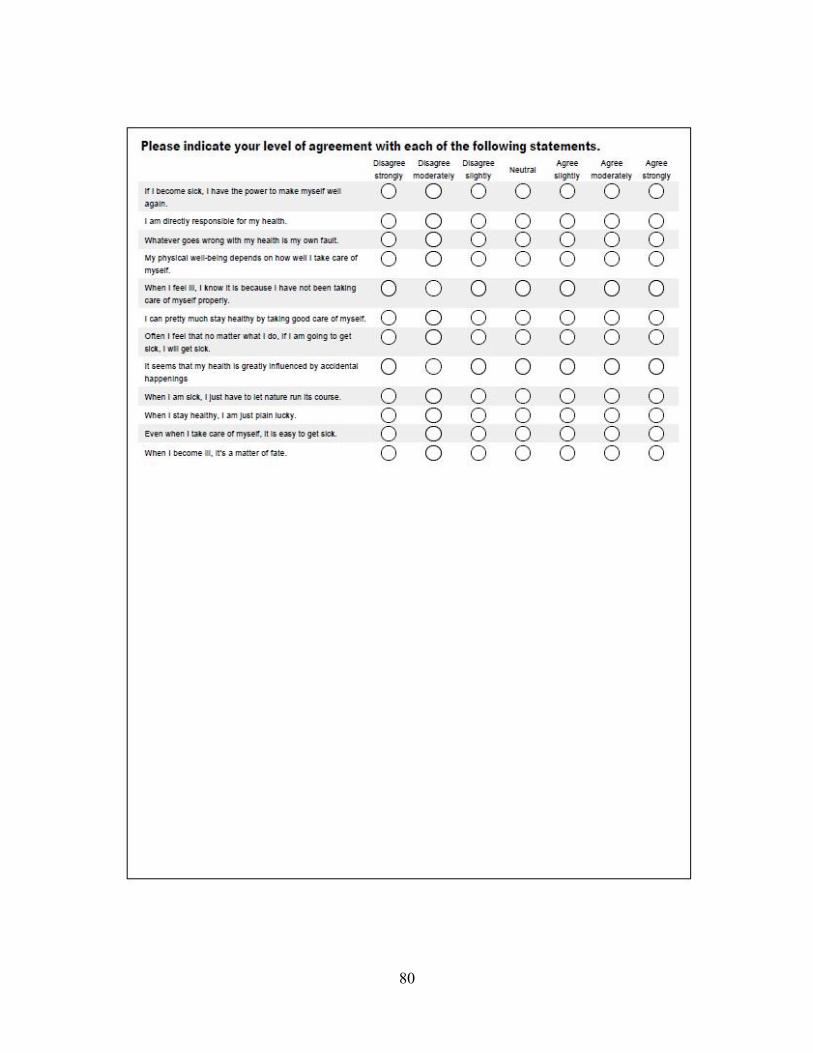
80
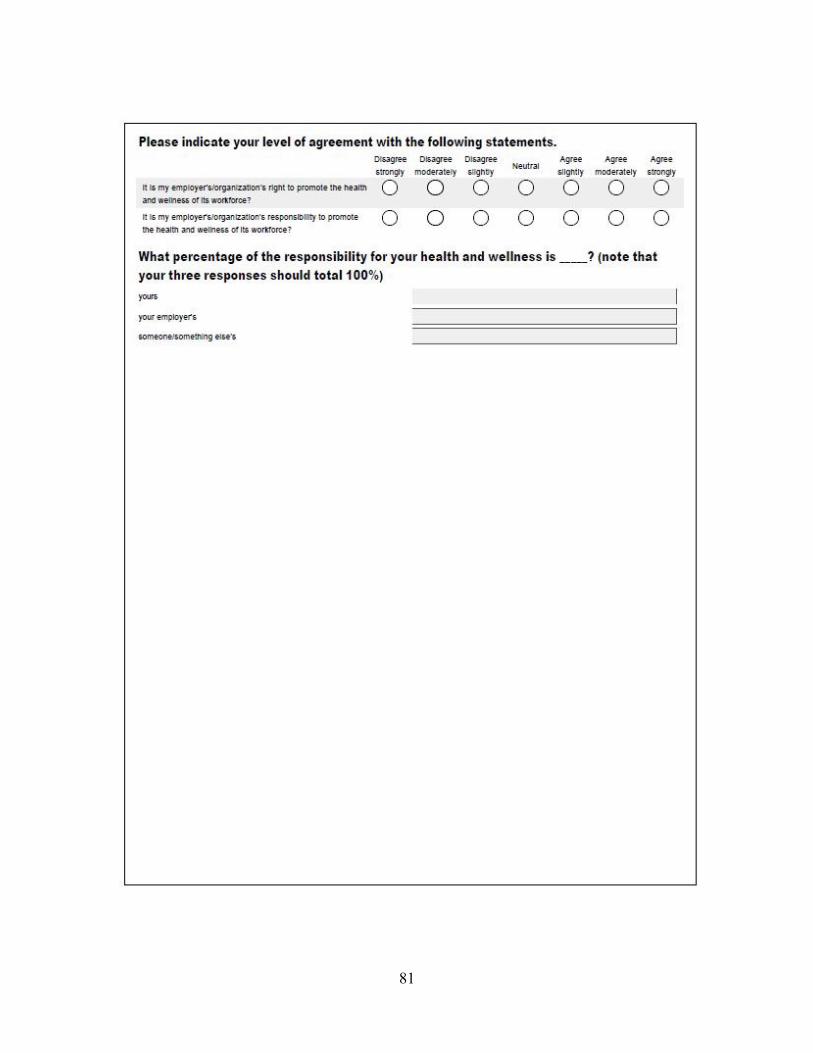
81

82

83
84

85
APPENDIX F
INSTITUTIONAL REVIEW BOARD APPROVAL LETTER

86
MEMORANDUM
TO: Aaron Manier IRB # 12- 179 Dr. Chris Cunningham FROM: Lindsay Pardue, Director of Research Integrity
Dr. Bart Weathington, IRB Committee Chair
DATE: November 12, 2012
SUBJECT: IRB # 12-179: Perceptions of Organizational Wellness Programs
The Institutional Review Board has reviewed and approved your application and assigned you the IRB number listed above. You must include the following approval statement on research materials seen by participants and used in research reports:
The Institutional Review Board of the University of Tennessee at Chattanooga (FWA00004149) has approved this research project #12-179.
Please remember that you must complete a Certification for Changes, Annual Review, or Project Termination/Completion Form when the project is completed or provide an annual report if the project takes over one year to complete. The IRB Committee will make every effort to remind you prior to your anniversary date; however, it is your responsibility to ensure that this additional step is satisfied.
Please remember to contact the IRB Committee immediately and submit a new project proposal for review if significant changes occur in your research design or in any instruments used in conducting the study. You should also contact the IRB Committee immediately if you encounter any adverse effects during your project that pose a risk to your subjects.
For any additional information, please consult our web page http://www.utc.edu/irb or email [email protected]
Best wishes for a successful research project.
87
VITA
Aaron was born and raised in Nashville, TN. Upon graduation from Montgomery Bell
Academy in 2001, Aaron entered into actor training at Emerson College in Boston, MA. While
his journey into acting was rewarding, he decided to transition into study of Psychology and
completed his BS at The University of Massachusetts in Amherst, MA. At UMass Aaron
completed his Honors Thesis on bridging the gap between science and practice in the field of
Clinical Psychology. After graduating, Aaron worked in the field as a counselor for some time,
but then again refocused his interests and entered into UTC’s Industrial-Organizational
Psychology program. During his time at UTC, he has worked on several research projects in both
nursing and psychology while teaching undergraduate level Psychology courses. Aaron
graduates in May 2013 and will be pursuing a PhD in I-O Psychology with an emphasis on
Occupational Health Psychology at St. Mary’s University in Halifax, Nova Scotia.