understanding olive oil stability using filtration and
TRANSCRIPT

molecules
Article
Understanding Olive Oil Stability Using Filtrationand High Hydrostatic Pressure
Lorenzo Guerrini *, Bruno Zanoni, Carlotta Breschi, Giulia Angeloni, Piernicola Masella,Luca Calamai and Alessandro Parenti
Dipartimento di Scienze e Tecnologie Agrarie, Alimentari, Ambientali e Forestali (DAGRI),Università degli Studi di Firenze, Piazzale delle Cascine 15, 50144 Florence, Italy; [email protected] (B.Z.);[email protected] (C.B.); [email protected] (G.A.); [email protected] (P.M.);[email protected] (L.C.); [email protected] (A.P.)* Correspondence: [email protected]; Tel.: +39-5-5275-5933
Academic Editors: Maria Lisa Clodoveo and Filomena CorboReceived: 15 November 2019; Accepted: 18 January 2020; Published: 20 January 2020
�����������������
Abstract: Veiled extra virgin olive oil (VEVOO) is very attractive on the global market. A study wasperformed to highlight the role of different amounts of water and microorganisms on the evolution ofVEVOO quality during storage, using the selective effects of the application of individual or combinedfiltration and high hydrostatic pressure (HHP) treatments. Four oil processing trials were carried outin four replicates, resulting in a full factorial design with two independent fixed factors: filtrationand HPP treatments. The turbidity of all the olive oil samples was characterized. Furthermore, allthe olive oil samples were analysed for legal parameters, volatile organic compounds and phenoliccompounds during the storage tests. The microbial contamination in the presence of a high levelof water activity (>0.6 Aw) was related to the formation of volatile aroma compounds, which wereresponsible for the “fusty” sensory defect. Furthermore, high water activity values were related toan increase in the hydrolytic degradation rate of the phenolic compounds. The oil turbidity has tobe planned and controlled, starting from adjustment of the water content and application of goodmanufacturing practices.
Keywords: biophenols; microbial contamination; sensory defects; turbidity; water content
1. Introduction
Extra virgin olive oil (EVOO) is considered a food with a long shelf life. However, during storageEVOO undergoes several compositional changes that reduce its quality. These changes can affect boththe chemical and sensory criteria that must be met for the European legal classification of EVOO aswell as its nutritional value.
With respect to the European legal requirements [1], the most frequently considered parametersare the amount of free fatty acids (i.e., the acidity value), peroxide values and UV index (i.e., K232,K270 and ∆K) values, in order to evaluate the level of enzymatic hydrolysis and radical oxidation ofthe triacylglycerols, respectively. EVOO must also have both a minimum positive “fruity” attributeand no negative sensory attributes (i.e., defects). Panel testing is the official method to measure theabove attributes, even though some relationships have been reported in the literature between sensoryperception and volatile organic compound content [2,3].
EVOO is rich in phenolic compounds, which are natural antioxidants with several positive effectson human health, playing a role in preventing several diseases [4]. The beneficial effect of phenoliccompounds from olives has been confirmed by the following scientific opinion from the EuropeanFood Safety Authority (EFSA) in relation to permitted health claims [5–7]: “Olive oil polyphenolscontribute to the protection of blood lipids from oxidative stress”.
Molecules 2020, 25, 420; doi:10.3390/molecules25020420 www.mdpi.com/journal/molecules

Molecules 2020, 25, 420 2 of 15
Veiled extra virgin olive oil (VEVOO) is described as a dispersion-suspension system, with thedegree of turbidity resulting from the presence of micro-droplets of vegetation water and small solidfragments of olive skin and pulp covered by a film of water [8,9]. VEVOO is always very attractive onthe global market, since for many consumers VEVOO is deemed to be of a higher quality than filteredextra virgin olive oil (FEVOO). However, this subject is still controversial.
Some literature data have shown a lower level of radical oxidation of the triacylglycerols inVEVOO than in FEVOO; the resulting increase in shelf life was explained by the higher content ofantioxidant phenolic compounds such as secoiridoids (i.e., oleuropein, ligstroside and their derivatives)in VEVOO, since they are not removed by filtration [10–14]. Instead, other literature data have shownVEVOO to have a higher risk of degradation during shelf life than FEVOO; the water content, combinedwith the spoilage microorganisms (i.e., mainly yeasts) which are contained in the micro-droplets ofwater and the solid particles [15], was related to both an increase in secoiridoid degradation andthe development of sensory defects in VEVOO [16–19]. Finally, other literature data have shown nosignificant qualitative differences during shelf life between VEVOO and FEVOO [8,20].
Therefore, a study on the effects of chemical and microbial transformation phenomena on VEVOOquality may be useful; an explanation of the potential different roles between the water and solid particlecontents and microbial contamination may be particularly interesting too. In this work, the selectiveeffects of the application of individual or combined filtration and high hydrostatic pressure (HHP)treatments were tested. Indeed, filtration is able to remove water and solid particles [21], while HHPis able to inactivate microorganisms [22]. In this way, a study was performed of the role of differentamounts of water and microorganisms on the evolution of EVOO quality during storage. Four oilprocessing trials were carried out, resulting in a full factorial design with four specimens: (i) CON(i.e., no filtration and no HHP), (ii) FIL (i.e., filtration and no HHP), (iii) HHP (i.e., no filtration andHHP), (iv) F-HHP (i.e., filtration and HHP). All of the olive oil samples were analysed to measuresome turbidity characterization parameters (i.e., degree of turbidity, water content, water activity,solid particle content, microbial cell count) and the EVOO legal requirements, the volatile organiccompounds and the phenolic compounds during storage tests. The storage conditions were chosen topotentially cause the transformation phenomena on olive oil samples quality.
2. Results
2.1. Effect of Treatments on Turbidity Characterization
The filtration and HHP treatments had a significant effect on the turbidity characterizationparameters of the just processed olive oil samples (Table 1).
Table 1. Mean values and standard deviations of the turbidity characterization parameters forthe four specimens of just processed olive oil samples; CON = veiled and not HHP-treated oilsamples; HHP = veiled and HHP-treated oil samples; FIL = filtered and not HHP-treated oil samples;F-HHP = filtered and HHP-treated oil samples. Number of replicates = 4.
Oil Samples Degree ofTurbidity (NTU)
Water Content(%w/w)
Solid ParticleContent (%w/w) Aw
Microbial CellCount (log UFC/g)
CON1525 ± 108 0.25 ± 0.09 0.22 ± 0.06 0.76 ± 0.05
4.5 ± 0.2HHP 0.0 ± 0.0
FIL17 ± 4 0.05 ± 0.01 0.00 ± 0.00 0.42 ± 0.02
0.0 ± 0.0F-HHP 0.0 ± 0.0
All the veiled oil samples (i.e., CON and HHP samples) showed a high degree of turbidity (approx.1500 NTU), since they were collected at the end of the “decanter” without having undergone anypreliminary centrifugation or decantation treatments [18,21,23]. Consistently, the CON and HHPsamples had high water (0.25% w/w) and solid particle content values (0.22% w/w) and high levels ofwater activity (0.76 AW). The CON samples were also contaminated by microorganisms with microbial

Molecules 2020, 25, 420 3 of 15
counts in the range of 4–5 log UFC/g, which may be related to the sanitary conditions of the olive fruitsand the hygiene conditions of the olive oil mill [13,15,24]. The HHP treatment was able to inactivatethe microorganisms; the HHP samples contained no microorganisms, even though the values of theother turbidity characterization parameters remained the same as the CON samples. All of the filteredoil samples (i.e., FIL and F-HHP samples) showed a low degree of turbidity (15 NTU), a low watercontent (0.05% w/w), no solid particle content and low water activity values (0.42 AW). The separationof water and solid particles by filtration also caused the complete removal of microorganisms.
2.2. Quality Evolution During Storage
2.2.1. European Legal Requirements
All of the olive oil samples were compliant with the EU legal chemical limits [1] during thestorage tests (Supplementary Material Table S1); no significant variations occurred between eitherthe CON, HHP, FIL and F-HHP samples or the different storage times (i.e after 15 days, 1 month and6 months of storage). The oil samples had low acidity values (approx. 0.21% oleic acid), low peroxidevalues (approx. 4.9 meq O2 kg−1) and low UV index values (approx. 1.67 and 0.13 for K232 and K270,respectively). A color shift from green to yellow was visually noticed in all samples regardless thetreatment, probably due to the light effect on samples.
Instead, the filtration and HHP treatments had a significant effect on the legal sensory attributesof the olive oil (Table 2). The positive “fruity” attribute showed a significant change as a function offiltration and storage time. The filtered oil (FIL and F-HHP samples) was perceived as fruitier (p < 0.001)than the veiled oil (CON and HHP samples). Furthermore, in all of the olive oil samples the fruitinessattribute significantly decreased during storage (p < 0.001). The positive bitterness attribute changedsignificantly as a function of filtration (p < 0.01), storae time (p < 0.001) and their interaction (p < 0.05).The filtered oil was bitterer than the veiled oil after 15 days of storage, while no significant differencesoccurred after 1 and 6 months of storage; the bitterness significantly decreased in intensity duringstorage. The behaviour of the positive pungency attribute during storage was also consistent with thebitterness attribute.
“Fusty” and “rancid” sensory defects occurred in some olive oil samples, causing the oil to bedowngraded from EVOO to virgin or lampante olive oil. The negative “fusty” attribute was related tofiltration (p < 0.001), HHP treatment (p < 0.05) and their interaction (p < 0.01). The CON oil sampleswere the only ones with the “fusty” defect. The negative “rancid” attribute was significantly relatedto the treatments, storage time and all of their interactions. The “rancid” defect was not present inthe filtered oil samples during storage, but it was perceived in the veiled oil samples after 1 month ofstorage. The intensity of the rancidity attribute was high and increased with storage time in the CONoil samples.
2.2.2. Volatile Organic Compounds
The volatile organic compound content of the oil samples was studied as the three followinggroups of compounds, in relation to their assumed role in oil sensory quality: (i) compounds withfive and six carbon atoms, which are usually associated with the lipoxygenase (LOX) pathway and,consequently, with the “fruity” and “green” positive sensory attributes [25]; (ii) microbial metabolitecompounds, which are usually associated with negative sensory attributes such as “fusty”, “muddy”,“vinegary” and “mouldy” defects [2,15,17]; (iii) compounds with seven, eight and nine carbon atoms,which are usually associated with the “rancid” negative sensory attribute [2,3]. The list of the abovemeasured compounds is presented as Supplementary Material in Table S2. The experimental datawere processed as the sum of the three above groups of volatile organic compounds, except for the(E)-2-hexenal compound, which was certainly associated in the literature with the “fruity” and “green”positive sensory attributes (Table 3).
Molecules 2020, 25, 420 4 of 15
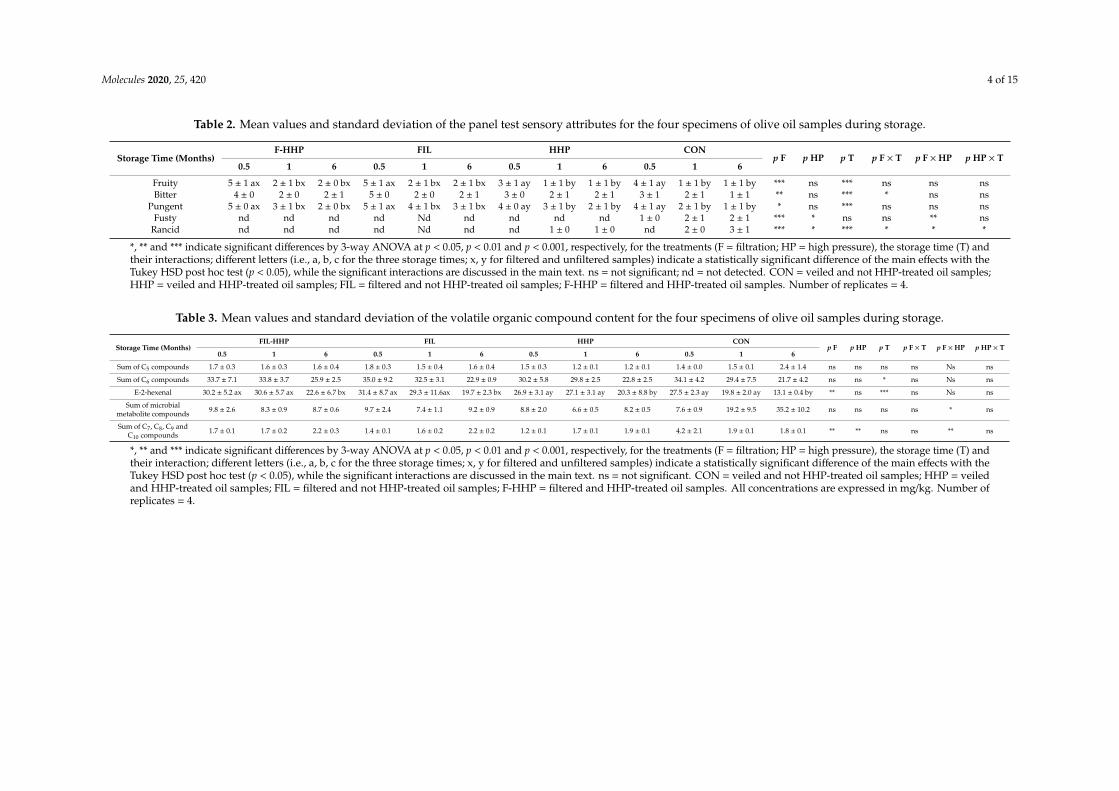
Table 2. Mean values and standard deviation of the panel test sensory attributes for the four specimens of olive oil samples during storage.
Storage Time (Months)F-HHP FIL HHP CON
p F p HP p T p F × T p F ×HP p HP × T0.5 1 6 0.5 1 6 0.5 1 6 0.5 1 6
Fruity 5 ± 1 ax 2 ± 1 bx 2 ± 0 bx 5 ± 1 ax 2 ± 1 bx 2 ± 1 bx 3 ± 1 ay 1 ± 1 by 1 ± 1 by 4 ± 1 ay 1 ± 1 by 1 ± 1 by *** ns *** ns ns nsBitter 4 ± 0 2 ± 0 2 ± 1 5 ± 0 2 ± 0 2 ± 1 3 ± 0 2 ± 1 2 ± 1 3 ± 1 2 ± 1 1 ± 1 ** ns *** * ns ns
Pungent 5 ± 0 ax 3 ± 1 bx 2 ± 0 bx 5 ± 1 ax 4 ± 1 bx 3 ± 1 bx 4 ± 0 ay 3 ± 1 by 2 ± 1 by 4 ± 1 ay 2 ± 1 by 1 ± 1 by * ns *** ns ns nsFusty nd nd nd nd Nd nd nd nd nd 1 ± 0 2 ± 1 2 ± 1 *** * ns ns ** ns
Rancid nd nd nd nd Nd nd nd 1 ± 0 1 ± 0 nd 2 ± 0 3 ± 1 *** * *** * * *
*, ** and *** indicate significant differences by 3-way ANOVA at p < 0.05, p < 0.01 and p < 0.001, respectively, for the treatments (F = filtration; HP = high pressure), the storage time (T) andtheir interactions; different letters (i.e., a, b, c for the three storage times; x, y for filtered and unfiltered samples) indicate a statistically significant difference of the main effects with theTukey HSD post hoc test (p < 0.05), while the significant interactions are discussed in the main text. ns = not significant; nd = not detected. CON = veiled and not HHP-treated oil samples;HHP = veiled and HHP-treated oil samples; FIL = filtered and not HHP-treated oil samples; F-HHP = filtered and HHP-treated oil samples. Number of replicates = 4.
Table 3. Mean values and standard deviation of the volatile organic compound content for the four specimens of olive oil samples during storage.
Storage Time (Months)FIL-HHP FIL HHP CON
p F p HP p T p F × T p F ×HP p HP × T0.5 1 6 0.5 1 6 0.5 1 6 0.5 1 6
Sum of C5 compounds 1.7 ± 0.3 1.6 ± 0.3 1.6 ± 0.4 1.8 ± 0.3 1.5 ± 0.4 1.6 ± 0.4 1.5 ± 0.3 1.2 ± 0.1 1.2 ± 0.1 1.4 ± 0.0 1.5 ± 0.1 2.4 ± 1.4 ns ns ns ns Ns ns
Sum of C6 compounds 33.7 ± 7.1 33.8 ± 3.7 25.9 ± 2.5 35.0 ± 9.2 32.5 ± 3.1 22.9 ± 0.9 30.2 ± 5.8 29.8 ± 2.5 22.8 ± 2.5 34.1 ± 4.2 29.4 ± 7.5 21.7 ± 4.2 ns ns * ns Ns ns
E-2-hexenal 30.2 ± 5.2 ax 30.6 ± 5.7 ax 22.6 ± 6.7 bx 31.4 ± 8.7 ax 29.3 ± 11.6ax 19.7 ± 2.3 bx 26.9 ± 3.1 ay 27.1 ± 3.1 ay 20.3 ± 8.8 by 27.5 ± 2.3 ay 19.8 ± 2.0 ay 13.1 ± 0.4 by ** ns *** ns Ns ns
Sum of microbialmetabolite compounds 9.8 ± 2.6 8.3 ± 0.9 8.7 ± 0.6 9.7 ± 2.4 7.4 ± 1.1 9.2 ± 0.9 8.8 ± 2.0 6.6 ± 0.5 8.2 ± 0.5 7.6 ± 0.9 19.2 ± 9.5 35.2 ± 10.2 ns ns ns ns * ns
Sum of C7, C8, C9 andC10 compounds 1.7 ± 0.1 1.7 ± 0.2 2.2 ± 0.3 1.4 ± 0.1 1.6 ± 0.2 2.2 ± 0.2 1.2 ± 0.1 1.7 ± 0.1 1.9 ± 0.1 4.2 ± 2.1 1.9 ± 0.1 1.8 ± 0.1 ** ** ns ns ** ns
*, ** and *** indicate significant differences by 3-way ANOVA at p < 0.05, p < 0.01 and p < 0.001, respectively, for the treatments (F = filtration; HP = high pressure), the storage time (T) andtheir interaction; different letters (i.e., a, b, c for the three storage times; x, y for filtered and unfiltered samples) indicate a statistically significant difference of the main effects with theTukey HSD post hoc test (p < 0.05), while the significant interactions are discussed in the main text. ns = not significant. CON = veiled and not HHP-treated oil samples; HHP = veiledand HHP-treated oil samples; FIL = filtered and not HHP-treated oil samples; F-HHP = filtered and HHP-treated oil samples. All concentrations are expressed in mg/kg. Number ofreplicates = 4.

Molecules 2020, 25, 420 5 of 15
Data from all of the oil samples showed that C6 compounds from linolenic acid were themost abundant, in agreement with the literature [25,26], demonstrating that the LOX pathway hada preferential action on linolenic acid. (E)-2-Hexenal was consistently the most abundant compound(i.e., from 85% to 92% of the sum of C6 compounds).
The sum of the LOX compound content with five carbon atoms was not significantly relatedto filtration, HHP treatment or storage time, while sum of the LOX compound content with sixcarbon atoms significantly decreased during storage (p < 0.05). The (E)-2-hexenal content also showeda significant change as a function of filtration and storage time. The filtered oil (FIL and F-HHPsamples) had a significantly (p < 0.01) higher content of (E)-2-hexenal than the veiled oil (CON andHHP samples). Furthermore, in all of the olive oil samples the (E)-2-hexenal content significantlydecreased during storage (p < 0.001).
The sum of the microbial metabolite compound content was significantly influenced by theinteraction between the filtration and HHP treatments (p < 0.05). Low contents of the above compoundswere measured both in the filtered oil (FIL and F-HHP samples) and in the veiled oil treated withHHP (HHP samples), while the veiled oil (CON samples) had the highest content of microbialmetabolite compounds.
The sum of the C7, C8, C9 and C10 compounds (i.e., the “rancid” compounds) showed significantdifferences as a result of filtration (p < 0.01), HHP treatment (p < 0.01) and interaction between filtrationand HHP treatment (p < 0.01). After 15 days of storage, a higher content of the “rancid” compoundswas measured in the veiled oil (CON samples) than in both the filtered oil (FIL and F-HHP samples)and the veiled oil treated with HHP (HHP samples). The above difference between the oil sampleswas lost after 1 and 6 months of storage.
2.2.3. Phenolic Compounds
The phenolic compound content of the oil samples was studied as total content, content of groupsof secoiridoid compounds and content of single representative secoiridoid compounds in EVOO [27].The R-Index was also considered as described in the Materials and Methods section. Briefly, the R-indexis the ratio between tyrosol+hydroxytyrosol and the total secoridoids content. It can be considereda useful indicator of the hydrolysis of secoiridoids.
The experimental conditions and their interaction had no significant effect on the total phenoliccompound content, but the profile of the phenolic compounds changed significantly (Table 4).
The sum of the content of oleuropein and its derivatives, and, accordingly, the 3,4-DHPEA-EDAcontent showed a significant difference as a function of filtration treatment (p < 0.001). After 15 daysof storage the veiled oil samples had lower contents of the above compounds than the filtered ones;this difference remained constant after 1 and 6 months of storage.
The hydroxytyrosol and tyrosol contents changed significantly as a function of filtration (p < 0.001),storage time (p < 0.001) and their interaction (p < 0.001). In particular, the above compound contentsincreased in the veiled oil samples during storage, while they remained approximately constant in thefiltered oil samples. In the same way, the R-Index was significantly related to filtration, storage time andtheir interaction. The filtration treatment caused a decrease in the hydrolytic status of the secoiridoids,while the storage time caused an increase in the R-Index. The interaction between storage time andfiltration highlighted that the veiled oil samples were the samples most susceptible to secoiridoidhydrolytic degradation during storage.

Molecules 2020, 25, 420 6 of 15
Table 4. Mean values and standard deviation of the phenolic compound content for the four specimens of olive oil samples during storage.
Storage Time (Months)FIL-HPP FIL HHP CON
p F p HP p T p F × T p F ×HP p HP × T0.5 1 6 0.5 1 6 0.5 1 6 0.5 1 6
Sum of oleuropein andits derivatives 333 ± 22 a 306 ± 40 a 309 ± 29 a 346 ± 9 a 317 ± 26 a 290 ± 25 a 218 ± 42 b 228 ± 37 b 248 ± 56 b 229 ± 45 b 229 ± 44 b 241 ± 58 b *** ns ns ns ns ns
3,4-DHPEA-EDA 122 ± 14 a 135 ± 16 a 126 ± 25 a 123 ± 7 a 112 ± 17 a 131 ± 15 a 65 ± 22 b 71 ± 23 b 64 ± 21 b 67 ± 24 b 68 ± 11 b 60 ± 22 b *** ns ns ns ns ns
Hydroxytyrosol 1 ± 0 2 ± 0 3 ± 0 1 ± 0 1 ± 0 3 ± 0 6 ± 1 6 ± 2 15 ± 3 8 ± 3 7 ± 4 17 ± 3 *** ns *** *** ns ns
Sum of ligstroside andits derivatives 106 ± 15 109 ± 15 128 ± 23 118 ± 22 109 ± 17 116 ± 13 124 ± 23 113 ± 22 135 ± 25 125 ± 26 115 ± 29 126 ± 28 ns ns ns ns ns ns
p-HPEA-EDA 71 ± 6 68 ± 8 73 ± 14 73 ± 5 67 ± 12 75 ± 9 70 ± 12 65 ± 13 70 ± 14 74 ± 14 68 ± 21 64 ± 17 ns ns ns ns ns ns
Tyrosol 2 ± 0 2 ± 0 3 ± 0 2 ± 0 2 ± 0 3 ± 0 2 ± 1 3 ± 0 6 ± 1 3 ± 1 4 ± 2 9 ± 6 *** ns *** *** ns ns
Total phenoliccompounds 448 ± 20 474 ± 42 484 ± 46 479 ± 19 468 ± 48 469 ± 37 418 ± 66 429 ± 52 481 ± 81 434 ± 68 420 ± 61 472 ± 72 ns ns ns ns ns ns
R-Index (10−2) 1 ± 0 1 ± 0 2 ± 0 1 ± 0 1 ± 0 1 ± 0 3 ± 1 3 ± 2 6 ± 1 4 ± 2 4 ± 3 8 ± 5 *** ns *** *** ns ns
*, ** and *** indicate significant differences by 3-way ANOVA at p < 0.05, p < 0.01 and p < 0.001, respectively, for the treatments (F = filtration; HP = high pressure), the storage time (T) andtheir interaction; different letters (i.e., a, b, c for the three storage times; x, y for filtered and unfiltered samples) indicate a statistically significant difference of the main effects with the TukeyHSD post hoc test (p < 0.05), while the significant interactions are discussed in the main text. ns = not significant; nd = not detected. CON = veiled and not HHP-treated oil samples;HHP = veiled and HHP-treated oil samples; FIL = filtered and not HHP-treated oil samples; F-HHP = filtered and HHP-treated oil samples; 3,4-DHPEA-EDA = dialdehydic form ofdecarboxymethyl elenolic acid linked to hydroxytyrosol; p-HPEA-EDA = dialdehydic form of decarboxymethyl ligstroside aglycones. All concentrations are expressed in mg/kg. Numberof replicates = 4.

Molecules 2020, 25, 420 7 of 15
3. Discussion
According to the literature data [21,28,29], the applied filtration and HHP treatments were ableto create olive oil samples with different microbial contamination, water content and water activitylevels (Table 1). Therefore, this work achieved its aim of creating olive oil samples with differentsusceptibilities to microbial, enzymatic and non-enzymatic transformation phenomena [30]. The CONoil samples were highly susceptible to all the above phenomena, since they had a high level of microbialcontamination, water content and water activity. Indeed, water activity values > 0.6 Aw potentiallymake foods more prone to transformation phenomena [31].
The HHP oil samples were highly susceptible to enzymatic and non-enzymatic phenomena only,since they had no microbial contamination, but a high water content and level of water activity. TheFIL and F-HHP oil samples were not very susceptible to any of the above phenomena, since they hadno microbial contamination, a low water content and low water activity (< 0.6 Aw).
The evolution of the measured EU legal chemical limits during storage showed that neitherenzymatic hydrolysis by lipases nor radical oxidation of the triacylglycerols occurred on any of theolive oil samples. The potential lipases from microorganisms [15] were not active, since the acidityvalue did not change in the CON samples. The potential endogenous lipases were not active either,since the acidity value did not change in the HHP samples. The relatively short storage time mayexplain the above behaviour; Fregapane et al. [16] observed a hydrolysis of triacylglycerols in unfilteredoil samples, but they were working under accelerated storage conditions at 40 ◦C in the dark.
No effect of water content or water activity was evidenced on the rate of radical oxidationof the triacylglycerols. The relatively short storage time may explain the above phenomenon, butcontradictory literature data have suggested that water has a protective effect against oxidation [14,32]or that the rate of lipid oxidation is lowest at a water activity of 0.2–0.4 Aw [33]. However, Brkic Bubolaet al. [34] also showed no significant effect between the oxidation levels of filtered and unfilteredolive oil.
Instead, the veiled oil samples were affected by significant changes of sensory attributes,and volatile organic and phenolic compound contents, which can be explained by the experimentaldata as an effect of either a microbial contamination or a high level of water activity.
Only the CON oil samples (i.e., with a high level of microbial contamination, water content andwater activity) had a “fusty” defect during storage (Table 2) and an increasing content of microbialmetabolite compounds during storage (Table 3). These behaviours can be considered congruent, relatedto each other and in line with some literature data [15,35]; Figure 1 clearly shows that the removalof microorganisms by filtration and HHP treatments prevented the formation of volatile organiccompounds, which were responsible for the “fusty” defect.
Only the CON oil samples had a rancidity defect, which increased during storage (Table 2).Therefore, microbial activity may be related to the formation of the above sensory defect; thisphenomenon, even though not well studied, has already been reported by both Guerrini et al. [24] andCiafardini and Zullo [15], who linked the rapid appearance of the “rancid” defect with olive oil samplescontaminated by yeasts. In this way, the appearance of the rancidity defect without a significantradical oxidation of the triacylglycerols in all the olive oil samples (as reported above in the text)may be explained. The experimental data relating to the C7, C8, C9 and C10 compound contents(i.e., the “rancid” compounds) appeared to be congruent with the above phenomenon, their highestcontent being in the CON oil samples (Table 3); the relationship between the “rancid” compounds andthe same rancidity sensory defect is shown clearly in Figure 1.
The FIL and F-HHP oil samples (that is, with no microbial contamination, low water content andlow water activity) were perceived by the panel test as fruitier than the veiled oil samples duringstorage (Table 2). This behaviour can be related to the LOX pathway. Indeed, it is known that duringextraction processing both the olive oil fruits and the olive oil are subjected to the LOX pathway [36],which is the multi-step enzyme oxidation of linoleic and linolenic fatty acids into aldehydes, alcoholsand esters with five and six atoms of carbon, responsible for pleasant sensory descriptors, such as

Molecules 2020, 25, 420 8 of 15
“fruity” and “green” [25]. A common marker of the LOX pathway extent is E-2-hexenal, which was infact the most abundant compound in all of the olive oil samples in this study (Table 3). A transformationof the LOX compounds can occur after oil extraction and during storage with a consistent decrease inthe fruitiness attribute [16,20]. This transformation was evidenced by our experimental data: a decreasein (E)-2-hexenal content occurred and, consequently, the fruitiness attribute decreased (Tables 2 and 3).Since the veiled oil samples displayed the greatest decrease in E-2-hexenal, it may be supposed thata high level of water activity has an effect on the increase in the LOX compound transformation rate;similar results were also reported by Fortini et al. [18]. Moreover, the above transformation may becaused by enzymatic or non-enzymatic reactions, without the involvement of microbial activity.Molecules 2019, 24, x FOR PEER REVIEW 2 of 16
Figure 1. Interaction plots of “fusty” and “rancid” results given by the panel compared with
chromatograph results (i.e., microorganism-related compounds for fustiness and C7-C8-C9-C10
compounds for rancidity). The x-axis reports HHP treatment (No or Yes). The continuous grey line
shows filtered samples (i.e., filtration YES), and the black line cloudy samples (i.e., Filtration NO).
Error bars represent the standard error.
Only the CON oil samples had a rancidity defect, which increased during storage (Table 2).
Therefore, microbial activity may be related to the formation of the above sensory defect; this
phenomenon, even though not well studied, has already been reported by both Guerrini et al. [24]
and Ciafardini and Zullo [15], who linked the rapid appearance of the “rancid” defect with olive oil
samples contaminated by yeasts. In this way, the appearance of the rancidity defect without a
significant radical oxidation of the triacylglycerols in all the olive oil samples (as reported above in
the text) may be explained. The experimental data relating to the C7, C8, C9 and C10 compound
contents (i.e., the “rancid” compounds) appeared to be congruent with the above phenomenon, their
highest content being in the CON oil samples (Table 3); the relationship between the “rancid”
compounds and the same rancidity sensory defect is shown clearly in Figure 1.
The FIL and F-HHP oil samples (that is, with no microbial contamination, low water content and
low water activity) were perceived by the panel test as fruitier than the veiled oil samples during
storage (Table 2). This behaviour can be related to the LOX pathway. Indeed, it is known that during
extraction processing both the olive oil fruits and the olive oil are subjected to the LOX pathway [36],
which is the multi-step enzyme oxidation of linoleic and linolenic fatty acids into aldehydes, alcohols
and esters with five and six atoms of carbon, responsible for pleasant sensory descriptors, such as
“fruity” and “green” [25]. A common marker of the LOX pathway extent is E-2-hexenal, which was
in fact the most abundant compound in all of the olive oil samples in this study (Table 3). A
transformation of the LOX compounds can occur after oil extraction and during storage with a
consistent decrease in the fruitiness attribute [16,20]. This transformation was evidenced by our
experimental data: a decrease in (E)-2-hexenal content occurred and, consequently, the fruitiness
attribute decreased (Tables 2 and 3). Since the veiled oil samples displayed the greatest decrease in
E-2-hexenal, it may be supposed that a high level of water activity has an effect on the increase in the
LOX compound transformation rate; similar results were also reported by Fortini et al. [18].
Moreover, the above transformation may be caused by enzymatic or non-enzymatic reactions,
without the involvement of microbial activity.
Figure 1. Interaction plots of “fusty” and “rancid” results given by the panel compared withchromatograph results (i.e., microorganism-related compounds for fustiness and C7-C8-C9-C10compounds for rancidity). The x-axis reports HHP treatment (No or Yes). The continuous greyline shows filtered samples (i.e., filtration YES), and the black line cloudy samples (i.e., Filtration NO).Error bars represent the standard error.
The FIL and F-HHP oil samples were perceived by the panel test as bitterer and more pungentthan the veiled oil samples during storage (Table 2). This behaviour can be related to the phenolicprofile of olive oil, which is not the same as the phenolic profile of olive oil fruits, since numeroustransformation phenomena can occur during EVOO extraction processing and storage [37–39]. Sincesecoiridoids are the phenolic compounds with the highest transfer rate from fruits to oil, the predominantphenolic compounds in olive oil are oleuropein, ligstroside and their derivatives. Oleuropein andligstroside are thought to be subjected to transformation, resulting in hydrolytic and oxidative changesof both an enzymatic and non-enzymatic nature. The hydrolytic transformation pathway causesthe rapid formation of aglycones (3,4-DHPEA-EA - oleuropein aglycone; p-HPEA-EA - ligstrosideaglycone), as a result of the hydrolysis of a sugar molecule, which can be caused by β-glucosidaseactivity. The obtained aglycones can undergo isomerization to open dialdehydic forms. Dialdehydicforms in turn decarboxylate into the respective aglycones (3,4-DHPEA-EDA - dialdehydic formof decarboxymethyl oleuropein aglycone; p-HPEA-EDA - dialdehydic form of decarboxymethylligstroside aglycone). 3,4 DHPEA-EDA is often EVOO’s most abundant phenolic compound. Finally,the compounds hydroxytyrosol (3,4-DHPEA) and tyrosol (p-HPEA) are formed slowly by hydrolysis of

Molecules 2020, 25, 420 9 of 15
the ester linkage. The content of oleuropein, ligstroside and their derivatives was usually proportionallyrelated to the intensity of bitterness and pungency and the positive effects of EVOO on human health [30].The oxidative degradation of secoiridoids may follow both an enzymatic and a non-enzymaticdegradation pathway. In the former pathway, polyphenol oxidases (PPO) and peroxidases (POD)catalyse the oxidation of phenolic compounds to corresponding quinones [40]. In the latter pathway,which is connected to termination reactions of radical oxidation of triacylglycerols to peroxides andderivatives, the release of hydrogen atoms by phenolic compounds can inhibit the formation ofhydroperoxide radicals [41].
Our experimental data on the phenolic compound content (Table 4) showed that the secoiridoidsin the olive oil samples underwent a clear hydrolytic transformation during storage. This effect canbe related to the water content and water activity of the oil samples, without the involvement ofmicrobial activity. Indeed, the 3,4-DHPEA and p-HPEA contents increased during storage and thehigh level of water activity caused the greatest increase in the veiled oil samples. A hydrolytic increasein 3,4-DHPEA and p-HPEA contents has also been reported in the literature [16,18,42,43]. The R-Indexbehaviour consistently showed no variations in the hydrolytic status of secoiridoids for the FIL andF-HHP oil samples only (Figure 2).
Molecules 2019, 24, x FOR PEER REVIEW 3 of 16
The FIL and F-HHP oil samples were perceived by the panel test as bitterer and more pungent
than the veiled oil samples during storage (Table 2). This behaviour can be related to the phenolic
profile of olive oil, which is not the same as the phenolic profile of olive oil fruits, since numerous
transformation phenomena can occur during EVOO extraction processing and storage [37–39]. Since
secoiridoids are the phenolic compounds with the highest transfer rate from fruits to oil, the
predominant phenolic compounds in olive oil are oleuropein, ligstroside and their derivatives.
Oleuropein and ligstroside are thought to be subjected to transformation, resulting in hydrolytic and
oxidative changes of both an enzymatic and non-enzymatic nature. The hydrolytic transformation
pathway causes the rapid formation of aglycones (3,4-DHPEA-EA - oleuropein aglycone; p-HPEA-
EA - ligstroside aglycone), as a result of the hydrolysis of a sugar molecule, which can be caused by
β-glucosidase activity. The obtained aglycones can undergo isomerization to open dialdehydic forms.
Dialdehydic forms in turn decarboxylate into the respective aglycones (3,4-DHPEA-EDA -
dialdehydic form of decarboxymethyl oleuropein aglycone; p-HPEA-EDA - dialdehydic form of
decarboxymethyl ligstroside aglycone). 3,4 DHPEA-EDA is often EVOO’s most abundant phenolic
compound. Finally, the compounds hydroxytyrosol (3,4-DHPEA) and tyrosol (p-HPEA) are formed
slowly by hydrolysis of the ester linkage. The content of oleuropein, ligstroside and their derivatives
was usually proportionally related to the intensity of bitterness and pungency and the positive effects
of EVOO on human health [30]. The oxidative degradation of secoiridoids may follow both an
enzymatic and a non-enzymatic degradation pathway. In the former pathway, polyphenol oxidases
(PPO) and peroxidases (POD) catalyse the oxidation of phenolic compounds to corresponding
quinones [40]. In the latter pathway, which is connected to termination reactions of radical oxidation
of triacylglycerols to peroxides and derivatives, the release of hydrogen atoms by phenolic
compounds can inhibit the formation of hydroperoxide radicals [41].
Our experimental data on the phenolic compound content (Table 4) showed that the secoiridoids
in the olive oil samples underwent a clear hydrolytic transformation during storage. This effect can
be related to the water content and water activity of the oil samples, without the involvement of
microbial activity. Indeed, the 3,4-DHPEA and p-HPEA contents increased during storage and the
high level of water activity caused the greatest increase in the veiled oil samples. A hydrolytic
increase in 3,4-DHPEA and p-HPEA contents has also been reported in the literature [16,18,42,43].
The R-Index behaviour consistently showed no variations in the hydrolytic status of secoiridoids for
the FIL and F-HHP oil samples only (Figure 2).
Figure 2. R-index as a function of storage time for the four treatments (CON = veiled and notHHP-treated oil samples; HHP = veiled and HHP-treated oil samples; FIL = filtered and not HHP-treatedoil samples; F-HHP = filtered and HHP-treated oil samples). Error bars represent the standard errors.
Our experimental data showed that the secoiridoids also underwent oxidative degradation duringstorage, but this behaviour was primarily influenced by the absence of the significant radical oxidationof triacylglycerols in all of the olive oil samples. There was no decrease in the total phenolic compoundcontent, or the content of oleuropein, ligstroside and their derivatives (Table 4), conversely to someliterature data [16,20] which have shown a decrease in phenolic compound contents due to theirantioxidant role. Instead, after 15 days of storage a difference quickly occurred between the contents ofoleuropein and its derivatives and 3,4-DHPEA-EDA of the filtered and veiled oil samples (Table 4).The oxidative enzymatic degradation of secoiridoids by endogenous PPO and POD may be involvedin the decrease of the above phenolic compounds in the veiled oil samples [44]; this phenomenonmay be consistent with both the effect of the water content/water activity and the panellists’ differentperceptions of bitterness and pungency between the filtered and veiled oil samples.

Molecules 2020, 25, 420 10 of 15
4. Materials and Methods
4.1. Trials
Four trials were carried out during November 2017. Olive fruits of the Frantoio cultivar (approx.300 kg for each trial) were harvested in the Greve in Chianti area (Florence, Italy) and pressed inan industrial oil mill (Azienda Agricola La Ranocchiaia, Florence, Italy). In brief, the plant wasequipped with an olive cleaner, followed by a blade cutter crusher, and 300 kg sealed vertical malaxers.The olive paste was kneaded in the malaxers for 20 min at 18 ◦C, and extracted by a two-phasehorizontal centrifuge (i.e., decanter) with 700 kg/h working capacity. The batches of olive oil werecollected at the end of the “decanter” and immediately split as follows: half was immediately filtered,while the other half was left veiled. A filter press equipped with eleven 40 × 40 cm cardboard sheets(CKP V8, Cordenons SpA, Pordenone, Italy) was used. The technical specifications, which wereprovided by the filter producer, were as follows: weight, 1050 g/m2; thickness, 3.75 mm; nominalcut-off filtration, 12 µm; nominal flow rate, 160 L min−1 m−2. Then, all of the olive oil samples werebottled in 250 mL transparent PET bottles and half of the bottles underwent HHP treatment. A JBTAvureTM HPP industrial plant (HPP Italia srl, Traversetolo, Parma, Italy) was used. During the HHPtreatment, the pressure was increased from atmospheric pressure to a working pressure of 608 MPain 200 s, the working pressure was maintained for 360 s and then the oil samples were returned,almost instantaneously, to atmospheric pressure. The HHP system remained at 15 ◦C, which was theminimum temperature to prevent the olive oil from freezing during the decompression stage.
Therefore, the trials resulted in a full factorial design with four specimens: (i) not filtered and notHHP-treated olive oil samples, (ii) filtered and not HHP-treated olive oil samples, (iii) not filtered andHHP-treated olive oil samples, (iv) filtered and HHP-treated olive oil samples.
All of the olive oil samples were transferred to the laboratory; they were immediately analysed tomeasure some turbidity characterization parameters (i.e., degree of turbidity, water content, wateractivity, solid particle content, microbial cell count) and then subjected to the storage tests.
4.2. Storage Conditions
All of the olive oil samples were stored in a chamber (1.3 × 1.0 × 0.8 m) with the internal wallscovered with reflective material. The operating conditions were as follows: constant temperature of20 ◦C and light intensity of 1900 lux (Master TL-D 90 Graphica lamp, 35W/390, Philips, Amsterdam,The Netherlands) for 8 h per day. The samples were stored in a random position with adequate spacebetween the transparent bottles, and their positions were changed every two weeks. The olive oilsamples were analysed after 15 days, 1 month and 6 months of storage. The analyses at 15 days and1 months were performed to monitor rapid changes due to microorganisms, while the analysis after 6months of stored were performed to monitor slow changes in the olive oil chemical profile.
4.3. Analyses
The acidity (% oleic acid), peroxide value (meq O2 kg−1) and UV spectroscopic indices (K232, K270
and ∆K) were measured according to the official EU method and subsequent amendments [45].The panel test was carried out according to the official IOC method [46]. The panel was made up
of five men and three women, aged from 28 to 57; all of the panellists were non-smokers and had beentrained following the official IOC procedure. The panellists worked for the Taste Commission of theMinistero delle Politiche Agricole Alimentari, Forestali e del Turismo (MIPAAAFT - Italian Ministry ofAgri-Food and Forestry Policy and Tourism).
The degree of turbidity was measured in nephelometric turbidity units (NTU) using a HachModel 2100 turbidimeter (Hach, Loveland, CO, USA). About 25 g of the oil samples were put in thestandard glass vessel, which was inserted in the closed vessel chamber of the turbidimeter; the degreeof turbidity was measured at equilibrium after approx. 1 h.

Molecules 2020, 25, 420 11 of 15
Water content (% w/w) was analysed using a Karl Fischer Kit for visual water determinationwithout a titrator (37858 HYDRANAL—Moisture Test Kit, Honeywell FlukaTM, Bucharest, Romania).The oil sample (1 mL) was dissolved in previously neutralized HYDRANAL—Solvent E, and thetitrating reagent (HYDRANAL—Titrant 5E) was added until the equivalence point was reached.
Water activity (Aw) was measured using a Rotronic Hygroskop DT hygrometer (Michell Italia Srl,Milan, Italy). The samples (approx. 6.5 mL) were placed in the standard sample cups and the wateractivity was measured at equilibrium after approx. 12 h.
The solid particle content was measured using the method described by the literature [15]. A 5 galiquot of filtered oil was vacuum-filtered to saturate Whatman grade 1 filter paper (Merck KGaA,Darmstadt, Germany). The same filter paper was used to filter approx. 30 g of the oil samples andthen it was weighed using an analytical balance. The solid particle content was calculated by weighingthe difference and quantified in % w/w.
The microorganisms were enumerated according to the method reported by the literature [47],with some modifications: an aliquot of each sample (i.e., approx. 20 mL) was taken from each bottle insterile conditions and filtered through a 0.45 µm sterile nitrocellulose membrane. Then, the membranewas transferred into a 50 mL sterile Falcon tube containing 20 mL of sterile physiological solution(NaCl 0.85%), and homogenized using an UltraTurrax (mod. T25 homogenizer, IKA, Milan, Italy). Ofeach homogenized sample, 200 µL serial dilutions were plated onto a YPD agar medium. After 48–72h of incubation at 28 ◦C, the colonies with different morphologies were counted and, for each kind,the cell morphology was observed through a light microscope.
The extraction, identification and determination of the phenolic compounds were performedby RP-HPLC using the official IOC method [48]. Briefly the HPLC apparatus consisted an Agilent1200 series system (Agilent technoligies, Santa Clara, CA, USA) composed by a quaternary pumpequipped with a diode-array detector and autosampler. The analytical conditions were: HPLC column:LiChroCART®250-4.6 Purospher®STAR RP-18E, 5 µm (250 × 4.6 mm id, Merck KGaA) equipped witha: LiChroCART®4-4 Purospher®STAR RP-18E, 5 µm pre-column (4 × 4 mm); eluition condition: water0.2% H3PO4 (v/v), methanol, acetonitrile gradient following the official IOC method [48]; injectionvolume: 20 µL; wavelength: 280 nm. Syringic acid was used as the internal standard; syringicacid and tyrosol were chosen as the external calibration standards to evaluate the relative responsefactor (i.e., RRF = 4.87). Phenolic compounds were quantified in mgtyrosol kgoi
−1. The total phenoliccompound content (mgtyrosol kgoi
−1) was determined asthe sum of the peak areas of phenols recordedat 280 nm.
The R-Index, which was suggested by Fiorini et al. [49] to measure the hydrolytic status ofsecoiridoids, was also determined as follows:
R− Index =(Tyrosol content + Hydroxytyrosol content)
(Tyrosol content + Hydroxytyrosol content + Secoiridoid derivative content)(1)
The volatile organic compound content of the olive oil was determined according to the methoddescribed by the literature [50], using HS-SPME-GC-MS. Analyses were carried out by weighing4.3 g of the sample and 0.1 g of an internal standard mixture (ISTD MIX) into 20 mL screw-cap vialsfitted with a PTFE/silicone septum. After 5 min of equilibrium at 60 ◦C, the SPME fibre (50/30 µmDVB/CAR/PDMS by Supelco, Darmstadt, Germany) was exposed in the vial headspace for 20 minwhile being subjected to orbital shaking (500 rpm). Then, the fibre was immediately desorbed for2 min in a gas chromatograph injection port operating in splitless mode at 260 ◦C. The identificationof the volatile compounds was performed by gas chromatography coupled with quadrupole massspectrometry using a GC-MS Scientific Trace system (Thermo Fisher, Waltham, MA, USA) equippedwith a 30 m × 0.25 mm ID, 0.25 µm DF ZB-FFAP capillary column (Phenomenex, Torrance, CA, USA).The initial column temperature was held at 36 ◦C for 10 min, then increased to 156 ◦C at 4 ◦C/min,then to 260 ◦C at 10 ◦C/min, and finally to 250 ◦C at 10 ◦C/min, with a hold time of 2 min. Helium wasused as the carrier gas at a constant flow of 0.8 mL/min. The temperature of both the ion source and the
Molecules 2020, 25, 420 12 of 15
transfer line was 250 ◦C. The mass detector was operated in scan mode within a 30–330 Th mass rangeat 1500 Th/s, with an IE energy of 70 eV. Compounds were identified and quantified (mg/kg) throughcomparison of their mass spectra and retention times with those of the ISTD MIX. These consisted of thefollowing 11 compounds: 3,4-dimethylphenol, 4-methyl-2-pentanol, hexanoic acid-d11, 1-butanol-d10,ethyl acetate-d8, toluene-d8, ethyl hexanoate-d11, acetic acid-2,2,2-d3, 6-chloro-2-hexanone, 3-octanoneand trimethylacetaldehyde.
All the above measurements were carried out in triplicate.
4.4. Data Processing
A 3-way ANOVA was performed on each variable to assess the effect of filtration, HHP, storagetime and their interactions. The ANOVA showed significant differences (p < 0.05) which were studiedas follows: first of all, the significant interactions between two variables were studied, then thesignificance of the three main effects was assessed with a Tukey-HSD post hoc test.
5. Conclusions
This study evaluated the EVOO qualitative changes during the storage due to microbialcontamination and water content/activity. The microbial contamination level (i.e., mainly yeasts) inpresence of a high level of water activity (> 0.6 Aw) could be related to the formation of volatile aromacompounds, which were responsible for the “fusty” sensory defect. High water activity values could berelated to an increase in the degradation rate of LOX compounds; the (E)-2-hexanal content decreased,causing a decrease in the “fruity” positive sensory attribute. High water activity values could be alsorelated to an increase in the hydrolytic degradation rate of the phenolic compounds; the 3,4-DHPEA andp-HPEA contents increased, causing an increase in the hydrolytic status (R-Index) of the secoiridoids.Thus, microbial contamination and water activity of the oil immediately after extraction could beconsidered critical control parameters to identify olive oil more prone to degradation during storage.
Since in our study the radical oxidation of the triacylglycerols during storage was negligible in allof the oil samples during 6 months of storage, no relevant potential effects of water activity on the EUlegal limits or non-enzymatic oxidative degradation of secoiridoids were evidenced. On the other hand,the absence of the radical oxidation of triacylglycerols could have revealed evidence of the followingtwo degradation phenomena, which would require supplementary studies: (i) microbial activity inthe presence of a high level of water activity, which rapidly caused the formation of C7, C8, C9 andC10 volatile compounds and the “rancid” sensory defect; (ii) an oxidative enzymatic degradationof secoiridoids in the presence of a high level of water activity, which rapidly caused a decrease in3,4-DHPEA-EDA and different perceptions by the panellists of the “bitter” and “pungent” positivesensory attributes.
In the end, when an organization wants to produce VEVOO in order to cause a positive visualeffect on consumer expectations, the oil turbidity has to be planned and controlled, starting from(i) adjustment of the water content with suitable application of the normal separation treatments afteroil extraction by “decanter”; (ii) good manufacturing practices to minimize microbial contaminationduring the olive oil processing chain.
Supplementary Materials: The following are available online at http://www.mdpi.com/1420-3049/25/2/420/s1,Table S1: report the mean and standard deviation of free fatty acids content, peroxide value and UV indexesfor the four specimens of olive oil samples during storage, Table S2: Groups of the volatile organic compoundsidentified and measured in the oil samples.
Author Contributions: L.G., B.Z. and A.P. wrote the manuscript draft, conducted the statistical analyses,interpreted and discussed the results. C.B., L.G. and L.C. conducted the microbiological and the chemical analyses.G.A. conducted the sensory tests. P.M. and L.G. conducted the filtration tests. All authors reviewed the manuscript.All authors have read and agreed to the published version of the manuscript.
Funding: This study was supported by the AGER 2 Project, grant No.2016-0174, COMPETiTiVE—Claims of Oliveoil to IMProvE The market ValuE of the product.

Molecules 2020, 25, 420 13 of 15
Acknowledgments: The authors would like to thanks the HPP Italia company (Traversetolo, PR, Italy) for hostingthe HHP trials.
Conflicts of Interest: The authors declare no competing interests.
Abbreviations
EVOO Extra virgin olive oilVEVOO veiled extra virgin olive oilFEVOO filtered extra virgin olive oilHHP olive oil treated with high hydrostatic pressureFIL filtered olive oilF-HPP olive oil filtered and treated with HHPCON not treated olive oilLOX Lipoxygenase3,4-DHPEA-EDA dialdehydic form of decarboximethyl elenolic acid linked to hydroxytyrosol3,4-DHPEA-EA oleuropein aglycones3,4-DHPEA Hydroxytyrosolp-HPEA-EDA dialdehydic form of decarboxymethyl ligstroside aglyconesp-HPEA-EA ligstroside aglyconesp-HPEA TyrosolLOX LipoxygenaseYPD Yeast Extract–Peptone–Dextrose Broth
References
1. European Commission Commission Implementing Regulation (EU) No 29/2012 of 13 January 2012 onmarketing standards for olive oil (codification). Off. J. Eur. Union 2013, 39, 1–8.
2. Aparicio, R.; Morales, M.T.; García-González, D.L. Towards new analyses of aroma and volatiles to understandsensory perception of olive oil. Eur. J. Lipid Sci. Technol. 2012, 114, 1114–1125. [CrossRef]
3. Kotti, F.; Cerretani, L.; Gargouri, M.; Chiavaro, E.; Bendini, A. Evaluation of the volatile fraction of commercialvirgin olive oils from Tunisia and italy: Relation with olfactory attributes. J. Food Biochem. 2011, 35, 681–698.[CrossRef]
4. Vissers, M.N.; Zock, P.L.; Katan, M.B. Bioavailability and antioxidant effects of olive oil phenols in humans:A review. Eur. J. Clin. Nutr. 2004, 58, 955–965. [CrossRef] [PubMed]
5. EFSA Panel on Dietetic Products, Nutrition and Allergies (NDA). Scientific Opinion on the Substantiation ofHealth Claims Related to Polyphenols in Olive and Protection of LDL Particles from Oxidative Damage (ID 1333, 1638,1639, 1696, 2865), Maintenance of Normal Blood HDL Cholesterol Concentrations (ID 1639), Maintenance of NormalBlood Pressure (ID 3781), “Anti-Inflammatory Properties” (ID 1882), “Contributes to the Upper Respiratory TractHealth” (ID 3468), “Can Help to Maintain a Normal Function of Gastrointestinal Tract” (3779), and “Contributes toBody Defences; European Food Safety Authority (EFSA): Parma, Italy, 2011.
6. Bellumori, M.; Cecchi, L.; Innocenti, M.; Clodoveo, M.L.; Corbo, F.; Mulinacci, N. The EFSA health claim onolive oil polyphenols: Acid hydrolysis validation and total hydroxytyrosol and tyrosol determination inItalian virgin olive oils. Molecules 2019, 24, 2179. [CrossRef] [PubMed]
7. Roselli, L.; Clodoveo, M.L.; Corbo, F.; De Gennaro, B. Are health claims a useful tool to segment the categoryof extra-virgin olive oil? Threats and opportunities for the Italian olive oil supply chain. Trends Food Sci. Technol.2017, 68, 176–181.
8. Koidis, A.; Triantafillou, E.; Boskou, D. Endogenous microflora in turbid virgin olive oils and thephysicochemical characteristics of these oils. Eur. J. Lipid Sci. Technol. 2008, 110, 164–171. [CrossRef]
9. Breschi, C.; Guerrini, L.; Domizio, P.; Ferraro, G.; Calamai, L.; Canuti, V.; Masella, P.; Parenti, A.; Fratini, E.;Fia, G.; et al. Physical, Chemical, and Biological Characterization of Veiled Extra Virgin Olive Oil Turbidityfor Degradation Risk Assessment. Eur. J. Lipid Sci. Technol. 2019, 121, 1900195. [CrossRef]
10. Lercker, G.; Frega, N.; Bocci, F.; Servidio, G. “Veiled” Extra-Virgin Olive Oils: Dispersion Response Relatedto Oil Quality. J. Am. Oil Chem. Soc. 1994, 71, 657–658. [CrossRef]

Molecules 2020, 25, 420 14 of 15
11. Frega, N.; Mozzon, M.; Lercker, G. Effects of free fatty acids on oxidative stability of vegetable oil. J. Am. OilChem. Soc. 1999, 76, 325–329. [CrossRef]
12. Tsimidou, M.Z.; Georgiou, A.; Koidis, A.; Boskou, D. Loss of stability of “veiled” (cloudy) virgin olive oils instorage. Food Chem. 2005, 93, 377–383. [CrossRef]
13. Koidis, A.; Boskou, D. The contents of proteins and phospholipids in cloudy (veiled) virgin olive oils. Eur. J.Lipid Sci. Technol. 2006, 108, 323–328. [CrossRef]
14. Lozano-Sánchez, J.; Cerretani, L.; Bendini, A.; Gallina-Toschi, T.; Segura-Carretero, A.; Fernández-Gutiérrez, A.New Filtration Systems for Extra-Virgin Olive Oil: Effect on Antioxidant Compounds, Oxidative Stability,and Physicochemical and Sensory Properties. J. Agric. Food Chem. 2012, 60, 3754–3762. [CrossRef] [PubMed]
15. Ciafardini, G.; Zullo, B.A. Virgin olive oil yeasts: A review. Food Microbiol. 2018, 70, 245–253. [CrossRef][PubMed]
16. Fregapane, G.; Lavelli, V.; León, S.; Kapuralin, J.; Desamparados Salvador, M. Effect of filtration on virginolive oil stability during storage. Eur. J. Lipid Sci. Technol. 2006, 108, 134–142. [CrossRef]
17. Cayuela, J.A.; Gómez-Coca, R.B.; Moreda, W.; Pérez-Camino, M.C. Sensory defects of virgin olive oil froma microbiological perspective. Trends Food Sci. Technol. 2015, 43, 227–235. [CrossRef]
18. Fortini, M.; Migliorini, M.; Cherubini, C.; Cecchi, L.; Guerrini, L.; Masella, P.; Parenti, A. Shelf life and qualityof olive oil filtered without vertical centrifugation. Eur. J. Lipid Sci. Technol. 2016, 118, 1213–1222. [CrossRef]
19. Jabeur, H.; Zribi, A.; Bouaziz, M. Changes in chemical and sensory characteristics of Chemlali extra-virginolive oil as depending on filtration. Eur. J. Lipid Sci. Technol. 2017, 119, 1–10. [CrossRef]
20. Veneziani, G.; Esposto, S.; Minnocci, A.; Taticchi, A.; Urbani, S.; Selvaggini, R.; Sordini, B.; Sebastiani, L.;Servili, M. Compositional differences between veiled and filtered virgin oive oils during a simulated shelflife. LWT 2018, 94, 87–95. [CrossRef]
21. Guerrini, L.; Masella, P.; Migliorini, M.; Cherubini, C.; Parenti, A. Addition of a steel pre-filter to improveplate filter-press performance in olive oil filtration. J. Food Eng. 2015, 157, 84–87. [CrossRef]
22. Zeuthen, P.; Bøgh-Sørensen, L. Food Preservation Techniques; CRC Press: Boston MA, USA, 2003; p. 580.23. Guerrini, L.; Migliorini, M.; Giusti, M.; Parenti, A. The influence of crusher speed on extra virgin olive oil
characteristics. Eur. J. Lipid Sci. Technol. 2017, 119, 1–7. [CrossRef]24. Guerrini, S.; Mari, E.; Migliorini, M.; Cherubini, C.; Trapani, S.; Zanoni, B.; Vincenzini, M.; Section, M.
Investigation on microbiology of olive oil extraction process. Ital. J. Food Sci. 2015, 27, 236–247.25. Angerosa, F.; Servili, M.; Selvaggini, R.; Taticchi, A.; Esposto, S.; Montedoro, G. Volatile compounds in virgin
olive oil: Occurrence and their relationship with the quality. J. Chromatogr. A 2004, 1054, 17–31. [CrossRef]26. Migliorini, M.; Mugelli, M.; Cherubini, C.; Viti, P.; Zanoni, B. Influence of O2 on the quality of virgin olive oil
during malaxation. J. Sci. Food Agric. 2006, 2146, 2140–2146. [CrossRef]27. Rallo, L.; El Riachy, M.; Priego-capote, F.; Leo, L.; Rabanales, C.; De Mutis, E.C.; Madrid-ca, C.; Rabanales, C.;
De Curie, E.M.; Madrid-ca, C. Review Article Hydrophilic antioxidants of virgin olive oil. Part 2: Biosynthesisand biotransformation of phenolic compounds in virgin olive oil as affected by agronomic and processingfactors. Eur. J. Lipid Sci. Technol. 2011, 113, 692–707.
28. Ciafardini, G.; Zullo, B.A. Survival of micro-organisms in extra virgin olive oil during storage. Food Microbiol.2002, 19, 105–109. [CrossRef]
29. Bakhouche, A.; Lozano-Sánchez, J.; Ballus, C.A.; Martínez-García, M.; Velasco, M.G.; Govantes, Á.O.;Gallina-Toschi, T.; Fernández-Gutiérrez, A.; Segura-Carretero, A. Monitoring the moisture reduction andstatus of bioactive compounds in extra-virgin olive oil over the industrial filtration process. Food Control.2013, 40, 292–299. [CrossRef]
30. Zanoni, B. Which processing markers are recommended for measuring and monitoring the transformationpathways of main components of olive oil? Ital. J. Food Sci. 2014, 26, 3–12.
31. Mossel, D.A.A.; Corry, J.E.L.; Strujik, C.B.; Baird, R.M. Essential of the Microbiology of Foods: A Textbook forAdvanced Studies; John & Wiley Sons: Chichester, UK, 1995; p. 735.
32. Xenakis, A.; Papadimitriou, V.; Sotiroudis, T.G. Colloidal structures in natural oils. Curr. Opin. ColloidInterface Sci. 2010, 15, 55–60. [CrossRef]
33. Budilarto, E.S.; Kamal-Eldin, A. The Supramolecular Chemistry of Lipid Oxidation and Antioxidation inBulk Oils. Eur. J. Lipid Sci. Technol. 2015, 117, 1095–1137. [CrossRef]
34. BrkicBubola, K.; Lukic, M.; Mofardin, I.; Butumovic, A.; Koprivnjak, O. Filtered vs. naturally sedimentedand decanted virgin olive oil during storage: Effect on quality and composition. LWT 2017, 84, 370–377.

Molecules 2020, 25, 420 15 of 15
35. Aparicio-Ruiz, R.; Garcia-Gonzalez, D.L.; Oliver-Pozo, C.; Tena, N.; Morales, M.; Aparicio, R. Phenolic profileof virgin olive oils with and without sensory defects: Oils with non-oxidative defects exhibit a considerableconcentration of phenols. Eur. J. Lipid Sci. Technol. 2016, 118, 299–307. [CrossRef]
36. Clodoveo, M.L.; Hbaieb, R.H.; Kotti, F.; Mugnozza, G.S.; Gargouri, M. Mechanical strategies to increasenutritional and sensory quality of virgin olive oil by modulating the endogenous enzyme activities. Compr. Rev.Food Sci. Food Saf. 2014, 13, 135–154. [CrossRef]
37. Klen, T.J.; Wondra, A.G.; Sivilotti, P. Olive Fruit Phenols Transfer, Transformation, and -Partition Trail duringLaboratory-Scale Olive Oil Processing. J. Agric. Food Chem. 2015, 63, 4570–4579. [CrossRef] [PubMed]
38. Trapani, S.; Breschi, C.; Cecchi, L.; Guerrini, L.; Mulinacci, N.; Parenti, A.; Canuti, V.; Picchi, M.; Caruso, G.;Gucci, R.; et al. Indirect indices of oxidative damage to phenolic compounds for the implementation of olivepaste malaxation optimization charts. J. Food Eng. 2017, 207, 24–34. [CrossRef]
39. Zanoni, B.; Breschi, C.; Canuti, V.; Guerrini, L.; Masella, P.; Picchi, M.; Parenti, A. An original computerprogram (MalaxAction 1.0) to design and control olive paste malaxation under exposure to air. J. Food Eng.2018, 234, 57–62. [CrossRef]
40. Migliorini, M.; Cecchi, L.; Cherubini, C.; Trapani, S.; Cini, E.; Zanoni, B. Understanding degradation ofphenolic compounds during olive oil processing by inhibitor addition. Eur. J. Lipid Sci. Technol. 2012, 114,942–950. [CrossRef]
41. Frankel, E.N. Recent advances in lipid oxidation. J. Sci. Food Agric. 1991, 54, 495–511. [CrossRef]42. Brenes, M.; García, A.; García, P.; Garrido, A. Acid hydrolysis of secoiridoid aglycons during storage of
virgin olive oil. J. Agric. Food Chem. 2001, 49, 5609–5614. [CrossRef]43. Guerrini, L.; Luca Pantani, O.; Parenti, A. The impact of vertical centrifugation on olive oil quality. J. Food
Process. Eng. 2017, 40, e12489. [CrossRef]44. García-Rodríguez, R.; Romero-Segura, C.; Sanz, C.; Sánchez-Ortiz, A.; Pérez, A.G. Role of polyphenol oxidase
and peroxidase in shaping the phenolic profile of virgin olive oil. Food Res. Int. 2011, 44, 629–635. [CrossRef]45. European Union Commission implementing regulation (EC) No 1989/2003 of 6 November 2003 amending
regulation No 2568/91 on the characertistics of olive oil and olive-residue oil and on the relevant methods ofanalysis. Off. J. Eur. Union 2003, L295, 57–77.
46. International Olive Council. Sensory Analysis of Olive Oil. Method for the Organoleptic Assessment of VirginOlive Oil; International Olive Council: Madrid, Spain, 2018.
47. Zullo, B.A.; Cioccia, G.; Ciafardini, G. Distribution of dimorphic yeast species in commercial extra virginolive oil. Food Microbiol. 2010, 27, 1035–1042. [CrossRef] [PubMed]
48. International Olive Council. Determination of Biophenols in Olive Oils by HPLC; International Olive Council:Madrid, Spain, 2017.
49. Fiorini, D.; Boarelli, M.C.; Conti, P.; Alfei, B.; Caprioli, G.; Ricciutelli, M.; Sagratini, G.; Fedeli, D.;Gabbianelli, R.; Pacetti, D. Chemical and sensory differences between high price and low price extravirgin olive oils. Food Res. Int. 2018, 105, 65–75. [CrossRef] [PubMed]
50. Fortini, M.; Migliorini, M.; Cherubini, C.; Cecchi, L.; Calamai, L. Multiple internal standard normalizationfor improving HS-SPME-GC-MS quantitation in virgin olive oil volatile organic compounds (VOO-VOCs)profile. Talanta 2017, 165, 641–652. [CrossRef] [PubMed]
Sample Availability: Samples of the compounds are not available from the authors.
© 2020 by the authors. Licensee MDPI, Basel, Switzerland. This article is an open accessarticle distributed under the terms and conditions of the Creative Commons Attribution(CC BY) license (http://creativecommons.org/licenses/by/4.0/).