understanding non-viral nucleic acid delivery vehicles ......daniel crawford for all the...
TRANSCRIPT

Understanding Non-viral Nucleic Acid Delivery Vehicles with Different
Charge Centers and Degradation Profiles
Hao Lu
Virginia Polytechnic Institute and State University
Master of Science in Chemistry
Theresa M. Reineke
T. Daniel Crawford
Webster L. Santos
May 10, 2010
Blacksburg, Virginia
Keywords: Non-viral Nucleic Acid Delivery, Biodegradable Polymer, Guanidine, Self-
degradable Polymer, Amide Hydrolysis, Poly(glycoamidoamine), Gene Expression

Understanding Non-viral Nucleic Acid Delivery Vehicles with Different
Charge Centers and Degradation Profiles
Abstract
Different structures of non-viral cationic polymer delivery vehicles, including charge
center type, molecular weight and degradability, could significantly affect toxicity, release of
nucleic acid and transfection efficiency.
Poly(glycoamidoamine)s (PGAAs) contained different carbohydrate and secondary
amine moieties and showed high transfection efficiency to different cell lines in a nontoxic
manner. The “proton sponge hypothesis” has attempted to relate the buffering capacity to
endosomal release of polyethylenimine (PEI) based polyplexes, which could contribute to high
transfection efficiency. Secondary amine structures rendered PGAAs buffering capacity around
physiological pH. To test the feasibility of the mechanism for PGAAs, new no buffering capacity
guanidine or methylguanidine containing poly(glycoamidoguanidine)s (PGAGs) were
synthesized. PGAGs formed stable polyplexes with pDNA from N/P (# secondary amine or
guanidine group on polymer backbone / # phosphate group on pDNA backbone) ratio 3. PGAG
based polyplexes expressed low cytotoxicity and were internalized by 90% of cells at N/P 25.
Furthermore, two PGAG based polyplexes showed higher transfection efficiency from N/P 5 to
30 than their PGAA based analogs. These data suggested the low transfection could be due to the
difficulties to release pDNA from polyplexes; also, the “proton sponge theory” could not explain
the higher transfection efficiency by some PGAGs.

iii
Degradation of delivery vehicles could potentially release pDNA in cells and increase
transfection efficiency. PGAAs degraded rapidly at physiological conditions and the proposed
mechanism was amide hydrolysis. Typically, amide groups are stable and hydrolyze slowly in
absence of enzyme. Different models mimicking PGAAs were synthesized to study the fast
hydrolysis. Amide groups showed asymmetric hydrolysis. Different hydrolysis behaviors
suggested neighboring group participation of two terminal groups to induce rapid amide
hydrolysis. These new models could potentially be used to design new polymer delivery vehicles
with various degradation profiles.

iv
Acknowledgements
Firstly, I would like to thank Dr. Theresa M. Reineke for her instruction, care and
encouragement during my research. She shows me how to use time more efficiently. She also
establishes a warm and cooperative environment in the lab. Discussion with Dr. Reineke helps
me to think more independently and generate new ideas. Secondly, I would like to thank Dr. T.
Daniel Crawford for all the computational work on the amide hydrolysis project. I also would
like to thank Dr. Webster L. Santos for all the organic guidance during my class and research.
Special thanks are to Dr. Vijay P. Taori for his guidance and encouragement when
collaborating on the two projects. I am grateful to Dr. Patrick McLendon and Giovanna
Grandinetti for their help in biological experiments. I also want to thank Antons Sizovs for his
insightful discussion. I am also thankful to all members in Dr. Reineke’s group for all their
support and collaboration.
Finally, I would like to thank my family for all their support and care in my life and
career. Special thanks go to my father (Baoguang), mother (Zhen), grandpa (Shangpin) and
grandma (Shujiu) for all their encouragement when I was depressed and all sacrifices in my life.

v
Table of Contents
Chapter 1 – Novel Cationic Polymers for Nucleic Acids Delivery • • • • • • • • • • • • • • • • • • • 1
1.1 Polymer Vehicles for Nucleic Acid Delivery • • • • • • • • • • • • • • • • • • • • • • • • • • • • 4
1.2 Poly(glycoamidoamine)s (PGAA) • • • • • • • • • • • • • • • • • • • • • • • • • • • • • • • • • • • 11
1.3 Biodegradable Polymers • • • • • • • • • • • • • • • • • • • • • • • • • • • • • • • • • • • • • • • • • 15
1.4 Conclusions • • • • • • • • • • • • • • • • • • • • • • • • • • • • • • • • • • • • • • • • • • • • • • • • • 17
Chapter 2 - Structure-Activity Examination of Poly(glycoamidoguanidine)s: Glycopolycations
Containing Guanidine Units for Nucleic Acid Delivery • • • • • • • • • • • • • • • • • • • • • • • • • • 19
2.1 Introduction • • • • • • • • • • • • • • • • • • • • • • • • • • • • • • • • • • • • • • • • • • • • • • • • • 20
2.2 Experimental Procedures • • • • • • • • • • • • • • • • • • • • • • • • • • • • • • • • • • • • • • • • • 23
2.3 Results and Discussion • • • • • • • • • • • • • • • • • • • • • • • • • • • • • • • • • • • • • • • • • • 34
2.4 Conclusions • • • • • • • • • • • • • • • • • • • • • • • • • • • • • • • • • • • • • • • • • • • • • • • • • 48
Chapter 3 - Fast Amide Hydrolysis: Potential to Increase Transfection Efficiency with Novel
Self-degrading Structures • • • • • • • • • • • • • • • • • • • • • • • • • • • • • • • • • • • • • • • • • • • • • 50
3.1 Introduction • • • • • • • • • • • • • • • • • • • • • • • • • • • • • • • • • • • • • • • • • • • • • • • • • 51
3.2 Experimental Procedures • • • • • • • • • • • • • • • • • • • • • • • • • • • • • • • • • • • • • • • • • 55
3.3 Results and Discussion • • • • • • • • • • • • • • • • • • • • • • • • • • • • • • • • • • • • • • • • • 64
3.4 Conclusions • • • • • • • • • • • • • • • • • • • • • • • • • • • • • • • • • • • • • • • • • • • • • • • • • 84
Chapter 4 - Future Directions • • • • • • • • • • • • • • • • • • • • • • • • • • • • • • • • • • • • • • • • • • 85
4.1 Introduction • • • • • • • • • • • • • • • • • • • • • • • • • • • • • • • • • • • • • • • • • • • • • • • • • 86
4.2 New Fast Degrading PGAAs for Nucleic Acid Delivery • • • • • • • • • • • • • • • • • • • • 86
References • • • • • • • • • • • • • • • • • • • • • • • • • • • • • • • • • • • • • • • • • • • • • • • • • • • • • • • 88

vi
List of Tables
2.1 The weight average molecular weight (Mw), polydispersity index (PDI) and degree of
polymerization (DP) for PGAGs, G1 and T1 • • • • • • • • • • • • • • • • • • • • • • • • • • • • • • • • • 38
3.1 Hydrolysis of one-side amide hydrolysis for different models • • • • • • • • • • • • • • • • • 53
3.2 Hydrolysis kinetics of different models • • • • • • • • • • • • • • • • • • • • • • • • • • • • • • • 73
3.3 pKa values of conjugate acids of compound 9 and 12 • • • • • • • • • • • • • • • • • • • • • • 77
List of Figures
1.1 Formation of polyplexes followed by cellular uptake. Figure is from Ref. 19 • • • • • • • 14
1.2 Poly(γ-(4-aminobutyl)-L-glycolic acid) (PAGA)14,62 • • • • • • • • • • • • • • • • • • • • • • 16
1.3 Formation of peptide DNA polyplexes. Figure is from Ref. 67 • • • • • • • • • • • • • • • • 17
2.1 Gel electrophoresis shift assay for the PGAGs • • • • • • • • • • • • • • • • • • • • • • • • • • 39
2.2 The PGAG polyplex size and Zeta potential • • • • • • • • • • • • • • • • • • • • • • • • • • • • 41
2.3 HeLa cell uptake of Cy5-pDNA delivered with the PGAG and PGAA polymers
complexed with pDNA at N/P ratio 10 and 25 • • • • • • • • • • • • • • • • • • • • • • 43
2.4 Luciferase gene expression observed with polyplexes formed with the PGAGs, PGAAs,
and the positive controls in reduced serum culture medium • • • • • • • • • • • • • • • • • • 45
2.5 Luciferase gene expression observed with polyplexes formed with the PGAGs, PGAAs,
and the positive controls in serum medium • • • • • • • • • • • • • • • • • • • • • • • • • • • • • 46
2.6 HeLa cells viability after exposed to polyplexes from N/P 5 to 30 in serum free media
for 48 hours • • • • • • • • • • • • • • • • • • • • • • • • • • • • • • • • • • • • • • • • • • • • • • • • • 48
3.1 L-tartrate or succinate based small molecule models • • • • • • • • • • • • • • • • • • • • • • 52

vii
3.2 1H NMR of compound 9 during hydrolysis at different time. Figure adapted from Dr.
Vijay P. Taori’s dissertation • • • • • • • • • • • • • • • • • • • • • • • • • • • • • • • • • • • • • • 54
3.3 Possible changeable parameters for hydrolysis models • • • • • • • • • • • • • • • • • • • • • 64
3.4 1H NMR of compound 20 during hydrolysis • • • • • • • • • • • • • • • • • • • • • • • • • • • 66
3.5 Hydrolysis kinetics of compound 20 • • • • • • • • • • • • • • • • • • • • • • • • • • • • • • • • • 66
3.6 1H NMR of compound 21 during hydrolysis • • • • • • • • • • • • • • • • • • • • • • • • • • • 67
3.7 Hydrolysis kinetics of compound 21 • • • • • • • • • • • • • • • • • • • • • • • • • • • • • • • • • 67
3.8 1H NMR of compound 23 during hydrolysis • • • • • • • • • • • • • • • • • • • • • • • • • • • 68
3.9 Hydrolysis kinetics of compound 23 • • • • • • • • • • • • • • • • • • • • • • • • • • • • • • • • • 68
3.10 1H NMR of compound 25 during hydrolysis • • • • • • • • • • • • • • • • • • • • • • • • • • • 69
3.11 Hydrolysis kinetics of compound 25 • • • • • • • • • • • • • • • • • • • • • • • • • • • • • • • • • 69
3.12 1H NMR of compound 27 during hydrolysis • • • • • • • • • • • • • • • • • • • • • • • • • • • 70
3.13 Hydrolysis kinetics of compound 27 • • • • • • • • • • • • • • • • • • • • • • • • • • • • • • • • • 70
3.14 1H NMR of compound 28 during hydrolysis • • • • • • • • • • • • • • • • • • • • • • • • • • • 71
3.15 Hydrolysis kinetics of compound 28 • • • • • • • • • • • • • • • • • • • • • • • • • • • • • • • • • 71
3.16 1H NMR of compound 29 during hydrolysis • • • • • • • • • • • • • • • • • • • • • • • • • • • 72
3.17 Hydrolysis kinetics of compound 29 • • • • • • • • • • • • • • • • • • • • • • • • • • • • • • • • • 72
3.18 Conformations of compound 27 and 28 • • • • • • • • • • • • • • • • • • • • • • • • • • • • • • • 74
3.19 Hydrolysis of compound 9 at various pD • • • • • • • • • • • • • • • • • • • • • • • • • • • • • • 76
3.20 Hydrolysis of compound 12 at various pD • • • • • • • • • • • • • • • • • • • • • • • • • • • • • 76
3.21 pH titration curve for compound 9 • • • • • • • • • • • • • • • • • • • • • • • • • • • • • • • • • • 77
3.22 Hydrolysis of compound 9 in D2O CD3OD mixture • • • • • • • • • • • • • • • • • • • • • • • 78
3.23 Kinetics of ln(1/(1-c)) = Kt • • • • • • • • • • • • • • • • • • • • • • • • • • • • • • • • • • • • • • • 79
viii
3.24 Kinetics of K = k[D2O]2 • • • • • • • • • • • • • • • • • • • • • • • • • • • • • • • • • • • • • • • • • 79
3.25 Possible mechanism 1 • • • • • • • • • • • • • • • • • • • • • • • • • • • • • • • • • • • • • • • • • • 80
3.26 Possible mechanism 2 • • • • • • • • • • • • • • • • • • • • • • • • • • • • • • • • • • • • • • • • • • 81
3.27 Hydrolysis studies with 22 and dimethyl L-tartrate at pD 7.5 • • • • • • • • • • • • • • • • • 83
3.28 Hydrolysis kinetics of compound 22 • • • • • • • • • • • • • • • • • • • • • • • • • • • • • • • • • 83
3.29 Hydrolysis kinetics of dimethyl L-tartrate • • • • • • • • • • • • • • • • • • • • • • • • • • • • • 84
List of Schemes
1.1 Deacetylation of chitin to chitosan • • • • • • • • • • • • • • • • • • • • • • • • • • • • • • • • • • 5
1.2 (a) Synthesis of branched PEI, (b) Synthesis of linear PEI • • • • • • • • • • • • • • • • • • • 7
1.3 Synthesis of linear poly(amidoamine)s (PAA)s • • • • • • • • • • • • • • • • • • • • • • • • • • 9
1.4 Synthesis of PAMAM, (a) Michael addition of a nucleophilic core to methyl acrylate, (b)
amidation of the dendrimer ester with a diamine • • • • • • • • • • • • • • • • • • • • • • • • • 10
1.5 Syntheses of PGAAs • • • • • • • • • • • • • • • • • • • • • • • • • • • • • • • • • • • • • • • • • • • 13
2.1 Synthetic scheme for the synthesis of the guanidine containing monomers • • • • • • • • 36
2.2 Synthetic scheme for polymerization of the diamine monomers • • • • • • • • • • • • • • • 37
3.1 Synthesis of compound 20 and 21 • • • • • • • • • • • • • • • • • • • • • • • • • • • • • • • • • • 57
3.2 Synthesis of compound 23 and 25 • • • • • • • • • • • • • • • • • • • • • • • • • • • • • • • • • • 59
3.3 Synthesis of compound 27 • • • • • • • • • • • • • • • • • • • • • • • • • • • • • • • • • • • • • • • 61
3.4 Synthesis of compound 28 • • • • • • • • • • • • • • • • • • • • • • • • • • • • • • • • • • • • • • • 62
3.5 Synthesis of compound 29 • • • • • • • • • • • • • • • • • • • • • • • • • • • • • • • • • • • • • • • 62
4.1 Synthesis of fast degrading PGAAs • • • • • • • • • • • • • • • • • • • • • • • • • • • • • • • • • 86

1
Chapter 1
Novel Cationic Polymers for Nucleic Acids Delivery

2
Nucleic acid therapy has gained much attention over last two decades as a potential
treatment of cancer and other genetic disorder diseases.1 However, as negatively charged
molecules, nucleic acids are not easy to pass through the negatively charged cell membrane due
to charge repulsion. Also, nucleic acids are easy to degrade under the environment of DNAse
and RNAse.2 Therefore, many types of vehicles have been developed to protect and deliver
nucleic acids into the cells. This process may require delivery vehicles to have the ability to form
nanoparticles with nucleic acids and transfect cells, as well as the property to lower binding
ability and release nucleic acids after that.3 Also, the delivery vehicles should be non-toxic
enough as not to affect healthy cells.
Tremendous research has been completed on viral carriers due to their high efficiency at
delivering DNA and RNA to different cell lines. However, the high toxicity and immunogenicity
issues have limited their clinical use.4 Non-viral vehicle systems are being developed rapidly to
offer potential routes for nucleic acid delivery. These vehicles include cationic lipids and cationic
polymers. They both show low immunogenicity, good ability to bind nucleic acids and low
production cost. However, low transfection efficiency and high cytotoxicity are also observed.5
Currently, research is mainly focusing on modifying non-viral vehicle structures to increase
transfection efficiency and reduce toxicity profiles. In the Reineke group, we are focusing on
polymer vehicles to deliver plasmid DNA and small interfering RNA.
Another property of a good delivery vehicle should have is to release nucleic acids after
cellular uptake via endocytosis. This requires polymers to be cleavable or degradable to reduce
the binding properties with the nucleic acid.6 These polymers usually have photo-, pH- or redox-
sensitive cleavable linkers, hydrolysable moieties and enzymatically degradable groups in their
structures.7-11 Biodegradable polymers include polyesters, disulfides and acetals.12-17

3
The research in our group mainly focuses on synthesizing novel poly(glycoamidoamine)s
(PGAAs) and examining these polymers for pDNA transfection.18-20 PGAAs have secondary
amine moieties that can bind pDNA and form polymer-pDNA complexes (polyplexes). These
polyplexes have transfection efficiency as high as jet-PEI in different cell lines such as HeLa,
BHK-21 and HepG2 cells while maintaining low cytotoxicity.19 PGAAs can also degrade under
mild pH condition mimicking physiological conditions.21 This property could render PGAAs
abilities to release pDNAs inside cells.
My work mainly focuses on figuring out the roles different charge centers could play
when polymers are binding pDNAs, and the mechanism of how PGAAs degrade under mild pH
conditions to help develop new polymers with desired degradation profiles.
The thesis will follow the sequence mentioned above. Chapter 2 discusses novel polymer
transfection agents with guanidine groups as charge centers. Binding and other biological
experiments were conducted to examine and identify the difference both colloidally and
biologically caused by new charge centers. Chapter 3 discusses the degradation mechanism of
poly(L-tartramidopentaethylenetetramine) (T4). Different small molecule models mimicking T4
structures are studied to elucidate a possible mechanism for rapid and tunable amide hydrolysis.

4
1.1 Polymer Vehicles for Nucleic Acid Delivery
As mentioned above, many difficulties are encountered during the delivery of nucleic
acids that are not bound to a carrier such as, 1) electric charge repulsion, 2) fragility to enzymes
in physiological conditions, and 3) their large size. Therefore, different cationic polymers were
developed to condense and protect DNA via electrostatic interactions and hydrogen
bonding.5,19,22 Cationic polymers have several advantages over viral delivery vehicles. First, the
positive charges on polymer backbone make them highly soluble in water. This property enable
polymers to condense DNA more efficiently to form smaller and more stable polyplexes.15
Second, the size and surface charge of the polyplexes are greatly dependent on the formulation
conditions of the colloidal complexes, such as positive charge (from polymer) to negative charge
(from DNA backbone) ratios. Higher positive to negative charge ratios usually give smaller
polyplex size and higher surface charge.5 Herein, several polymer vehicles are outlined and
discussed including chitosan, polyethylenimine (PEI), poly(amido-amine) (PAA) and some
biodegradable polymers.23-26
Chitosan
Chitosan is biocompatible, biodegradable and a naturally occuring polysaccharide. Its
structure makes it one of the dominant non-viral vehicles of study. Chitosan is commercially
available and made from by the deacetylation of chitin. Therefore, the product contains randomly
distributed N-acetyl-D-glucosamine (acetylated unit) and D-glucosamine (deacetylated unit)
(Scheme 1.1). The amines from D-glucosamine have pKa of about 6.5 at 25 oC and most of them
can be protonated to form cationic chitosan under acidic pH conditions (lower than pKa).27
Cationic chitosan can assemble with nucleic acids and form polyplexes spontaneously for nucleic

acid del
density
of polyp
deacetyl
highest
which m
influenc
chitosan
polyplex
differen
B
hinder th
livery. How
at physiolog
plexes.27 Pre
lation and d
molecular w
may be caus
ces the size
n / # phosph
xes. Typical
nt cell lines,
Because the
he nucleic a
ever, chitos
gical pH. Th
evious studi
degree of po
weight chito
ed by the di
of resulting
hates on DN
lly, the part
the optimum
Schem
e high hydro
acid transfec
san itself is n
herefore, po
ies also show
olymerizatio
osan typicall
ifficulties to
g polyplexes
NA ratio) and
icles around
m polyplexe
me 1.1, Dea
ophobicity a
ction for chi
5
not a promis
oor solubility
wed that chi
on (>50) pro
ly does not
o release DN
s. Higher N/P
d lower DN
d 100 nm ca
es sizes are
acetylation o
and high aci
itosan, num
sing deliver
y will lead t
itosan that h
omoted cellu
give highes
NA.5 Charge
/P charge rat
A concentra
an be endocy
different.28
of chitin to c
idic pH requ
merous deriva
ry vehicle du
to aggregati
has a high d
ular internal
st gene trans
e ratio and D
tios (# deac
ation genera
ytosed by ce
chitosan
uirement to p
atives were
ue to its low
ion and poor
degree of
lization.24 H
sfection effic
DNA concen
cetylated am
ally give sm
ells. Howev
protonate am
developed t
w charge
r stability
However,
ciency
ntration
mines on
maller
ver, for
mines
to

6
improve the bioactivity. Trimethyl chitosans, which can be protonated more easily at
physiological pH were developed to overcome the hydrophobicity of regular chitosan. Gene
transfection results for the 40% and 50% quaternized trimethyl chitosans were 10 to 100 fold to
regular chitosan with similar molecular weight, while maintaining low toxicity.24,29 Polyethylene
glycol-conjugated chitosan DNA complexes were used to improve stability from aggregation and
were for as long as one month.29,30 Transferrin modified chitosan DNA nanoparticles were
introduced to increase transfection efficiency through a receptor-mediated endocytosis
mechanism as transferrin receptor is found on many mammalian cells and transferrin is able to
transfer non-bioactive molecules efficiently.30
Polyethylenimine (PEI)
PEI is considered one of the most widely-studied gene delivery agents. Commercially
available PEIs such as jetPEI are used as positive controls in many transfection studies. There
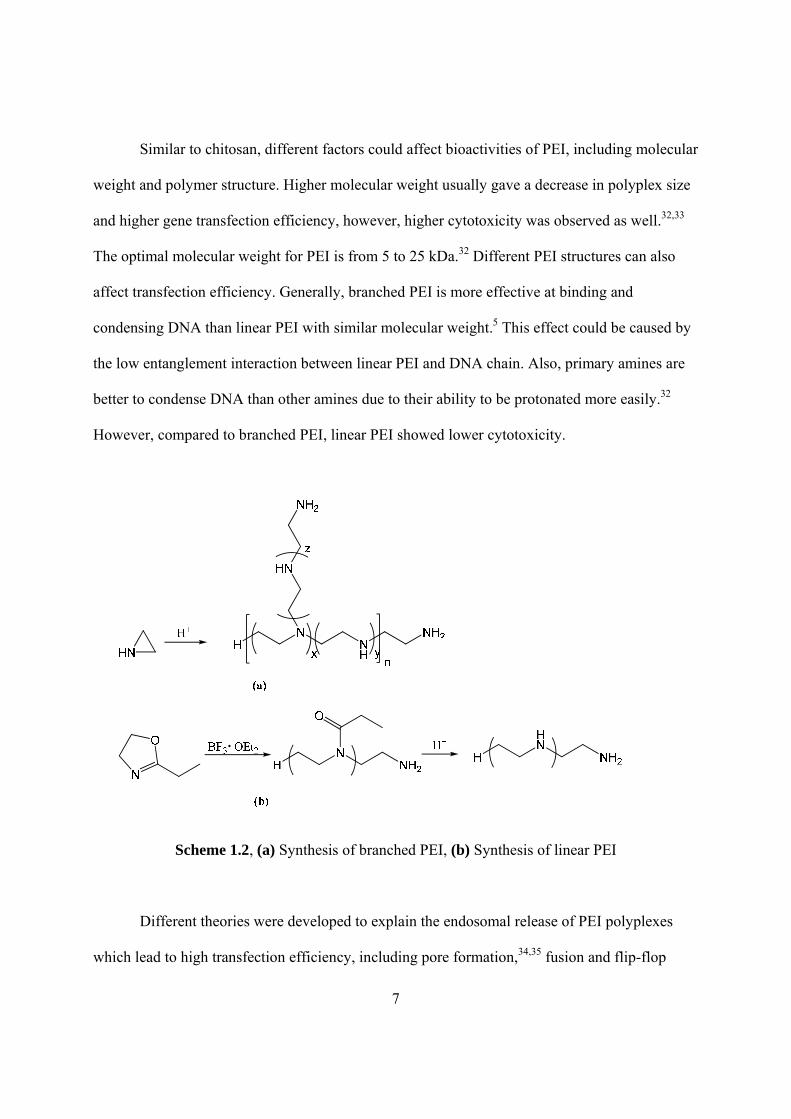
exist two types of PEI structures: linear PEI and branched PEI. Linear PEI is synthesized through
ring opening polymerization of 2-ethyl-2-oxazoline followed by hydrolysis of propionamide
groups,31 while branched PEI is synthesized through acid catalyzed ring opening polymerization
of aziridine.5 (Scheme 1.2) Linear PEI only contains only secondary amines excluding the
terminal primary amines; while branched PEI has primary, secondary and tertiary amines.
Typically, the ratio of primary/secondary/tertiary amines is 1:2:1 based on theoretical
calculation.5 Now that every three atoms of its chain is nitrogen, PEI has high cationic charge if
amine groups are protonated. At physiological pH, around 20% of amines are protonated
examined by pH titration.32
7
Similar to chitosan, different factors could affect bioactivities of PEI, including molecular
weight and polymer structure. Higher molecular weight usually gave a decrease in polyplex size
and higher gene transfection efficiency, however, higher cytotoxicity was observed as well.32,33
The optimal molecular weight for PEI is from 5 to 25 kDa.32 Different PEI structures can also
affect transfection efficiency. Generally, branched PEI is more effective at binding and
condensing DNA than linear PEI with similar molecular weight.5 This effect could be caused by
the low entanglement interaction between linear PEI and DNA chain. Also, primary amines are
better to condense DNA than other amines due to their ability to be protonated more easily.32
However, compared to branched PEI, linear PEI showed lower cytotoxicity.
Scheme 1.2, (a) Synthesis of branched PEI, (b) Synthesis of linear PEI
Different theories were developed to explain the endosomal release of PEI polyplexes
which lead to high transfection efficiency, including pore formation,34,35 fusion and flip-flop

8
mechanism.36,37 The “proton sponge hypothesis” was recognized to well explain why PEI based
polyplexes have the ability to induce endosomal release.38 When pH decreases from 7.4 to 5, PEI
becomes more protonated in endosomes. This process induces an influx of Cl- ions with H+
followed by the influx of water to balance osmotic pressure, which finally causes the swelling
and rupture of endosomes.39,40 The high buffering capacity around physiological pH could lead
to the higher transfection efficiency. However, this hypothesis is still under controversy.
Studies showed that branched PEI has higher transfection efficiency with higher
cytotoxicity and linear PEI has lower transfection efficiency with lower cytotoxicity. However,
this trend is not always true in different cells. Also, neither of these two types of PEIs is
biocompatible or biodegradable. Therefore, different modified PEIs were developed to overcome
these drawbacks. The common way is to copolymerize PEI with other biocompatible or
biodegradable polymers such as PEG and disulfide linkages.5,41,42 Moreover, PEI conjugated
with different receptors has been tested for targeting different cell lines.
PEI-g-PEG copolymers are more hydrophilic and more soluble in water. Therefore, the
resulting polyplexes are more stable and do not aggregate.32,41 PEG has low toxicity and it is a
biocompatible compound, which can lower cytotoxicity compared with PEI itself at similar
molecular weight. However, PEGylated PEI usually gave lower transfection efficiency. The
length and density of PEG group can significantly affect transfection efficiency. Too many
neutral PEG groups can shield the surface charges of polyplexes and hinder the interaction
between polyplexes and cell membrane.5 Davis, M. E. showed that around 10% cyclodextrin
grafted linear or branched PEI had reduced cytotoxicity, higher stability and competitive
transfection efficiency compared to PEI itself.43
9
PEI conjugated with different targeting groups were also used to increase specific
transfection to different cell lines. G. H. Hsiue, et al, showed that folate-polyethylenimine-block-
poly(L-lactide) (folate-PEI-PLLA) polyplexes were stable in water solution, less toxic, and they
targeted folate receptor overexpressed tumor cells followed by receptor-mediated endocytosis.44
E. Wagner, et al, showed that transferrin conjugated low molecular PEI polyplexes improved
transfection efficiency to tumor cells. Also, transferrin could shield the positive surface charge of
polyplexes, increase body circulation time and reduce nonspecific interactions in vivo.45
Poly(amidoamine)
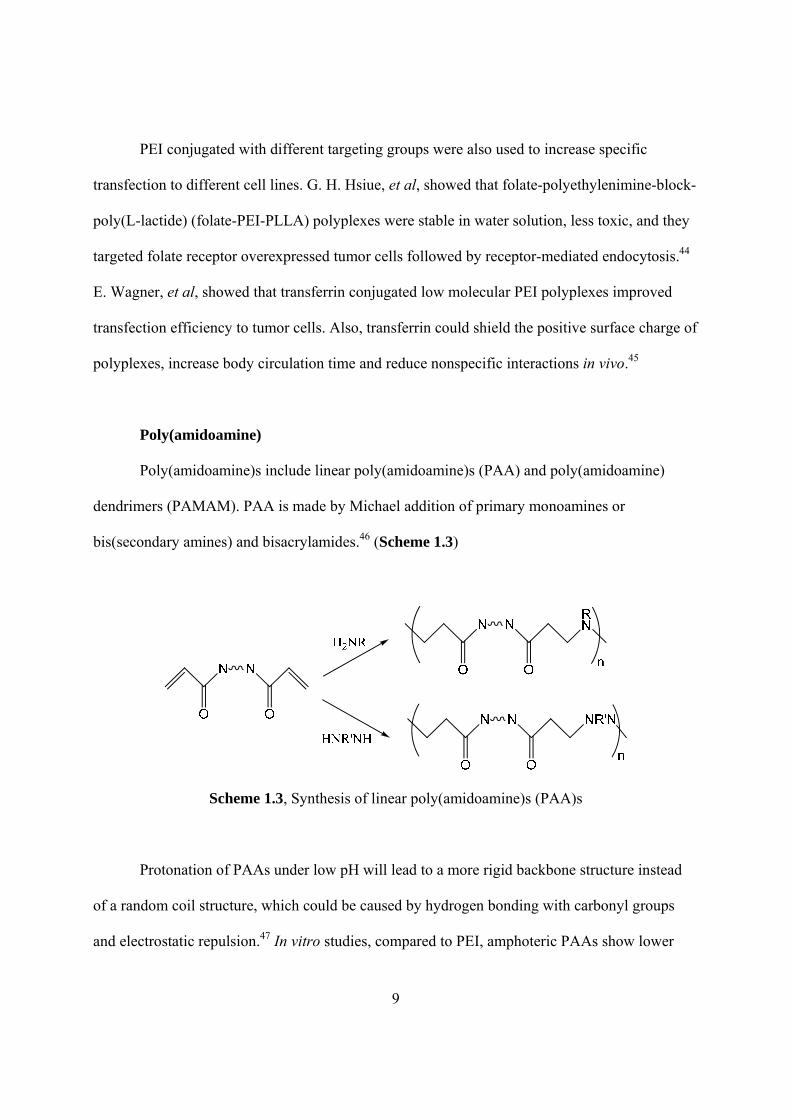
Poly(amidoamine)s include linear poly(amidoamine)s (PAA) and poly(amidoamine)
dendrimers (PAMAM). PAA is made by Michael addition of primary monoamines or
bis(secondary amines) and bisacrylamides.46 (Scheme 1.3)
Scheme 1.3, Synthesis of linear poly(amidoamine)s (PAA)s
Protonation of PAAs under low pH will lead to a more rigid backbone structure instead
of a random coil structure, which could be caused by hydrogen bonding with carbonyl groups
and electrostatic repulsion.47 In vitro studies, compared to PEI, amphoteric PAAs show lower

10
cytotoxicity with a comparable transfection efficiency.48 The possible endosomolytic properties
of this polymer likely contribute to high transfection efficiency by inducing endosomal release of
polyplexes.49 However, higher cytotoxicity is also observed which could be due to the presence
of secondary amines in the structures.48
Scheme 1.4, Synthesis of PAMAM, (a) Michael addition of a nucleophilic core to methyl
acrylate, (b) amidation of the dendrimer ester with a diamine
11
Poly(amidoamine) dendrimers (PAMAM) are branched poly(amidoamine)s. The
synthesis undergoes a repetitive sequence of (1) Michael addition of a nucleophilic core to
methyl acrylate, (2) amidation of the dendrimer ester with a diamine.50 (Scheme 1.4) The
number of generation and surface charges significantly affect the binding with DNA. Higher N/P
ratios yield stable and water soluble polyplexes.51 Furthermore, PAMAM with higher generation
had higher transfection efficiency. This could be due to its hydrophobic structure increasing
cellular penetration and its higher buffer capacity induced endosomal release explained by
“proton sponge theory”.52
1.2 Poly(glycoamidoamine)s (PGAA)
Because chitosan based delivery vehicles showed low cytotoxicity with low transfection
efficiency, PEI based delivery vehicles showed high transfection efficiency and high cytotoxicity,
the Reineke group has developed a series of new delivery vehicles by combing the carbohydrate
structures mimicking chitosan moiety and the oligoamine structures mimicking PEI moiety. Also,
inspired by the linkages from poly(amidoamine)s, the new series of delivery vehicles were linked
by amido groups and called poly(glycoamidoamine)s (PGAAs).
Dr. Yemin Liu synthesized PGAAs with four different types of carbohydrates and four
types of amines through a step-growth polymerization reaction.18,19,53 (Scheme 1.5) The four
types of carbohydrate monomers include difunctional D-glucarate, meso-galactarate, D-
mannarate and L-tartrate. The four different amines are diethylenetriamine, triethylenetetramine,
tetraethylenepentamine and pentaethylenehexamine. All these amines have primary amines at the
ends and differ in number of secondary amines in the structures. The resulting polymers were
named poly(D-glucaramidoamine)s (D1-D4), poly(galactaramidoamine)s (G1-G4), poly(D-

12
mannaramidoamine)s (M1-M4) and poly(L-tartaramidoamine)s (T1-T4). The “G, D, M, T” in
the symbol represents the monomer type, and the “1-4” denotes the number of secondary amines
in the repeat unit. Secondary amines in these polymers can be charged at physiological pH. Dr.
Lisa E. Prevette, et al, showed that PGAAs bond pDNA and formed polyplexes via electrostatic,
van der Waals and hydrogen bonding forces. The hydroxyl groups can enhance the binding with
pDNA.54
All these polymers have degrees of polymerization (DP) from 11 to 14. The similar DP
ensured that the transfection efficiency and cytotoxicity are not affected by molecular weight.19
Gel binding studies showed that D2-D4, G1-G4 and T1-T4 bond pDNA between N/P (N =
number of secondary amine groups, P = number of phosphate groups on DNA backbones) ratio 1
and 3 compared to linear PEI at 2 and chitosan at 1. M1-M4 showed polymers bond pDNA at
higher N/P ratios between 3 and 5.19,55 As the only difference among all these types of polymers
are the stereochemistry and number of hydroxyl groups on carbohydrates, these hydroxyl groups
could contribute to the binding with pDNA.19 Heparin competitive assay was used to test how
stable the polyplexes were by competitively binding pDNA. A higher concentration used to
release pDNA from polyplexes represents a more stable polyplex. Results showed that G4 and
T4 polyplexes were more stable than D4 and M4 polyplexes at same N/P ratios.19,53
The polyplexes sizes were measured by dynamic light scattering (DLS) and ranged from
50 to 500 nm for N/P ratio 20. Polymers with less secondary amines (1 or 2) in each repeating
unit usually had larger polyplexes sizes. Also, with same number of secondary amines, T and G
polymers had smaller polyplexes. N/P ratio is an important factor to size. Higher N/P ratio
always gave smaller polyplexes.19,55 TEM studies showed that the shape of polyplexes is
spherical. The sizes or radiuses measured by TEM were consistent with DLS results.18,19,55

13
Scheme 1.5, Syntheses of PGAAs
Biological studies included toxicity assay and transfection efficiency assay. Hamster
kidney fibroblast cell line (BHK-21), human cervical cancer epithelial cell line (HeLa) and
human liver carcinoma cell line (HepG2) were used for G, D and M polymers, while T polymers
were tested with HeLa only.

Fig
T
N/P rati
seconda
found to
R
gene tra
produce
and gen
which p
amine d
polymer
consiste
P
deliverin
repeatin
with the
deliver p
gure 1.1, Fo
Toxicity ass
ios higher th
ary amine de
o be as low
Reporter ge
ansfection ef
e luciferase i
nerate lumin
polymer deli
density incre
rs at same a
ent with diff
Previous wo
ng pDNA. D
ng unit. Also
e secondary
pDNA, bran
ormation of
says showed
han 20. Furt
ensity increa
as that of ch
ene expressio
fficiency by
in cells. The
nescence. By
ivers pDNA
eased. Also,
amine densit
ferent cell li
ork has foun
Dr. Chen-Ch
o, regular PG
amines, as
nched and li
f polyplexes
d that all PG
thermore, th
ased in the p
hitosan.
on assays w
y PGAAs. L
e protein wi
y measuring
A better. Res
, T and G ba
ty and N/P r
ines.19
nd that seco
hang Lee, e
GAAs are li
well as bran
inear PGAA
14
followed by
GAAs were
he toxicity st
polymer bac
were used to
Luciferase re
ill catalyze o
g the intensit
sults showed
ased polyme
ratios.19,53,55
ndary amin
et al, extende
ikely not co
nched PEI a
As were also
y cellular up
non-toxic to
till was foun
ckbone. The
examine th
eporter gene
oxidation of
ty of lumine
d that transf
ers function
5 However, t
e density pl
ed secondar
mpletely lin
and linear PE
o synthesize
ptake. Figur
o different c
nd to be at a
e toxicity of
he ability to
e (pCMV-lu
f luciferin in
escence, we
fection effic
ned better th
the trend wa
lays an impo
ry amine nu
near due to t
EI showed d
ed to examin
re is from R
cell lines, ev
a low level a
f the PGAA
deliver pDN
uc) was used
n the assay s
e can determ
iency increa
han D and M
as not alway
ortant role in
umber to 5 a
the possible
different abi
ne whether t
Ref. 19
ven at the
as the
As was
NA and
d to
substrate
mine
ased as
M based
ys
n
and 6 per
e reaction
ility to
the

15
topology of PGAAs can affect biological activities.20 Biological studies showed that transfection
efficiency by the polymers with 5 or 6 protonatable amines in each repeating unit remained
similar to the structures with 4 protonatable amines in the repeating unit, however, toxicity
started to increase. Studies also showed that linear M and D based polymers gave higher
transfection efficiency than the branched systems, but this trend was not obvious for G and T
based polymers. Moreover, linear PGAAs were a little more toxic than the branched analogs.20
Because previous studies showed that the release of DNA promoted transfection
efficiency,14,56-59 Dr Yemin Liu, et al, studied the fast degradation of PGAAs. PGAAs had a
faster degradation rate at pH 7.4 than pH 5. These properties could contribute to the high
transfection efficiency by PGAAs.21
1.3 Biodegradable Polymers
As the polymers with high molecular weight cause higher cytotoxicity, people are trying
to use low molecular weight polymers for nucleic acid delivery. However, the polymers with
lower molecular weight usually generated less stable polyplexes and lower transfection
efficiency. Therefore, biodegradable polymer vehicles are highly focused to be applied in nucleic
acid delivery to avoid the accumulations of polymer and the induced cytotoxicity.6 Furthermore,
the release of nucleic acid by biodegradable polymers could potentially release drugs and
increase transfection efficiency. Currently, several biodegradable polymers have been tested for
nucleic acid delivery, including esters,13,59 acetals,12,60 and disulfides17,57,61.
Water-soluble polyesters can be modified to contain polyamines that could be potentially
used to form polyplexes with nucleic acid for delivery. These polymers can degrade rapidly at
physiological conditions. Poly(γ-(4-aminobutyl)-L-glycolic acid) (PAGA) (Figure 1.2) showed a

16
rapid degradation which yielded one-third of the starting molecular weight after 100 min at 37
oC.14,62 Polyplexes formulated with these polymers were stable under physiological conditions
for 8 hours measured by gel binding assay, indicating polymers in the polyplexes likely degraded
less rapidly than free polymers. Compared to poly(L-lysine) (PLL), PAGA was non-toxic, while
the transfection efficiency to 293 cells was twice as high as that by PLL from β-galactosidase
enzyme activity assay.14 In vivo studies carried out with 3-week-old NOD mice and
PAGA/pCAGGS mouse IL-10 complexes showed the resulting protein can be detected for more
than 9 weeks.16 Poly(aminoester)s were developed to attain slower degradation rate with half-
lives from days to months.63-65 The cross-linked poly(β-aminoester)s showed good ability to
complex DNA. The polymers were non-toxic to 293 cells compared with PEI controls, and
transfection efficiency was comparable to PEI.
Figure 1.2, Poly(γ-(4-aminobutyl)-L-glycolic acid) (PAGA)14,62
Acetal groups are acid sensitive. When these groups are introduced into polymers,
polymers tend to have tunable degradation rates based on different pH. Frechet, et al, modified
dextran by reaction with 2-methoxypropene.12 Degradation studies with the resulting acetalated
dextran degraded faster at pH 5.0 (half-life 10 h) than at pH 7.4 (half-life 15 days). Frechet, et al,

also syn
polymer
D
properti
synthesi
containi
formatio
significa
1.4 Con
M
the high
nthesized PE
rs can be ap
Figure
Disulfide gr
ies under red
ized low mo
ing hydrosu
on of disulfi
antly higher
nclusions
My research
h transfectio
EO based dr
pplied to rele
1.3, Forma
roups are als
ducing envi
olecular wei
ulfide groups
fide bonds an
r stability as
h is to exam
on efficiency
rug molecul
ease drugs a
ation of pept
so widely u
ironment via
ight disulfid
s (from cyst
nd cross-lin
s well as hig
mine whether
y by replacin
17
es which ca
at mildly aci
tide DNA po
sed to link p
a thiol-disul
de cross-link
teine) were
nking. (Figu
gher in vitro
r the “proto
ng secondar
an form link
idic endosom
olyplexes. F
polymers an
lfide exchan
king peptide
used to com
ure 1.3) The
o gene transf
n sponge th
ry amines w
kages with d
mes.
Figure is fro
nd drugs due
nge reaction
es for DNA
mplex DNA
e resulting p
fection effic
heory” could
with guanidin
drugs.66 The
om Ref. 67
e to their cle
ns. Rice, et a
delivery.67
followed by
olyplexes sh
ciency.
d potentially
ne or
se
eavable
al,
Peptides
y
howed
y explain

18
methylguanidine groups. Also, to understand the degradation mechanism of different PGAAs,
further hydrolysis studies with small model compounds are conducted. Moreover, the difference
in hydrolysis could potentially lead to novel delivery vehicles with tunable degradation rate for
desired nucleic acid release.

19
Chapter 2
Structure-Activity Examination of Poly(glycoamidoguanidine)s:
Glycopolycations Containing Guanidine Units for Nucleic Acid Delivery
Adapted from
Taori, V. P.; Lu, H.; Reineke, T. M. Biomacromolecules XXXX, XX, XXX
All synthetic and polymer characterization studies were done by Dr. Vijay P. Taori, and all
biological studies were done by me.
Key words:
Guanidine, buffering capacity, proton sponge hypothesis, pDNA delivery, low cytotoxicity

20
2.1 Introduction
The cellular delivery of nucleic acids has been the focus of increasing attention due to the
incredible promise of this new therapeutic modality.68 Many polycation macromolecules are
under investigation as non-viral polynucleotide delivery vehicles as they have the ability to bind
and compact nucleic acids into nanoparticle complexes termed polyplexes.19,69,70 In addition,
many studies have shown that the polymeric vehicles can facilitate the cellular uptake and
transport of polynucleotides into various regions of the cell, such as the cytoplasm and
nucleus.71,72 Non-viral delivery vehicles are advantageous as they are easy to synthesize, can
carry a high therapeutic payload, and can be easily tailored to display stabilizing and targeting
groups to increase circulation time and tissue specific delivery.18,72-75
Our group has focused on the design and development of a novel class of polymers that
we have termed poly(glycoamidoamine)s (PGAAs).18,19,22,53,73,76,77 These structures were
strategically designed and synthesized to incorporate both oligoethyleneamine and carbohydrate
moieties in the repeat units.18,19,75,78 Numerous analogous structures have been created and
examined;53,54,76,78 several comprehensive studies using a variety of mammalian cell lines have
shown that PGAAs exhibit similar high transfection efficiency when compared to the positive
control that contains repeated ethylenimines, polyethylenimine (PEI), but with significantly
reduced toxicity, similar to chitosan, which consists of repeated carbohydrates. Moreover, earlier
studies have shown that the carbohydrate groups in our PGAA structures provide a biologically-
benign attribute, contributes to polyplex stability via hydrogen-bonding to the nucleic acids,22
and when copolymerized with the amine structures, helps to facilitate rapid polymer degradation
through hydrolysis of the amide bond.21,79 Among the library of PGAAs we have created and
studied, the compounds with four secondary amines in the oligoethyleneamine unit exhibited the

21
best biological delivery efficiency results. The interaction of the polyplexes with
glycosaminoglycans (GAGs) on the cell surface has been shown to be essential for the
internalization of these polyplexes.80,81 We have also performed an extensive mechanistic studies
to show that while PGAA polyplexes are internalized via clathrin and caveolae-mediated
endocytosis, caveolae appear to be the major route leading to nuclear delivery of pDNA for
subsequent expression.82 Although PGAAs have revealed interesting biological behavior, it is
essential to have a thorough understanding of the complex factors that dictate the cellular
delivery of nucleic acids.76 To this end, a systematic investigation of structure-bioactivity
relationships is critical for the design of more efficient delivery vehicles for therapeutic
compounds.
One of the critical biological barriers in non-viral polynucleotide delivery involves the
transit of the polyplexes from endosomes to the final destination. While the mechanisms of
polymer-mediated nucleic acid delivery are still under intense investigation, endosomal release
of polyplexes into the cytoplasm is thought to be essential to facilitate high delivery efficiency,
particularly in therapeutic modalities that function in the cytoplasm, such as siRNA. A number of
theories have been proposed for this process, including pore formation,34,35 the fusion and/or flip-
flop83 mechanism, and the proton sponge hypothesis,84 which is associated with the endosomal
release of the polyplexes due to their high buffering capacity. This theory states that during the
acidification event of the early endosomes, the protonation of amines in the polymer backbone
provide a buffering capacity, which causes the subsequent influx of H+ ions to further reduce the
pH of these vesicles (and in turn, it is thought that an influx of Cl- ions also takes place as a
charge neutralization event). As a result of this osmotic imbalance across the endosomal
membrane, water rushes in and swells the endosomes, which eventually rupture and release their

22
cargo into the cytoplasm. Although this theory has been widely studied, the various mechanisms
involved in this process are debated within this field as much evidence both for and against this
theory have been published.53,85-89
In the current study, we synthesized a novel group of macromolecules that we have
termed poly(glycoamidoguanine)s (PGAGs) that contain guanidine cationic groups
copolymerized with a meso-galactarate or L-tartrate moiety. These structures were created as a
series of oligomers analogous to original PGAAs structures;18,19,21,22,53,73,76,77,79,82 however, we
have replaced the “buffering” oligoethyleneamine groups with cationic charges that do not have
a buffering capacity. These oligomers were developed to study and compare the structure-
property relationships, in particular, the biological effect of changes in amine (PGAAs) versus
guanidine (PGAGs) charge type present on the backbone. As discussed earlier, subtle changes in
the chemical structure of a delivery vehicle can affect its complexation with DNA, and thus the
biological activity of the complex. Although some polymer vehicles have been reported that
contain guanidine functionalities, the cationic groups are typically grafted as a pendant on the
polymer backbone (i.e. poly-L-arginine, PLA),90 or grafted to the ends of the macromolecule
vehicle.91,92 While those polymers have shown to facilitate the cellular delivery of
polynucleotides, they also have been shown to vary in their toxicity profile (typically between
60-80% cell survival at low N/P ratios) in vitro.91,92
The results of the current study revealed that the low molecular weight PGAG structures
created from galatarate or tartrate are able to bind with pDNA and form stable complexes
(polyplexes) in the range of 60 to 200 nm. Biological assays with HeLa cells revealed that the
polyplexes formed with the PGAGs displayed higher cellular uptake over polyplexes formed
their analogous PGAAs created by copolymerizing galactarate or tartrate with
23
diethylenetriamine. Despite the lack of buffering capacity of the guanidine group, our studies
have revealed that the galactaramide and tartaramide-based PGAG polyplexes transfect HeLa
cells and yield higher gene expression than their PGAA analogs. In addition, this study has found
that the PGAG polyplexes exhibit non-toxic behavior at a variety of polymer-to-DNA ratios (N/P
ratios), and it could be related to the presence of carbohydrates and/or the low molecular weight
of these materials.
2.2 Experimental Procedures
General: Unless specified otherwise, almost all of chemicals used in the monomer
synthesis were purchased from Sigma Aldrich Chemical Co. and were used without any further
purification. Di-tert-butyl dicarbonate was purchased from Alfa Aesar Chemical Co. Monomers
dimethyl-meso-galactarate and dimethyl-L-tartrate and polymers G1 and T1 were synthesized as
previously described.19,73 Glycofect Transfection ReagentTM was obtained as a gift from
Techulon, Inc. (Blacksburg, VA). Poly-L-Arginine (PLA) (Mw = 5000 – 15000 Da) was
purchased from Sigma Aldrich Chemical Co. NMR spectra were collected on an Inova MR-
400MHz spectrometer and mass spectra were obtained on an IonSpec HiResESI mass
spectrometer. Cell culture media and supplements were purchased from Gibco/Invitrogen
(Carlsbad,CA). pCMV-lacZ was labeled with a Cy5 nucleic acid labeling kit (Mirus, Madison,
WI), and purified by a QIAquick PCR purification kit (QIAGEN, Valencia, CA). HeLa cells
were purchased from ATCC (Rockville, MD). The luciferase assays were completed with a
Promega Luciferase Assay Kit (Madison, WI). The toxicity assays were performed with a Bio-
Rad DC Protein Assay Kit (Hercules, CA). (3-(4,5-Dimethylthiazol-2-yl)-2,5-
diphenyltetrazolium bromide (MTT) was purchased from Invitrogen (Carlsbad, CA).

24
Monomer Synthesis:
1,3-bis(2-((tert-butoxycarbonyl)amino)ethyl)thiourea (2): Dry methylene chloride (200
mL) was added to a 3-neck flask and was brought to -78 oC. Thiophosgene (1.665 mL, 21.84
mmol) was added carefully to this flask under nitrogen. It should be noted that thiophosgene is a
highly toxic liquid and this procedure should be completed only in a hood and with proper safety
precautions. A mixture of mono-N-Boc-ethylenediamine (1) (7.00 g, 43.68 mmol) and
diisopropylethylamine (DIPEA) (5.60 g, 43.68 mmol) in 200 mL of dry methylene chloride was
added slowly and carefully to the dark orange thiophosgene in methylene chloride over a period
of 2 h. This reaction was stirred for 2 h at -78 oC and then warmed to room temperature and
stirred for an additional 2 h. After, the reaction mixture was refluxed for another 2 h, and then
washed with ultrahigh purity water. The organic layer was dried over Na2SO4 and the methylene
chloride was evaporated en vacuo yielding a sticky yellow solid. Ethyl acetate (100 mL) was
added to this residue, which was then sonicated for 30 mins and the white precipitate was filtered
and isolated, washed again with cold ethyl acetate and dried to yield 5.06 g (13.98 mmol, 64%).
1H NMR (400 MHz, CDCl3, TMS): δ = 1.44 (s, 18H, C(CH3)3), 3.33 (m, 4H, CH2NHCO), 3.54
(m, 4H, CH2NHCS), 5.14 (br, 2H, NHCO), 6.70-7.06 (br, 2H, NHCS). 13C NMR (CDCl3): δ =
28.26, 39.73, 44.78, 79.88, 157.18, 181.99. ESI-MS [C15H31N4O4S]+: m/z observed 363.2065,
calculated 363.2061.
1,3-bis(2-((tert-butoxycarbonyl)amino)ethyl)-2-methylisothiouronium iodide (3):
Compound 2 (3.00 g, 8.28 mmol) was dissolved in 100 ml of acetonitrile in a round bottom flask
and then a 10 fold molar excess of methyl iodide (11.76 g, 82.80 mmol) was added. This reaction
mixture was then stirred at 40 oC for 8 h. Acetonitrile and excess methyl iodide were evaporated
en vacuo and the resulting pure product was dried and characterized to yield 3.84 g (7.62 mmol,
25
92%) of the final product. 1H NMR (400 MHz, CDCl3, TMS): δ = 1.42 (s, 18H, C(CH3)3), 2.75
(s, 3H, CH3S), 3.43-3.56 (m, 6H, CH2CH2NHCO), 3.54 (m, 2H, CH2+NH=CS), 5.58, 5.72 (2 x s,
2H, NHCO), 8.74, 8.98 (2 x s, 2H, +NH=CS(CH3)NH). 13C NMR (CDCl3): δ = 15.27, 28.33,
38.25, 39.30, 45.94, 79.74, 80.59, 156.65, 158.28, 168.28. ESI-MS [C16H34N5O4 - I]+: m/z
observed 377.2216, calculated 377.2222.
1,3-bis(2-(tert-butoxycarbonylamino)ethyl)-2-methylguanidinium iodide (4):
Compound 3 (1.00 g, 1.98 mmol) was dissolved in 100 ml of chloroform and was stirred at 50
oC. To this mixture, 2 ml of 2 M methylamine in tetrahydrofuran (THF) was added every 1 h for
the first 4 h After 20 h, the reaction mixture was filtered to remove the precipitated impurity, and
then the low boiling compounds were evaporated under reduced pressure to leave a very viscous
colorless oil. This oil was dried en vacuo and then weighed to recover 0.93 g (1.90 mmol, 96%)
of compound 4 1H NMR (400 MHz, CDCl3, TMS): δ = 1.43 (s, 18H, C(CH3)3), 2.99 (s, 3H,
CH3+NH=C), 3.39 (q, 4H, CH2NHCO), 3.51 (m, 4H, CH2NHCS), 5.78 (t, 2H, NHCO), 7.30 (s,
2H, NHCS), 7.32 (s, 1H, +NH=CS). 13C NMR (CDCl3): δ = 28.32, 28.67, 39.24, 43.27, 80.31,
155.00, 157.95. ESI-MS [C16H34N5O4 - I]+: m/z observed 360.2615, calculated 360.2610.
1,3-bis(2-(tert-butoxycarbonylamino)ethyl)-2-guanidinium iodide (5): Compound 3
(1.00 g, 1.98 mmol) was dissolved in 100 ml of chloroform and this reaction mixture was
brought to 40 oC. To this mixture, 2 mL 7 N ammonia in methanol was added every hour for the
first 4 hours. After 20 h, the reaction mixture was filtered to remove the precipitated impurity,
and then the solvent was evaporated en vacuo yielding viscous colorless oil. This oil was then
dried en vacuo to obtain 0.89 g (1.88 mmol, 95%) of compound 5. 1H NMR (400 MHz, CDCl3,
TMS): 3.33 (m, 4H, CH2NHCO), 3.40 (m, 4H, CH2NHCS), 5.44 (s, 2H, NHCO), 7.02 (s, 2H,

26
NHCS), 7.68 (s, 2H, +NH2=CS). 13C NMR (CDCl3): δ = 28.36, 39.37, 41.92, 80.21, 156.38,
157.19. ESI-MS [C15H32N5O4 - I]+: m/z observed 346.1934, calculated 346.2449.
1,3-bis(2-aminoethyl)-2-methylguanidine trihydrochloride (6): Compound 4 (0.50 g,
1.03 mmol) was dissolved in 10 mL of trifluoroacetic acid (TFA) and stirred at room
temperature. After 2 h, the TFA was evaporated under reduced pressure, which resulted in a dark
brown oil. This oil was dissolved in 20 mL of ethanol, to which 2 mL of concentrated
hydrochloride was added. A white precipitate resulted that was subsequently filtered and washed
with cold ethanol. This product was then dried and characterized. Yield (0.16 g, 0.61 mmol,
59%). 1H NMR (400 MHz, D2O): δ = 2.82 (s, 3H, CH3N), 3.19 (CH2NHC), 3.53 (CH2NH2). 13C
NMR (CDCl3): δ = 27.81, 38.07, 38.66, 155.52. ESI-MS [C6H18N5 - Cl]+: m/z observed
160.1554, calculated 160.1562. Purity from NMR: >99%.
1,3-bis(2-aminoethyl)-2-guanidine trihydrochloride (7): Compound 5 (0.50 g 1.06
mmol) of was dissolved in 10 mL of trifluoroacetic acid (TFA) and stirred at room temperature.
After 2 h, the TFA was evaporated under reduced pressure, which resulted in dark brown oil.
This oil was dissolved in 20 mL of ethanol, to which 2 mL of concentrated hydrochloride was
added. A white precipitate resulted, that was then isolated via filtration and washed with cold
ethanol. The product was then dried and characterized, yield 0.17 g (0.67 mmol, 63%). 1H NMR
(400 MHz, D2O): δ = 3.19 (CH2NHC), 3.53 (CH2NH2). 13C NMR (CDCl3): δ = 38.06, 38.74,
156.26. ESI-MS [C5H16N5 - Cl]+: m/z observed 146.1402, calculated 146.1406. Purity
from NMR >95%.

27
Polymer Synthesis:
Poly(L-tartaramidodiethyleneamine) (T1)73: Diethylenetriamine (0.10 g, 0.97 mmol)
was weighed out in a round bottom flask and 0.96 mL (2.0 M) of methanol was added to dissolve
the diethylenetriamine. Dimethyl-L-tartrate (0.17 g, 0.97 mmol) was added to the round bottom
flask. This mixture was then stirred for 24 h at room temperature, after which time 5 mL of water
was added to this reaction mixture. This reaction mixture was then dialyzed in 1000 Da
molecular weight cut off (MWCO) membrane against ultrapure water for 24 h to purify the
polymer material from the residual low molecular weight compounds. This reaction mixture was
then lyophilized until dry. The resulting polymer was then characterized via GPC (Table 2.1).
Yield 0.087 g (41%, Mw = 1.1 kDa, n = 4).
Poly(galactaramidodiethyleneamine) (G1)19: Diethylenetriamine (0.3 g, 2.91 mmol) was
dissolved in 58.1 mL (0.1 M) of methanol and dimethyl meso-galactarate 0.693 g (2.91 mmol) of
was added to this reaction mixture. This reaction mixture was stirred for 24 h. Methanol was
evaporated under reduced pressure to afford a white solid. This solid, was dissolved in 10 mL of
ultrapure and the mixture was transferred in a 1000 Da molecular weight membrane and was
exhaustively dialyzed against ultrapure water for 24 h to remove the relatively smaller molecular
weight compounds. This mixture was then flash frozen in a scintillation vial and lyophilized to
afford a white fluffy solid. The resulting polymer was then characterized via GPC. Yield 0.32 g
(38%, Mw = 1.3 kDa, n = 5).
Poly(galactaramidodiethylenemethylguanidine) (Gmeg): Compound 6 (0.15 g, 0.56
mmol) was dissolved in 2 mL of methanol. To this, 400 μL of triethylamine (TEA) was added in
5 x 0.556 mmol aliquots while stirring over the period of 15 min to obtain a homogeneous
mixture. Next, dimethyl meso-galactarate (0.13 g, 0.56 mmol) was added and the reaction was

28
stirred at room temperature for 48 h. The reaction mixture was then concentrated under reduced
pressure. Ultrapure water (5 mL) was added to the reaction mixture and it was then pipetted into
a 1000 Da MWCO membrane and exhaustively dialyzed for 24 h against ultrapure water to
remove lower molecular weight impurities. This mixture was then flash frozen in a scintillation
vial and was lyophilized to afford a sticky white solid. The resulting polymer was then
characterized via GPC. Yield 0.073 g (36%, Mw = 1.3 kDa, n = 4).
Poly(L-tartaramidodiethylenemethylguanidine) (Tmeg): Compound 6 (0.15 g, 0.56
mmol) was dissolved in 1 mL of methanol in a round bottom flask. Triethylamine (400 μL) was
added to this mixture in 5 x 0.56 mmol aliquots and stirred for 15 mins to obtain a homogeneous
mixture. Next, dimethyl L-tartrate (99.1 mg, 0.56 mmol) was added and stirred for 120 h at room
temperature. The methanol was then removed under reduced pressure to afford a white solid and
the product was dissolved in 5 mL of ultrapure water, transferred to a 1000 Da MWCO
membrane and was exhaustively dialyzed against ultrapure water for 24 hours. This mixture was
then flash frozen in a scintillation vial and lyophilized to afford a sticky yellowish solid. The
resulting polymer was then characterized via GPC. Yield 0.043 g (23%, Mw = 1.4 kDa, n = 5).
Poly(galactaramidodiethyleneguanidine) (Gg): Compound 7 (0.10 g,0.39 mmol) was
added to a round bottom flask and dissolved in 2 mL of methanol. To this mixture, 275 μL of
triethylamine (TEA) was added in 5 x 0.393 mmol aliquots while stirring over the period of 15
minutes to obtain homogeneous reaction mixture. Next, dimethyl meso-galactarate (0.094 g, 0.39
mmol) was added and the reaction was stirred for 48 h at room temperature. The reaction
mixture was concentrated under reduced pressure. Ultrapure water (5 mL) was then added to this
reaction mixture and the solution was transferred in a 1000 Da MWCO membrane and was
exhaustively dialyzed against ultrapure water for 24 h to remove low molecular weight

29
impurities. This mixture was then flash frozen in a scintillation vial, after which the remaining
water was lyophilized to afford a sticky white solid. The resulting polymer was then
characterized via GPC. Yield 0.043 g (31%, Mw = 1.3 kDa, n = 4).
Poly(L-tartaramidodiethyleneguanidine) Tg: Compound 7 (0.15 g, 0.59 mmol) was
dissolved in 1 mL of methanol in a 5 mL round bottom flask. Triethylamine (425 μL) was added
in 5 x 0.59 mmol aliquots and stirred for 15 mins to obtain a homogeneous mixture. Next,
dimethyl L-tartrate (105.5 mg, 0.59 mmol) was added and the reaction mixture was stirred for
120 h. Next, the methanol was removed under reduced pressure to afford an off-white solid. To
purify, the solid was dissolved in 5 mL of ultrapure water and transferred into a 1000 Da MWCO
membrane and exhaustively dialyzed against ultrapure water for 24 h. This mixture was then
flash frozen in a scintillation vial, after which any residue and lyophilized to afford a sticky
yellowish solid. The resulting polymer was then characterized via GPC. Yield 0.063 g (36%, Mw
= 1.3 kDa, n = 5).
Polymer Characterization:
Molecular weight and polydispersity (PDI) were characterized using a Viscoteck
GPCmax with a GMPWXL column coupled to a triple detector (static light scattering, viscometry
and refractive index). A solution of 0.5 M sodium acetate in 80:20 water to acetonitrile was used
as mobile phase. The pH of the mobile phase was adjusted to pH 7 by adding acetic acid. Sample
preparation was done by dissolving 2 mg of polymer sample in 1 mL of mobile phase, and
injecting 100 μL this solution onto the column at a flow rate of 0.6 mL/minute.
30
Polyplex Characterization:
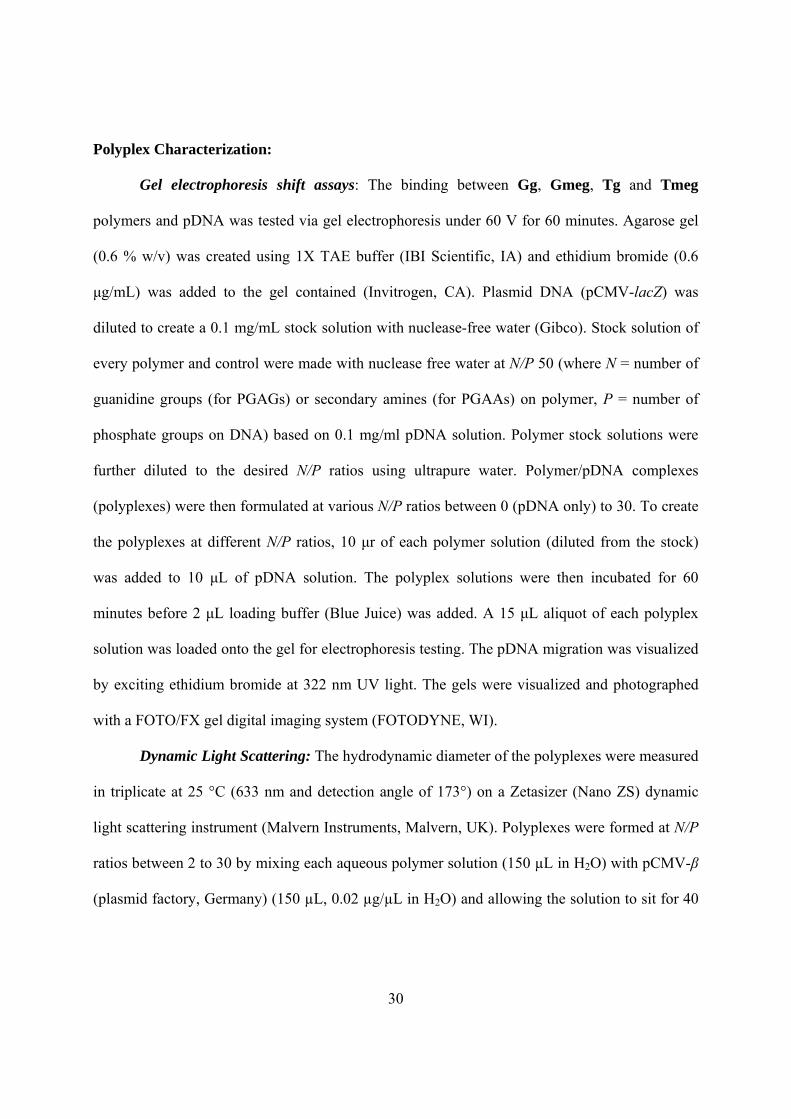
Gel electrophoresis shift assays: The binding between Gg, Gmeg, Tg and Tmeg
polymers and pDNA was tested via gel electrophoresis under 60 V for 60 minutes. Agarose gel
(0.6 % w/v) was created using 1X TAE buffer (IBI Scientific, IA) and ethidium bromide (0.6
μg/mL) was added to the gel contained (Invitrogen, CA). Plasmid DNA (pCMV-lacZ) was
diluted to create a 0.1 mg/mL stock solution with nuclease-free water (Gibco). Stock solution of
every polymer and control were made with nuclease free water at N/P 50 (where N = number of
guanidine groups (for PGAGs) or secondary amines (for PGAAs) on polymer, P = number of
phosphate groups on DNA) based on 0.1 mg/ml pDNA solution. Polymer stock solutions were
further diluted to the desired N/P ratios using ultrapure water. Polymer/pDNA complexes
(polyplexes) were then formulated at various N/P ratios between 0 (pDNA only) to 30. To create
the polyplexes at different N/P ratios, 10 μr of each polymer solution (diluted from the stock)
was added to 10 μL of pDNA solution. The polyplex solutions were then incubated for 60
minutes before 2 μL loading buffer (Blue Juice) was added. A 15 μL aliquot of each polyplex
solution was loaded onto the gel for electrophoresis testing. The pDNA migration was visualized
by exciting ethidium bromide at 322 nm UV light. The gels were visualized and photographed
with a FOTO/FX gel digital imaging system (FOTODYNE, WI).
Dynamic Light Scattering: The hydrodynamic diameter of the polyplexes were measured
in triplicate at 25 °C (633 nm and detection angle of 173°) on a Zetasizer (Nano ZS) dynamic
light scattering instrument (Malvern Instruments, Malvern, UK). Polyplexes were formed at N/P
ratios between 2 to 30 by mixing each aqueous polymer solution (150 µL in H2O) with pCMV-β
(plasmid factory, Germany) (150 µL, 0.02 µg/µL in H2O) and allowing the solution to sit for 40

31
mins. The average size of the polyplexes and standard deviation are reported for each polyplex
solution in Figure 2.2.
Transmission Electron Microscopy: Polymer-pDNA complexes were prepared at N/P =
20 as described above for the dynamic light scattering studies. Samples (5 μL of the polyplex
solution in water) were applied in duplicate to 400-mesh carbon-coated grids (EMS, Fort
Washington, PA) and incubated for 60 s. Excess liquid was removed by blotting with a kimwipe.
Samples were negatively stained with uranyl acetate (2%, w/v) for 90 s and again blotted with a
kimwipe. TEM images were recorded with a JEOL JEM-1230 transmission electron microscope
operated at 60.
Cell Culture Experiments:
General: HeLa (human cervix adenocarcinoma) cells were purchased from ATCC. Cells
were cultured in Dulbecco’s Modified Eagle Medium (DMEM) with 10 % fetal bovine serum
(FBS), 50 units/mL of penicillin and 50 µg/mL of streptomycin in 5 % CO2 at 37 oC. Plasmid
DNA including pCMV-lacZ and luciferase DNA (pCMV-luc) were purchased from
PlasmidFactory (Germany). All experiments used an identical passage of cells and the same
batch of reagent; all samples were prepared with Gibco nuclease-free water and all materials
were autoclaved or treated under UV light for 15 mins to ensure aseptic conditions and
reproducible results.
Luciferase and Protein Assays in Serum-free Culture Medium: HeLa cells were
cultured in a 24-well plate with a density of 5x10⁴ cells/well and were incubated for 24 h prior to
transfection. To form the polyplexes, 150 μL of an aqueous solution of each PGAG (Gg, Gmeg,
Tg, Tmeg) or positive control polymers (G1, T1, poly-L-arginine (PLA) and Glycofect

32
Transfection Reagent) were added into 150 μL pCMV-luc DNA (0.02 mg/mL) at N/P ratios of 5,
10, 15, 20, 25 and 30 at room temperature. The solutions were allowed to incubate for 60-
minutes to allow polyplex formation, after which 600 µL of serum-free medium (Opti-MEM)
was added to each eppendorf containing the polyplex solutions and mixed gently with a pipette.
The HeLa cells were washed with 0.5 mL PBS, after which 300 µL of polyplex solution
(containing 1 µg DNA and the designated N/P ratios of polymer) was added to the cells in each
well. Untranfected cells and cells transfected with pCMV-luc pDNA only were used as the
negative controls. Experiments were completed in triplicate. Four hours after initial transfection,
800 µL of DMEM solution containing 10% FBS was added to each well. Twenty four hours after
initial transfection, the medium in each well was replaced with 1 mL of fresh DMEM containing
10% FBS . Forty-eight hours after initial transfection, cells were washed with PBS and lysed
with 100 µL of 1X cell culture lysis buffer (Promega). A Bio-Rad DC protein assay kit was used
to determine the amount of protein in the cell lysates. For luciferase activity, the cell lysates were
analyzed by adding luciferase substrate and measuring the relative light units. Luminescence was
measured over 10 s with a luminometer (GENios Pro, TECAN US, Research Triangle Park, NC).
Luciferase and Protein Assays in Culture Medium Containing Serum: The luciferase
and protein assays in the presence of DMEM containing 10% serum carried out via an identical
protocol to the serum-free study with the exception that 600 µL of DMEM containing 10% FBS
was added directly to the polyplex solutions and the transfections were completed solely in the
presence of this media. Also, only two representative N/P ratios (10 and 25) were used for
transfection studies with the PGAGs and positive control polymers in the medium containing
serum.

33
MTT Assay: HeLa cells were cultured in a 24-well plate with a density of 5x10⁴
cells/well and incubated for 24 hours prior to transfection. Polyplexes were formed by pipetting
150 µL of the PGAG or positive control polymers (Gg, Gmeg, Tg, Tmeg, G1, T1, PLA or
Glycofect Transfection Reagent) into 150 µL of pCMV-lacZ DNA (0.02 mg/mL) and pipetting
up and down to mix the solutions. The polyplexes were formed via this method at N/P ratios of
5, 10, 15, 20, 25 and 30 at room temperature. The polyplex solutions were allowed to sit for 60-
minutes prior to addition of 600 µL of serum-free medium (Opti-MEM). HeLa cells were
washed with 0.5 mL PBS, after which 300 µL of each polyplex solution (containing 1 µg DNA
and different N/P ratios of each polymer) was added to the cells in each well. Untranfected cells
and cells transfected with pCMV-luc pDNA only were used as negative controls. Each
experiment was completed in triplicate. Four hours after initial transfection, 800 µL 10% FBS
DMEM solution was added to each well. Twenty-four hours after initial transfection, the cells in
each well were washed with 0.5 mL PBS. Then 0.5 mL of a 0.5 mg/mL 3-(4,5-Dimethylthiazol-
2-yl)-2,5-diphenyltetrazolium bromide (MTT) in 10% FBS DMEM solution was added to each
well. After incubation at 37 oC for 1 h, the cells in each well were washed with 0.5 mL PBS and
lysed with 600 µL DMSO. Cell lysates were shaken for 20 mins in darkness. A 200 µL aliquot of
cell lysate was loaded to a 96-well plate for colorimetric measurement. Samples were measured
with a spectrophotometer (GENios Pro, TECAN US, Research Triangle Park, NC) with a
wavelength of 570 nm. Cell viability profiles were characterized by absorbance results. Cell
viability of transfected cells was normalized to that of untransfected cells.
Flow Cytometry: HeLa cells were cultured in a 6-well plate with a density of 2.5x10⁵
cells/well and were incubated for 24 h prior to transfection. Polyplexes were formed by adding
250 µL of each polymer and control (Gg, Gmeg, Tg, Tmeg, G1, T1, PLA and Glycofect

34
Transfection Reagent) into 250 µL Cy5-labeled pCMV-lacZ DNA (excited at 633 nm) (0.02
mg/mL). Polyplexes were formed at N/P ratios of 10 and 25 at room temperature and allowed to
sit for 60-minutes at room temperature. After this incubation period, 1 mL of serum-free medium
(Opti-MEM) was added. HeLa cells were washed with 1 mL PBS and 1.5 mL polyplex solution
(containing 5 µg DNA and each polymer to examine the effect of N/P ratios of 10 and 25) was
added to cells in each well. Untranfected cells and cells transfected with pDNA only were used
as negative controls for the cellular uptake study. Cells treated with PLA and Glycofect were
used as the positive controls and all of the experiments were completed in duplicate. Two hours
after initial transfection, cells were rinsed with PBS several times to remove any polyplexes
bound to the cell surface. After, 1 mL of 10% FBS DMEM was then added to allow further
endocytosis for 30 mins. Four and a half hours after initial transfection, cells were washed with
PBS, trypsinized, pelleted, the supernants were removed, and the cells were resuspended in PBS
for flow cytometry analysis. Cells positive for Cy5 (and the average Cy5 intensity) were
analyzed with a FACSCanto II (Becton Dickenson, San Jose, CA). Approximately 20,000 events
were recorded.
2.3 Results and Discussion
Here in, we synthesized and studied a new polymer series we have termed
poly(glycoamidoguanidine)s (PGAGs) that have been created as analogues to our previous
PGAAs. To examine the biological effects of the charge center, we replaced the amines in our
original PGAA structures with guanidine and methylguanidine groups. The guanidine group has
a high pKa value of around 12.5 (dependent on the substituent) and is protonated at physiological
pH as opposed to the amine groups in the PGAAs; in the case of T1, only about 50% of the

35
secondary amines are protonated at physiological pH.22 Because subtle changes in the chemical
structure93,94 of the delivery vehicle can largely impact the resulting biological properties of a
polymer, the different charge types in the PGAAs and PGAGs can heavily impact the biological
properties such as polyplex formation,22,54 polyplexes internalization80 into cells, intracellular
trafficking, and possible release from the endosome. Also, according to the proton sponge
hypothesis, the presence of PGAGs in a polyplex should not provide buffering capacity in the
endosomes, thereby supposedly hindering endosomal release and our study seeks to explore how
these structural changes alter the delivery profiles.
Monomer and Polymer Synthesis
Poly(glycoamidoguanidine)s (PGAGs) were designed based on a similar aminolysis
chemistry used previously for synthesizing the PGAAs. However, since the diamine with a
guanidine moiety in the architecture was not commercially available, we used similar synthetic
methods related to those developed by Sambrook et al.95 As shown in Scheme 2.1, mono-N-Boc-
ethylenediamine (1) synthesized from an earlier reported procedure96 was reacted carefully with
thiophosgene at -78 oC in presence of diisopropylethylamine (DIPEA). The reaction mixture was
warmed to room temperature and then refluxed. After purification, the thiourea compound (2)
was obtained and was subsequently reacted with methyliodide yielding the methyl thiourea
species (3). The methyl thiourea was then treated with either ammonia or methylamine, which
afforded the desired methyl guanidine (4) and guanidine (5) compounds respectively. Both
compounds (4 and 5) were then treated with trifluoroacetic acid (TFA) to remove the Boc groups
and liberate the amine salts. The final methyl guanidine-containing (6) and guanidine (7)
36
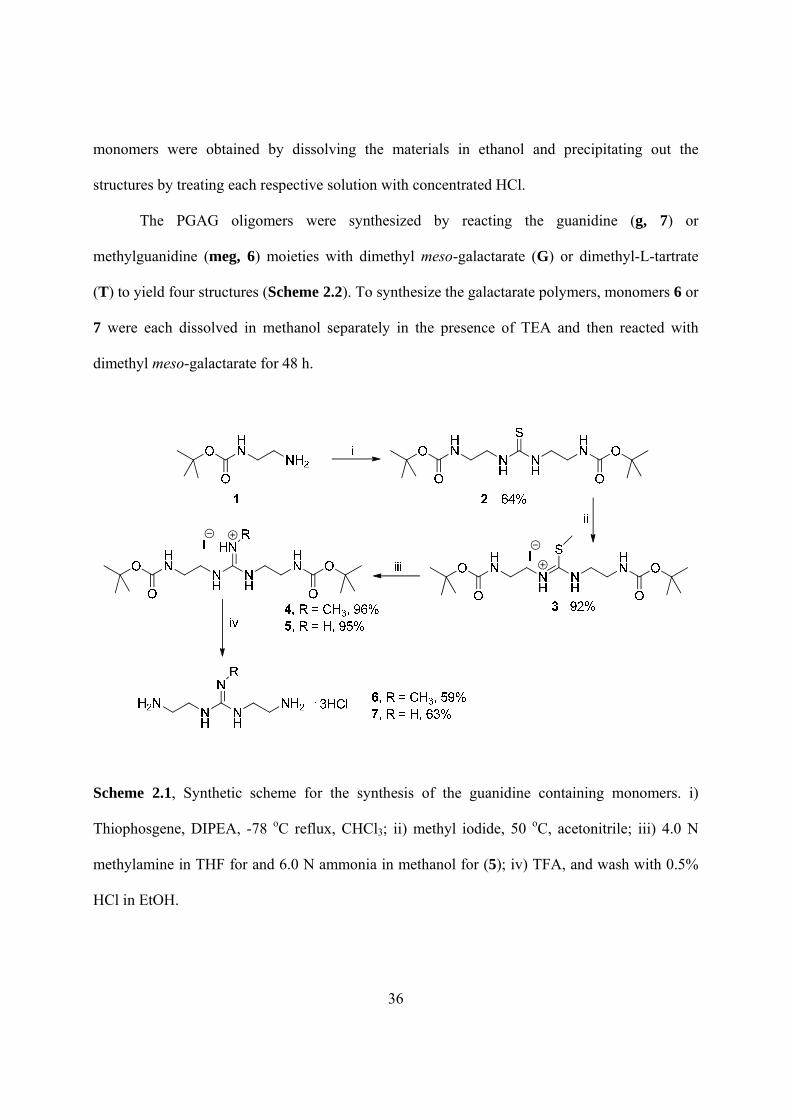
monomers were obtained by dissolving the materials in ethanol and precipitating out the
structures by treating each respective solution with concentrated HCl.
The PGAG oligomers were synthesized by reacting the guanidine (g, 7) or
methylguanidine (meg, 6) moieties with dimethyl meso-galactarate (G) or dimethyl-L-tartrate
(T) to yield four structures (Scheme 2.2). To synthesize the galactarate polymers, monomers 6 or
7 were each dissolved in methanol separately in the presence of TEA and then reacted with
dimethyl meso-galactarate for 48 h.
Scheme 2.1, Synthetic scheme for the synthesis of the guanidine containing monomers. i)
Thiophosgene, DIPEA, -78 oC reflux, CHCl3; ii) methyl iodide, 50 oC, acetonitrile; iii) 4.0 N
methylamine in THF for and 6.0 N ammonia in methanol for (5); iv) TFA, and wash with 0.5%
HCl in EtOH.

37
OH
OH O
NHO
OHN
HN
OH
OH
OH
OHO
OO
NHNH2
NH
Hn
OH
OH O
NHO
OHN
HN
HNNH
Hn
HN
HN
NHNH2
n
OH
OH
OH
OHO
OO
NH
HN
HN
NHHN n
Cl
Cl
Cl
Cl
OH
OH O
NHO
OHN
NH
Hn
OH
OH
OH
OHO
OO
NH
HN
NH n
H
Tg Gg
GmegTmeg
T1 G1
OH
OH
OH
OHO
OO
O
dimethyl meso-galactarate
OH
OH O
OO
O
dimethyl L-tartrate
i 6 or 7 or H2NHN
NH2
Scheme 2.2, Synthetic scheme for polymerization of the diamine monomers such as 6, 7, or
diethylenetriamine with dimethyl-meso-galactarate or dimethyl-L-tartrate in TEA, MeOH.
The tartrate series was synthesized by reacting monomers 6 and 7 with dimethyl-L-
tartrate under similar conditions for 120 h. After polymerization of each mixture, the reaction
mixtures were each dialyzed with a 1000 MWCO membrane against ultrapure water for 24 hours

38
to purify the polymers from unreacted monomer and each product was characterized via GPC.
The PGAAs with one secondary amine created with galactarate or tartrate monomers (G1 and
T1) were also synthesized to obtain similar short oligomers to more accurately compare the
effects of the charge center on the biological properties and to assure that the differences
observed in the biological activity are related to the charge center alterations. Table 2.1 reveals
the characterization data for each of the polymers created for this study.
Table 2.1, The weight average molecular weight (Mw), polydispersity index (Mw/Mn) and
degree of polymerization (n) for the guanidine and amine containing oligomers.
Polymer Mw (kDa) Mw/Mn n
Gg 1.3 1.2 4
Gmeg 1.3 1.3 4
Tg 1.3 1.2 5
Tmeg 1.4 1.2 5
G1 1.3 1.3 5
T1 1.1 1.3 4
Polyplex Characterization
Gel Electrophoresis Shift Assay: The ability of each PGAG polymer to bind with the
pDNA was examined using a gel electrophoresis shift assay to observe the inhibition of pDNA
migration with increasing the polymer concentration (N/P ratio). Polyplexes were prepared at a
variety of N/P ratios from zero (pDNA only) to 30 and loaded onto the gel. As shown in Figure

2.1, at N
guanidin
of 2.5 o
(compou
applied
Figure
pDNA i
and 30.
at N/P =
T
of 10 or
(PGAG
polymer
N/P = 2
polymer
galactar
addition
+
‐
+
‐
N/P zero (pD
ne polymers
or lower. W
und 6 and
to these two
2.1, Gel ele
in different
These data
= 2.5, c) Gg
The analogo
r higher. Th
s) exhibited
rs (PGAAs)
2) were sho
rs (Tg N/P
rate moiety
n, the PGAG
DNA only)
s were show
While, gel e
7) revealed
o compound
ectrophores
N/P ratios
show that:
binds with
ous PGAA
hus, at simil
d a higher
). The galact
own to bind
= 2, Tmeg
appears to p
Gs with a me
pDNA mig
wn to bind w
electrophore
d no bindin
ds.
is shift assa
between 0
a) Gmeg bi
pDNA at N
polymers, T
lar degrees
affinity fo
tarate-based
d pDNA at
g N/P = 2.
play a role
ethyl guanid
39
grates towar
with pDNA
esis shift a
ng with pDN
ay for the P
(pDNA on
inds with pD
N/P = 1.5, an
T1 and G1
of polymer
or pDNA b
d, guanidine
t a lower N
5). This su
at enhancin
dine group (
‐
‐
+
+
rds the posit
A and inhibit
assay condu
NA. Theref
PGAGs. Eac
nly, migrate
DNA at N/P
nd d) Tg bin
showed pD
rization, the
binding com
e-containing
N/P ratio as
upports our
ng the polym
(Tmeg and
tive electrod
t gel migrat
ucted with g
fore, no bio
ch polymer
es with the
P = 2, b) Tm
nds pDNA a
DNA migrat
guanidine-
mpared to t
g polymers (
s compared
previous d
mer binding
Gmeg) bou
de and all f
tion at low N
guanidine m
ological stu
was compl
electrophor
meg binds w
at N/P = 2.
tion inhibiti
-containing
the amine-c
(Gg N/P = 1
to the tartr
data showin
affinity to p
und pDNA a
four of the
N/P ratios
monomers
udies were
lexed with
retic field)
with pDNA
ion at N/P
oligomers
containing
1.5, Gmeg
rate-based
g that the
pDNA. In
at a higher

40
N/P ratio when compared to the PGAGs with a guanidine group, indicating that the methyl group
may slightly weaken the binding affinity due to a lower electrostatic interaction. Interestingly,
the Zeta potential data supports this hypothesis.
Polyplex Size: Polyplex size was characterized via dynamic light scattering (DLS) at
various N/P ratios between 2 and 20. Figure 2.3 shows the data for polyplexes formed with each
of the new PGAGs at N/P = 5 and 20. The average size of the polyplexes at a low N/P ratio of 2
was approximately 600 nm likely due to the incomplete plasmid compaction (and negative Zeta
potential, vide infra). However, at an N/P ratio of 5, the polyplex size significantly decreased to
between 78-124 nm and remained consistent at this size, with the exception of polyplexes
formed with Gmeg, which revealed larger sizes of around 200 nm. The polyplex size of Gmeg at
N/P 20 was also determined using TEM and it was found that, these polyplexes might be
forming dimers which could be the reason for the observed DLS measurements. Interestingly,
G1 and T1 polyplexes revealed large particle sizes of between 400-700nm even at higher N/P
ratios, revealing that these materials may not fully compact pDNA into polyplexes effectively.
However, the positive controls, PLA and Glycofect were both very effective at compacting
pDNA into polyplexes. The disparity in polyplex size when comparing the small PGAG
polyplexes to the complexes formed with the PGAAs is likely due to differences in the
electrostatic interaction of these short oligomers with pDNA (PGAGs are more cationic and
appear to promote a higher binding affinity at lower N/P ratio).
Zeta Potential: As shown in Figure 2.2, the Zeta potential of the PGAG polyplexes in an
aqueous solution was depended on the N/P ratio of formulation. At low N/P ratio of 2, the
polyplex Zeta potential values were all neutral or slightly positive (0 to +2 mV), with the
exception of Gmeg complexes (-7 mV). At polyplex formulations greater than 2, the polyplexes

all resul
with Tm
N/P = 2
Interesti
10 and 2
Figure
water an
Cell Cu
C
the PGA
cells, pD
T1 (N/P
cells po
lted in a mo
meg yielded
20; this resu
ingly, with t
25 (Support
2.2, The PG
nd complex
ulture Expe
Cellular Up
AG-based p
DNA, poly-
Ps = 10 and
ositive for C
G
oderately po
d the lowest
lt supports t
the controls
ting Informa
GAG polypl
ed with pDN
eriments
ptake and T
polyplexes (
L-Lysine (P
d 25), a flow
Cy5-labeled
g
ositive surfa
t Zeta poten
the gel shift
s, the T1 exh
ation).
ex size and
NA at N/P =
Transgene E
(Gg, Gmeg
PLA, N/P =
w cytometry
pDNA and
Gmeg
41
ace charge o
ntial values,
ft assays that
hibited lowe
Zeta potent
= 5 and 20.
Expression
g, Tg, Tme
5), Glycofe
y assay was
d the averag
on the polyp
, which wer
t had the hi
er Zeta pote
tial. The PG
Studies: To
eg) and com
ect Transfec
carried out
ge intensity
Tg
plexes (4-12
re near neut
ghest N/P r
ential values
GAG polyme
o examine t
mpare the re
tion Reagen
t to ascertain
of Cy5 flo
Tmeg
2). Polyplex
tral (+5 mV
ratio of com
s at N/P rati
ers were dis
the cellular
esults to th
nt (N/P = 25
n both the n
rescence in
xes formed
V), even at
mplexation.
ios of both
ssolved in
uptake of
e controls
5), G1 and
number of
n the cells.

42
PGAG polyplexes were formed at N/P 10 and 25 and HeLa cells were incubated with each
polyplex solution and control for 2 hours, after which, the cells were washed multiple times with
PBS, trypsanized, pelleted, washed with PBS, and pelleted and repeated several times to remove
surface bound polyplexes for accurate flow cytometry characterization. Results are shown in
Figure 2.3 for the percentage of cells positive for Cy5 fluorescence, as well as for mean
fluorescence intensity. Specifically, only 20% of the cells were positive for Cy5 fluorescence
with pDNA only. All of the polymers (PGAGs, PGAAs, and positive controls) facilitated an
increase in the uptake of pDNA in HeLa cells over the negative controls. It is also interesting to
note that the PGAGs promoted similar cellular uptake of pDNA as the positive controls,
Glycofect, a glycopolymer that consists of repeated galatarate residues along with four
ethyleneamines and poly-L-arginine (PLA) a polypeptide consisting of repeated pendant
guanidine charge centers, and also revealed higher cellular uptake than the other PGAAs
analogues (G1 and T1). Polyplexes formed with G1 and T1 were internalized by about 70% of
cells while the PGAGs promoted higher cellular internalization, where on average, 90% of the
cells were positive for Cy5-pDNA (with the exception of Tg polyplexes at N/P = 10). While the
uptake of the Tg polyplexes at N/P = 10 is low, we currently do not understand this result. When
comparing the mean Cy5 intensity per cells, surprisingly the Tg (N/P = 10) and the control PLA
polyplex samples revealed the lowest intensity values, indicating that these formulations do not
facilitate effective nucleic acid transfer into cells. On the high end, both of the methylated
guanidine analogs, Gmeg (N/P = 25) and Tmeg (N/P 10 and 25) yielded high Cy5
internalization, similar or higher than Glycofect. This result was very interesting and prompted
our comparison of the gene expression profile for these systems.

Figure
complex
controls
the posi
line repr
L
assays
oligome
flow cy
poly-L-a
absence
control
was fou
2.3, HeLa
xed with pD
s and Glycof
itive control
resents the m
Luciferase A
were carrie
ers can deli
ytometry stu
arginine. Th
e and presen
and the dat
und that tran
Cel
ls
DN
A
cell uptake
DNA at N/P
ofect Transfe
ls. The bars
mean fluore
Assays in S
ed out in
iver pDNA
udies, two p
he luciferas
nce of serum
ta revealed
nsgene expr
DN
A
PLA
-5
Gly
cofe
ct-2
5
e of Cy5-pD
P ratio 10 a
fection Reag
represent th
escence inte
Serum and S
order to ch
to HeLa ce
positive con
se reporter g
m (Figures
some intere
ression with
G1-
10
G1-
25
T1-1
0
43
DNA delive
and 25. Cell
gent (N/P 25
he percentag
nsity of the
Serum-free
haracterize
ells and pro
ntrols were
gene deliver
2.4 and 2.5
esting trend
h the PGAG
T1-2
5
Gg-
10
ered with th
ls only and
5) and poly
ge of cells p
cells.
Media: Luc
how effic
omote trans
used: Glyc
ry experime
5, respectiv
ds. In the ab
G polyplexe
Gg-
25
Gm
eg-1
0
Gm
e g-2
5he PGAG a
DNA only
y-L-arginine
positive for
ciferase rep
iently the
sgene expre
cofect Trans
ents were ca
vely) for eac
bsence of se
es, increased
g Tg-1
0
Tg-2
5
and PGAA
are used as
e (PLA) wer
Cy5 fluores
porter gene e
guanidine-c
ession. Simi
sfection Rea
arried out b
ch polyplex
erum (Opti-
d with an in
Tmeg
-10
Tmeg
-25
polymers
s negative
re used as
cence; the
expression
containing
ilar to the
agent and
both in the
x type and
-MEM), it
ncrease in

44
the N/P ratios from 5 to 30. Overall, of the new polymers examined, Gg was found to yield the
highest transgene expression within this series. Also, at lower N/P ratios, the galactarate
polymers Gg and G1 revealed the highest gene expression (similar to PLA), which correlates to
our findings that the galactarate units in the polymer appear to enhance interactions with pDNA
and promote stable polyplex formation.22 As the N/P ratio is increased, transgene expression
with the tartrate polymers (in particular, Tmeg) increases. Over all, the controls, Glycofect
revealed the highest gene expression in serum-free media. PLA revealed a similar gene
expression profile to the PGAGs and PGAAs (G1 and T1), however, above an N/P ratio of 15,
total cell death was observed and expression values were not able to be recorded.
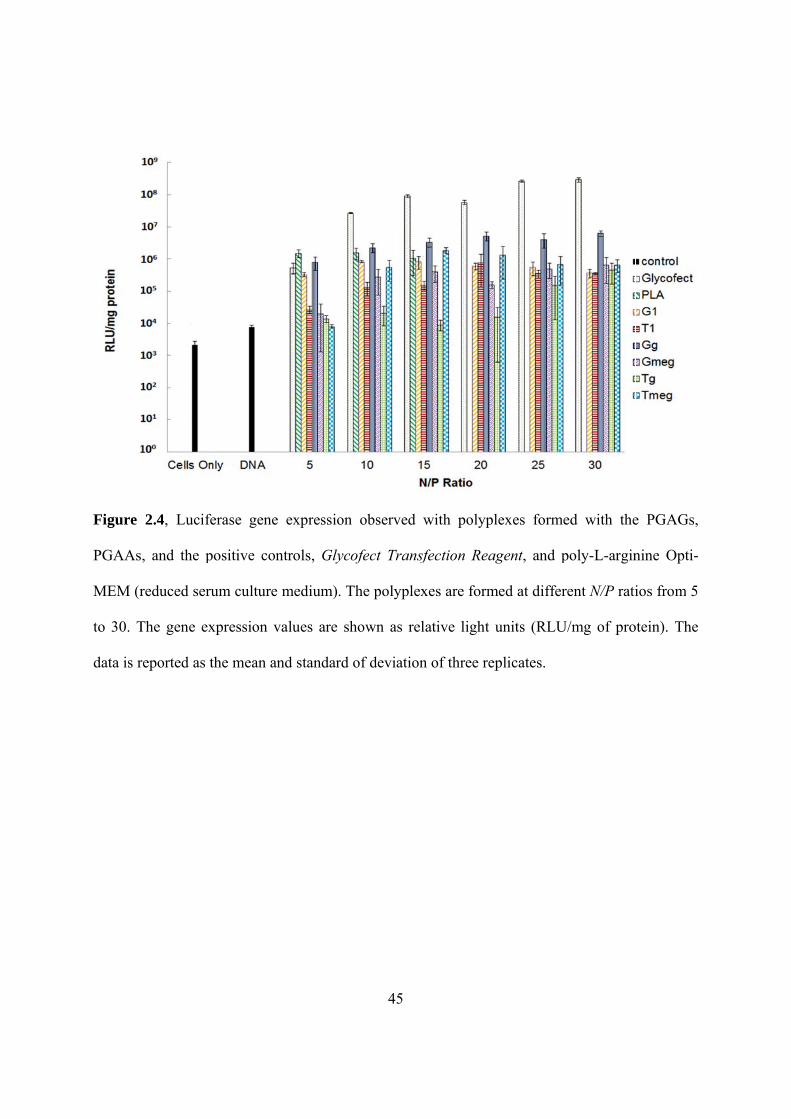
Figure
PGAAs
MEM (r
to 30. T
data is r
2.4, Lucife
, and the p
reduced seru
The gene ex
reported as t
erase gene
positive con
um culture m
xpression va
the mean an
expression
ntrols, Glyco
medium). T
alues are sh
nd standard o
45
observed w
ofect Transf
The polyplex
hown as rel
of deviation
with polypl
fection Rea
xes are form
lative light
n of three re
lexes forme
agent, and p
med at differ
units (RLU
plicates.
ed with the
poly-L-argin
rent N/P rati
U/mg of pro
e PGAGs,
nine Opti-
ios from 5
otein). The

46
Figure 2.5, Luciferase gene expression observed with polyplexes formed with the PGAGs,
PGAAs and the positive controls Glycofect Transfection Reagent and poly-L-arginine in DMEM
containing 10% serum. The polyplexes are formed at N/P ratio 10 and 25. The gene expression
values are shown as relative light units per milligram of protein (RLU/mg). The data is reported
as the mean and standard of deviation of three replicates.
Figure 2.5 shows the transgene expression data for the PGAG and control polyplexes
formed at N/P ratios of 10 and 25 in the presence of serum. At both N/P ratios, compounds G1,
T1, Gmeg, Tg, and Tmeg (N/P 10 only) revealed minimal luciferase expression (similar to the
negative controls). However, polyplexes formed with Gg, particularly at N/P = 25, revealed high
gene expression similar to Glycofect and higher than PLA. This result is intriguing because the
guanidine oligomers are completely protonated at physiological pH and therefore do not have a
buffering capacity, however, Gg revealed gene expression values similar to Glycofect, which has
secondary amines in the polymer backbone. These results do not agree with the proton sponge
RLU
/mg
prot
ein
controlN/P 10N/P 25
107
106
105
104
103
102
101
100

47
hypothesis and suggest that the galactarate residues may play a role in the transfection.
Interestingly, when comparing the positive controls, PLA revealed lower gene expression than
Glycofect with Hela cells, and this result is likely related to its high toxicity (polyplexes
formulated at N/P ratios higher than 15 caused complete cell death in the experiment, which is
why the gene expression data is not available in Figure 2.4 for these N/P ratios). Overall,
polyplexes formed with Gg appeared to be the most effective pDNA delivery vehicles of the
PGAG oligomer series. This agent promoted binding at the lowest N/P ratio (1.5), the smallest
polyplex sizes, and the highest number of cells positive for Cy5-pDNA of all the PGAG created
and studies here. It is also interesting to note that Gg had a higher gene expression level than
Gmeg, while a reverse trend was observed for the tartrate-based, guanidine-containing polymers;
interestingly Tmeg promoted luciferase expression at N/P = 25, where Tg polyplexes were
complexly inactive. These data indicate that both the charge center and the carbohydrate type
play a large role in the delivery of pDNA to the cellular nucleus for transgene expression.
MTT Assay: The cell viability was characterized via an MTT assay using HeLa cells. As
shown in Figure 2.6, all of the PGAG and PGAA polyplexes exhibited low toxicity, as more
than 90% of the cells were viable at N/P ratios ranging from 5 to 30 over the 48 hour
experimental time course. The positive control, Glycofect, showed similar low toxicity. PLA,
however, revealed a very high cytotoxic response. Even though it displayed 80% cell viability at
an N/P ratio of 5, cell viability drastically decreased to about 16% as the N/P ratio increased to
20 and above. The large difference in cytoxic response when comparing the PGAGs to PLA is
likely two-fold: i) the low molecular weight of the PGAG oligomers likely plays a major role in
their low cytotoxic profile, and ii) the presence of a carbohydrate group could also be a factor in
promoting a biocompatible response.

48
Figure 2.6, HeLa cell viability following a 24 hour exposure to polyplexes formed with pDNA
and each PGAG, PGAAs, Glycofect Transfection Reagent and poly-L-arginine at different N/P
ratios from 5 to 30 in reduced serum culture medium. The fraction cell survival is normalized to
the untransfected cells and pDNAonly was also used as an experimental control.
2.4 Conclusions
Herein, a new series of carbohydrate-containing nucleic acid carriers
[poly(glycoamidoguanidine)s or PGAGs] has been synthesized by copolymerizing either
dimethylgalatarate or dimethyl-L-tartrate with monomers containing either a guanidine or
methyl-guanidine charge center. These polymers have been created as analogs to the extensively
studied previous systems that contain oligoethyleneamine charge centers (PGAAs) to compare
the effect of charge center type on the biological properties of these glycopolymers. The PGAG
vehicles bound pDNA at lower N/P ratios when compared to their PGAA analogs (T1 and G1)
0
0.2
0.4
0.6
0.8
1
1.2
1.4
CellsOnly
DNA 5 10 15 20 25 30
Cel
l Via
bilit
y
N/P Ratio
ControlGlycofectPLAG1T1GgGmegTgTmeg

49
and readily formed polyplexes with pDNA at sizes approximately around 100 nm, as
characterized from gel electrophoresis shift assay and DLS studies, respectively. Interestingly,
the PGAG oligomers were not cytotoxic and all analogs revealed high cellular uptake and
transgene expression in HeLa cells as compared to their amine-containing analogs (G1 and T1).
It is interesting to note that others have reported that guanidine groups within the backbone of
polymer vehicles can possibly assist in the cellular entry of nanoparticles.97,98 This study also
revealed that while the PGAGs do not provide any buffering capacity in the endosomal pH
range, two of the derivatives, Gg and Tmeg, promoted higher transgene expression values than
their amine-containing analogs T1 and G1. While we still do not fully understand these
intriguing results, we have found that a number of our polymer systems do not strictly obey the
proton sponge hypothesis, as analogous PGAA polymers (with a higher buffering capacity in the
cellular pH range) do not necessarily lead to higher transgene expression.53 To this end,
extensive studies in our lab are currently focused on understanding how the polymer structure
affects the routes of polyplex intracellular trafficking and results of these studies will be reported
in due course.
50
Chapter 3
Fast Amide Hydrolysis: Potential to Increase Transfection Efficiency
with Novel Self-degrading Structures
Key words: amide hydrolysis, non-enzymatic fast hydrolysis, asymmetric amide hydrolysis,
mild pH condition, neighboring group participation, hydrogen bond

51
3.1 Introduction
Since biodegradable polymers can facilitate stable release of drugs and avoid
accumulation in body,6 these types of polymers gained significant attention for nucleic acid
delivery due to low cytotoxicity and low requirement for drug dosage.99 Previous studies showed
that PGAAs with oligo secondary amines degraded at physiological pH.21 This property could
potentially contribute to high transfection efficiency and low toxicity observed with these
polymers. Also, PGAAs degrade slower than esters and could provide for a new motif that has a
longer and tunable degradation lifetime for drug release. Moreover, PGAAs degrade at
physiological pH rather than the low pH (around 4) required for acetals.100 The proposed
mechanism for PGAA degradation is via hydrolysis of amide linkages, but further studies are
needed to understand this.21 Generally, amide groups except sp3-hybridized nitrogen are
recognized to be very stable under mild pH conditions due to their resonance stabilization.101 The
normal conditions to promote amide hydrolysis involves hot and concentrated base or acid
environment. Fast amide hydrolysis usually involves enzymatic hydrolysis under physiological
pH.102,103 The half-life of non-enzymatic amide hydrolysis at physiological pH is over 7
years.104,105 Recent studies showed that neighboring group participation involving distorting the
amide bond and lowering the resonance with carbonyl group could also contribute to fast amide
hydrolysis.105-108
PGAAs with different hydroxyl stereochemistry have similar degradation rates, even
though they showed different binding properties with pDNA. Interestingly, PGAAs degrade
faster at higher pH (7.4) than at lower pH (5). These results suggest that the degree of
protonation of secondary amines could be potential to affect degradation properties.21

52
In order to study the mechanism of the fast amide hydrolysis of PGAAs, Dr. Vijay P.
Taori synthesized several small molecule modeling systems to mimic the structure of T4.
(Figure 3.1) All degradation studies were done in PBS under 37 oC to mimic physiological pH
conditions.
Figure 3.1, L-tartrate or succinate based small molecule models.
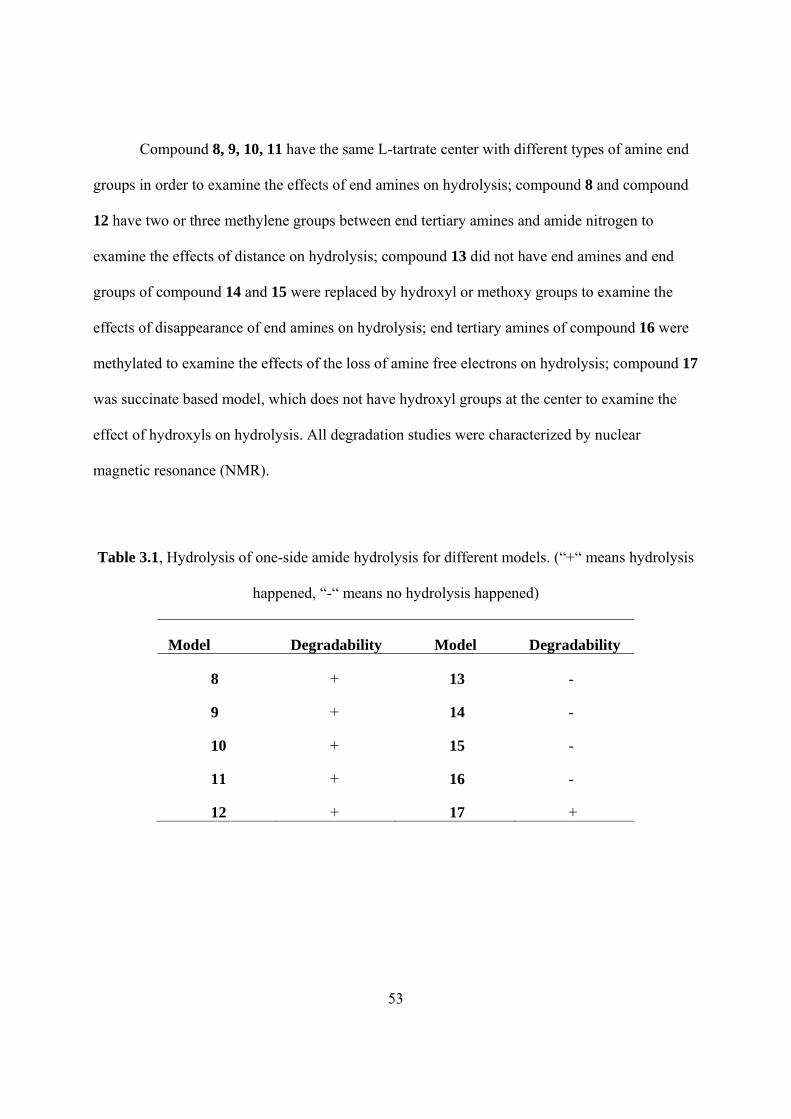
53
Compound 8, 9, 10, 11 have the same L-tartrate center with different types of amine end
groups in order to examine the effects of end amines on hydrolysis; compound 8 and compound
12 have two or three methylene groups between end tertiary amines and amide nitrogen to
examine the effects of distance on hydrolysis; compound 13 did not have end amines and end
groups of compound 14 and 15 were replaced by hydroxyl or methoxy groups to examine the
effects of disappearance of end amines on hydrolysis; end tertiary amines of compound 16 were
methylated to examine the effects of the loss of amine free electrons on hydrolysis; compound 17
was succinate based model, which does not have hydroxyl groups at the center to examine the
effect of hydroxyls on hydrolysis. All degradation studies were characterized by nuclear
magnetic resonance (NMR).
Table 3.1, Hydrolysis of one-side amide hydrolysis for different models. (“+“ means hydrolysis
happened, “-“ means no hydrolysis happened)
Model Degradability Model Degradability
8
9
10
11
12
+
+
+
+
+
13
14
15
16
17
-
-
-
-
+

54
Figure 3.2, 1H NMR of compound 9 during hydrolysis at different times. Figure adapted from
Dr. Vijay P. Taori’s dissertation.
Because NMR of compound 9 and the resulting degraded molecule was easy to be
elucidated, compound 9 was studied first. Figure 3.2 was the assay NMR degradation
experiment of compound 9 under physiological condition for 13 hours. Two regions (highlighted
by red rectangles) of newly formed peaks were discovered: 1. Peak e near 2.8-2.9 ppm were
from newly formed free amine groups representing 3.4 ppm (peak c) of same groups in
compound b); 2. Peak f and g near 3.3 and 3.45 ppm were from newly formed asymmetric

55
protons next to hydroxyls on carbohydrate groups representing 4.5 ppm (peak d) of same but
symmetric protons next to hydroxyls in compound 9. Also, peak b showed a small chemical shift
during degradation. These data showed rapid amide hydrolysis. More interestingly, this
compound degraded on one side, which means only one amide group of these molecules
degrades, leaving the other amide group intact on the structure. Also, it was found that the
hydrolysis reaction was first order to model concentration. Compound 8, 10, 11, 12 and 17
showed similar amide hydrolysis pattern, which indicates all compounds with free end amine
groups facilitated hydrolysis, even though the degradation rates were not same. (Table 3.1)
Compound 9, 10 and 11 degraded faster than compound 8 indicating that the compounds with
end tertiary amines degrade faster than that with primary amines. Compound 17 degraded slower
indicating the hydroxyl groups on carbohydrates are important to facilitate hydrolysis.
Compound 13, 14, 15 and 16, the models without end amine groups, with hydroxyl end groups,
with methoxyl end groups, or with quaternary end ammonium showed no degradation over long
periods of time, indicating that the end amine groups are essential to facilitate fast hydrolysis.
However, it still remains uncertain why hydrolysis occurs rapidly and why hydrolysis
always occurs only on one side of the molecules. My work was to further study different models
to understand the mechanism of hydrolysis.
3.2 Experimental Procedures
Materials Synthesis:
General: Unless specified, all chemicals were purchased from Sigma Aldrich Chemical
Co. and were used without further purification. NMR spectra were collected on a Varian Inova
56
MR-400MHz spectrometer and mass spectra of final compounds were obtained on an IonSpec
HiResESI mass spectrometer.
(2R,3R)-2,3-dihydroxy-N1,N4-bis(2-(methylamino)ethyl)succinamide (20, Scheme 3.1):
3.00 g (0.041 mol) N-methylethylenediamine was dissolved in 30 ml dry MeOH. 6.40 g (0.045
mol) ethyl trifluoroacetate (CF3COOEt) was dissolved in 20 ml dry MeOH and was dropwise
added to N-methylethylenediamine solution at 0 oC. Reaction mixture was further stirred at room
temperature for 24 hours followed by the addition of 10.00 g (0.046 mol) Boc anhydride. After 6
hours, solvent was rotary evaporated and the tert-butyl 2-aminoethyl(methyl)carbamate (18) was
recrystallized from 30 ml 1:1 (v/v) DCM/hexane twice to give a white powder. 18 was further
dissolved in 9:1 (v/v) MeOH/H2O mixture. 15 g anhydrous K2CO3 was added to solution. The
reaction mixture was stirred for 24 hours under room temperature and evaporated to stop the
reaction. The residue oil was redissolved in DCM and washed twice with H2O. The oil layer was
kept and solvent was again removed via rotary evaporation to give a yellowish oil. The product
(19) was further dried en vacuo overnight. (Yield: 4.11 g, 0.024 mol, 58%) 0.50 g (2.8 mmol) of
dimethyl L-tartrate was dissolved in 20 ml MeOH followed by the addition of 1.10 g (6.3 mmol)
of compound (19). Reaction mixture was stirred under room temperature for 48 hours after
which the solvent was removed via rotary evaporation. Crude compound was purified with a
silica gel column with 10:1 (v/v) CHCl3/190 proof EtOH solvent system. Tert-butyl group of this
compound was further deprotected by reacting with 4 M HCl in dioxane for 1 hour to obtain
compound (20) (Yield: 0.47 g, 1.8 mmol, 64%). 1H NMR (400 MHz, D2O) δ = 2.68 (s, 6H), 3.16
(t, 4H), 3.57 (t, 4H), 4.57 (s, 2H), 13C NMR (400 MHz, D2O), 32.93, 35.59, 48.45, 72.30, 174.61,
m/z = 263.1692 (M+H)+

57
N1,N4-bis(2-(dimethylamino)ethyl)-N1,N4-dimethylsuccinamide (21, Scheme 3.1): All
glassware was pre dried overnight before reaction. 1.00 g (9.8 mmol) of N,N,N’-
trimethylethylenediamine and 5.00 g (0.050 mol) of triethylamine (TEA) was dissolved in 20 ml
dry DCM in a 200-ml round bottom flask. 0.70 g (4.6 mmol) of succinyl chloride was dissolved
in 10 ml dry DCM and dropwise added to the round bottom flask from additional funnel. The
reaction was stirred in ice bath during addition followed by at room temperature for 2 hours.
TEA•HCl salt precipitated out and was filtered. Solvent was rotary evaporated, and excessive
amine was removed en vacuo overnight. Crude product was dissolved in 1 ml MeOH again
followed by precipitation and washed with THF to give a slightly yellow powder (21) (Yield:
1.10 g, 3.8 mmol, 83%). 1H NMR (400 MHz, D2O) δ = 2.79 (s, 6H), 3.18 (s, 12H), 3.41 (t, 4H),
3.83 (t, 2H), 13C NMR (400 MHz, D2O), 27.86, 35.16, 42.95, 43.18, 54.98, 175.84, m/z =
287.2429 (M+H)+
Scheme 3.1, Synthesis of compound 20 and 21

58
(2R,3R)-N1-(2-(dimethylamino)ethyl)-2,3-dihydroxysuccinamide (23, Scheme 3.2): 0.50
g (2.3 mmol) of degraded compound from compound 9 and 20 ml MeOH was added to a 50-ml
round bottom flask. Concentrated HCl solution was added dropwise until all solid was dissolved.
Solution was brought up to boil to remove excessive HCl. 0.005 g (0.03 mmol) p-toluenesulfonic
acid monohydrate was added to solution after cooled down. Reaction mixture was refluxed for
48 hours. Most of solvent was rotary evaporated, and ethyl acetate (EA) was added to precipitate
out compound (22). 22 was dried en vacuo overnight. 0.20 g (0.85 mmol) 22 was dissolved in 1
ml MeOH with 5 ml 4 M NH3 in MeOH in a 50-ml round bottom flask. Reaction was stirred for
48 hours. MeOH and excessive NH3 were rotary evaporated. Crude product was dissolved in
small amount of MeOH and precipitate against EA twice. Product was dried en vacuo overnight
to give a white powder (23) (Yield: 0.17 g, 0.78 mmol, 91%). 1H NMR (400 MHz, D2O) δ =
3.11 (s, 6H), 3.52 (t, 2H), 3.86 (t, 2H), 4.75 (s, 2H), 13C NMR (400 MHz, D2O), δ = 34.39, 43.04,
56.47, 72.17, 72.26, 174.62, 176.73, m/z = 220.1553 (M+H)+
(2R,3R)-N1-(3-(dimethylamino)propyl)-2,3-dihydroxysuccinamide (25, Scheme 3.2):
0.50 g (2.1 mmol) of degraded compound from compound 12 and 20 ml MeOH was added to a
50-ml round bottom flask. Concentrated HCl solution was added dropwise until all solid was
dissolved. Solution was brought up to boil to remove excessive HCl. 0.005 g (0.03 mmol) p-
toluenesulfonic acid monohydrate was added to solution after cooled down. Reaction mixture
was refluxed for 48 hours. Most of solvent was rotary evaporated, and ethyl acetate (EA) was
added to precipitate out compound (24). 24 was dried en vacuo overnight. 0.20 g (8.1 mmol) 24
was dissolved in 1 ml MeOH with 5 ml 4 M NH3 in MeOH in a 50-ml round bottom flask.
Reaction was stirred for 48 hours. MeOH and excessive NH3 were rotary evaporated. Crude
product was dissolved in small amount of MeOH and precipitate against EA twice. Product was

59
dried en vacuo overnight to give a white powder (25) (Yield: 1.67 g, 7.2 mmol, 89%). 1H NMR
(400 MHz, D2O) δ = 2.10 (m, 2H), 3.00 (s, 6H), 3.27 (t, 2H), 3.50 (m, 2H) 4.67 (s, 2H), 13C
NMR (400 MHz, D2O), 24.10, 35.74, 42.74, 55.19, 72.15, 72.23, 174.07, 176.86, m/z =
234.1720 (M+H)+
Scheme 3.2, Synthesis of compound 23 and 25
(4S,5R)-N4,N5-bis(2-(dimethylamino)ethyl)-2,2-dimethyl-1,3-dioxolane-4,5-
dicarboxamide (27, Scheme 3.3): The synthesis of compound 26 was completed in a similar
manner to the method of dimethyl 2,3-O-isopropylidene-L-tartrate.109 4.00 g (0.024 mol) meso-
tartaric acid monohydrate, 20 ml 2,2-dimethoxypropane, and 0.05 g (0.3 mmol) p-
toluenesulfonic acid monohydrate were mixed in a 100 ml round bottom flask and refluxed under

60
N2 (g) for 5 hours to form a dark red solution, after which an additional 5 ml 2,2-
dimethoxypropane and 25 ml cyclohexane were added into solution. The flask was fitted with a
Vigreux column and a variable reflux distilling head. The mixture was distilled to remove the
MeOH-cyclohexane and acetone-cyclohexane azeotropes. 1 g of anhydrous K2CO3 was added to
the solution and the mixture was stirred for another 3 hours. The K2CO3 was filtered out and the
volatile residue was evaporated. The mixture was recrystallized under low temperature (-80 oC)
with hexane twice to give a slightly yellow oil dimethyl 2,3-O-isopropylidene-meso-tartrate (26)
at room temperature. (Yield: 4.52 g, 0.020 mol, 84%) 2.00 g (9.2 mmol) of 26 and 1.90 g (0.022
mol) of N,N-dimethylethylenediamine were dissolved in 10 ml MeOH in a 50-ml round bottom
flask. The reaction mixture was stirred for 24 hours. The solvent was evaporated and the
remaining yellow oil was dried en vacuo overnight to remove excessive amines. Product was
recrystallized with 15 ml hexane twice to form a light yellow powder. The product (27) was
filtered and dried en vacuo overnight. (Yield: 2.58 g, 7.9 mmol, 86%) 1H NMR (400 MHz,
CDCl3) δ = 1.40 (s, 3H), 1.67 (s, 3H) 2.22 (s, 12H), 2.39 (t, 4H), 3.31 (t, 4H), 4.75 (s, 2H), 6.77
(s, 2H), 13C NMR (400 MHz, CDCl3), δ = 25.22, 26.58, 36.59, 45.23, 57.66, 77.84, 111.27,
167.43, m/z = 331.2626 (M+H)+

61
Scheme 3.3, Synthesis of compound 27
(4R,5R)-N4,N5-bis(2-(dimethylamino)ethyl)-2,2-dimethyl-1,3-dioxolane-4,5-
dicarboxamide (28): 2.00 g (9.2 mmol) of dimethyl 2,3-O-isopropylidene-L-tartrate, 1.90 g
(0.022 mol) N,N-dimethylethylenediamine were dissolved in 10 ml MeOH in a 50-ml round
bottom flask. The reaction mixture was stirred for 24 hours. The solvent was removed via rotary
evaporation and the remaining yellow oil was dried en vacuo overnight to remove excessive
amines. The mixture was recrystallized under low temperature (-80 oC) with hexane two times to
yield a slightly yellow oil at room temperature. The product was dried en vacuo overnight to
yield 28. (Yield 2.83 g, 8.5 mmol, 93%) 1H NMR (400 MHz, D2O) δ = 1.51 (s, 6H), 2.26 (s,
12H), 2.55 (t, 4H), 3.42 (t, 4H), 4.65 (s, 2H), 13C NMR (400 MHz, D2O), δ = 25.16, 36.58, 43.94,
56.68, 77.16, 113.65, 171.12, m/z = 331.2637 (M+H)+

62
NNH2
O O
H
H
O
O
O
O
O O
H
H
O
HN
O
HNN
N
28
Scheme 3.4, Synthesis of compound 28
(2R,3S)-N1,N4-bis(2-(dimethylamino)ethyl)-2,3-dihydroxysuccinamide (29, Scheme 3.5):
0.50 g (1.5 mmol) of 27 was mixed with 3 ml 4 M HCl in dioxane. The mixture was stirred at
room temperature for 2 hours. The solvent and excess HCl was then removed via rotary
evaporation. The remaining powder was further dried en vacuo overnight to give a white powder
(29) Yield: (0.38 g, 1.3 mmol, 87%). 1H NMR (400 MHz, D2O) δ = 2.95 (s, 12H), 3.35 (t, 4H),
3.70 (m, 4H), 4.62 (s, 2H), 13C NMR (400 MHz, D2O), 34.07, 43.09, 56.60, 73.20, 173.82, m/z =
291.2269 (M+H)+
Scheme 3.5, Synthesis of compound 29
63
Hydrolysis Kinetics Studies:
General: All kinetics studies were done at pD 7.5 in D2O-PBS (pH for H2O-PBS = 7.4)
or at pD 11.2 in D2O-K2CO3 (pH for H2O-K2CO3 = 11.0) unless specified under 37 oC.
Phosphate buffered saline (PBS) was purchased from Invitrogen (Carlsbad, CA). Deuterated
phosphate buffered saline (D2O-PBS) was prepared by freeze drying certain amount of PBS
followed by adding of D2O to re-dissolve the buffer salt to its initial volume. D2O-K2CO3 was
prepared by dissolving K2CO3 in D2O for desired pD. The concentration of different model
molecules was maintained at 0.05 mole/L. Each hydrolysis was measured in duplicate with two
same samples in two NMR tubes.
Hydrolysis at different pD: All kinetics models were done at pD 7.5 and pD 11.2.
Compound 9 and 12 was further studied at pD 2.0 and 5.0.
Hydrolysis under D2O/CD3OD mixture: In order to understand the effect of water
concentration on amide cleavage, hydrolysis was done in solution with D2O/CD3OD mixture at
different ratios: 75% D2O/25% CD3OD, 50% D2O/50% CD3OD, 25% D2O/ 75% CD3OD and
100% CD3OD.
pH Titration Studies:
Most of the symmetric compounds have two amines at the terminal position of the
molecules. Therefore, there exist different combinations of three statuses at different pH: 1. both
amines protonated; 2. only one amine is protonated; 3.both amines deprotonated. Because of the
ease to measure the NMR of the compounds both pre- and post-hydrolysis of 9 and 12, these two
compounds were used for study.

64
Solutions of compound 9 and 12 were made to have a concentration of 0.035 mole/L in
ultrapure water. The pH was adjusted to around 1 with 1 mole/L HCl to avoid hydrolysis at high
pH. The solution was titrated with standardized NaOH and pH was recorded with a Fisher
accumet BASIC AB 15 pH meter (Pittsburgh, PA). NaOH was standardized with a known mass
of primary standard potassium hydrogen phthalate. Potassium hydrogen phthalate was dried
overnight and was kept dry to be cooled down before standardization.
3.3 Results and Discussion
All compounds were made based on different parameters that could potentially affect
hydrolysis profiles including the terminal amine type, hydroxyl stereochemistry, secondary or
tertiary amide, and asymmetry of two terminal groups. (Figure 3.3)
Figure 3.3, Possible changeable parameters for hydrolysis models.
To compare all different hydrolysis effects of each structure characteristic with that of
compound 9, different models mimicking compound 9 but with different functionalities were
synthesized. Compound 20 was synthesized with terminal secondary amines to examine whether
the difference in pKa or amine types will affect hydrolysis rate. Compound 21 was synthesized
with tertiary amides (R= CH3) instead of secondary amide. Compound 23 and 25 were
asymmetric compounds to see whether only one terminal amine can facilitate hydrolysis and on
which side amide hydrolysis occurs. Also, the spacers between amine nitrogen and amide
65
nitrogen can be altered: 2 methylene groups for 23 and 3 methylene groups for 25. Also, it
should be noted that compound 27 and compound 28 are two diastereomers. The hydroxyl
groups of these two models were protected, and therefore, the conformation of the hydroxyl
groups are locked resulting in a smaller distance between two amide groups for 27 and a larger
distance between two amide groups for 28. The difference in the distance and conformation of
the amides and amines could affect the interaction of the two end chains and possibly the
hydrolysis rate. Compound 29 is a diastereomer to compound 9. Studying the hydrolysis kinetic
difference between compound 29 and 9 could confirm whether the different hydrolysis rates of
compound 27 and 28 resulted from the distance between the amide groups and terminal amines.
The possible hydrolysis mechanism will be discussed after the hydrolysis kinetics studies.

66
Hydrolysis Kinetics Studies at pD 7.5 and 11.2:
Figure 3.4, 1H NMR of compound 20 during hydrolysis.
Figure 3.5, Hydrolysis kinetics of compound 20.
0
0.1
0.2
0.3
0.4
0.5
0.6
0.7
0.8
0.9
0 50 100 150 200 250 300
Con
vers
ion
Time, hpD 7.5 pD 11.2
20

67
Figure 3.6, 1H NMR of compound 21 during hydrolysis.
Figure 3.7, Hydrolysis kinetics of compound 21.
00.10.20.30.40.50.60.70.80.9
1
0 50 100 150 200 250 300
Con
vers
ion
Time, hpD 7.5 pD 11.2
21

68
NHN NH2
O
OOH
OHN
HN OH
O
OOH
OHNH3
a
a
a
a
a
b b
b
c c
c
d
d
fe
ef
Figure 3.8, 1H NMR of compound 23 during hydrolysis.
Figure 3.9, Hydrolysis kinetics of compound 23.
00.10.20.30.40.50.60.70.80.9
1
0 50 100 150
Con
vers
ion
Time, hpD 7.5 pD 11.2
23

69
NHN
NH2
O
OOH
OH
NHN
OHO
OOH
OHNH3
a
a
a
a
a
b b
b
c
c
d d
c
d
e
e
fg
f g
Figure 3.10, 1H NMR of compound 25 during hydrolysis.
Figure 3.11, Hydrolysis kinetics of compound 25.
00.10.20.30.40.50.60.70.80.9
1
0 50 100 150 200 250 300
Con
vers
ion
Time, hpD 7.5 pD 11.2
25

70
ge
Figure 3.12, 1H NMR of compound 27 during hydrolysis.
Figure 3.13, Hydrolysis kinetics of compound 27.
00.10.20.30.40.50.60.70.80.9
1
0 10 20 30 40
Con
vers
ion
Time, hpD 7.5 pD 11.2
27
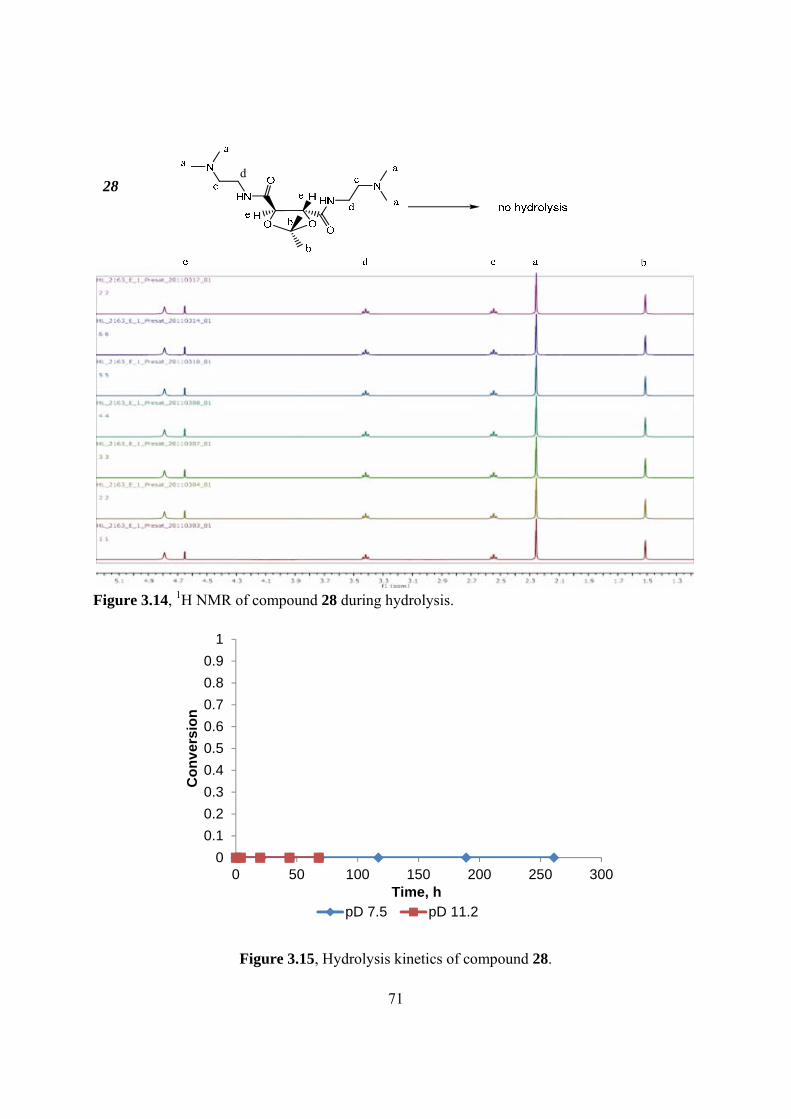
71
d
Figure 3.14, 1H NMR of compound 28 during hydrolysis.
Figure 3.15, Hydrolysis kinetics of compound 28.
00.10.20.30.40.50.60.70.80.9
1
0 50 100 150 200 250 300
Con
vers
ion
Time, hpD 7.5 pD 11.2
28

72
NHN
NH
O
ON
OH
OH
NHN
OHO
OOH
OHH2N
Na
a
aa
aa
a
a
a
b e
b
c
c
d
d e
g
f
f g
hi
j
h i j
Figure 3.16, 1H NMR of compound 29 during hydrolysis.
Figure 3.17, Hydrolysis kinetics of compound 29.
00.10.20.30.40.50.60.70.80.9
1
0 50 100 150 200 250 300
Con
vers
ion
Time, hpD 7.5 pD 11.2
29

73
Table 3.2, Hydrolysis kinetics of different models. (“-“ means that model did not hydrolyze.)
Models K (pD 7.5), h-1 Half-life (pD 7.5), h K (pD 11.2), h-1 Half-life (pD 11.2), h
8
9
12
20
0.0007
0.0020
0.0006
0.0015
971
347
1155
462
0.0088
0.030
0.0043
0.027
79
23
161
26
21 - - - -
23 0.0054 128 0.114 6
25 0.0014 495 0.055 13
27 0.048 14 0.675 1
28 - - - -
29 0.0019 364 0.039 18
Generally, all hydrolysis kinetics were calculated based on the integration of new formed
peaks highlighted in the red rectangles from 1H NMR. All hydrolysis reactions behave first-order
to modeling compound concentration. Interestingly, it has been found that hydrolysis only occurs
on one side of the model molecules due to the nonequivalence of asymmetric hydrolysis products
that appeared in the 1H NMR trace. A bigger K value or a smaller half-life in Table 3.2
represents a faster hydrolysis rate and vice versa.

74
Compound 20 hydrolyzed slower than compound 21 but faster than compound 20 at both
pH. Also, previous studies showed that compound 23 and compound 25 hydrolyzed faster than
compound 9. There results stated higher basicity of terminal amine resulted in faster hydrolysis.
Compound 21 which had tertiary amides showed no hydrolysis at both pDs for a long
time, indicating that the hydrogen on the amide nitrogen is important to facilitate hydrolysis.
Also, this behavior is not due to the lack of hydroxyl groups because compound 17 (the
secondary amide analog) exhibits hydrolysis at same pD.
Compound 23 and 25 were two asymmetric compounds with tertiary amines on one end
chain. These two compounds showed amide hydrolysis on the side without the terminal amine.
(m/z for 23 hydrolysis product = 221.1139 (M+H)+) These results showed that terminal amines
were important to hydrolysis. Also, compound 25 hydrolyzed slower than compound 23
indicating a longer spacer between amide nitrogen and amine nitrogen slows down hydrolysis.
This result matches the slower hydrolysis of compound 12 compared to compound 9.
Figure 3.18, Conformations of compound 27 and 28.

75
Figure 3.18 shows the Newman Projections of the diastereomers 27 and 28 by viewing
through the two central carbons of meso-tartrate or the L-tartrate moiety. Newman projections
showed that the distance of the two end chains of compound 27 is much closer than that of 28.
Compound 27 hydrolyzed significantly faster than any other models studied at both pDs, while
28 showed a complete lack of hydrolysis. Final product (m/z = 260.1372 (M+H)+) indicated that
hydrolysis still occurred only on one end chain for compound 27. These data suggest the
interaction of two end chains or the close proximity of the amide carbonyls could facilitate
neighboring group participation mechanism and be the cause to increase the rate of hydrolysis.
Compound 29 and 9 are diastereomers like 27 and 28 except the two center carbons of
meso-tartrate or L-tartrate moiety can rotate freely for terminal groups to move close to each
other. The two model compounds were synthesized as controls for compound 27 and 28.
Interestingly, the kinetics results showed almost no difference between the hydrolysis kinetics of
these two compounds at both pDs. The similarity of the kinetics could support that the
intramolecular interaction of end chains is important to hydrolysis suggested by absolutely
different hydrolysis kinetics of compound 27 and 28.
All these hydrolysable compounds facilitated unexpected rapid hydrolysis even at pD 7.5.
A small difference in structure resulted in very different hydrolysis profiles.
Hydrolysis at different pD:
Early studies showed that normal amide hydrolysis can be facilitated in strong acidic or
basic conditions. Compound 9 and 12 were further studied at acidic pD: 2.0 and 5.0. However,
no hydrolysis was observed for these two compounds even at pD 2.0. (Figure 3.19 and Figure
3.20) This suggests that the hydrolysis does not follow normal amide hydrolysis which should

76
functionalize at low pH also, and supports that the free terminal amines are important to
hydrolysis. Therefore, a pH titration was completed to determine the pKa of the terminal amines
and relate the hydrolysis phenomena with the degree of prononation of the terminal amines.
Figure 3.19, Hydrolysis of compound 9 at various pD.
Figure 3.20, Hydrolysis of compound 12 at various pD.
0
0.1
0.2
0.3
0.4
0.5
0.6
0.7
0.8
0.9
1
0 100 200 300
Con
vers
ion
Time, h
pD 2pD 5pD 7.5pD 11.2
0
0.1
0.2
0.3
0.4
0.5
0.6
0.7
0.8
0.9
1
0 100 200 300
Con
vers
ion
Time, h
pD 2pD 5pD 7.5pD 11.2

77
pKa Measurement and pH Titration Studies:
pH titration experiments were completed to determine pKa for the diamine model 9 and
12 conjugate di-acids. The pKa can tell how many terminal amines were protonated at a certain
pH. pKa was measured by pH titration: pH at middle point of two pH jump point given by the
secondary derivative of pH vs. volume. (Figure 3.21)
Figure 3.21, pH titration curve for compound 9
Table 3.3, pKa values of conjugate acids of compound 9 and 12
Models pKa
9 8.75
12 9.25
-200
-150
-100
-50
0
50
100
150
200
0.00
2.00
4.00
6.00
8.00
10.00
12.00
14.00
35.00 40.00 45.00 50.00 55.00 60.00 65.00se
c. d
eriv
ativ
e, m
l-2
pH
Volume NaOH, mlpH sec. derivative

78
Calculated from the pKa of compound 9 and 12, at pH 11, both terminal amines are
deprotonated, while at pH 7.4, more than 80% terminal amines are protonated. Therefore, the
free amine can still facilitate hydrolysis at both pDs, except that hydrolysis rate was slower at a
pD 7.5. However, at lower pD such as 2.0 and 5.0, two effects could dramatically slow down or
terminate hydrolysis: 1. concentration of OH- or OD- significantly decreases; 2. terminal amines
tend to be protonated.
Hydrolysis under D2O/CD3OD mixture:
All the reactions are first order to concentration of model. However, the concentration of
D2O or OD- never was changed during the hydrolysis experiments. Therefore, PBS-D2O/CD3OD
mixtures at different ratios: 75% D2O/25% CD3OD, 50% D2O/50% CD3OD, 25% D2O/ 75%
CD3OD and 100% CD3OD were used as solvent. The pD was adjusted to 9 for a moderate
hydrolysis rate.
Figure 3.22, Hydrolysis of compound 9 in D2O CD3OD mixture
0
0.1
0.2
0.3
0.4
0.5
0.6
0.7
0 20 40 60 80 100
Con
vers
ion
Time, h0%D2O+100%CD3OD 25%D2O+75%CD3OD50%D2O+50%CD3OD 75%D2O+25%CD3OD
0%D2O+100%CD
3OD
50%D2O+50%CD
3OD
25%D2O+75%CD
3OD
75%D2O+25%CD
3OD

79
Figure 3.23, Kinetics of ln(1/(1-c)) = Kt
Figure 3.24, Kinetics of K = k[D2O]2
y = 8E-05xR² = 0.6581
y = 0.0019xR² = 0.9975
y = 0.0052xR² = 0.9994
y = 0.0111xR² = 0.9985
0
0.2
0.4
0.6
0.8
1
1.2
0 20 40 60 80 100
ln(1
/(1-c
))
Time, h
0%D2O+100%CD3OD 25%D2O+75%CD3OD50%D2O+50%CD3OD 75%D2O+25%CD3OD
y = 0.0000076x2R² = 0.9988
0.0000
0.0020
0.0040
0.0060
0.0080
0.0100
0.0120
0 10 20 30 40 50
K
[D2O], mol/L
0%D2O+100%CD
3OD
50%D2O+50%CD
3OD
25%D2O+75%CD
3OD
75%D2O+25%CD
3OD

80
It was previously determined that the hydrolysis kinetics rate follows first order to model
compound concentration, or r = K*[Model]. Hydrolysis kinetics showed that K is also directly
proportional to [D2O]2. Furthermore, faster hydrolysis rates were observed in a basic
environment. Therefore, the functional group could be both OD- and D2O. Reaction rate could be
expressed by r = k[Model]*[D2O]2 at a certain pD or r = k[Model]*[H2O]2 at a certain pH.
Possible Mechanisms:
Figure 3.25, Possible mechanism 1

81
Figure 3.26, Possible mechanism 2
Two different possible mechanisms were proposed to explain the fast amide hydrolysis.
Possible mechanism 1 (Figure 3.25) states that the amide hydrogen on end chain 1 will
form a hydrogen bond with the terminal amine on the end chain 2 and the amide hydrogen on
end chain 2 will form hydrogen bond with carbonyl oxygen on end chain 1. The resulting effect
is to pull the electron cloud away from the carbonyl carbon and to make it more positively
charged. This effect could make the OH- attack the carbonyl carbon and facilitate hydrolysis
more easily.
Possible mechanism 2 (Figure 3.26) states that the end amine on end chain 1 will attack
the amide hydrogen on its own side. The enol group will attack the carbonyl carbon on end chain

82
2, forming a 5-membered ring. Amide bond breakage is followed by the ring opening of the
lactone.
Both of the possible mechanisms are able to state why all hydrolysis reactions happened
only on one side chain, why free deprotonated terminal amines were important to facilitate
hydrolysis, why hydrolysis occurs on the chain without terminal amines for asymmetric
compounds, why the compounds hydrolyzed much faster in basic solution while no hydrolysis
was observe in acidic environment, and why the small end chain distance is required for
hydrolysis. However, the only difference between these two mechanisms is that mechanism 1
requires both amides are primary or secondary amides for formation of two hydrogen bonds,
while mechanism 2 only requires primary or secondary amide on the end chain with terminal
amines for formation of one hydrogen bond.
Hydrolysis studies at pD 7.5 with compound 22 and dimethyl L-tartrate were compared.
Esters were used here instead of amides due to the easy synthesis. Further, high pH studies were
avoided due to the ease of hydrolysis of ester. If possible mechanism 1 is correct, neither of these
two compounds should hydrolyze due to the lack of one hydrogen bond. However, if mechanism
2 is correct, 22 should hydrolyze and dimethyl L-tartrate should not.
Results showed that only compound 22 hydrolyzed at pD 7.5 while dimethyl L-tartrate
did not. (Figure 3.27, 3.28, 3.29) Therefore, mechanism 2 could be the possible correct
mechanism.

F
Figure 3
Figure 3.27
3.28, Hydro
00.10.20.30.40.50.60.70.80.9
1C
onve
rsio
n
7, Hydrolysi
olysis kineti
0 20
is studies w
ics of compo
0 40
22
83
ith 22 and d
ound 22
60Time
dimethy
dimethyl L-t
80 1e, h
yl L-tartarat
tartrate at pD
00 120
te
D 7.5
0 140

Figure 3
3.4 Con
D
function
hydroly
importa
tertiary
for asym
hydroly
hydroly
or OD- c
between
3.29, Hydro
nclusions
Different m
nal groups c
ysis reaction
ant to facilita
amides to fa
mmetric com
ysis was obs
ysis. Hydroly
concentratio
n two end ch
olysis kineti
models mimic
could affect
s happened
ate hydrolys
facilitate hyd
mpounds; co
erved in aci
ysis rate foll
on. The prop
hains could
ics of dimeth
cking T1 de
and increas
only on one
sis; amides o
drolysis; hyd
ompounds h
idic environ
lowed first o
posed mech
increase the
84
hyl L-tartrat
elivery vehi
se the amide
e end chain;
on the side o
drolysis occ
hydrolyzed m
nment; and a
order to com
hanism sugg
e hydrolysis
te
cles were sy
e degradatio
; free deprot
of free term
curs on the c
much faster
a small end
mpound con
gests that nei
s rate.
ynthesized t
n rate. All t
tonated term
minal amines
chain withou
in basic sol
chain distan
ncentration a
ighboring g
to study whi
these model
minal amine
s cannot not
ut terminal
lution while
nce is requir
and first ord
group partici
ich
s showed
es were
t be
amines
e no
red for
der to OH-
ipation

85
Chapter 4
Future Directions

86
4.1 Introduction
Since studies showed that the degradation of nucleic acid delivery vehicles could release
drugs and help increase transfection efficiency,14,56-59 novel polymers with different degradation
properties could be synthesized with the model monomers synthesized above. These polymers
could potentially increase the transfection efficiency and be used to tune the degradation rate.
4.2 New Fast Degrading PGAAs for Nucleic Acid Delivery
Scheme 4.1, Synthesis of fast degrading PGAAs
The new PGAAs random copolymers will be synthesized by copolymerization of
dimethyl L-tartrate, 2,3-O-isopropylidene-meso-tartrate and oligoamines. (Scheme 4.1)
Discussed in Chapter 3, L-tartrate based models degraded much slower than 2,3-O-
isopropylidene-meso-tartrate based models, therefore, different ratios of these two models will be

87
applied. The polymers are assumed to degrade faster with higher percentage of 2,3-O-
isopropylidene-meso-tartrate moiety and degrade slower with higher L-tartrate moiety.
Experiments:
Degradation studies: Gel permeation chromatography (GPC) will be used to measure
polymer molecular weight. Polymers will be dissolved in PBS or pH 5 buffers and incubated at
37 oC for degradation studies. Sample at different time points will be measured by GPC to tell
how fast different polymers degrade.
Gel binding assay: Gel binding assay will be used to measure the ability of polymers to
bind nucleic acids. Polymer pDNA complexes (polyplexes) will be made at different N/P ratios.
Gel electrophoresis will measure from what N/P ratio polyplexes will be formed. Furthermore,
the stable polyplexes can be incubated at 37 oC for longer time. Gel binding assay of the
polyplexes after different incubation time points could tell from what time points polyplexes will
not be stable and nucleic acids will be released.
Cell culture experiments: Toxicity, cellular uptake and transfection efficiency assays
will be conducted with HeLa cells to measure how bio-active different polymers behave while
maintaining low cytotoxicity. Moreover, bio-activities of polymers on different cell lines are
different. Potentially, more cell types will be transfected with polyplexes.
Degradation and biological data will be correlated and show how the degradation rate
will affect nucleic acid delivery.

88
References
(1) Yang, Z. R.; Wang, H. F.; Zhao, J.; Peng, Y. Y.; Wang, J.; Guinn, B.-A.; Huang, L. Q. Cancer Gene Therapy 2007, 14, 599. (2) Niven, R.; Pearlman, R.; Wedeking, T.; Mackeigan, J.; Noker, P.; Simpson-Herren, L.; Smith, J. G. J. Pharm. Sci. 1998, 87, 1292. (3) Kunisawaa, J.; Masudaa, T.; Katayamaa, K.; Yoshikawaa, T.; Tsutsumia, Y.; Akashib, M.; Mayumia, T.; Nakagawa, S. Journal of Controlled Release 2005, 105, 344. (4) Verma, I. M.; Somia, N. NATURE 1997, 389, 239. (5) Mintzer, M. A.; Simanek, E. E. Chem. Rev. 2009, 109, 259. (6) Luten, J.; Nostrum, C. F. v.; Smedt, S. C. D.; Hennink, W. E. Journal of Controlled Release 2008, 126, 97. (7) Ghosn, B.; Haselton, F. R.; Gee, K. R.; Monroe, W. T. Photochemistry and Photobiology 2005, 81, 953. (8) Handwerger, R. G.; Diamond, S. L. Bioconjugate Chem. 2007, 18, 717. (9) Wang, C. Y.; Huang, L. Biochemistry 1989, 28, 9508. (10) Xu, R.; Wang, X.-L.; Lu, Z.-R. Langmuir 2010, 26, 13874. (11) Lin, Y.-L.; Jiang, G.; Birrell, L. K.; El-Sayed, M. E. H. Biomaterials 2010, 31, 7150. (12) Bachelder, E. M.; Beaudette, T. T.; Broaders, K. E.; Dashe, J.; Frechet, J. M. J. J. AM. CHEM. SOC. 2008, 130, 10494. (13) Wang, X.; Xie, X.; Cai, C.; Rytting, E.; Steele, T.; Kissel, T. Macromolecules 2008, 41, 2791. (14) Lim, Y.-B.; Han, S.-O.; Kong, H.-U.; Lee, Y.; Park, J.-S.; Jeong, B.; Kim, S. W. Pharm. Res. 2000, 17, 811. (15) Hwang, S. J.; Davis, M. E. Current Opinion in Molecular Therapeutics 2001, 3, 183. (16) Koh, J. J.; Ko, K. S.; Lee, M.; Han, S.; Park, J. S.; Kim, S. W. Gene Therapy 2000, 7, 2099. (17) Erickson, H. K.; Widdison, W. C.; Mayo, M. F.; Whiteman, K.; Audette, C.; Wilhelm, S. D.; Singh, R. Bioconjugate Chem. 2010, 21, 84. (18) Liu, Y.; Wenning, L.; Lynch, M.; Reineke, T. M. J. AM. CHEM. SOC. 2004, 126, 7422. (19) Liu, Y.; Reineke, T. M. J. Am. Chem. Soc. 2005, 127, 3004. (20) Lee, C.-C.; Liu, Y.; Reineke, T. M. Bioconjugate Chem. 2008, 19, 428. (21) Liu, Y.; Reineke, T. M. Biomacromolecules 2010, 11, 316. (22) Prevette, L. E.; Kodger, T. E.; Reineke, T. M.; Lynch, M. L. Langmuir 2007, 23, 9773. (23) Gabrielson, N. P.; Pack, D. W. Journal of Controlled Release 2008, 136, 54. (24) Liu, W. G.; Yao, K. D. Journal of Controlled Release 2002, 83, 1. (25) Coué, G.; Engbersen, J. F. J. Journal of Controlled Release 2011, xxx, xxx. (26) Griffiths, P. C.; Paul, A.; Khayat, Z.; Wan, K.-W.; King, S. M.; Grillo, I.; Schweins, R.; Ferruti, P.; Franchini, J.; Duncan, R. Biomacromolecules 2004, 5, 1422. (27) Strand, S. P.; Lelu, S.; Reitan, N. K.; Davies, C. d. L.; Artursson, P.; Vårum, K. M. Biomaterials 2010, 31, 975.

89
(28) MacLaughlin, F. C.; Mumper, R. J.; Wang, J.; Tagliaferri, J. M.; Gill, I.; Hinchcliffe, M.; Rollanda, A. P. Journal of Controlled Release 1998, 56, 259. (29) Germershaus, O.; Mao, S.; Sitterberg, J.; Bakowsky, U.; Kissel, T. Journal of Controlled Release 2008, 125, 145. (30) Mao, H.-Q.; Roy, K.; Troung-Le, V. L.; Janes, K. A.; Lin, K. Y.; Wang, Y.; August, J. T.; Leong, K. W. Journal of Controlled Release 2001, 70, 399. (31) Brissault, B.; Kichler, A.; Guis, C.; Leborgne, C.; Danos, O.; Cheradame, H. Bioconjugate Chem. 2003, 14, 581. (32) Neu, M.; Fischer, D.; Kissel, T. J. Gene Med. 2005, 7, 992. (33) Mecke, A.; Lee, D.-K.; Ramamoorthy, A.; Orr, B. G.; Holl, M. M. B. Langmuir 2005, 21, 8588. (34) Allende, D.; Simon, S. A.; McIntosh, T. J. Biophysical Journal 2005, 88, 1828. (35) Yang, L.; Harroun, T. A.; Weiss, T. M.; Ding, L.; Huang, H. W. Biophysical Journal 2001, 81, 1475. (36) Xu, Y.; Francis C. Szoka, J. Biochemistry 1996, 35, 5616. (37) Fattal, E.; Nir, S.; Parente, R. A.; Francis C. Szoka, J. Biochemistry 1994, 33, 6721. (38) Akinc, A.; Thomas, M.; Klibanov, A. M.; Langer, R. J. Gene Med. 2005, 7, 657. (39) BOUSSIF, O.; LEZOUALC'H, F.; ZANTA, M. A.; MERGNY, M. D.; SCHERMAN, D.; DEMENEIX, B.; BEHR, J.-P. Proc. Natl. Acad. Sci. 1995, 92, 7297. (40) KHALIL, I. A.; KOGURE, K.; AKITA, H.; HARASHIMA, H. Pharmacol. Rev. 2006, 58, 32. (41) Wen, Y.; Pan, S.; Luo, X.; Zhang, X.; Zhang, W.; Feng, M. Bioconjugate Chem. 2009, 20, 322. (42) Pathak, A.; Patnaik, S.; Gupta, K. C. Nucleic Acids Symposium Series 2009, 53, 57. (43) Pun, S. H.; Bellocq, N. C.; Liu, A.; Jensen, G.; Machemer, T.; Quijano, E.; Schluep, T.; Wen, S.; Engler, H.; Heidel, J.; Davis, M. E. Bioconjugate Chem. 2004, 15, 831. (44) Wang, C.-H.; Hsiue, G.-H. Bioconjugate Chem. 2005, 16, 391. (45) Kircheis, R.; Wightman, L.; Schreiber, A.; Robitza, B.; Rossler, V.; Kursa, M.; Wagner, E. Gene Therapy 2001, 8, 28. (46) Ferruti, P.; Marchisio, M. A.; Barbucci, R. Polymer Preprints 1985, 26, 1336. (47) Barbucci, R.; Casolaro, M.; Ferruti, P.; Barone, V.; Leli, F.; Oliva, L. Macromolecules 1981, 14, 1203. (48) Ferruti, P.; Manzoni, S.; Richardson, S. C. W.; Duncan, R.; Pattrick, N. G.; Mendichi, R.; Casolaro, M. Macromolecules 2000, 33, 7793. (49) Richardson, S.; Ferruti, P.; Duncan, R. Journal of Drug Targeting 1999, 6, 391. (50) Tomalia, D. A.; Baker, H.; Dewald, J.; Hall, M.; Kallos, G.; Martin, S.; Roeck, J.; Ryder, J.; Smith, P. Polym. J. 1985, 17, 117. (51) Ottaviani, M. F.; Furini, F.; Casini, A.; Turro, N. J.; Jockusch, S.; Tomalia, D. A.; Messori, L. Macromolecules 2000, 33, 7842. (52) Sonawane, N. D.; Szoka, F. C. J.; Verkman, A. S. The Journal of biological chemistry 2003, 278, 44826. (53) Liu, Y.; Reineke, T. M. Bioconjugate Chem. 2007, 18, 19. (54) Prevette, L. E.; Lynch, M. L.; Reineke, T. M. Biomacromolecules 2010, 11, 326.

90
(55) Reineke, T. M. Journal of Polymer Science: Part A: Polymer Chemistry 2006, 44, 6895. (56) Anderson, D. G.; Lynn, D. M.; Langer, R. Bioconjugate Chem. 2003, 42, 3153. (57) Kakizawa, Y.; Harada, A.; Kataoka, K. J. Am. Chem. Soc. 1999, 121, 11247. (58) Lackey, C. A.; Press, O. W.; Hoffman, A. S.; Stayton, P. S. Bioconjugate Chem. 2002, 13, 996. (59) Oster, C. G.; Wittmar, M.; Unger, F.; Lucian, B.-T.; Schaper, A. K.; Kissel, T. Pharm. Res. 2004, 21, 927. (60) Lackey, C. A.; Press, O. W.; Hoffman, A. S.; Stayton, P. S. Bioconjugate Chem. 2002, 13, 996. (61) Saito, G.; Swanson, J. A.; Lee, K.-D. Adv. Drug. Delivery Rev. 2003, 55, 199. (62) Lim, Y. B.; Kim, C. H.; Kim, K.; Kim, S. W.; Park, J. S. J. AM. CHEM. SOC. 2000, 122, 6524. (63) Kim, T. I.; Seo, H. J.; Choi, J. S.; Yoon, J. K.; Baek, J. U.; Kim, K.; J.S. Park Bioconjugate Chem. 2005, 16, 1140. (64) Wu, D.; Liu, Y.; Jiang, X.; Chen, L.; He, C.; Goh, S. H.; Leong, K. W. Biomacromolecules 2005, 6, 3166. (65) Li, X.; Su, Y.; Chen, Q.; Lin, Y.; Tong, Y.; Li, Y. Biomacromolecules 2005, 6, 3181. (66) Gillies, E. R.; Goodwin, A. P.; Frechet, J. M. J. Bioconjugate Chem. 2004, 15, 1254. (67) McKenzie, D. L.; Smiley, E.; Kwok, K. Y.; Rice, K. G. Bioconjugate Chem. 2000, 11, 901. (68) Davis, M. E.; Zuckerman, J. E.; Choi, C. H. J.; Seligson, D.; Tolcher, A.; Alabi, C. A.; Yen, Y.; Heidel, J. D.; Ribas, A. NATURE 2010, 464, 1067. (69) Davis, M. E. Current Opinion in Biotechnology 2002, 13, 128. (70) Putnam, D.; Gentry, C. A.; Pack, D. W.; Langer, R. Proc. Natl. Acad. Sci. 2001, 98, 1200. (71) Guo, X.; Szoka Jr, F. C. Acc. Chem. Res. 2003, 36, 335. (72) Davis, M. E. Mol. Pharmaceutics 2009, 6, 659. (73) Liu, Y.; Wenning, L.; Lynch, M.; Reineke, T. M. In Polymeric Drug Delivery I: Particulate Drug Carriers 2006, 923, 217. (74) Gopin, A.; Pessah, N.; Shamis, M.; Rader, C. Angewandte Chemie 2003, 115, 341. (75) Srinivasachari, S.; Liu, Y.; Zhang, G. D.; Prevette, L.; Reineke, T. M. J. AM. CHEM. SOC. 2006, 128, 8176. (76) Lee, C.-C.; Liu, Y.; Reineke, T. M. Bioconjugate Chem. 2008, 19, 428. (77) Liu, Y.; Reineke, T. M. Bioconjugate Chem. 2006, 17, 101. (78) Bryson, J. M.; Fichter, K. M.; Chu, W. J.; Lee, J. H.; Li, J.; Madsen, L. A.; McLendon, P. M.; Reineke, T. M. Proc. Natl. Acad. Sci. 2009, 106, 16913. (79) Taori, V. P.; Liu, Y.; Reineke, T. M. Acta biomaterialia 2009, 5, 925. (80) McLendon, P. M.; Buckwalter, D. J.; Davis, E. M.; Reineke, T. M. Mol. Pharmaceutics 2010, 7, 1757. (81) Mislick, K. A.; Baldeschwieler, J. D. Proc. Natl. Acad. Sci. U.S.A. 1996, 93, 12349. (82) McLendon, P. M.; Fichter, K.; Reineke, T. M. Molecular Pharmaceutics 2010, 7, 738.

91
(83) Fattal, E.; Nir, S.; Parente, R. A.; Szoka Jr, F. C. Biochemistry 1994, 33, 6721. (84) Medina-Kauwe, L. K.; Xie, J.; Hamm-Alvarez, S. Gene Therapy 2005, 12, 1734. (85) Gabrielson, N. P.; Pack, D. W. Biomacromolecules 2006, 7, 2427. (86) Behr, J. P. CHIMIA International Journal for Chemistry 1997, 1, 34. (87) Boussif, O.; Lezoualc'h, F.; Zanta, M. A.; Mergny, M. D.; Scherman, D.; Demeneix, B.; Behr, J. P. Proc. Natl. Acad. Sci. 1995, 92, 7297. (88) Pang, S. W.; Park, H. Y.; Jang, Y. S.; Kim, W. S.; Kim, J. H. Colloids and Surfaces B: Biointerfaces 2002, 26, 213. (89) Dubruela, P.; Christiaensb, B.; Vanloob, B.; Brackea, K.; Rosseneub, M.; Vandekerckhoveb, J.; E., S. European Journal of Pharmaceutical Sciences 2003, 18, 211. (90) Funhoff, A. M.; Nostrum, C. F.; Lok, M. C.; Fretz, M. M.; Crommelin, D. J. A.; E., H. W. Bioconjugate Chem. 2004, 15, 1212. (91) Nimesh, S.; Chandra, R. European Journal of Pharmaceutics and Biopharmaceutics 2008, 68, 647. (92) Bromberg, L.; Raduyk, S.; Hatton, T. A.; Concheiro, A.; Rodriguez-Valencia, C.; Silva, M.; Alvarez-Lorenzo, C. Bioconjugate Chem. 2009, 20, 1044. (93) Reineke, T. M.; Davis, M. E. Bioconjugate Chem. 2003, 14, 247. (94) Reineke, T. M.; Davis, M. E. Bioconjugate Chem. 2003, 14, 255. (95) Sambrook, M. R.; Beer, P. D.; Wisner, J. A.; Paul, R. L.; Cowley, A. R.; Szemes, F.; Drew, M. G. B. J. AM. CHEM. SOC. 2005, 127, 2292. (96) Lucas, R. L.; Benjamin, M.; Reineke, T. M. Bioconjugate Chem. 2008, 19, 24. (97) Funhoff, A. M.; van Nostrum, C. F.; Lok, M. C.; Fretz, M. M.; Crommelin, D. J. A.; Hennink, W. E. Bioconjugate Chem. 2004, 15, 1212. (98) Kim, T.; Lee, M.; Kim, S. W. Biomaterials 2010, 31, 1798. (99) Kanczler, J. A.; Ginty, P. J.; Barry, J. J. A.; Clarke, N. M. P.; Howdle, S. M.; Shakesheff, K. M.; Oreffo, R. O. C. Biomaterials 2008, 29, 1892. (100) Tomlinson, R.; Klee, M.; Garrett, S.; Heller, J.; Duncan, R.; Brocchini, S. Macromolecules 2002, 35, 473. (101) Somayaji, V.; Keillor, J.; Brown, R. S. J. AM. CHEM. SOC. 1988, 110, 2625. (102) Mukherjee, T.; Zhang, Y.; Abdelwahed, S.; Ealick, S. E.; Begley, T. P. J. AM. CHEM. SOC. 2010, 132, 5550. (103) Bisogno, T.; Petrocellis, L. D.; Marzo, V. D. Current Pharmaceutical Design 2002, 8, 125. (104) Kahne, D.; Still, W. C. J. Am. Chem. Soc. 1988, 110, 7529. (105) Gltisenkamp, K.-H.; Mengede, C.; Drosdziok, W.; Jahde, E.; Rajewsky, M. F. Bioorg. Med. Chem. Lett. 1998, 8, 285. (106) Kogan, R. L.; Fife, T. H. J. Org. Chem. 1984, 49, 5229. (107) Hegarty, A. F.; Frost, L. N.; Coy, J. H. J. Org. Chem. 1974, 39, 1089. (108) Kirby, A. J.; McDonald, R. S.; Smith, C. R. J. Chem. Soc., Perkin Trans. 2 1974, 1495. (109) Feit, P. W. J. Med. Chem. 1964, 7, 14.