understanding iri household-based and store-based …
TRANSCRIPT

Economic Research Service
Technical Bulletin 1942
April 2016
Understanding IRI Household-Based and Store-Based Scanner Data
Mary K. Muth, Megan Sweitzer, Derick Brown, Kristen Capogrossi, Shawn Karns, David Levin, Abigail Okrent, Peter Siegel, and Chen Zhen
United States Department of Agriculture

Economic Research Service www.ers.usda.gov
In accordance with Federal civil rights law and U.S. Department of Agriculture (USDA) civil rights regu-lations and policies, the USDA, its Agencies, offices, and employees, and institutions participating in or administering USDA programs are prohibited from discriminating based on race, color, national origin, religion, sex, gender identity (including gender expression), sexual orientation, disability, age, marital status, family/parental status, income derived from a public assistance program, political beliefs, or reprisal or retaliation for prior civil rights activity, in any program or activity conducted or funded by USDA (not all bases apply to all programs). Remedies and complaint filing deadlines vary by program or incident.
Persons with disabilities who require alternative means of communication for program information (e.g., Braille, large print, audiotape, American Sign Language, etc.) should contact the responsible Agency or USDA's TARGET Center at (202) 720-2600 (voice and TTY) or contact USDA through the Federal Relay Service at (800) 877-8339. Additionally, program information may be made available in languages other than English.
To file a program discrimination complaint, complete the USDA Program Discrimination Complaint Form, AD-3027, found online at How to File a Program Discrimination Complaint and at any USDA office or write a letter addressed to USDA and provide in the letter all of the information requested in the form. To request a copy of the complaint form, call (866) 632-9992. Submit your completed form or letter to USDA by: (1) mail: U.S. Department of Agriculture, Office of the Assistant Secretary for Civil Rights, 1400 Independence Avenue, SW, Washington, D.C. 20250-9410; (2) fax: (202) 690-7442; or (3) email: [email protected].
USDA is an equal opportunity provider, employer, and lender.
United States Department of Agriculture
Access this report online:
www.ers.usda.gov/publications/eib-economic-information-bulletin/TB-1942
Download the charts contained in this report:
• Go to the report’s index page www.ers.usda.gov/publications/ eib-economic-information-bulletin/TB-1942
• Click on the bulleted item “Download TB1942.zip”
• Open the chart you want, then save it to your computer
Recommended citation format for this publication:
Mary K. Muth, Megan Sweitzer, Derick Brown, Kristen Capogrossi, Shawn Karns, David Levin, Abigail Okrent, Peter Siegel, and Chen Zhen. Understanding IRI Household-Based and Store-Based Scanner Data, TB-1942, U.S. Department of Agriculture, Economic Research Service, April 2016.
Cover image from iStock.
Use of commercial and trade names does not imply approval or constitute endorsement by USDA.
United States Department of Agriculture
Economic Research Service
Technical Bulletin 1942
April 2016
Abstract
Commercial scanner data on retail food purchases are an integral resource for a broad range of food policy research. ERS has acquired proprietary household and retail scanner data from IRI, a market research firm, including novel data on nutrition infor-mation and health and wellness claims for a large number of products. This report provides a detailed description of the methodology, characteristics, and statistical prop-erties of these datasets and summarizes the limitations and considerations for using these data for food economics research. The report shows that the IRI data are an exten-sive, complex data source and provides an introduction to the data for new users and important considerations for advanced users.
Keywords: IRI, Consumer Network, InfoScan, scanner data, food at home, FAH, food prices, food expenditures
Acknowledgments
The authors thank Ted Jaenicke of Pennsylvania State University, Christiane Schroeter of California Polytechnic State University, and Hayden Stewart of USDA’s Economic Research Service (ERS) for peer-review comments. We also thank Lisa Becker, Cheryl Bergeon, and Daniel Pliske of IRI and Aylin Kumcu and Mark Denbaly of ERS for their contributions and input. Thanks also to Michaela Coglaiti of RTI International for assisting with data preparation and John Weber and Ethiene Salgado Rodríguez of ERS for editorial and design assistance.
About the authors: Mary Muth (program director and economist), Derick Brown (statistician), Kristen Capogrossi (economist), Shawn Karns (programmer/analyst), and Peter Siegel (statistician) are employed with RTI. Megan Sweitzer, David Levin, and Abigail Okrent are economists with USDA’s Economic Research Service. Chen Zhen is an associate professor with the University of Georgia.
Mary K. Muth, Megan Sweitzer, Derick Brown, Kristen Capogrossi, Shawn Karns, David Levin, Abigail Okrent, Peter Siegel, and Chen Zhen
Understanding IRI Household-Based and Store-Based Scanner Data

ii Understanding IRI Household-Based and Store-Based Scanner Data, TB-1942
Economic Research Service/USDA
Contents
Summary . . . . . . . . . . . . . . . . . . . . . . . . . . . . . . . . . . . . . . . . . . . . . . . . . . . . . . . . . . . . . . . . . . . . . iii
Introduction . . . . . . . . . . . . . . . . . . . . . . . . . . . . . . . . . . . . . . . . . . . . . . . . . . . . . . . . . . . . . . . . . . . .1
Overview of ERS Acquisition of Commercial Purchase Data . . . . . . . . . . . . . . . . . . . . . . . . . . . .1
Intended Purposes of the Data for Food Policy Research . . . . . . . . . . . . . . . . . . . . . . . . . . . . . . .2
Objectives and Approach to This Study . . . . . . . . . . . . . . . . . . . . . . . . . . . . . . . . . . . . . . . . . . . . .3
Household-Based Scanner Data: Consumer Network . . . . . . . . . . . . . . . . . . . . . . . . . . . . . . . . . .4
Overview of the Datasets . . . . . . . . . . . . . . . . . . . . . . . . . . . . . . . . . . . . . . . . . . . . . . . . . . . . . . . .4
Household Recruitment and Selection and Creation of the Static Panel . . . . . . . . . . . . . . . . . . . . . . . . . . . . . . . . . . . . . . . . . . . . . . . . . . . . . 10
Food Purchase Data Collection and Adjustments . . . . . . . . . . . . . . . . . . . . . . . . . . . . . . . . . . . .13
Projection Factor Calculations . . . . . . . . . . . . . . . . . . . . . . . . . . . . . . . . . . . . . . . . . . . . . . . . . . . 16
Variance Estimation . . . . . . . . . . . . . . . . . . . . . . . . . . . . . . . . . . . . . . . . . . . . . . . . . . . . . . . . . . . 17
Store-Based Scanner Data: InfoScan . . . . . . . . . . . . . . . . . . . . . . . . . . . . . . . . . . . . . . . . . . . . . .19
Overview of the Datasets . . . . . . . . . . . . . . . . . . . . . . . . . . . . . . . . . . . . . . . . . . . . . . . . . . . . . . . 19
Store Recruitment and Sampling . . . . . . . . . . . . . . . . . . . . . . . . . . . . . . . . . . . . . . . . . . . . . . . . .25
Food Purchase Data Collection and Adjustments . . . . . . . . . . . . . . . . . . . . . . . . . . . . . . . . . . . .29
Projection Factor Calculations . . . . . . . . . . . . . . . . . . . . . . . . . . . . . . . . . . . . . . . . . . . . . . . . . . .32
Variance Estimation . . . . . . . . . . . . . . . . . . . . . . . . . . . . . . . . . . . . . . . . . . . . . . . . . . . . . . . . . . .32
Product Information, Nutrition Data, and Product Claims Data . . . . . . . . . . . . . . . . . . . . . . . . . . . . . . . . . . . . . . . . . . . . . . . . . . . . . . . .33
Overview of the Contents of the Product Dictionary Files . . . . . . . . . . . . . . . . . . . . . . . . . . . . .33
Overview of the Contents of the Nutrition Product Dictionary . . . . . . . . . . . . . . . . . . . . . . . . . .35
Nutrition Data Collection and Preparation Process . . . . . . . . . . . . . . . . . . . . . . . . . . . . . . . . . . .39
Considerations in Using IRI Data for Policy Analysis . . . . . . . . . . . . . . . . . . . . . . . . . . . . . . . . .40
Household-Based Scanner Data: Consumer Network . . . . . . . . . . . . . . . . . . . . . . . . . . . . . . . . .40
Store-Based Scanner Data: InfoScan . . . . . . . . . . . . . . . . . . . . . . . . . . . . . . . . . . . . . . . . . . . . . . 41
Nutrition and Product Claims Data . . . . . . . . . . . . . . . . . . . . . . . . . . . . . . . . . . . . . . . . . . . . . . .42
Conclusion . . . . . . . . . . . . . . . . . . . . . . . . . . . . . . . . . . . . . . . . . . . . . . . . . . . . . . . . . . . . . . . . . . . .43
References . . . . . . . . . . . . . . . . . . . . . . . . . . . . . . . . . . . . . . . . . . . . . . . . . . . . . . . . . . . . . . . . . . . .44
Appendix: Changes to Subsequent Data Deliveries . . . . . . . . . . . . . . . . . . . . . . . . . . . . . . . . . . . . . . . . . . . .46
Table Organization . . . . . . . . . . . . . . . . . . . . . . . . . . . . . . . . . . . . . . . . . . . . . . . . . . . . . . . . . . . .46
Consumer Network Data . . . . . . . . . . . . . . . . . . . . . . . . . . . . . . . . . . . . . . . . . . . . . . . . . . . . . . .46
InfoScan Data . . . . . . . . . . . . . . . . . . . . . . . . . . . . . . . . . . . . . . . . . . . . . . . . . . . . . . . . . . . . . . . .46
Product Dictionaries and Nutrition Data . . . . . . . . . . . . . . . . . . . . . . . . . . . . . . . . . . . . . . . . . . .46
United States Department of Agriculture
A report summary from the Economic Research Service
ERS is a primary source of economic research and
analysis from the U.S. Department of Agriculture, providing timely informa-
tion on economic and policy issues related to agriculture, food, the environment, and
rural America.
www.ers.usda.gov
Economic Research Service
Technical Bulletin 1942
April 2016
Understanding IRI Household-Based and Store-Based Scanner Data
Mary K. Muth, Megan Sweitzer, Derick Brown, Kristen Capogrossi, Shawn Karns, David Levin, Abigail Okrent, Peter Siegel, and Chen Zhen
United States Department of Agriculture
April 2016
Find the full report at www.ers.usda.gov/
publications/eib-eco-nomic-information-
bulletin/tb-1942
What Is the Issue?
USDA’s Economic Research Service (ERS) purchases proprietary household and retail scanner data that are an integral resource for many policy-relevant research projects. ERS obtained data for 2008-12 from IRI, a market research company, on household food purchases (called Consumer Network) and retail food sales (called InfoScan). While ERS has purchased and evaluated similar household data from other vendors, differences in how the data are processed by vendors could have implications for research programs at ERS. Additionally, ERS purchased comprehensive store-level scanner data and product dictionaries, including nutrition and health claims data, and little is known about the attributes of these data. To help users better under-stand the limitations of these data for food policy research, and in accordance with Office of Management and Budget specifications, this report documents the characteristics and examines the statistical properties of these datasets. This is the first in a series of ERS reports examining the statistical properties of the IRI datasets.
What Did the Study Find?
The IRI household and retail scanner data and associated files can be an extensive, impactful resource, but researchers should understand the complexity and different properties of these datasets. The Consumer Network household scanner data are derived from over 120,000 house-holds who report what food products they purchased, when they shopped, and where they shopped. These households also report demographic information, and a subset of households report health and prescription drug information. The household purchase data can be linked to product characteristics (e.g., brand) and nutrition data, which gives a robust picture of the type of products households are purchasing. Researchers, however, should be aware of how well the household panel reflects the demographic makeup of the U.S. population and how the methods used to construct prices and demographic variables may affect analyses. In particular:
• The data include survey weights, which can be used to produce estimates for the total U.S. population. However, total U.S. expenditures reported by households in the weighted IRI data are less than those in other nationally representative datasets.
• Certain households are less likely to report purchases consistently, including households with heads under age 35, households in the lowest income bracket, and households with children. Hence, researchers should use caution in interpreting findings based on the data for certain population subgroups.
Understanding IRI Household-Based and Store-Based Scanner DataMary K. Muth, Megan Sweitzer, Derick Brown, Kristen Capogrossi, Shawn Karns, David Levin, Abigail Okrent, Peter Siegel, and Chen Zhen

• The household demographics file for 2008-12 is a snapshot of household demographic characteristics as of 2012, and changes in demographic characteristics over the time period cannot be determined.
• For the majority of products, IRI assigns prices using InfoScan data collected from stores, so many prices may not represent the exact value a household paid for an item. In addition, researchers should subtract the value of coupons from prices paid by households to calculate net amounts paid.
• Quantities purchased are not available for random-weight items (i.e., products purchased by the pound or unit, rather than by the package), which limits the usefulness of the data in food economics research involving fresh fruits and vegetables, meats and cheeses, and bakery items.
The InfoScan retail scanner data cover a large portion of retail food sales in the United States and contain billions of transactions by outlet type (i.e., grocery, convenience, dollar, drug, liquor, mass merchandiser, and club stores) and market area. Like the Consumer Network data, the InfoScan data can also be linked to nutri-tion and product characteristics data, enabling researchers to examine sales of products with particular charac-teristics geographically as well as by outlet type. However, these data also have limitations researchers should consider when using them to conduct food economics analysis. In particular:
• The IRI data obtained by ERS are a subset of the total data in InfoScan due to restrictions from IRI and retailers on what data may be released. As a result, the retail store set is a subset of IRI’s fully projected market tracking service, and survey weights are unavailable to produce nationally representative estimates.
• Some retailers release data for each individual store, while others release data for retailer-defined retail marketing areas. Because these geography-based aggregations vary by retailer, it can be difficult to examine geographic variation or conduct analyses by geographic area for certain retailers.
• Some retailers limit the release of data on private-label products to broad categories rather than individual Universal Product Codes (UPC), limiting the scope of analysis for research on private labels.
Lastly, the product dictionaries and nutrition and health claims data provide information about the items households are purchasing and retailers are selling. The product dictionaries give detailed descriptions of the products, including flavor, brand, style, and type for items with UPCs. The nutrition and claims data contain information on the Nutrition Facts panel and front-of-package health claims. However, researchers should note the following when using these datasets:
• Limited product information is available for random-weight perishable products, such as bulk or loose produce; uniform-weight perishable products, such as bagged produce; and private-label products from certain retailers.
• Only 41 percent of the UPC products in the retail store set have any nutrition and/or claims data; however, these products make up about 81 percent of total sales in the InfoScan data.
• IRI provides substantially better nutrition information coverage for private-label products than other commercial nutrition datasets; however, IRI’s nutrition coverage is less for private-label UPC products than for branded UPC products.
How Was the Study Conducted?
Researchers from ERS and RTI International examined the contents of the IRI datasets, initial documentation provided by IRI, and documentation prepared by ERS. Detailed discussions were conducted with IRI, including discussions on a set of questions developed under the study, and additional documentation was obtained from IRI on specific questions. Researchers documented their findings, prepared summaries of the data, and compared certain components of the datasets with Government or commercial data sources.
www.ers.usda.gov

1 Understanding IRI Household-Based and Store-Based Scanner Data, TB-1942
Economic Research Service/USDA
Understanding IRI Household-Based and Store-Based Scanner Data
Introduction
For more than a decade, ERS has been using commercial food-purchase data collected through household panels and retail store scanners to develop data products for research and analyses on topics related to food policy. Because of the complexity of the data, it is important for researchers to understand the underlying data collection processes and statistical properties of the data to ensure they are used appropriately.
This report focuses on data provided by IRI, a market research firm, and includes household-based scanner data (called Consumer Network), retail point-of-sale scanner data (called InfoScan), and product information and nutrition- and label-claims data linked by Universal Product Code (UPC) to both datasets.1 The Consumer Network data also include purchases for random-weight2,3 or perish-able products from a subset of the overall household panel. This report also touches briefly on two additional datasets: MedProfiler, an annual survey on health concerns, medical conditions, diet, and lifestyle offered to the households in the household panel; and RxPulse, purchase data for prescrip-tion medications.4
Overview of ERS Acquisition of Commercial Purchase Data
As a principal statistical agency of the Federal Government, ERS must meet Office of Management and Budget (OMB) guidelines to provide objective and credible economic statistics and intelligence based on sound and objective data. In compliance with OMB directives and standards, ERS should have documentation on sample construction and selection, data collection and construction proce-dures, and the statistical characteristics and properties of data used in its analyses.
The initial IRI data acquired by ERS cover the period 2008-12, but ERS plans to acquire annual updates for subsequent years.5 Previously, ERS had acquired Homescan data from The Nielsen Company that spanned 12 years (1998-2010). Although both IRI and Nielsen receive household purchase data from the same National Consumer Panel (NCP) (IRI, 2015), this change in vendor could have implications for research programs at ERS because the vendors differ in the way they
1An earlier ERS report was developed based on The Nielsen Company’s household-based scanner data (called Homes-can) in 2007, shortly after ERS began using commercial food-purchase data (see Muth et al., 2007).
2Random-weight products are perishable products without a UPC that are typically sold in bulk or by unit. This cat-egory includes fresh meat, poultry, seafood, bakery, fruits, vegetables, cheese, cold cuts and lunch meat, prepared foods, coffee, and candy, nuts, and seeds.
3There are four types of random-weight data in the IRI datasets: store sales of random-weight items, household pur-chases of random-weight items, store-level product information for random-weight items, and household-level product information for random-weight items.
4IRI also provided a store dictionary dataset; however, examination of this data resource is outside the scope of this report.
5As of April 2016, data for 2008-14 were available for use.

2 Understanding IRI Household-Based and Store-Based Scanner Data, TB-1942
Economic Research Service/USDA
organize and present the data. Furthermore, this is ERS’s first purchase of comprehensive retail store-level scanner data for all food products, and the purchase includes novel data on nutrition information and health and wellness claims for a large number of UPC products.
Because of the differences between Consumer Network data and Homescan data and the novelty of the IRI nutrition data and store-level InfoScan data in food economics and nutrition policy research, this report includes (1) documentation of IRI sample selection, data collection, and weighting and variance estimation procedures and methodologies; and (2) an examination of the statistical proper-ties of these proprietary data and their representativeness of the U.S. food market and the general population, as compared with other data sources.
This project reinforces ERS’s commitment to scientific integrity by meeting OMB’s statistical policy directives and guidelines related to statistical surveys. A thorough understanding of the data char-acteristics and properties will help one determine whether these data are suitable for testing certain study hypotheses and will assist with appropriate interpretation of empirical results. Furthermore, the findings could be useful to government or commercial entities whose data are documented or compared under this project in future data collection efforts.
This is the first in a series of reports examining the statistical properties of the IRI datasets. Future research will focus on comparing the IRI data to data from other sources to assess the coverage and to identify systematic differences across datasets. These efforts will include comparisons of the IRI household expenditure data, household health and medical information, retail store counts and sales data, and product nutrition information with comparable data from Government and commercial sources.
Intended Purposes of the Data for Food Policy Research
ERS conducts research to inform and enhance public and private decisionmaking on economic and policy issues related to food demand and supply. Food demand is motivated by a number of factors, including food prices, demographics, health concerns, and the food retail environment. Information on how these factors affect food purchasing behavior can aid in the effective design of food policy that addresses key nutrition and health concerns of the U.S. population. Similarly, agriculture and food industry stakeholders use economic and food policy-related information to aid in production decisions. Detailed and timely data on location, time, quantities, prices paid, and nutritional attri-butes of foods purchased by different population segments are beneficial for food policy research.
Research programs within government agencies and the academic community use household and retail scanner data to address food policy issues that cannot be addressed using publicly available data. Several studies have used household scanner data to evaluate the effects of policy-induced changes in prices on consumption of sugar-sweetened beverage purchases (Zhen et al., 2014; Finkelstein et al., 2013; Lin et al., 2011). Scanner data have also been used to evaluate the effects of store format on retail prices and healthfulness of purchases (Leibtag, 2006; Volpe and Okrent, 2013) and to examine the effects of food and nutrition assistance programs like the Special Supplemental Nutrition Program for Women, Infants, and Children (WIC) and the Supplemental Nutrition Assistance Program (SNAP) on food choices of low-income populations (e.g., Andreyeva et al., 2012) and retailer competition (Oliveira et al., 2011).
The purpose of acquiring the IRI data is to enable ERS and collaborative institutions to continue providing indepth analysis and evaluation of the key components of food choices with implications

3 Understanding IRI Household-Based and Store-Based Scanner Data, TB-1942
Economic Research Service/USDA
for the diet quality, safety, and health of Americans. In addition, the data enable ERS to dissemi-nate market information to agriculture and food-marketing industry stakeholders, which aids in food-production decisions. The IRI data complement the use of existing publicly available datasets by providing detailed purchase, price, demographic, and store information to enhance food policy research.
Objectives and Approach to This Study
Researchers from ERS and RTI conducted this study by reviewing IRI’s existing documentation of the data;6 reviewing ERS’s preliminary documentation of the data; conducting discussions with IRI over a period of several months, including detailed discussions on a set of questions developed under the study; obtaining additional documentation from IRI on specific questions; and examining the datasets and preparing summaries of the data. Researchers at ERS and RTI who are working with the data contributed insights based on their knowledge of the data.
The overall objectives of this study were to:
• Document IRI’s sample selection, household and retailer recruitment, data collection proce-dures, and weighting and variance estimation methodologies and procedures;
• Summarize key attributes of the datasets;
• Compare summaries of the data with publicly available data and identify reasons for differ-ences; and
• Provide suggestions and recommendations for researchers using the data to ensure appropriate use of the data.
6The IRI documentation included “Information Resources, Inc. Documentation: ERS Data Extract Project” dated March 24, 2014; “IRI Item Coding” dated May 2013; a document on multi-outlet reporting dated September 15, 2014; a document on defining “All Commodity Volume (ACV) dated August 2, 2013; “IRI Census Data Coverage/Information,” which is undated; “Response to Coding Questions” dated February 11, 2015; and other written responses to lists of ques-tions prepared by IRI in early 2015.

4 Understanding IRI Household-Based and Store-Based Scanner Data, TB-1942
Economic Research Service/USDA
Household-Based Scanner Data: Consumer Network
IRI derives the Consumer Network data from the National Consumer Panel (NCP), which is an operational joint venture equally owned by IRI and The Nielsen Company (IRI, 2015) since 2009. Households are recruited to the NCP through multiple mechanisms and are provided incentives to record all of their UPC-based consumer product purchases, regardless of where purchased, with a handheld in-home scanning device (IRI, 2015). (See box “A Note About UPC Code Assignments.”)
The primary Consumer Network datasets are the transactions data for each shopping trip made by the household. These datasets contain food and alcohol purchase information by UPC, including quantities, prices, discounts, and coupons that can be linked to a set of household demographic information such as household size, household income, age of household head, ethnicity, race, and presence of children. IRI assigns prices to each UPC-level transaction using its weekly point-of-sale data for the store chain or the outlet types, or it uses the price that households input during the reporting process if they shop at a store that is not represented in the IRI point-of-sale data.
All 2008-12 household transaction data are available in a table called Trip. These transactions (or Trip) data can be linked to the following:
• Demographics data file (by PANID),
• Product dictionary file for UPC branded products (by UPC),
• Product dictionary for nutrition information for UPC products (by UPC),
• Product dictionary for uniform-weight perishable products (by UPC),7
• Product dictionary for random-weight perishable products (by UPC).8
In addition, for households that participate, separate datasets on medical information obtained through an annual survey and prescription drug purchases can be linked to a household.
Overview of the Datasets
Table 1 provides a summary of the number of households in the Consumer Network, RxPulse, and MedProfiler datasets for the years available through 2012.9 A portion of the Consumer Network panel, also reflected in table 1, enters random-weight purchases across 10 broad product categories (e.g., meat, bakery, fruits, and vegetables).
The Consumer Network panel includes over 120,000 households, with 46 to 52 percent of the households providing sufficient purchase data to be included in the static panel used for analyses from 2008 to 2012. The criteria for including households in the static panel are based on specific thresholds for expenditures based on household size and are described later in this report. However, the static panel households accounted for 70 to 80 percent of the transactions records in the dataset, thus reflecting that the households that are not in the static panel (“non-static” households) reported dramatically fewer purchases.
7Uniform-weight products are typically packaged, UPC-labeled items, such as produce enclosed in a bag or clamshell container.
8Random-weight products include bulk produce, fresh meat, poultry, seafood, deli items (meats, cheeses, and prepared foods), and in-store bakery items.
9As ERS obtains additional years of data, updated summaries of the data will be provided in appendixes or addendums to this report.

5 Understanding IRI Household-Based and Store-Based Scanner Data, TB-1942
Economic Research Service/USDA
The number of Consumer Network households that recorded random-weight purchases increased substantially from over 52,000 in 2008 to almost 79,000 in 2012. In 2012, households reporting random-weight purchases accounted for 63 percent of the entire household panel. However, the share of these households that provided sufficient purchase data to be included in the static random-weight panel was only 41 to 45 percent of households. The purchases by these households accounted for 66 to 78 percent of the random-weight transaction records in the dataset.
The RxPulse panel is an opt-in survey offered to the full National Consumer Panel on prescription drug purchases and included 18,000 to 24,000 households from 2008 to 2012. In 2012, the RxPulse panel accounted for 17 percent of the entire household panel, which likely reflects that many house-holds do not purchase prescription drugs in any given year or they have privacy concerns about reporting prescription drug purchases. As with the other purchase datasets, approximately half of the households in the RxPulse panel provided sufficient purchase data to be included in the static panel, but these households accounted for a much larger portion of the transactions records than households not in the static panel.
Finally, the MedProfiler panel is an opt-in survey on medical conditions offered to all house-holds in the NCP. About one-third of the NCP households had at least one member respond to the MedProfiler survey (from 39,000 to 49,000 households), with responses received from 95,000 to 123,000 individuals in those households from 2010 to 2012.10
Each shopping trip record can be linked to the retail chain and market in the InfoScan data described in section 3. However, it is not possible to link a shopping trip record to the specific store where the purchases were made, as panelists simply identify the retail chain and not a specific store location.
10A more comprehensive examination of the RxPulse and MedProfiler data will be provided in a future report.
A Note About UPC Code Assignments
The assignment of Universal Product Codes (UPC) to manufacturers and retailers is overseen by GS1. UPC codes within the IRI data are 14 digits structured as follows:
• 2-digit system code
• 5-digit manufacturer code
• 5-digit item code
• 2-digit generation code
Random-weight products that are assigned a pseudo-UPC start with a system code of 20-26. Private-label products that are not released at the UPC level are also assigned a pseudo-UPC that starts with a system code of 66.
IRI assigns a new generation code each time a product discontinues sales and then reappears. When linking data across datasets, analysts may want to use the International Article Number (EAN) variable, which is the true UPC as assigned by the manufacturer, but also verify that the product description is the same.
An example of a breakdown of the UPC code 002400016230204 follows:
• 00 = system code
• 24000 = Del Monte
• 16302 = fresh cut regular salt level corn 15.25 ounces
• 04 = fourth generation of the UPC code for this product

6 Understanding IRI Household-Based and Store-Based Scanner Data, TB-1942
Economic Research Service/USDA
Table 1Number of households and transaction records in the static, nonstatic, and full IRI panel datasets, 2008-12
Dataset and year
No. of variables
Number of householdsStatic (%)
Number of transaction recordsa
Static (%)Static
Non-static
Total Static Nonstatic Total
Consumer Network
2008 11 53,621 62,320 115,941 46 50,147,180 21,256,610 71,403,790 70
2009 11 62,689 58,360 121,049 52 58,556,525 14,293,502 72,850,027 80
2010 11 63,605 60,814 124,419 51 58,510,299 16,833,941 75,344,240 78
2011 11 64,348 59,466 123,814 52 59,418,664 12,809,018 72,227,682 82
2012 11 62,517 63,523 126,040 50 58,790,496 13,334,232 72,124,728 82
Random Weight
2008 11 21,392 31,121 52,513 41 2,380,142 1,236,018 3,616,160 66
2009 11 26,583 33,198 59,781 44 3,042,174 1,011,929 4,054,103 75
2010 11 28,955 39,048 68,003 43 3,273,235 1,280,259 4,553,494 72
2011 11 32,657 39,143 71,800 45 3,732,700 1,029,054 4,761,754 78
2012 11 33,852 45,140 78,992 43 5,007,773 1,413,941 6,421,714 78
RxPulse
2010 19 12,368 11,781 24,149 51 617,241 229,379 846,620 73
2011 19 10,887 7,146 18,033 60 557,886 142,022 699,908 80
2012 19 9,915 15,089 25,004 40 520,851 305,457 826,308 63
MedProfiler Number of survey responses
2010 99 26,014 12,736 38,750 67 59,704 35,231 94,935 63
2011 109 34,121 14,580 48,701 70 79,370 43,870 123,240 64
2012 110 28,661 10,990 39,651 72 64,994 31,662 96,656 67
aTransactions records for Consumer Network, Random Weight, and RxPulse represent the purchase of a single Universal Product Code or item. A transaction record for MedProfiler represents a survey response from a household member.Source: Calculated by authors using data from IRI.
Each shopping trip record can be linked to the retail chain and market in the InfoScan data described in section 3. However, it is not possible to link a shopping trip record to the specific store where the purchases were made, as panelists simply identify the retail chain and not a specific store location.
Table 2 shows the demographic variables and code values for the households in the dataset. These variables include the demographic variables used for selecting households to the panel and for calcu-lating projection factors in addition to other demographic variables. Each year, the NCP requests that households update their demographic information and conducts followups with households elec-tronically, and then by phone, until they complete their updates. IRI estimates that approximately 75 percent of households overall update their demographic information on an annual basis (IRI, March 3, 2015). The percentages could be different for the households in the static panel versus those for the remaining households, but these estimates are not available from IRI.
In preparing the static datasets for 2008 through 2012, IRI included only the most recent values for the variables for household characteristics because its practice is to overwrite household variables as more recent data become available. Consequently, the demographics file contains a snapshot of household characteristics from 2012 or the last year each household reported demographic data, meaning it is not possible to track changes in household characteristics over time.11
11As ERS obtains additional years of data, the household characteristics for each subsequent year of data will be retained, enabling researchers to observe changes over time.

7 Understanding IRI Household-Based and Store-Based Scanner Data, TB-1942
Economic Research Service/USDA
Table 2Demographic data fields and codes in the Consumer Network dataa
IRI field Variable description Code values
PANID Household panel ID 9-digit code (Nielsen HHID variable with leading “9”)
HEAD Male or female head of household
1=male; 2=female
HHSIZE Household size
1 = single member; 2 = two members; 3 = three members; 4 = four members; 5 = five members; 6 = six members; 7 = seven members; 8 = eight members+;
HHINC Household income
1 = under $10,000; 2 = $10,000–$11,999; 3 = $12,000–$14,999; 4 = $15,000–$19,999; 5 = $20,000–$24,999; 6 = $25,000–$34,999; 7 = $35,000–$44,999; 8 = $45,000–$49,999; 9 = $50,000–$59,999; 10 = $60,000–$69,999; 11 = $70,000–$99,999; 12 = $100,000+
RACE Race of household 1 = White; 2 = Black; 3 = Asian; 4 = other
HISPWhether household is Hispanic
1 = Hispanic; 2 = non-Hispanic
ACAge and presence of children in household
1 = under 6 only; 2 = 6-12 only; 3 = 13-17 only;4 = under 6 and 6-12; 5 = under 6 and 13-17;6 = 6-12 and 13-17; 7 = under 6 and 6-12 and 13-17;8 = no children under 18
MEMBER_#_BIRTHBirthdate for member # (up to seven members)
6-digit value
MEMBER_#_RELA-TIONSHIP
Relationship of member # to household head
3 = son; 4 = daughter; 5 = other
FEMALE_HEAD_BIRTH
Birth month and year of female head
6-digit value
FED Female head education
1 = grade school; 2 = some high school; 3 = graduated high school; 4 = some college; 5 = graduated college; 6 = post graduate school; 7 = no female head; 9 = not available
FEMP Female head employ-ment
1 = less than 35 hours/week; 2 = 35 or more hours/week; 3 = homemaker/student; 4 = no female head
FOCC Female head occupation
1 = professional; 2 = manager/administrator; 3 = clerical; 4 = sales; 5 = craftsman/foreman (skilled); 6 = machine operator; 7 = laborer; 8 = service workers and private household workers; 9 = no occupation; 10 = others; 11 = no female head
- continued

8 Understanding IRI Household-Based and Store-Based Scanner Data, TB-1942
Economic Research Service/USDA
Table 2Demographic data fields and codes in the Consumer Network dataa (continued)
IRI field Variable description Code values
MALE_HEAD_BIRTH Birth month and year of male head
6-digit value
MED Male head education Uses same coding as FED
MEMP Male head employment Uses same coding as FEMP
MOCC Male head occupation Uses same coding as FOCC
MARITAL Marital status1 = married; 2 = widowed; 3 = divorced/separated; 4 = single
RENTOWN Whether household rents or owns
1 = owner; 2 = renter; 3 = other than rent/own home
HHTYPE Life stage/cycle
1 = households with younger children; 2 = house-holds with older children; 3 = young singles; 4 = older singles; 5 = young couples; 6 = older couples
CATS Whether household has any cats
0 = no cat; 1 = cat owner
DOGS Whether household has any dogs
0 = no dog; 1 = dog owner
STATE State of residence 2-character code for State
STATE_COUNTY State and county FIPS code of residence
5-digit FIPS code
ZIPCODE ZIP Code of residence 5-digit ZIP Code
COUNTY_SIZE Size code for the county
1 = County Code A (counties located in the 25 largest metropolitan areas); 2 = County Code B (counties that are not in A but with a population of 150,000 or more or in a metropolitan area with 150,000 or more); 3 = County Code C (counties that are not in A or B but have a population of 40,000 or more); 4 = County Code D (remaining counties)
REGIONCensus region of resi-dence
1 = Midwest (North Central); 2 = Northeast; 3 = South; and 4 = West
BLOCK_GROUPHousehold Census block group
8-digit code for Census block group
MARKETID IRI InfoScan market2- or 3-digit code for 65 markets or 3-digit code for 8 other market areas
Projection factorsAnnual projection factors for the total panel or spe-cific subsets
Household-specific U.S. region and market pro-jection factors for the total panel, random-weight panel, RxPulse panel, MedProfiler panel, and combinations of these panels
aDemographic data in Consumer Network for 2008-12 are for 2012 or the most recent year for which the household re-ported data.Source: Authors using data from IRI.
9 Understanding IRI Household-Based and Store-Based Scanner Data, TB-1942
Economic Research Service/USDA
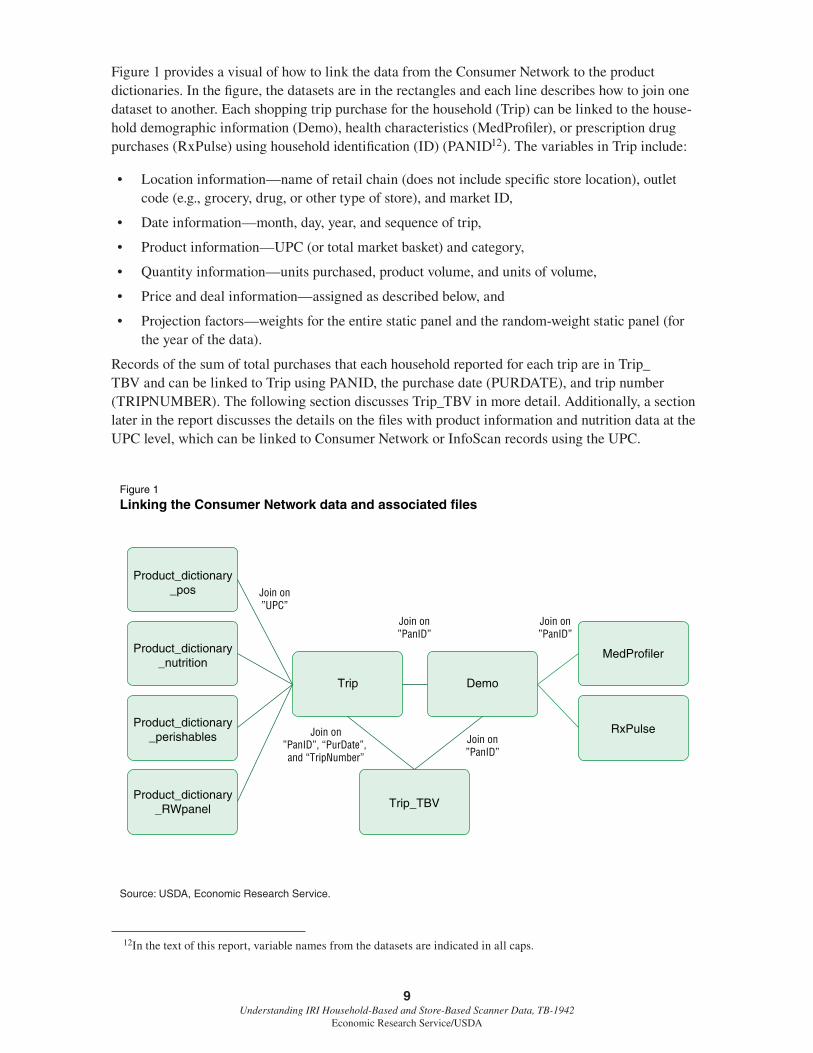
Figure 1 provides a visual of how to link the data from the Consumer Network to the product dictionaries. In the figure, the datasets are in the rectangles and each line describes how to join one dataset to another. Each shopping trip purchase for the household (Trip) can be linked to the house-hold demographic information (Demo), health characteristics (MedProfiler), or prescription drug purchases (RxPulse) using household identification (ID) (PANID12). The variables in Trip include:
• Location information—name of retail chain (does not include specific store location), outlet code (e.g., grocery, drug, or other type of store), and market ID,
• Date information—month, day, year, and sequence of trip,
• Product information—UPC (or total market basket) and category,
• Quantity information—units purchased, product volume, and units of volume,
• Price and deal information—assigned as described below, and
• Projection factors—weights for the entire static panel and the random-weight static panel (for the year of the data).
Records of the sum of total purchases that each household reported for each trip are in Trip_TBV and can be linked to Trip using PANID, the purchase date (PURDATE), and trip number (TRIPNUMBER). The following section discusses Trip_TBV in more detail. Additionally, a section later in the report discusses the details on the files with product information and nutrition data at the UPC level, which can be linked to Consumer Network or InfoScan records using the UPC.
12In the text of this report, variable names from the datasets are indicated in all caps.
Figure 1
Linking the Consumer Network data and associated files
Source: USDA, Economic Research Service.
Product_dictionary_pos
Product_dictionary_nutrition
Trip Demo
MedProfiler
RxPulse
Trip_TBV
Product_dictionary_perishables
Join on”UPC”
Join on”PanID”
Join on”PanID”
Join on”PanID”, “PurDate”, and “TripNumber”
Join on”PanID”
Product_dictionary_RWpanel

10 Understanding IRI Household-Based and Store-Based Scanner Data, TB-1942
Economic Research Service/USDA
Household Recruitment and Selection and Creation of the Static Panel
As mentioned previously, the household purchase data are derived from the NCP, which is a joint venture between IRI and Nielsen that is governed by a board of IRI and Nielsen officers and an inde-pendent chief executive officer (IRI, March 24, 2014). Households are recruited to the panel through third-party vendors that provide online advertising, including display networks, blogs, email, social media, and independent sites. Households register through NCP’s online recruitment site13 and complete a detailed questionnaire on household demographics. According to IRI, less than 10 percent of households join through unsolicited signups and programs, such as “refer-a-friend” (IRI, March 3, 2015). In the past, some households were recruited by direct mail, but this approach is no longer used. Households receive incentives to participate in the panel in the form of sweepstakes entries or points that can be cashed in for rewards chosen from a catalogue of products.
Once households register for the panel, they are selected for membership through a process that IRI refers to as “stratified quota random sampling” (IRI, March 24, 2014). Under this process, house-holds are selected based on their household characteristics to balance the panel to be representative of the U.S population in the 48 contiguous States; in other words, they are selected to meet quotas for each type of household. In the household panel, the household head is the primary shopper for the household. The following demographic criteria are used for selecting households:
• Household size (1, 2, 3-4, and 5+ persons),
• Age of household head (21-34, 35-44, 45-64, and 65+),
• Household annual income level (<$35,000; $35,000-$59,999; $60,000-$99,999; and $100,000+),
• Ethnicity of household head (Hispanic versus non-Hispanic),
• Race of household head (Black versus non-Black),
• Education level of female head of household (five levels),
• Education level of male head of household (five levels),
• Occupation (blue collar/uniformed, service occupation, white collar),
• Presence of children (no children versus children), and
• Census division (New England, Middle Atlantic, East North Central, West North Central, South Atlantic, East South Central, West South Central, Mountain, and Pacific).
The U.S. data for these criteria are derived from the U.S. Census and obtained by the NCP from PopStatsTM. PopStatsTM is a data product on population estimates provided to market research companies by Synergos Technologies, Inc.
A random selection of households that meet the criteria for the targeted group to balance the sample is selected from households that have registered for the NCP. Some types of households are more difficult to recruit, particularly those with a household head under age 35 and Hispanic households. Thus, the NCP targets recruitment through websites that focus more on those demographic groups.
13The recruitment website is https://www.ncponline.com/panel/US/EN/Login.htm.

11 Understanding IRI Household-Based and Store-Based Scanner Data, TB-1942
Economic Research Service/USDA
Living accommodations are not considered in the selection process except that each household must have a unique mailing address (e.g., apartment or unit number). Thus, individuals living in institu-tions (e.g., nursing homes and mental health facilities) and dorms can be included in the sample.
After households are recruited, they are provided with scanning equipment and comprehensive instructions for scanning their purchases and transmitting their purchases on a weekly basis. The NCP communicates frequently with the panelists to provide support and respond to questions and provides additional resources on its website. Households are instructed to purchase all products as they normally would.
Because the quality and consistency of data reporting by the panelists varies, both IRI and Nielsen apply specific rules to determine whether a household’s data may be included in the static dataset prepared each calendar year. IRI uses the following criteria:
• The household must have reported its purchases at least once every 4 weeks for 80 percent of the time periods, or 11 of the 13 four-week reporting periods during the year.
• The household must have reported a minimum average level of spending as follows:
• $25 per week for 1-person households,
• $35 per week for 2-person households, and
• $45 per week for 3-or-more person households (IRI, March 24, 2014).
Table 3 displays the Census targets used by IRI and the weighted American Community Survey. The weighted population estimates from the American Community Survey are the most reliable esti-mates of the population by household size, race, ethnicity, income, age, and presence of children in 2012. The Consumer Network dataset includes projection factors (or weights) that weight the data to match the Census targets shown in the table in addition to other variables. In general, the estimates for the Census targets used by IRI are similar to those for the American Community Survey.
In comparing the static panel households with the Census targets or the American Community Survey, the static panel has:
• Fewer 1-person and more 2-person and 3-4 person households,
• Substantially fewer households with heads under the age of 35,
• Substantially fewer households in the lowest income bracket,
• Fewer Hispanic and Black households, and
• Substantially fewer households with children.
Some of the differences derive from differences in the composition of the panel as a whole, and some are from differences in the quality of reporting by households of different types. Even if the panel composition matched U.S. demographics perfectly, some types of households are less likely to be consistent data reporters.

12 Understanding IRI Household-Based and Store-Based Scanner Data, TB-1942
Economic Research Service/USDA
Table 3Comparison of weighted Consumer Network (CN) household demographics with the American Community Survey, 2012
Household characteristic CN Census target American Community Surveya
Percent of households
Household size
1 person 26.1 32.8
2 person 32.4 31.0
3-4 person 30.7 27.3
5+ person 10.7 9.0
Age of household head
<35 years 20.3 18.5
35–44 years 18.7 18.0
45–64 years 39.2 40.2
65+ years 21.9 23.3
Annual household income
<$15,000 12.9 13.2
$15,000–$34,999 21.9 20.8
$35,000–$69,999 31.5 28.8
$70,000+ 33.7 37.2
Ethnicity
Non-Hispanic 88.5 85.1
Hispanic 11.5 14.9
Race
Black 11.8 14.3
Non-Black 88.2 84.7
Presence of children
Yes 33.9 32.9
No 66.1 67.1
aAmerican Community Survey estimates were obtained through DataFerrett (http://www.census.gov/acs/www/data_docu-mentation/data_ferrett_for_pums/).Source: Calculated by authors using data from IRI and American Community Survey.
The projection factors help account for the differences between the composition of the static panel and the general population. However, data users should keep in mind that the households that report data of sufficient quality to be included in the static panel may have different purchasing behaviors than their nonstatic, or nonparticipating, counterparts. In addition, in some cases, the data are being projected from a relatively small pool of reporters (particularly for households with heads under age 35).14
14In future research, we plan to compare household food expenditures from the Consumer Network data to a govern-ment data source for expenditures to further examine how Consumer Network household food purchase patterns compare with those from a nationally representative survey.

13 Understanding IRI Household-Based and Store-Based Scanner Data, TB-1942
Economic Research Service/USDA
Food Purchase Data Collection and Adjustments
As noted previously, households in the NCP are provided with scanning equipment (or they down-load a mobile application) and instructions for scanning their purchases throughout the week. They are also provided with extensive online support, and a support center is available to assist the panel-ists with problems and answer questions (IRI, March 24, 2014). Each time a household scans its purchases, the household also provides the name of the store where the items were purchased.
Households are instructed to scan the UPC or select from a list of nonbarcode items for all purchases for all types of shopping trips, including for items consumed on-the-go. Each household uses either the scanning device provided by the NCP for in-home use or a mobile application available through Google or Apple. For households that use the mobile application, all household members can scan items using their own devices. As of early 2015, IRI reports that approximately 17,000 households are using the mobile scanning option, while the remainder of the panel uses the in-home scanning device (IRI, March 3, 2015). In the ERS datasets, it is not possible to determine whether a household scans its purchases using the in-home device or a mobile application.
Data Recording Process for Products With UPCs
The UPC descriptions associated with the products are coded and maintained by a dictionary team at IRI using information from product images and information provided by retailers and manufac-turers. UPCs are associated with branded products and private-label (or store brand) products. IRI also assigns generation codes when the product description for a product changes (e.g., a number such as 01 or 02). A product description may change if the UPC has been assigned to an entirely different product or—more typically—if there has been a change in the existing product, such as a change in the package size.
Quantities (UNITS) . The number of units purchased for each UPC is recorded as the household scans its purchases. If analysts need the estimates of the total weight or volume of a product, the number of units can be multiplied by the field TOT_VOLUME (number of units of measure, e.g., ounces) for that UPC in the product dictionary.
Items that come packaged in a multipack with a barcode on the packaging (e.g., case of soda, rolls of paper towels) are recorded as the number of multipacks purchased (e.g., one 12-pack of soda). The size or count of the multipack can also be estimated using the field TOT_VOLUME in the product dictionary. If the product has no outside packaging (e.g., cans held together with plastic rings), the household scans the barcode on one of the items and records the total number of items contained in the multipack.
Prices (DOLLARSPAID) . Many household purchases are assigned a price by IRI from the InfoScan point-of-sale data. This process relieves households of the burden of entering prices for each item purchased. Under this process, when households scan purchases, they enter the name of the store where they purchased the items. If the store is among the list of stores for which IRI and Nielsen receive point-of-sale data, the household does not enter a price. Instead, IRI assigns the average purchase price (including all sales) for the store chain and market area (e.g., Chicago, New York, or Tampa). If a chain-market area average is not available, IRI assigns the average purchase price, including all discounts, for the outlet or channel type (e.g., grocery store, mass merchandiser, or drug store) and market area. The majority of purchases (65 percent of transactions and 60 percent

14 Understanding IRI Household-Based and Store-Based Scanner Data, TB-1942
Economic Research Service/USDA
of dollars based on ERS calculations) are assigned a price using the InfoScan point-of-sale data, but the proportions vary by store type.
If a household shops at a store for which InfoScan point-of-sale data are not available, it is instructed to enter the price paid for the item. IRI applies quality control checks to ensure that the household-entered price is within the range of the dictionary price for the product. The dictionary price is a long-term average price calculated by IRI for each UPC by outlet type at the national level. As a final option when a price cannot be assigned using the above methods, the dictionary price is assigned to the product. During the assignment process, some purchases may be temporarily assigned a zero price, but these cases should be resolved promptly after the data are reported.
In the Consumer Network dataset, the PRICESOURCE field indicates whether the price was assigned through point-of-sale data, entered by the household, or assigned from the price dictionary. Therefore, if relevant, an analyst could examine differences in prices for a UPC based on the source of the price for the product.
Coupons and sales (DEALS) . When households scan an item, the in-home scanner asks if they received a deal on the item. If they select “yes,” they are asked if the deal stemmed from one of the following:
• Store sale—deal offered by the particular store, such as a temporary price reduction or a loyalty card discount,
• Store coupon—use of a coupon specific to the particular store (household enters the value of the coupon),
• Manufacturer coupon—use of a coupon distributed by the product manufacturer (household enters the value of the coupon), and
• Other sale—other type of discount such as senior citizen or employee.
Note that because the market- and chain-level average prices assigned to purchases by IRI include store and other sales but exclude manufacturer coupons, which are the majority of coupons, analysts should subtract the value of COUPON from DOLLARSPAID to calculate a net price paid by house-hold for each item.
Finally, households are asked to enter their total trip value at the end of the data transmission process. If any coupons or discounts were applied to the total transaction amount, the household is asked to enter the total value of purchases after all coupons or deals have been applied. An addi-tional record of the total basket value of the household’s purchases is generated for each trip; ERS maintains these records in an auxiliary table called Trip_TBV. These transaction records are denoted by a UPC value of “99999999999999” and contain the total value of all items purchased by trip, including both edible and nonedible items.

15 Understanding IRI Household-Based and Store-Based Scanner Data, TB-1942
Economic Research Service/USDA
Data Recording Process for Random-Weight Products
For random-weight products without a UPC code, households choose from a list of products in the mobile application or scan a bar code on a reference card that accompanied the NCP-provided scanner to record the product type, enter the price paid, and indicate whether they received a deal on the purchase. Random-weight product categories cover meat, bakery, fruits, vegetables, cheese, cold cuts and lunch meat, prepared foods, coffee, and candy, nuts, and seeds (see table 4).15
Households do not enter the weights or amounts of the items purchased, and, thus, these need to be inferred based on the entered price and average prices for each type of product from other sources. (For example, an analyst could calculate the average price per pound for a similar UPC product and then divide the price entered by the household by the average price per pound to estimate the number of pounds of product purchased.)
Note that if a household shops at outlets such as farmers’ markets or community-supported agricul-ture (CSA) operations, it could enter these purchases using the reference card. However, this option places a greater burden on the household than if it made its purchases at conventional stores because nonconventional food outlets typically do not provide itemized receipts. The degree of underre-porting of these types of purchases is not known.
Table 4Random-weight item categories and products - continued
Category Products
Baked goods
BagelsBreadsBrowniesCroissantsCupcakesDanishDonuts/CrullersHoliday/SeasonalMuffins
PastriesRollsSpecialty dessertsCakes—Decorated/Special occa-sion, Nondecorated/OtherCookies—Chocolate chip, oatmeal raisin, sugar, assorted, otherPies—Fruit, cream, pumpkin, other Other baked goods
Candy, nuts, seeds Candy, nuts, seeds
Cheese (clerk or self-served)
AmericanBlue cheeseBrieCheddarGoudaJackMozzarella
MuensterParmesanProvoloneRomanoSwissOther cheese
Coffee Ground, whole bean
Cold cuts and lunch meat (clerk or self-served)
BeefBolognaChickenHam
PepperoniSalamiTurkeyOther cold cuts
15Prior to 2011, NCP households only recorded information for vegetables, fruit, and cheeses with no delineation by specific product and a very limited number of categories for cold cuts and deli meat and for meat, poultry, and seafood.

16 Understanding IRI Household-Based and Store-Based Scanner Data, TB-1942
Economic Research Service/USDA
Table 4Random-weight item categories and products - continued
Category Products
Fruits
AppleAvocadoBananaBerriesCherriesGrapesGrapefruitMelon
OrangePeach/Nectarine/PlumPearPineapplePrepared fresh fruitOther citrusOther fruit
Meat, poultry, seafood
Beef: Cubed, ground, roast, steak, other Pork: Chops, ham, ribs, roast, other pork Other meat: Hot dog, lamb, sau-sage, veal Chicken: Breast, cut up (mixed), ground, legs/drum sticks, thighs, whole, wing, other
Turkey: Breast, ground, whole, other Fish: Catfish, cod/scrod, salmon, tilapia, tuna, otherShellfish: Crab, scallops, shrimp, otherAll other meat, poultry, seafood
Prepared foods Includes foods that do not need preparation or heating before eating
Vegetables
Broccoli CabbageCarrotCauliflower CeleryCooking greens CornCucumber EggplantGreen beans (string)LettuceMushroom
OnionPeasPepperPotatoRadishSpinachSproutsSquash/PumpkinTomatoZucchiniPrepared fresh vegetablesOther vegetable
Source: Authors using data from IRI.
Projection Factor Calculations
The projection factors in the Consumer Network data are analogous to weights used in analyzing survey data from a random sample of a population. Each household in the Consumer Network data represents other households in the population, and the projection factor indicates how many house-holds are represented by the household. IRI uses the Iterative Proportional Fitting (IPF) method to calculate the projection factors based on geographic and demographic variables for the households in the static panel. IRI calculates a separate set of projection factors for the entire Consumer Network panel and for the random-weight portion of the panel. When using the data, analysts should multiply the household purchase quantities and expenditures by the projection factors to obtain estimates that represent the universe of households in the United States. For the random-weight portion of the panel, it is only possible to project expenditures due to the lack of quantity information collected about random-weight products. If a household in the dataset has a projection factor equal to zero, the household is not in the static panel and should be excluded from the analysis.
IRI obtains the values for the target demographic variables within geography from Census data acquired through PopStatsTM. The target demographic variables overlap with some of the variables used for selecting households for recruitment to the panel, except that education, occupation, and Census division are excluded from the list and county size and language preference are added to

17 Understanding IRI Household-Based and Store-Based Scanner Data, TB-1942
Economic Research Service/USDA
the list. Target values for language preference are obtained from the American Community Survey because this variable is not available through PopStats. The two additional target demographic vari-ables beyond those used for selecting households are as follows:
• County size (A: counties in the 25 largest U.S. metropolitan areas; B: counties not in A but with populations exceeding 150,000 or part of a metropolitan area exceeding 150,000; C: coun-ties not in A or B and with populations between 40,000 and 150,000; D: all other size counties) and
• Language preference for Hispanic households (English preferred, Spanish preferred, bilingual).
To calculate the projection factors, the IPF procedure first forces the weighted sample totals of the levels of one variable to equal the population totals for that variable (Oh and Scheuren, 1983). Then it forces the weighted sample totals of the next variable to equal its population totals. The process continues for each of the demographic variables. Then, the procedure checks if the sum of the weights in all segments are within allowable error ranges compared to the Census targets. If not, the procedure iterates through another round of calculations and continues until the summed weights differ by no more than 1 percent to the Census targets. Weights are capped at a value of 20, so any weights initially above 20 are reduced to 20. The excess weight above 20 is redistributed to other households, such that the weight sums still match the Census targets.
The weighting process conducted by IRI is dynamic in that new weights are calculated for house-holds for each new data delivery. Analysts can track households over time using the household ID variable, but each household has a new projection factor calculated for each data delivery. Currently, there is no projection factor that can be applied to a set of households that appear across time for conducting longitudinal analyses.
Note that an alternative approach to weighting could be to weight the product quantities to match some known target for a product, such as quantities shipped by the manufacturer. However, obtaining the target values and developing separate weights by product is a time-intensive and costly undertaking and involves use of proprietary data.16 For analysts using the data, it is important to keep in mind that applying the projection factors to each household’s purchases does not necessarily result in the weighted product sales quantities adding to the total available supply of a product; but this method provides a reasonable proxy.
IRI uses the negative binomial distribution to adjust the data for bias due to undercoverage or over-coverage of the population. While the ERS data do not contain these adjustments, IRI tries to reduce both coverage bias and nonresponse bias in the methodology used for recruitment, quality control, projection factors, reporting among panelists, and overall panel design.
Variance Estimation
IRI uses multiple methods for computing variances, including the binomial distribution, negative binomial distribution, and Taylor series, depending on the analyses. Taylor series linearization is a commonly practiced method that estimates the variance of a nonlinear estimate by approximating
16As part of the analyses conducted for its clients, IRI uses the Negative Binomial Distribution (NBD) method to align the reported purchases to point-of-sale targets from the store scanner data. NBD is a probability distribution that allows IRI to estimate how many purchase occasions that panelists may have under- or over-reported (IRI, March 24, 2015). It is not a weighting or projection method but is applied after the consumer panel data have been weighted using the IPF method. Most of the NBD estimates are not shareable due to the proprietary nature of the store scanner data totals.

18 Understanding IRI Household-Based and Store-Based Scanner Data, TB-1942
Economic Research Service/USDA
the estimator with a linear function (Woodruff, 1971). Taylor series estimation is straightforward to use with the IRI data and requires analysis strata and analysis primary sampling units (PSUs) to approximate the sample design accounting for stratification and clustering of households. That is, the data records need to be grouped at two levels. The first level (PSU) is a group of households, and the second level (stratum) is a group of PSUs. For the IRI data, the analysis strata can be geog-raphy, such as Metropolitan Statistical Areas (MSAs), Census region or division, and/or county codes. Given that the household sample is not a statistical sample, the random groups method can be used to approximate the PSUs and account for clustering of households. Using the random groups method, analysis PSUs can be formed by randomly subsampling and grouping households within an analysis stratum.17
17Software packages that compute variance estimates accounting for the statistical design, including clustering, require that the analysis strata and PSUs are specified. For example, in SAS the VARMETHOD statement is set as TAYLOR, and STRATA and CLUSTER statements specify the analysis strata and PSUs, respectively. Similarly, in SUDAAN, the DESIGN statement is set as WR, and the NEST statement specifies both the analysis strata and PSUs.

19 Understanding IRI Household-Based and Store-Based Scanner Data, TB-1942
Economic Research Service/USDA
Store-Based Scanner Data: InfoScan
IRI has agreements with retail establishments across the United States to provide weekly retail sales data (revenue and quantity) for products with UPCs and random-weight (or perishable) products. The types of stores covered include grocery, drug, convenience, mass merchandiser, club, dollar, and defense commissary stores. Some of the InfoScan data are provided to ERS at the store level, while others are provided at the retailer marketing area (RMA) level in cases where the retailers did not approve release of their data at the store level. The geographic areas for the RMAs are defined sepa-rately by each retailer. The stores that approved release of their data at the RMA level but not at the store level include CVS, Kroger, Safeway, Publix, Long’s, Weis, Walmart, and Sam’s.
The primary datasets include aggregate weekly sales quantities and prices by UPC code for branded and, in some cases, private-label (store-brand) products. Separate files provide store-level or RMA-level data for the following:
• Branded and private-label UPC products,
• Private-label products at the brand/category level18 (for a small number of specific retailers), and
• Random-weight and uniform-weight perishable products.19
The sales data files can be linked to files that contain information on store attributes and product characteristics, including nutritional content. However, the depth of coverage is somewhat limited for private-label and random- and uniform-weight perishable products.
Overview of the Datasets
Table 5 provides a summary of the number of stores by type of store (also called retail channel) for the store-level and RMA-level data for UPC-level and random-weight products, as well as the total number of records included in the InfoScan datasets obtained by ERS for 2008-12. Each record represents one UPC per store per week. The UPC-level data include branded and private-label prod-ucts except that the private-label products are an aggregate at the brand/category level in some cases.
As shown in table 5a for store-level data, the total number of available stores represented in the UPC-level portion ranges from almost 37,000 in 2008 to over 41,000 in 2012 across retail chan-nels—convenience, defense commissary/exchanges, dollar, drug, grocery, liquor, and mass merchan-disers/club stores. In 2008, only grocery stores and mass merchandisers/club stores are represented in the random-weight data, but after 2008, dollar and drug stores are also represented.20 After 2008, the vast majority of the grocery, mass merchandiser/club, dollar, and drug stores that provide UPC-level data also provided random-weight data.
As shown in table 5b for RMA-level data, the total number of stores represented in the UPC-level portion ranges from more than 13,000 in 2008 to more than 18,000 in subsequent years. The RMA
18Most private-label data are available at the UPC level in the point-of-sale transaction files. However, certain retailers aggregate private-label data to a brand/category level that is less detailed than UPC-level data.
19Uniform-weight products are typically packaged, UPC-labeled items, such as produce enclosed in a bag or a clam-shell container. Random-weight products include bulk produce, fresh meat, poultry, seafood, deli items (meats, cheeses, and prepared foods), and in-store bakery items.
20Most of the random-weight purchases for dollar and drug stores are for fruits and vegetables.

20 Understanding IRI Household-Based and Store-Based Scanner Data, TB-1942
Economic Research Service/USDA
information table is static, so the number of stores for each RMA remains the same for each year with the exception of mass merchandisers, which were not included in the data in 2008. RMA definitions apply to drug, grocery, liquor, defense commissary/exchanges (few stores), and mass merchandisers, and, thus, other types of stores are not represented in the data. Virtually all stores represented in the RMA-level data provide both UPC-level and random-weight data. (See box “Example of Retailer RMA Definitions.”)
Table 5c shows the total number of stores including both store-level and RMA-level data. Thus, nearly 60,000 stores providing UPC-level data and nearly 40,000 stores providing random-weight data are represented in the data.
Retailer information by store and RMA, which includes retailer hierarchy, channel, store address, and latitude and longitude coordinates, is included in the store_info and RMA_info files that link with the retail transaction data sets (see fig. 2a).
The IRI data include what IRI refers to as a “census” component and a sample component. IRI “census” stores are those that have agreed to provide sales data for all of their stores. The remaining stores are a statistically representative sample for which IRI randomly selects stores and establishes an agreement with the retailer to obtain data for those selected stores. In some cases, IRI may provide scanners to smaller stores to allow for data collection and reporting. All of the data obtained by ERS are from the “census” component of the InfoScan data, and IRI does not sell its propri-etary sample component. As a result, the IRI data obtained by ERS are a subset of the total data in InfoScan and reflect an unprojected subset of IRI’s Infoscan market track reporting services.
In the primary UPC datasets, branded products are detailed by UPC code, but private-label products are sometimes aggregated to the brand/category level. More than 28 retailers have agreed to provide private-label data in the ERS data. Most of these retailers provide private-label data at the UPC level, and those data are included in the primary point-of-sale (POS) and dictionary files. A few of these retailers provide separate private-label products at the brand/category level: Target at the store level and Safeway and Kroger at the RMA level.21 IRI assigns these products UPC codes that begin with a system code of 66, and the sales records and product information for these items are contained in separate private-label data files (see fig. 2b). According to IRI, the private-label market across all consumer packaged goods is approximately $120 billion in annual sales, which is just
21Most of the random-weight purchases for dollar and drug stores are for fruits and vegetables.
Example of Retailer RMA Definitions
An example of how one retailer’s retailer marketing area (RMA) definition differs from that of another retailer can be observed by comparing the Kroger Fry’s RMA with the Safeway Phoenix Division RMA. The former includes 9 of the 15 counties in Arizona, while the latter includes 14 of the 15 counties in Arizona plus 1 county in New Mexico. Within InfoScan, both store-level retailers and RMA-level retailers report weekly prices and quantities at the UPC level. However RMA-level retailers report aggregate prices and quantities sold at all stores within the RMA. While the number and location of store outlets within an RMA are included in the InfoScan data, it is not possible to definitively attribute any portion of the aggregate prices and quantities of a UPC to any specific store outlet within an RMA.

21 Understanding IRI Household-Based and Store-Based Scanner Data, TB-1942
Economic Research Service/USDA
Tabl
e 5a
Nu
mb
er o
f st
ore
s an
d r
eco
rds
in t
he
IRI I
nfo
Sca
n s
tore
-lev
el d
atas
ets,
200
8-12
a
Year
Tabl
e na
me
No.
of
varia
bles
Num
ber
of s
tore
s (s
tore
-leve
l) by
ret
ail c
hann
elN
umbe
r of
rec
ords
(st
ore-
leve
l)
Con
ve-
nien
ce
Def
ense
co
m-
mis
sary
/ ex
chan
ges
Dol
lar
Dru
gG
roce
ryLi
quor
Mas
s m
er-
chan
dis-
er/ c
lub
Tota
lTo
tal r
ecor
dsM
ean
reco
rds/
w
eek
2008
PO
S p
os_
stor
e6
6,37
225
97,
364
11,9
987,
478
251
2,99
936
,721
5,82
6,10
7,63
311
2,04
0,53
1
RW
rw
_st
ore
70
00
06,
115
01,
049
7,16
424
8,13
7,34
24,
771,
872
All
6,37
225
97,
364
11,9
987,
479
251
3,00
136
,724
6,07
4,24
4,97
511
6,81
2,40
3
2009
PO
S p
os_
stor
e6
8,52
925
57,
392
12,2
767,
434
269
3,05
839
,213
5,97
8,35
4,67
811
4,96
8,35
9
RW
rw
_st
ore
70
07,
384
6,45
96,
437
01,
755
22,0
3529
2,64
3,22
75,
627,
754
All
8,52
925
57,
392
12,2
767,
436
269
3,05
839
,215
6,27
0,99
7,90
512
0,59
6,11
4
2010
PO
S p
os_
stor
e6
9,41
625
47,
538
12,3
757,
381
290
3,07
440
,328
6,06
4,52
6,61
411
6,62
5,51
2
RW
rw
_st
ore
70
06,
984
11,8
076,
601
01,
756
27,1
4829
5,95
0,28
45,
691,
352
All
9,41
625
47,
538
12,3
757,
382
290
3,07
540
,330
6,36
0,47
6,89
812
2,31
6,86
3
2011
PO
S p
os_
stor
e6
9,57
951
47,
808
12,4
147,
164
318
3,10
940
,906
6,23
9,91
5,65
411
9,99
8,37
8
RW
rw
_st
ore
70
02,
036
7,75
46,
606
01,
772
18,1
6830
3,30
0,01
75,
832,
693
All
9,57
951
47,
808
12,4
147,
165
318
3,10
940
,907
6,54
3,21
5,67
112
5,83
1,07
1
2012
PO
S p
os_
stor
e6
9,61
351
58,
237
12,4
977,
098
341
3,14
041
,441
6,52
4,93
6,33
312
3,11
2,00
6
RW
rw
_st
ore
70
01,
282
12,1
766,
720
01,
786
21,9
6431
2,05
7,12
75,
887,
870
All
9,61
351
58,
237
12,4
977,
100
341
3,14
041
,443
6,83
6,99
3,46
012
8,99
9,87
7

22 Understanding IRI Household-Based and Store-Based Scanner Data, TB-1942
Economic Research Service/USDA
Tabl
e 5b
Nu
mb
er o
f st
ore
s an
d r
eco
rds
in t
he
IRI I
nfo
Sca
n R
MA
-lev
el d
atas
ets,
200
8-12
(co
nti
nu
ed)
Year
File
na
me
No.
of
varia
bles
Num
ber
of s
tore
s (R
MA
) by
ret
ail c
hann
elN
umbe
r of
rec
ords
(R
MA
)
Con
ve-
nien
ce
Def
ense
co
m-
mis
sary
/ ex
chan
ges
Dol
lar
Dru
gG
roce
ryLi
quor
Mas
s
mer
-ch
an-
dise
r/
club
Tota
lTo
tal r
ecor
dsM
ean
reco
rds/
w
eek
2008
PO
S p
os_
rma
60
100
7,34
15,
732
487
013
,570
87,2
88,8
071,
678,
631
RW
rw
_rm
a7
00
00
5,74
30
05,
743
12,4
10,1
4723
8,65
7
All
010
07,
341
5,74
348
70
13,5
8199
,698
,954
1,91
7,28
8
2009
PO
S p
os_
rma
60
100
7,34
15,
743
464
4,52
118
,079
107,
296,
998
2,06
3,40
4
RW
rw
_rm
a7
00
07,
341
5,74
30
4,48
517
,569
14,5
72,0
0028
0,23
1
All
010
07,
341
5,74
346
44,
521
18,0
7912
1,86
8,99
82,
343,
635
2010
PO
S p
os_
rma
60
100
7,35
85,
743
464
4,52
118
,096
107,
620,
290
2,06
9,62
1
RW
rw
_rm
a7
00
07,
341
5,74
30
4,48
517
,569
14,9
89,3
8228
8,25
7
All
010
07,
358
5,74
346
44,
521
18,0
9612
2,60
9,67
22,
357,
878
2011
PO
S p
os_
rma
60
100
7,35
85,
743
464
4,52
118
,096
110,
635,
290
2,12
7,60
2
RW
rw
_rm
a7
00
07,
341
5,74
30
4,48
517
,569
15,4
41,9
7629
6,96
1
All
010
07,
358
5,74
346
44,
521
18,0
9612
6,07
7,26
62,
424,
563
2012
PO
S p
os_
rma
60
100
7,35
85,
743
464
4,52
118
,096
117,
511,
434
2,21
7,19
7
RW
rw
_rm
a7
00
07,
341
5,74
30
4,48
517
,569
15,8
73,3
8229
9,49
8
All
010
07,
358
5,74
346
44,
521
18,0
9613
3,38
4,81
62,
516,
695

23 Understanding IRI Household-Based and Store-Based Scanner Data, TB-1942
Economic Research Service/USDA
Tabl
e 5c
Nu
mb
er o
f st
ore
s an
d r
eco
rds
in t
he
IRI I
nfo
Sca
n c
om
bin
ed d
atas
ets,
200
8-12
(co
nti
nu
ed)
Year
File
na
me
No.
of
varia
bles
Num
ber
of s
tore
s (t
otal
IRI)
by
reta
il ch
anne
lN
umbe
r of
rec
ords
(to
tal I
RI)
Con
ve-
nien
ce
Def
ense
co
mm
is-
sary
Dol
lar
Dru
gG
roce
ryLi
quor
Mas
s
mer
-ch
andi
s-er
/ clu
b
Tota
lTo
tal r
ecor
dsM
ean
reco
rds/
W
eek
2008
PO
S
6,37
226
97,
364
19,3
3913
,210
738
2,99
950
,291
5,91
3,39
6,44
011
3,71
9,16
2
RW
00
00
11,8
580
1,04
912
,907
260,
547,
489
5,01
0,52
9
All
6,37
226
97,
364
19,3
3913
,222
738
3,00
150
,305
6,17
3,94
3,92
911
8,72
9,69
1
2009
PO
S8,
529
265
7,39
219
,617
13,1
7773
37,
579
57,2
926,
085,
651,
676
117,
031,
763
RW
00
7,38
413
,800
12,1
800
6,24
039
,604
307,
215,
227
5,90
7,98
5
All
8,52
926
57,
392
19,6
1713
,179
733
7,57
957
,294
6,39
2,86
6,90
312
2,93
9,74
8
2010
PO
S9,
416
264
7,53
819
,733
13,1
2475
47,
595
58,4
246,
172,
146,
904
118,
695,
133
RW
00
6,98
419
,148
12,3
440
6,24
144
,717
310,
939,
666
5,97
9,60
9
All
9,41
626
47,
538
19,7
3313
,125
754
7,59
658
,426
6,48
3,08
6,57
012
4,67
4,74
2
2011
PO
S9,
579
524
7,80
819
,772
12,9
0778
27,
630
59,0
026,
350,
550,
944
122,
125,
980
RW
00
2,03
615
,095
12,3
490
6,25
735
,737
318,
741,
993
6,12
9,65
4
All
9,57
952
47,
808
19,7
7212
,908
782
7,63
059
,003
6,66
9,29
2,93
712
8,25
5,63
3
2012
PO
S9,
613
525
8,23
719
,855
12,8
4180
57,
661
59,5
376,
642,
447,
767
125,
329,
203
RW
00
1,28
219
,517
12,4
630
6,27
139
,533
327,
930,
509
6,18
7,36
8
All
9,61
352
58,
237
19,8
5512
,843
805
7,66
159
,539
6,97
0,37
8,27
613
1,51
6,57
1
Not
e: A
rec
ord
repr
esen
ts th
e no
nzer
o sa
les
of o
ne U
nive
rsal
Pro
duct
Cod
e pe
r st
ore
per
IRI w
eek.
RM
A =
Ret
aile
r M
arke
ting
Are
a.a C
ount
s ba
sed
on a
n un
proj
ecte
d su
bset
of s
tore
s fr
om IR
I’s In
fosc
an m
arke
t tra
ckin
g se
rvic
es.
Sou
rce:
Cal
cula
ted
by a
utho
rs u
sing
dat
a fr
om IR
I.

24 Understanding IRI Household-Based and Store-Based Scanner Data, TB-1942
Economic Research Service/USDA
under 17 percent of all consumer packaged goods sales. However, an accurate estimate of the percentage of private-label products included in the ERS data is not available because of restrictions on the data for the total private-label market.
The data fields in each of the InfoScan files for the store-level and RMA-level data for branded, private-label, and perishable products include:
• UPC code,
• Store ID for store-level or geography key for RMA-level data,22
• Week of the data,
• Number of units sold (expressed in pounds or counts for perishable products), and
• Total revenue in dollars and cents.
Figures 2a and 2b show how to link InfoScan files (both perishable and point-of-sale) as well as the private-label data to the product dictionaries. In particular, these data can be linked to store and product information as follows:
• Store information for all retailers (by store ID code for store-level retailers and by geography key for RMA-level retailers),
• Product dictionary file for UPC-branded products (by UPC),
22Most of the random-weight purchases for dollar and drug stores are for fruits and vegetables.
Figure 2a
Linking point-of-sale (POS) and perishable (RW) data to product dictionaries and store and retail market area (RMA) information
Source: USDA, Economic Research Service.
Product_dictionary_pos
Product_dictionary_nutrition
POS_store
POS_RMA
RW_store
RW_RMA
Store_info
RMA_info
Product_dictionary_perishables
Join on”UPC”
Join on”UPC”
Join on”storeID”
Join on”geogkey”

25 Understanding IRI Household-Based and Store-Based Scanner Data, TB-1942
Economic Research Service/USDA
• Product dictionary file for private-label products for Target, Kroger, and Safeway (by pseudo-UPC),
• Product dictionary file for random-weight and uniform-weight perishable products (by UPC or pseudo-UPC), and
• Product dictionary for nutrition information for UPC products (by UPC).
The product dictionaries for UPC-branded and private-label products contain characteristics of the product ranging from brand to label information, which we describe in more detail later in the report. For perishable products, IRI’s Freshlook solution assigns a pseudo-UPC that provides detail on the type of product, form of product, and number of units or the volume in pounds.
Store Recruitment and Sampling
IRI maintains an exhaustive database of all retail stores in each retail channel along with relevant attributes for the stores. For the “census” retailers, IRI maintains information on the stores as part of its weekly data collection process. For the remainder of the retailers, IRI uses multiple retailer files and industry sources to create a total universe of stores by channel. The data purchased by ERS include only the “census” retailers, and, thus, sampling is not relevant for the data. For use in its other data reporting and analysis, IRI selects a sample of retailers by geographic region. Independent stores are grouped together for sampling.23
23Although ERS does not currently acquire data from the “noncensus” stores, we provide an explanation of the sam-pling process for these stores for future reference. To select the sample of stores, IRI first sets a sampling fraction (e.g., 10 percent), which dictates the probability of selection when applied to the population size of a stratum. Strata are defined by a combination of retailer and geography, which means that chains are selected and then stores within chains. Strata associated with a retailer or geography for which data can be released are set with a higher sampling fraction than those that cannot be released but only feed into higher level reporting. Within a stratum, stores are randomly selected using systematic sampling. With systematic sampling, the data are sorted based on selected variables, and then every nth store is selected, where n is the total number of stores divided by the sample size.
Figure 2b
Linking brand/category-level private-label data to the product dictionary and store and retail market area (RMA) information
Source: USDA, Economic Research Service.
Product_dictionary_privatelabel
Privatelabel_store
Privatelabel_RMA
Store_info
RMA_info
Join on”UPC”
Join on”storeID”
Join on”geogkey”

26 Understanding IRI Household-Based and Store-Based Scanner Data, TB-1942
Economic Research Service/USDA
Table 6 provides an overview of the different types of retailers, definition of the retail channel, and coverage of the sales represented in the data received by ERS.24 Stores in Alaska, Hawaii, and Puerto Rico are excluded across grocery, drug, and mass merchandisers, and stores in Hawaii and Puerto Rico are excluded across Walmart, club stores, dollar stores, and defense commissary stores. All sizes of stores are included, with the exception of grocery stores, which must have $2 million or more in annual sales to be included in the IRI sample.
Table 6Overview of retail outlets included in InfoScan datasets
Outlet type Definition of outlet type Coverage in data received by ERS
Grocery stores Grocery stores with $2 million or more in annual grocery sales (IRI estimates 33,000+ stores)a
All stores that provide complete sales data to IRI (representing approximately 74 percent of ACVb) except the store chain HEB; some stores only release data at the RMA level
Drug stores Chain and independent drug stores (IRI estimates 42,000+ stores)
All stores that provide complete sales data to IRI (representing approximately 93 percent of ACV for all products except prescription drugsb); some stores only release data at the RMA level
Convenience stores with scanning capability
Chain and independent convenience stores with scanning capability (IRI estimates 150,000+ stores)
All stores that provide complete sales data to IRI (approximately 14 percent of ACV for all products except gasolineb)
Mass merchandisers (excluding Walmart)
Mass merchandiser chains Target, Shopko, and Kmart
Walmart All Walmart store formats, including supercenters, traditional, and neighbor-hood markets
All stores starting in 2009 (RMA level only)
Club stores Membership stores Sam’s Club (starting in 2009; RMA level only)
Dollar stores Dollar store chains Family Dollar and Fred’s
Defense commissary stores and exchanges
Stores operated in the continental United States by the Defense Commis-sary Agency (DeCA)
NEXCOM and DeCA stores (represent-ing approximately 45 percent of the ACVb)
aGrocery stores with less than $2 million in annual grocery sales represent approximately 4 percent of total sales volume.bACV = all commodity volume. ACV includes all scanned and nonscanned food and nonfood items (e.g., health and beauty products) and services (e.g., floral department, video rental, and photo development) but excludes items such as gasoline, prescription drugs, furniture, appliances, and sporting equipment. The percentage of ACV is the percentage of the sales volume across all consumer products sold for the stores for a particular outlet type represented in the data relative to the total U.S. sales volume as estimated by IRI. RMA = Retailer Marketing Area.Source: Authors using data from IRI.
The counts included in the datasets have remained relatively constant over the time period of the data received by ERS. However, some of the convenience retailers moved from sample-based to “census”-based in 2009, thus, increasing the count of convenience stores in the data.
Table 7 shows a comparison of the number of stores by retail channel between the InfoScan data obtained by ERS and Census Bureau data by North American Industry Classification System (NAICS) code in 2012. Not all retail channels are represented in the RMA-level data (i.e., conve-nience stores, dollar stores, and for the most part, defense commissary/exchanges). For the grocery
24ERS also received limited data on liquor store sales, but a discussion of these data is outside the scope of the report.

27 Understanding IRI Household-Based and Store-Based Scanner Data, TB-1942
Economic Research Service/USDA
store counts by NAICS from the Census Bureau, we included stores with over $2.5 million in annual sales to approximate the definition that IRI uses for the stores it includes in InfoScan ($2 million or more in annual sales). These stores account for less than half the total number of grocery stores because of the large number of small-scale grocery stores across the country. The total coverage of the InfoScan data obtained by ERS can be approximated by summing the percentages for store-detail and RMA data. In particular, the percentages of drug stores and grocery stores included in the data represent about 45 percent of stores compared to Census. The coverage of mass merchandiser/club stores in IRI appears to exceed the number compared to Census, but this is likely due to differ-ences in the definitions of the categories. Overall, the estimated coverage is about 41 percent of stores compared to Census.
Because many stores represented in table 7 are smaller format stores and have relatively low sales volumes, a comparison of food and alcohol sales volumes provides a potentially more useful esti-mate of coverage of the InfoScan data than does store counts. Table 8 shows the comparison of total sales volumes for food and alcohol between the InfoScan data obtained by ERS and Census Bureau data for 2012 for the same categories as in table 7. Approximately half of food and alcohol purchases at grocery stores are covered in the data for 2012. Coverage of sales at mass merchandisers/club stores is higher at almost 80 percent, largely influenced by the inclusion of Walmart, while coverage of sales at convenience stores, dollar stores, and liquor stores is much lower. The coverage of sales from drug stores appears to exceed the Census estimates, but this is likely due to differences in the definitions of the categories. Overall, the estimated coverage of food and alcohol sales is 55 percent compared to Census.25
25In future work, we plan to compare the stores and sales in the InfoScan data with Census data, as well as proprietary data including TDLinx and National Establishment Time-Series by Walls and Associates, to examine InfoScan coverage relative to other extensive retail data sources.

28 Understanding IRI Household-Based and Store-Based Scanner Data, TB-1942
Economic Research Service/USDA
Table 7Comparison of number of stores in the InfoScan data with Census Bureau data, 2012a
Type of storeNAICS code
InfoScan (store-detail)
InfoScan (RMA)
Census Bureaub
InfoScan (store-detail)
InfoScan (RMA)
Total InfoScan
Number of stores
Number of stores
Number of stores
Percent of Census
stores
Percent of Census
stores
Percent of Census
stores
Convenience 44512 9,613 0 26,531c 36.2 0.0 36.2
Defense com-missary and exchangesd
Not ap-plicable
515 10 -- -- -- --
Dollar 45299 8,237 0 35,980 22.9 0.0 22.9
Drug 44611 12,497 7,358 43,353 28.8 17.0 45.8
Grocery 44511 7,100 5,743 28,201e 25.2 20.4 45.5
Liquor 44531 341 464 32,643 1.0 1.4 2.5
Mass merchan-diser/Club
45291 3,140 4,521 5,116 61.4 88.4 149.7
Total 41,443 18,096 145,293 28.5 12.4 41.0
NAICS = North American Industry Classification System.aCounts are based on an unprojected subset of stores from IRI’s InfoScan market tracking services. bPreliminary estimates of establishment numbers (stores) were obtained from the 2012 Economic Census, Industry Series Preliminary Product Line Statistics (www.factfinder.census.gov), with the exception of grocery stores. cThe store count for convenience stores does not include gasoline stations with convenience stores. dThe Census Bureau does not provide data for defense commissaries. eThe grocery store count was obtained from 2007 Economic Census, Retail Trade: Subject Series – Estab and Firm Size: Summary Statistics by Sales Size of Firms for the United States (www.factfinder.census.gov) and excludes stores with annual sales below $2.5 million to better align with the definition of grocery stores included in InfoScan ($2 million or more in sales).Source: Calculated by authors using data from IRI and the Census Bureau.

29 Understanding IRI Household-Based and Store-Based Scanner Data, TB-1942
Economic Research Service/USDA
Table 8Comparison of total UPC and random-weight food sales in the InfoScan data with total sales in Census Bureau data, 2012a
Type of store
NAICS code
InfoScan (store-detail)
InfoScan (RMA)
Census Bureau
InfoScan (store-detail)
InfoScan (RMA)
Total InfoScan
Total food and alcohol
sales ($1,000s)
Total food and alco-hol sales ($1,000s)
Food and al-cohol sales ($1,000s)b
Percent of Census
sales
Percent of Census
sales
Percent of Census
sales
Conve-nience
44512 5,551,479 0 15,929,925 34.8Not
applicable34.8
Defense commis-sary/ ex-changesc
Not applicable
3,917,769 208,277Not
applicableNot
applicableNot
applicableNot
applicable
Dollar 45299 2,604,033 0 13,839,717 18.8Not
applicable18.8
Drug 44611 8,223,619 5,992,284 11,950,180 68.8 50.1 119.0
Grocery 44511 104,433,106 102,671,090 411,641,954 25.4 24.9 50.3
Liquor 44531 960,521 1,800,915 40,651,077 2.4 4.4 6.8
Mass mer-chandiser/Club
45291 14,041,239 109,483,594 157,013,948 8.9 69.7 78.7
Total 139,731,766 220,156,160 651,026,801 21.5 33.8 55.3
NAICS = North American Industry Classification System.aSales are based on an unprojected subset of stores from IRI’s InfoScan market tracking services.bPreliminary estimates of sales were obtained from the 2012 Economic Census, Industry Series Preliminary Product Line Statistics (factfinder.census.gov), for the following product codes: 20100 Groceries and other food items for human con-sumption off premises. 21100 Meals, unpackaged snacks, sandwiches, unpackaged ice cream and yogurt, bakery items, other food items, and nonalcoholic beverages for immediate consumption. 20140 Packaged liquor, wine, and beer.cThe Census Bureau does not report separate estimates for defense commissaries.Source: Calculated by authors using data from IRI and the Census Bureau.
Food Purchase Data Collection and Adjustments
IRI receives weekly food purchase data from retailers that include data for products with UPCs and for random-weight or perishable products.26 IRI conducts several data quality checks as data are received to eliminate duplicates, compare aggregate sales measures to recent trends by store, and compare UPC-level sales to recent trends within stores. For some products, IRI verifies the purchase data against shipments data from manufacturers (i.e., beer, carbonated beverages, and salty snack categories). In addition to conducting quality control checks on the scanner data, IRI also conducts field audits to validate that the data files received from the stores match the electronic files at the store location.
Data Collection Process for Products With UPCs
As new UPCs enter the market, IRI obtains product image scans and then codes the information from the packages and adds it to its dictionary database. IRI obtains the product images, which
26Some stores provide data on a daily basis, and IRI aggregates the data to a weekly basis.

30 Understanding IRI Household-Based and Store-Based Scanner Data, TB-1942
Economic Research Service/USDA
includes the front and back of the product, from manufacturers and retailers. IRI also then catego-rizes the food within its product categorization. IRI adds approximately 3 million new items across all consumer packaged goods to its dictionary database on an annual basis (IRI, March 24, 2014). Details on the nutrition information and product claims included in IRI’s dictionary database is provided later in the report.
Retailers aggregate individual transactions and provide the data to IRI at the UPC level. Most retailers report the total units sold and the total dollars, although a few report total units sold and price. Note that the total dollars includes discounts obtained through the use of loyalty cards and other sales. During data collection, IRI checks the reported prices against its dictionary price to identify and correct errors in data reporting.
Although data are reported to IRI at the individual UPC level, given restrictions on data release, data for private-label products are provided to ERS for selected retailers only. More than 28 retailers that provide UPC-level data release the data for private-label products. Kroger, Safeway, and Target release private-label data at the brand/category level rather than at the disaggregate UPC level, but other retailers release private-label data at the UPC level.27 When private-label data are released only at the brand/category level, size (weight or volume) information is not available, and, thus, unit prices cannot be calculated.
Quantities (UNITS) . Quantities represent the number of items scanned by UPC code. If analysts need estimates of the total weight or volume of products, the number of units can be multiplied by the value in the volume (i.e., number of units of measure) field in the data. However, for private-label products that are aggregated to the brand/category level, the total weight or volume cannot be calculated because each record contains multiple sizes. For multipack packaging, retailers are often not able to provide defined unit measures; IRI searches for inconsistent price and volume combina-tions to identify these cases and then recalculates the volume. Note that when working with units of measure for liquid products, ounces typically represent fluid ounces, which is a measure of volume, rather than weight.28
Prices (CENTS) . IRI calculates a weighted-average price for each UPC by dividing the total dollars by the total units sold reported by retailers. The total dollars are net of discounts applied through sales and loyalty cards, and, thus, the weighted average price is net of these discounts. The weighted average price does not reflect discounts from coupons. To calculate unit prices (e.g., price per ounce), the weighted average price can be divided by value in the volume field.
Data Collection Process for Random-Weight and Uniform-Weight Perishable Products
IRI FreshLook solution obtains and reports perishable product data. The perishable product file includes data for both uniform-weight perishable products and random-weight perishable products. Uniform-weight products, such as UPC-labeled produce enclosed in a bag or a clamshell container, are coded using a similar process to that used for other UPC-labeled items.
27The retailers providing private-label data at the brand/category level vary slightly in subsequent years of data.28USDA’s National Nutrient Database for Standard Reference provides density measures to convert liquid volumes to
weights based on the type of product.

31 Understanding IRI Household-Based and Store-Based Scanner Data, TB-1942
Economic Research Service/USDA
Random-weight products include bagged or bulk produce, fresh meat and seafood, deli items (meats, cheeses, and prepared foods), and in-store bakery items. For these products, IRI collects data from retailers from two sources:
• Products with price look-up (PLU) codes—For these products, the cashier enters the PLU code and weighs the product during checkout. Most often, these are fruits and vegetables.
• Products that are pre-weighed and labeled at the store—These products are scanned at the register, and the price and weight are recorded.
Each retailer assigns its own UPC codes to random-weight products; therefore, IRI must keep track of the retailer that is using each code. Also, the retailer can change the product associated with a UPC at any time; therefore, IRI matches the product descriptions by UPC against its existing dictionary to identify new items. When new items are identified, IRI codes the items for addition to the product dictionary. The assigned UPCs for these products begin with a system code of 20-26.
Table 9 provides a list of the types of products, number of categories and subcategories, and other coded attributes for random-weight and perishable products (IRI, March 24, 2014). Data on random-weight and perishable product sales are available for dollar stores, drug stores, grocery stores, mass merchandisers, and club stores.29 However, not all stores in these retail channels provide random-weight data.
Table 9Perishables product categories and coding
Type of productNo. of
categoriesNo. of
subcategoriesOther coded attributes
Fresh produce 85 557 Package type, organic, preparation type
Fresh meat 14 147Cut, bone-in versus boneless, form, process type, and preparation type
Deli cheese 116 0 Health attributes
Deli meat 14 127 Flavors, health attributes, kosher
Deli prepared 15 149 Type (e.g., entree/pasta/ravioli)
In-store bakery 19 198 Type (e.g., cookies/regular/sugar)
Source: Calculated by authors using data from IRI.
Quantities . Retailers provide quantities for random-weight products as pounds or number of items (referred to as “eaches”). Some retailers provide either type of quantity in a single field, while others have separate fields for pounds and eaches. For those retailers that provide quantity in a single field, IRI determines the type of measure used by applying an algorithm based on how the retailer typi-cally sells the product and using a price range check. For quantities recorded as eaches, IRI applies the typical weight of each item using a standard conversion factor for each type of fruit or vegetable (i.e., see “Perishables_Conversion_Factors_Counts_to_Pound.xls”). The typical weights have been developed over time using store audits of weights, Internet sources, and interpolation across other products (IRI, March 24, 2014). Some types of produce, such as apples and squash, have conver-sion factors for several different varieties, while others, such as coconuts and jicama, have a single conversion factor.
29In 2008, data on random-weight sales were provided only for grocery stores and mass merchandisers.

32 Understanding IRI Household-Based and Store-Based Scanner Data, TB-1942
Economic Research Service/USDA
Projection Factor Calculations
Projection factors (or weights) are not included in the data purchased by ERS. However, IRI has a method of creating projection factors that projects the store scanner data to the sales volume of total consumer packaged goods (CPG) by geographic region. IRI uses a proprietary projection algorithm called Store Matrix to create projection factors in which all commodity volume (ACV) estimates serve as target values. The ACV estimates are generated using a model developed by IRI based on point-of-sale data, Census Bureau’s Retail Trade Survey, financial reports, and industry sources.
In applying this method, the rows of the matrix represent each store in the population, and the columns represent each store (“census” or “noncensus") in the sample. An algorithm assigns each store in the population to a store in the sample that is most similar, and then the ACV of the sample store is assigned to the store in the population based on a similarity calculation.
Variance Estimation
For the subset of store data obtained by ERS, variance calculation is not applicable because the data represent a census of the available stores rather than a sample; thus, there is no sampling error. However, if ERS obtains data from the sample portion of the stores in the future, it would be neces-sary to calculate variances of the estimates accounting for the sample design. When calculating vari-ances for the analyses it conducts for other purposes, IRI uses a jackknife method.

33 Understanding IRI Household-Based and Store-Based Scanner Data, TB-1942
Economic Research Service/USDA
Product Information, Nutrition Data, and Product Claims Data
As noted earlier, IRI provided a set of product dictionaries that contain details of food product attributes and that can be linked by UPC to the Consumer Network or InfoScan data. This section summarizes the product dictionary files, describes their linkages to the transaction files, and compares IRI’s nutrition coverage with that of other commercial data sources.
Overview of the Contents of the Product Dictionary Files
IRI delivered the majority of the UPC product information in a master product dictionary containing 1 million UPCs and almost 300 variables. ERS cleansed and reorganized this information into two smaller, more-manageable files: product_dictionary_pos and product_dictionary_nutrition. The file product_dictionary_master, containing the original set of variables from IRI, is available to researchers but is not updated by ERS and is not recommended for use due to its size.
Product_dictionary_pos is the main point-of-sale dictionary for both the InfoScan and Consumer Network data. It contains basic descriptors for UPC food products, including product category hier-archy (i.e., department ID, aisle, category), company hierarchy (i.e., parent, manufacturer, brand), and characteristics of the product itself (i.e., UPC description, style, type). See table 10 for the complete list of variables. Product_dictionary_nutrition contains nutrition information and claims for many UPCs, including information from the Nutrition Facts panel, ranges for several nutrients, and health and wellness claims on the packaging. Further examination of the nutrition file is covered later in the report.
IRI also delivered three additional dictionaries for specialized types of products: product_dictionary_perishables, product_dictionary_rwpanel, and product_dictionary_privatelabel. The perishables dictionary contains product information for uniform-weight and random-weight perish-able items such as produce and meat. These items have more limited product information, as shown in table 10. This dictionary links with all perishable items in the InfoScan data (contained in rw_store and rw_rma) and uniform-weight perishable products in the trip file.
Product_dictionary_rwpanel contains random-weight products purchased by the household panel. As noted in the discussion about the Consumer Network panel, households record random-weight products at an aggregated product level (e.g., apples, chicken breast) with very limited type informa-tion and no size variables.
Finally, as detailed in the section on InfoScan, a set of retailers delivers private-label data at the brand/category level. Product_dictionary_privatelabel contains product information for private-label items from these retailers, and IRI assigns these products a UPC beginning with “66.” Private-label product information from other retailers is reported at the UPC level and is contained in the POS dictionary.

34 Understanding IRI Household-Based and Store-Based Scanner Data, TB-1942
Economic Research Service/USDA
Table 10Overview of the IRI dictionary files - continued
Dictionary fileTotal active food UPCs (2008–12)
Linked transaction files Variables
Product_dictionary_pos 806,357Pos_store (InfoScan)Pos_rma (InfoScan)Trip (Consumer Network)
• UPC• UPC description• EAN (International Article
Number)• Flavor• Launch year• Aisle• Brand• Department ID• Manufacturer• Parent• Product• UPC_2• Week moved• Number of nutrients from
Nutrition Facts panel• Number of nutrients with
ranges• Number of claims vari-
ables• Number of nutrition claims
variables• Number of flavor variables• Number of other descriptor
variables• Number of style descriptor
variables• Number of type variables• Flag for duplicate EAN• Brand type• Style• Style codes• Other • Other codes• Type• Type codes• Total units• Total volume• Flag for imputed category• Category
Product_dictionary_nutrition 636,673Pos_store (InfoScan)Pos_rma (InfoScan)Trip (Consumer Network)
• See table 11
Product_dictionary_perish-ables
43,267Rw_store (InfoScan)Rw_rma (InfoScan)Trip (Consumer Network)
• UPC• Department ID• Category• Product• Variety• Claims• Other style• Type• Total units• Total volume

35 Understanding IRI Household-Based and Store-Based Scanner Data, TB-1942
Economic Research Service/USDA
Table 10Overview of the IRI dictionary files - continued
Dictionary fileTotal active food UPCs (2008–12)
Linked transaction files Variables
Product_dictionary_rwpanel 175 Trip (Consumer Network)
• UPC• Department ID• Category• Product
Product_dictionary_private-label
551
Privatelabel_store (In-foScan)Privatelabel_rma (In-foScan)
• UPC• Department• Aisle• Category• UPC description• Manufacturer• Parent• Brand• Brand type
Source: Calculated by authors using data from IRI.
The IRI dictionary files contain all products active in the Consumer Network or InfoScan data from 2008 to 2012. This means that the dictionary data must be matched to the other datasets to determine which UPCs are active in a particular year. Prior to 2013, it was not feasible to deter-mine whether products have been reformulated or relabeled over time because only the most recent product attributes are included in the dataset.30 However, the dataset includes variables that can help discern when the UPC became available on product shelves (imputed by IRI) and the most recent week in which sales were reported for the UPC that may be useful in some analyses.
Overview of the Contents of the Nutrition Product Dictionary
The product dictionary information for nutrition attributes provides product claims on the front of the package and nutrition values on the back of the package for food products. In the past, product claims and nutrition data had to be linked to purchase data using other commercial sources such as Gladson, Mintel, and DataMonitor. The availability of nutrition and product claim variables within the IRI data eases the ability to conduct analyses that rely on these data.
Table 11 provides an overview of the types of variables included in the nutrition dataset. The nutri-tion values are expressed in amounts and percentage daily value (%DV), depending on how the information is presented on the Nutrition Facts panel.31 The product claims data, which are generally obtained from the front of the package, are coded by category of claim with different levels of the claim. These claims may be either nutrient-content claims, such as “no,” “low,” or “less” of a nutrient or component, or functional claims. Functional claims refer to health claims that relate a nutrient or component to promoting or maintaining health or reducing disease (e.g., “studies show that diets low in salt help to maintain a healthy heart”). In addition to these claims, the data contain variables containing long strings of other types of nutrition claims (e.g., fat grams or juice percentage) and other more general types of claims (e.g., natural or kosher).
30ERS will maintain annual versions of the dictionaries from 2013 forward. 31The percentage daily values are relative to the Daily Reference Values established by the U.S Food and Drug Admin-
istration for a 2,000-calorie-per-day diet.

36 Understanding IRI Household-Based and Store-Based Scanner Data, TB-1942
Economic Research Service/USDA
Table 11Overview of key nutrition and product claims variables in the IRI nutrition data - continued
Location of information Type of information Variables
Nutrition Facts panelNumeric values for serving size information
• Serving size (and units)• Servings per container
Nutrition Facts panel Numeric values for nutrients
• Calories• Calories from fat• Total fat• Saturated fat• Trans fat • Polyunsaturated fat• Monounsaturated fat• Cholesterol• Total carbohydrates• Protein• Dietary fiber• Sugars• Protein• Other carbohydrates• Potassium• Sodium• Vitamin A• Vitamin C• Calcium• Iron
Nutrition Facts panel Daily value percentage for nutrients
• Total fat• Saturated fat• Cholesterol• Total carbohydrates• Dietary fiber• Sugars• Protein• Other carbohydrates• Potassium• Sodium• Vitamin A• Vitamin C• Calcium• Iron• Copper• Folic acid• Magnesium• Niacin• Pantothenic acid• Phosphorus• Riboflavin• Thiamin• Vitamin B12• Vitamin B6• Vitamin D• Vitamin E• Zinc
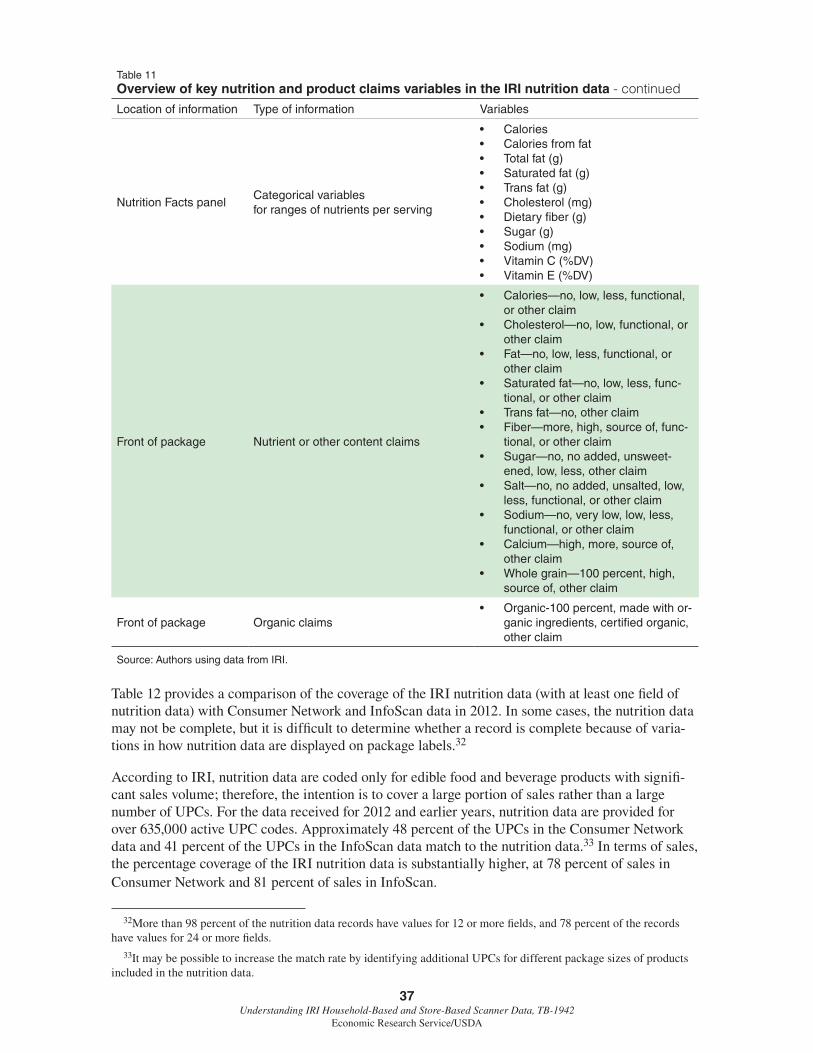
37 Understanding IRI Household-Based and Store-Based Scanner Data, TB-1942
Economic Research Service/USDA
Table 11Overview of key nutrition and product claims variables in the IRI nutrition data - continued
Location of information Type of information Variables
Nutrition Facts panelCategorical variables for ranges of nutrients per serving
• Calories• Calories from fat• Total fat (g)• Saturated fat (g)• Trans fat (g)• Cholesterol (mg)• Dietary fiber (g)• Sugar (g)• Sodium (mg)• Vitamin C (%DV)• Vitamin E (%DV)
Front of package Nutrient or other content claims
• Calories—no, low, less, functional, or other claim
• Cholesterol—no, low, functional, or other claim
• Fat—no, low, less, functional, or other claim
• Saturated fat—no, low, less, func-tional, or other claim
• Trans fat—no, other claim• Fiber—more, high, source of, func-
tional, or other claim• Sugar—no, no added, unsweet-
ened, low, less, other claim• Salt—no, no added, unsalted, low,
less, functional, or other claim• Sodium—no, very low, low, less,
functional, or other claim• Calcium—high, more, source of,
other claim• Whole grain—100 percent, high,
source of, other claim
Front of package Organic claims• Organic-100 percent, made with or-
ganic ingredients, certified organic, other claim
Source: Authors using data from IRI.
Table 12 provides a comparison of the coverage of the IRI nutrition data (with at least one field of nutrition data) with Consumer Network and InfoScan data in 2012. In some cases, the nutrition data may not be complete, but it is difficult to determine whether a record is complete because of varia-tions in how nutrition data are displayed on package labels.32
According to IRI, nutrition data are coded only for edible food and beverage products with signifi-cant sales volume; therefore, the intention is to cover a large portion of sales rather than a large number of UPCs. For the data received for 2012 and earlier years, nutrition data are provided for over 635,000 active UPC codes. Approximately 48 percent of the UPCs in the Consumer Network data and 41 percent of the UPCs in the InfoScan data match to the nutrition data.33 In terms of sales, the percentage coverage of the IRI nutrition data is substantially higher, at 78 percent of sales in Consumer Network and 81 percent of sales in InfoScan.
32More than 98 percent of the nutrition data records have values for 12 or more fields, and 78 percent of the records have values for 24 or more fields.
33It may be possible to increase the match rate by identifying additional UPCs for different package sizes of products included in the nutrition data.

38 Understanding IRI Household-Based and Store-Based Scanner Data, TB-1942
Economic Research Service/USDA
Table 12IRI nutrition data coverage with Consumer Network and InfoScan for UPCs active in 2012
DatasetTotal food
UPCsa
Number of UPCs matched with nutrition data
Percent of UPCs matched with nutrition data
Percent of sales represented in nutrition data
Nutrition data 308,317 — — —
Consumer Network 420,002 201,542 48.0 78.2
InfoScan 463,748 187,925 40.5 80.7
Note: Not all nutrition data UPCs are active because IRI does not remove UPCs without sales data.aThe UPC count does not include random-weight or perishable-product codes.Source: Calculated by authors using data from IRI.
Table 13 shows a summary comparison of the IRI nutrition data against an alternative nutrition dataset from Gladson (www.gladson.com) for branded and private-label products in 2012.34 The number of branded UPCs that appear only in Gladson exceed the number that appear only in IRI by approximately 10,000 UPCs, but the number of private-label UPCs that appear only in IRI exceed the number that appear only in Gladson by about 50,000 UPCs. Thus, Gladson provides somewhat better coverage in total for branded products than IRI, but IRI provides substantially better coverage for private-label products. Note that these differences are based only on UPC counts and not sales volumes represented by the UPCs.
Tables in the appendix provide a more detailed comparison of IRI and Gladson nutrition data coverage by product category. To conduct this comparison, we first matched the UPCs in the Gladson data with the UPCs in the IRI nutrition data. We then aligned Gladson product categories with the IRI product categories through a manual matching process. For example, the IRI category cake/cupcake/pie was aligned with portions of the following Gladson categories: baking, dessert, kosher, Mexican, and snack cake. Thus, the comparisons by product category should be considered approximate.
Table 13Summary of overlapping UPCs between IRI and Gladson nutrition data for UPCs active in 2012a
IRI product category IRI only Gladson only Both IRI and Gladson
Branded UPCs 53,543 63,465 56,461
Private-label UPCs 68,009 11,283 21,536aCounts based on an unprojected subset of stores from IRI’s InfoScan market tracking services.Source: Calculated by authors using data from IRI and Gladson.
The results of these comparisons suggest that supplementing the IRI nutrition data with Gladson nutrition data can help increase overall coverage of the nutrition data, but analysts will need to care-fully construct a combined dataset because the fields provided differ across the two sources. It may be more important to consider supplementing the data in cases where the product categories appear to have substantially different coverage across the datasets (i.e., a large number of UPCs in the “only” columns and a small number in the “both” column).35
34Gladson focuses on providing data on product contents and does not provide sales data. Therefore, Gladson data can be used as a supplement to household- and store-based scanner data but not as a substitute.
35In future work, we plan to estimate hedonic price equations to better understand whether differences in the coverage of products and the data values between IRI and Gladson lead to differences in results of analyses that rely on these data. The results should indicate whether certain nutrient information or labeling claims are associated with product prices and help determine whether the two different sources of data are comparable.

39 Understanding IRI Household-Based and Store-Based Scanner Data, TB-1942
Economic Research Service/USDA
Nutrition Data Collection and Preparation Process
As mentioned previously, for new UPCs entering the market, IRI obtains product image scans and then codes the information from the package and adds it to its dictionary database. As part of coding the information on the package, IRI includes nutrition information and product claims in its dictionary database. The addition of nutrition information and product claims is a relatively new part of the IRI coding process.
IRI aims to add information on a particular UPC to its data dictionary after the product is scanned 50 times. IRI adds approximately 3 million new items across all consumer packaged goods, including food products, to its dictionary database on an annual basis (IRI, March 24, 2014). Its goal is to capture nutritional and claim information for food and beverage products representing 95 percent of its respective category dollar sales volume. IRI updates the information for a product when a new image of the product becomes available or a significant change in the item description is detected. For example, if a retailer changes the weight information in the item description for a product, IRI flags the UPC for review and update of the product data.
IRI obtains information for coding products from package flats provided by clients (manufac-turers and retailers) and product images obtained from IRI’s field force, IRI’s clients, third-party vendors, and websites. To include nutrition data, IRI must have an image of all sides of the package. Otherwise, it includes only the main product attributes from the front of the package. The image for the product is stored in a database, and coding attributes are entered through visual examination of the image. When coding claims, IRI focuses on keywords included on the front of the package.

40 Understanding IRI Household-Based and Store-Based Scanner Data, TB-1942
Economic Research Service/USDA
Considerations in Using IRI Data for Policy Analysis
Based on the examination of the data described earlier, we provide broad guidance and consider-ations for using the data for policy analysis. In some cases, it is important for analysts to understand a particular aspect of the data that affects the types of research for which the data are most suitable. In other cases, analysts may need to ensure the analysis methods account for or adjust for the char-acteristics of the data. As is always the case in reporting the results of any analysis, it is important to state clearly any limitations that arise due to the nature of the data and any approaches taken to address the limitations (for previous work evaluating the Nielsen Homescan data, see Einav et al., 2009).
Household-Based Scanner Data: Consumer Network
The Consumer Network data provide detailed food purchase, price, and demographic data for a large panel of households in the United States. The UPC-coded purchases made by each household can be linked to information about product characteristics (e.g., brand, manufacturer, flavor, organic versus non-organic), store attributes, and nutrition information (i.e., Nutrition Facts panel, and health claims), providing a much more granular picture of what Americans are purchasing. This enables researchers to address food policy-related issues that could not be addressed using publicly available household purchase data. However, when working with Consumer Network data, analysts may need to consider the following:
Households represented in the data . Analysts should understand that certain types of households are less likely to report purchases consistently enough to be included in the static panel. This is particularly true for younger households, lower income households, and households with children. Although weights are provided to weight the data to ensure that the distribution of household demo-graphics reflects the make-up of the U.S. population, it is likely that households that report regularly enough to be included in the static panel have different attitudes toward diet and health than does the general population (see Muth et al., 2013). These differences in attitudes could influence purchase behaviors.
Household demographic data availability . The household demographic data received by ERS for the first purchase of data for 2008-12 represents the demographic characteristics in 2012, and, thus, changes in the demographic characteristics cannot be determined. IRI overwrites the demographic variables with each annual update such that prior values cannot be retrieved. In future updates, ERS will retain the annual values of the demographic characteristics.
Assignment of prices to individual purchases . The price represented in the data for most purchases is not the same as the price that the household actually paid but instead represents an average price for a broad geographic area and particular retail chain. In cases where a household uses a coupon or obtains another type of deal, analysts should adjust the prices paid by subtracting the value of coupons to calculate the net price paid. However, it should be noted that store coupons are already accounted for in the average price. Thus, some degree of double counting may occur when applying coupon values to an individual household’s purchases.
Quantities of random-weight foods. Because households record total price paid but not quanti-ties of random-weight foods, analysts must conduct additional calculations to develop estimates of the quantities. One such approach is to calculate average price per pound (or other units) for each

41 Understanding IRI Household-Based and Store-Based Scanner Data, TB-1942
Economic Research Service/USDA
random-weight food from the InfoScan data and then divide the total price paid in the Consumer Network data by the calculated average price to obtain an estimate of the total pounds (or other units). However, this method has not been tested by the authors, and further research is needed to determine the validity of such estimates.
Store information . When recording purchases, households report the name of the retailer chain or store type but do not record the specific store location. Therefore, it is not possible to match the household and retail data directly by individual store.
Weighting for calculating quantities . The weights (projection factors) in the dataset are developed based on achieving specific demographic targets across the households in the static dataset. Thus, weights are not developed with the idea of aligning total purchases to known national totals. This means that when the weights are applied to the data to estimate total regional or national purchases of foods, the weighted total is not necessarily the true total amount. However, applying the weights as provided is still the most effective approach to developing mean and total estimates.
Weighting in regression models . The decision about whether to weight the data when estimating econometric models is not settled. Although most statisticians would advocate for estimating weighted regressions, many economists tend to disagree (see Solon et al., 2015). However, statisti-cians and econometricians do agree that clustering should be accounted for in estimating the vari-ance-covariance matrix for the coefficients.
Store-Based Scanner Data: InfoScan
The InfoScan data contain aggregate weekly quantities sold and prices by UPC code for branded and, in some cases, random-weight and private-label (store brand) products. Billions of transactions across the country are recorded for grocery, drug, convenience, mass merchandiser, club, dollar, and defense commissary stores. Like the Consumer Network data, these data can be linked to informa-tion on store and product characteristics, providing a rich picture of the food retailing environment. When working with InfoScan data, analysts may need to consider the following issues:
Stores represented in the data . Although the InfoScan data capture a large number of stores and a large portion of sales volumes, they are not designed to capture sales from many smaller, inde-pendent stores. These stores often have different product selection and pricing strategies than larger stores, and lower income households may be more likely to shop at these types of stores. Thus, some types of analyses that are of interest might not be appropriate for InfoScan data. For example, it is likely not possible to analyze purchase behaviors in stores with majority WIC (Special Supplemental Program for Women, Infants, and Children) sales or WIC-only stores (approximately 1,000 stores in the United States), which tend to be small but follow very different strategies than larger grocery stores.
Private-label product data . For many types of packaged products, a substantial portion of the UPCs are private-label rather than branded products. In the InfoScan data, the data for private-label products are not as complete as those for branded products because of limitations on what retailers have approved for release by IRI. In some cases, retailers have not agreed to release any data on private-label product sales. In other cases, the data are aggregated in such a way that it is not possible to calculate unit prices (e.g., a record in the dataset might represent UPCs of different sizes, and, thus, the total ounces cannot be calculated for determining a price per ounce).
42 Understanding IRI Household-Based and Store-Based Scanner Data, TB-1942
Economic Research Service/USDA
Random-weight data . The random-weight data included in InfoScan data are limited because they are only released for certain stores and have somewhat limited product information. In addition, the units for random-weight products are recorded as a weight or a count; thus, analysts must determine the units for each product type included in an analysis.
Projection factors (or weights) . Projection factors or weights are not provided with the InfoScan data; therefore, it is not possible to calculate nationally representative estimates. Thus, analyses of the data are only representative of the subset of stores reflected in the data.
Nutrition and Product Claims Data
The nutrition and product claims data enable researchers to gain additional insight into U.S. food purchasing behavior and the food retailing environment. These data will allow researchers to deter-mine the underlying mechanisms behind food choice and diet quality. When working with nutrition and product claims data, analysts may need to consider the following issues.
Year of the data . For data prior to 2013, it is not possible to determine if the product nutrition or product claims data are current or when they were last updated. It is possible this affects only a small number of products due to the way IRI assigns generation codes to denote changes in product UPCs, but it may limit some types of analyses that focus on changes in product attributes over time. However, moving forward, ERS will maintain separate data for each subsequent year of the data, which will facilitate analyses that track changes over time.
Extrapolation for missing UPC-level information . Although the nutrition and product claims data cover a large portion of UPCs (and an even larger portion of sales volumes), many UPCs do not have nutrition or product claims data. It may be possible to extrapolate the existing data to cover other UPCs if other package sizes are included in the data. In those cases, the nutrition values per serving should be the same, and one could assume that the product claims would also be the same. In addi-tion, if analysts have access to the Gladson Nutrition Database, the nutrition values and product claims could be appended to either the Consumer Network or InfoScan data if not provided by IRI. In this case, analysts would have to ensure that the units are the same between the datasets.
Private-label products . Many fewer private-label products have nutrition or product claims data than do branded products. Thus, analyses that may wish to focus on differences between branded and private-label products or that are intended to be representative of the entire market may be limited or infeasible.
Interpretation of missing values in nutrition data . When using the nutrition data, analysts should note that many of the fields appear to be missing simply because the value was not listed on the label. However, a missing value in most cases should be recoded to zero. In particular, when a nutrient does not appear on a product label because it is an optional nutrient to be listed for that product, it can safely be assumed to be zero.
Standardization of nutrition values based on serving size . In analyzing nutrition data, analysts may need to standardize nutrient values to account for differences in serving sizes. Specifically, if the serving size is different between products, such as ½ cup for one product and 1 cup for another product, then nutrient values should be converted so that the serving sizes are the same across products. Furthermore, if one product’s 1-cup serving is x grams and another’s is y grams, analysts should consider converting the nutrient values so that the serving size weights are equivalent.

43 Understanding IRI Household-Based and Store-Based Scanner Data, TB-1942
Economic Research Service/USDA
Conclusion
The IRI household and retail scanner data are a valuable resource for conducting food economics research. Their vast size, scope, and level of detail allow users to gain unique insights into consumer food-purchase behaviors that have implications for food and nutrition research. Despite the limita-tions outlined in this report, these data are among the most extensive data sources used for food economics analysis and complement existing publicly available data sources.
44 Understanding IRI Household-Based and Store-Based Scanner Data, TB-1942
Economic Research Service/USDA
References
Andreyeva, T., J. Luedicke, K.E. Henderson, A.S. Tripp. 2012. “Grocery Store Beverage Choices by Participants in Federal Food Assistance and Nutrition Programs.” American Journal of Preventative Medicine 43(4): 411-418.
Einav, L., E. Leibtag, and A. Nevo. 2009. “Recording Discrepancies in Nielsen Homescan Data: Are They Present and Do They Matter? “ Quantitative Marketing and Economics 7(4).
Finkelstein, E.A., C. Zhen, M. Bilger, J. Nonnemaker, A.M. Farooqui and J.E. Todd. 2013. “Implications of a Sugar-Sweetened Beverage (SSB) Tax When Substitutions to Non-Beverage Items Are Considered.” Journal of Health Economics 32(1): 219-239
IRI. 2015. “National Consumer Panel.” http://ncppanel.com/content/ncp/ncphome.html. Accessed September 14, 2015.
IRI. May 2013. “IRI Item Coding.” PowerPoint presentation provided to ERS.
IRI. August 2, 2013. “All Commodity Volume (ACV).” Internal document provided to RTI.
IRI. March 24, 2014. “Information Resources, Inc. Documentation: ERS Data Extract Project.” Internal document provided to ERS.
IRI. September 15, 2014. “Multi-outlet.” Internal document provided to RTI.
IRI. February 11, 2015. “Response to Coding Questions.” Internal document provided to RTI.
IRI. March 3, 2015. “Consumer Network Methodologies: Prepared for USDA and RTI.”
IRI. Undated. “IRI Census Data Coverage/Information.” Internal document provided to RTI.
Leibtag, E. 2006. The Impact of Big-Box Stores on Retail Food Prices and the Consumer Price Index. Economic Research Report 33, U.S. Department of Agriculture, Economic Research Service. http://www.ers.usda.gov/publications/err-economic-research-report/err33.aspx.
Lin, B.H., T.A. Smith, J.-Y. Lee, and K.D. Hall. 2011. “Measuring Weight Outcomes for Obesity Intervention Strategies: The Case of a Sugar-Sweetened Beverage Tax.” Economics and Human Biology 9(4): 329-341.
Muth, M.K., S.C. Cates, S.A. Karns, P. Siegel, K.C. Wohlgenant, and C. Zhen. 2013. “Comparing Attitudinal Survey Responses From Proprietary and Government Surveys.” Prepared for U.S. Department of Agriculture, Economic Research Service.
Muth, M.K., P.H. Siegel, and C. Zhen. 2007. “ERS Data Quality Study Design.” Report prepared for U.S. Department of Agriculture, Economic Research Service.
Oh, H.L., and F.J. Scheuren. 1983. “Weighting Adjustment for Unit Nonresponse.” In Incomplete Data in Sample Surveys, Volume 2: Theory and Bibliographies, W.G. Madow, I. Olkin, and D.B. Rubin (Eds.), pp. 143-184. New York: Academic Press.

45 Understanding IRI Household-Based and Store-Based Scanner Data, TB-1942
Economic Research Service/USDA
Oliveira, V., B. Frazao, and D. Smallwood. 2011. The Infant Formula Market: Consequences of a Change in the WIC Contract Brand. Economic Research Report 124, U.S. Department of Agriculture, Economic Research Service. http://www.ers.usda.gov/publications/err-economic-research-report/err124.aspx.
Solon, G., S.J. Haider, and J.M. Wooldridge, 2015. “What Are We Weighting for?” Journal of Human Resources 50:301–316.
USDA National Nutrient Database for Standard Reference. http://ndb.nal.usda.gov/.
Volpe, R., and A. Okrent. 2013. Assessing the Healthfulness of Consumers’ Grocery Purchases. Economic Information Bulletin 22, U.S. Department of Agriculture, Economic Research Service. http://www.ers.usda.gov/publications/eib-economic-information-bulletin/eib102.aspx.
Woodruff, R.S. 1971. “A Simple Method for Approximating the Variance of a Complicated Estimate.” Journal of the American Statistical Association, 66: 411–414.
Zhen, C., E.A. Finkelstein, J.M. Nonnemaker, S.A. Karns and J.E. Todd. 2014. “Predicting the Effects of Sugar-Sweetened Beverage Taxes on Food and Beverage Demand in a Large Demand System.” American Journal of Agricultural Economics 96(1): 1-25. http://ajae.oxfordjournals.org/content/96/1/1.

46 Understanding IRI Household-Based and Store-Based Scanner Data, TB-1942
Economic Research Service/USDA
Appendix: Changes to Subsequent Data Deliveries
ERS purchased IRI data for 2008-14 and plans to purchase data for 2015. The analysis in this report covers the initial delivery of the data, which includes data for 2008-12. In subsequent years, the data made available to ERS and third-party agreement researchers has evolved, with changes in format and availability of information. This appendix documents changes to the data between 2013 and 2015, which are not covered earlier in this report.
Table Organization
The data for 2008-12 were provided to ERS in one delivery. As such, these data are stored in a set of tables each encompassing 5 years of data. Distinct years can be identified using the variable for IRI week. Data for subsequent years are contained in separate annual files.
Consumer Network Data
Household demographics: The household demographics table for 2008-12 is a snapshot of house-hold demographic characteristics as of 2012, and, thus, changes in demographic characteristics over this period cannot be determined. As ERS obtains additional years of data, the household character-istics for each subsequent year of data will be retained, enabling researchers to observe changes over time beginning with 2012.
InfoScan Data
Brand/Category private-label data: In 2013, Walmart and Sam’s began releasing private-label data at the brand/category level. These data are included in the private-label RMA table and dictionary along with the Kroger and Safeway private-label data discussed in this report.
RMA definitions: On an annual basis, retailers may redefine their RMA definitions. These changes, called “restatements,” may result in the new RMA definitions that do not align with historical data. For example, Walmart restated its geographies in the 2015 data, and other retailer restatements may occur in future data deliveries. Similarly, retailers may change between store-level and RMA-level reporting due to restatements, mergers, or acquisitions. For example, Harris Teeter changed from store-level reporting to RMA-level reporting in 2014 when the chain was purchased by Kroger.
Product Dictionaries and Nutrition Data
Product dictionaries: In the 2008-12 dictionaries, it was not feasible to determine whether products have been reformulated or relabeled over time because only the most recent product attributes are included in the dataset. ERS will maintain annual versions of the dictionaries from 2013 forward.
Household random-weight dictionary: Because households record purchases of random-weight products at an aggregated product-category level, the product dictionary for household random-weight items is static; all years of data link to one dictionary (product_dictionary_RWpanel), and annual updates are not necessary.

47 Understanding IRI Household-Based and Store-Based Scanner Data, TB-1942
Economic Research Service/USDA
Appendix table 1Abbreviations and acronyms in this report
Abbreviation Term Description
ACV All commodity volume
ACV includes all scanned and nonscanned food and nonfood items (e.g., health and beauty products) and services (e.g., floral department, video rental, and photo development) but excludes items such as gasoline, prescription drugs, furniture, appliances, and sporting equipment.
CN Consumer NetworkIRI household scanner data. “Consumer Network data” and “household data” are used interchangeably in this report.
EANInternational Article Number
True UPC barcode as assigned by the manufacturer.
NAICSNorth American Industry Classification System
Standard industry classification system used by Federal statisti-cal agencies in classifying business establishments for the purpose of collecting, analyzing, and publishing statistical data related to the U.S. business economy.
NCPNational Consumer Panel
An operational joint venture between IRI and Nielsen to collect consumer and market insight data from a panel of consumers who report their purchases and answer surveys.
PL Private labelStore brands, as opposed to national brands. For example, Kroger brand ketchup is private label, while Heinz is a national brand.
PLU Price look-up codeFour- or five-digit product identification numbers on non-UPC grocery items such as bulk produce.
POS Point of saleRefers to both UPC products (items with a UPC that can be scanned by a point-of-sale checkout or payment system) and UPC-product transactions in the InfoScan data.
RMA Retailer marketing areaAn aggregate geographic area that a retailer defines as its competitive marketing area. Unique by retailer. Certain retailers provide data to ERS by aggregate RMA instead of by store.
RW Random weight
Perishable products without a UPC that are typically sold in bulk or by the unit. Random-weight products cover fresh meat, poul-try, seafood, bakery, fruits, vegetables, cheese, cold cuts and lunch meat, prepared foods, coffee, and candy, nuts, and seeds.
UPC Universal Product Code
A barcode symbology widely used in the U.S. and other coun-tries to track trade items in stores. Its most common form, the UPC-A, consists of 12 numerical digits, which are uniquely as-signed to each trade item. IRI UPCs add two digits to the end of the UPC-A to track when UPCs are recycled.

48 Understanding IRI Household-Based and Store-Based Scanner Data, TB-1942
Economic Research Service/USDA
Appendix table 2Comparison of IRI nutrition data versus Gladson for branded and private-label products, 2012a - continued
Branded UPCs Private-label UPCs
IRI product categoryIRI
only
Glad-son only
BothIRI
only
Glad-son only
Both Total
ALCOHOLIC CIDERS 0 41 0 0 0 0 41
ALL OTHER BAKING MIXES 52 101 62 34 9 6 264
ALL OTHER CRACKERS 400 1,106 874 411 137 286 3,214
ALL OTHER DRY SEASONING MIXES 29 25 42 3 0 2 101
ALL OTHER PROCESSED CHEESE 62 99 63 62 14 18 318
ALL OTHER SEASONAL CANDY 51 22 24 2 2 0 101
AMERICAN CHEESE-ALL FORM 100 33 80 309 13 97 632
ASIAN COOKING OILS 12 23 41 3 2 0 81
BABY ELECTROLYTES 1 17 4 5 41 3 71
BABY FOOD/SNACK 154 469 644 132 79 128 1,606
BABY FORMULA 0 60 1 2 39 0 102
BABY FORMULA LIQUID CONCEN-TRATE
1 21 0 0 0 0 22
BABY FORMULA POWDER 6 75 5 4 24 7 121
BABY JUICE 4 48 38 4 0 0 94
BAKING CHOCOLATE/CHIPS/COCOA 42 77 116 132 13 61 441
BAKING POWDER/SODA 8 12 17 48 2 31 118
BREAD MIXES 23 92 76 16 4 2 213
BREADCRUMBS 53 64 84 146 5 36 388
BREADING/BATTER/COATING MIXES 39 96 130 42 3 17 327
BREATH FRESHENER (INCLUDE SUG-ARLESS)
62 54 130 0 0 0 246
BROWN/POWDER/FLAVORED SUGAR 29 24 38 164 13 52 320
BROWNIE MIX 29 43 91 72 14 21 270
CAKE/CUPCAKE/PIE MIX 58 84 212 116 27 59 556
CARAMEL/TAFFY APPLES 56 0 5 13 0 0 74
CARBONATED WATER/CLUB SODA (INCLUDE FLAVORED)
246 220 266 498 91 204 1,525
CAROB/YOGURT COATED SNACK 80 40 23 40 14 10 207
CATSUP/KETCHUP 27 39 37 170 30 87 390
CHEESE SNACKS 200 195 173 93 8 48 717
CHEESE SPREADS/BALLS 176 108 116 55 6 7 468
CHOCOLATE CANDY BAR < 3.5OZ/UNIT 279 741 400 42 21 2 1,485
CHOCOLATE CANDY BOX/BAG > 3.5OZ 538 975 601 214 91 46 2,465
CHOCOLATE CANDY SNACK SIZE 49 215 77 0 10 0 351
CHOCOLATE COVERED COOKIE/WA-FER CANDY BAR
35 88 54 3 1 1 182
CHOCOLATE COVERED SALTED SNACK
126 58 45 48 17 3 297

49 Understanding IRI Household-Based and Store-Based Scanner Data, TB-1942
Economic Research Service/USDA
Appendix table 2Comparison of IRI nutrition data versus Gladson for branded and private-label products, 2012a - continued
Branded UPCs Private-label UPCs
IRI product categoryIRI
only
Glad-son only
BothIRI
only
Glad-son only
Both Total
CHOCOLATE MILK FLAVORING/COCOA MIX
70 132 109 121 25 73 530
CHOCOLATE SYRUP/DESSERT TOP-PING
22 171 91 67 11 31 393
CHOW MEIN NOODLES 2 11 16 6 1 2 38
CHRISTMAS CANDY 530 71 212 67 6 8 894
CHUNKY PEANUT BUTTER 31 19 51 124 22 51 298
CHUTNEY 17 46 34 4 0 1 102
COCONUT 9 17 21 94 3 22 166
COFFEE CAKE/GINGERBREAD/PAS-TRY MIX
19 34 47 4 1 0 105
COFFEE SUBSTITUTES 0 14 7 0 0 0 21
COFFEE TEA ADDITIVES/FLAVORING 77 44 59 4 4 1 189
COOKIE/COOKIE BAR MIX 38 43 52 33 4 11 181
COOKIES 1,512 2,281 1,528 1,496 443 587 7,847
COOKING & SALAD OILS 101 228 130 438 40 139 1,076
COOKING SHERRY/WINE 8 20 45 21 0 6 100
COOKING SPRAY 10 33 33 146 15 72 309
COOKING STARCHES/RENNET 10 21 33 20 2 18 104
CORN/CARO/CRYSTAL/WHITE SYRUP 22 9 21 55 0 7 114
CORNMEAL/BAKING OAT BRAN 100 36 82 33 0 6 257
COTTAGE CHEESE 167 149 207 239 24 123 909
COUGH DROP/SQUARE 0 1 0 0 0 0 1
CREAM CHEESE/CREAM CHEESE SPREAD
70 73 68 241 45 95 592
CREAMY PEANUT BUTTER 55 85 83 175 40 83 521
CROUTONS-NO STUFFING CROUTONS 37 73 65 104 14 54 347
DATES 67 6 25 12 3 3 116
DIET CANDY 75 199 144 29 18 8 473
DISTILLED WATER 10 3 6 16 0 6 41
DOMESTIC BEER/ALE 0 128 0 0 0 0 128
DOMESTIC STILL/TABLE WINE 0 74 0 0 0 0 74
DRIED BEANS/GRAINS 327 227 224 603 25 144 1,550
DRIED MEAT SNACKS 310 560 260 138 28 21 1,317
DRIED PRUNES 21 39 29 72 9 23 193
DRIED VEGETABLE—EXCEPT BEANS 125 65 88 61 3 20 362
DRY DINNER MIX WITH MEAT 13 5 21 0 3 1 43
DRY DINNER MIX—ADD MEAT 56 93 139 133 38 45 504
DRY GRAVY MIXES 33 67 112 183 11 50 456
DRY MACARONI & CHEESE MIX 29 70 109 273 29 90 600
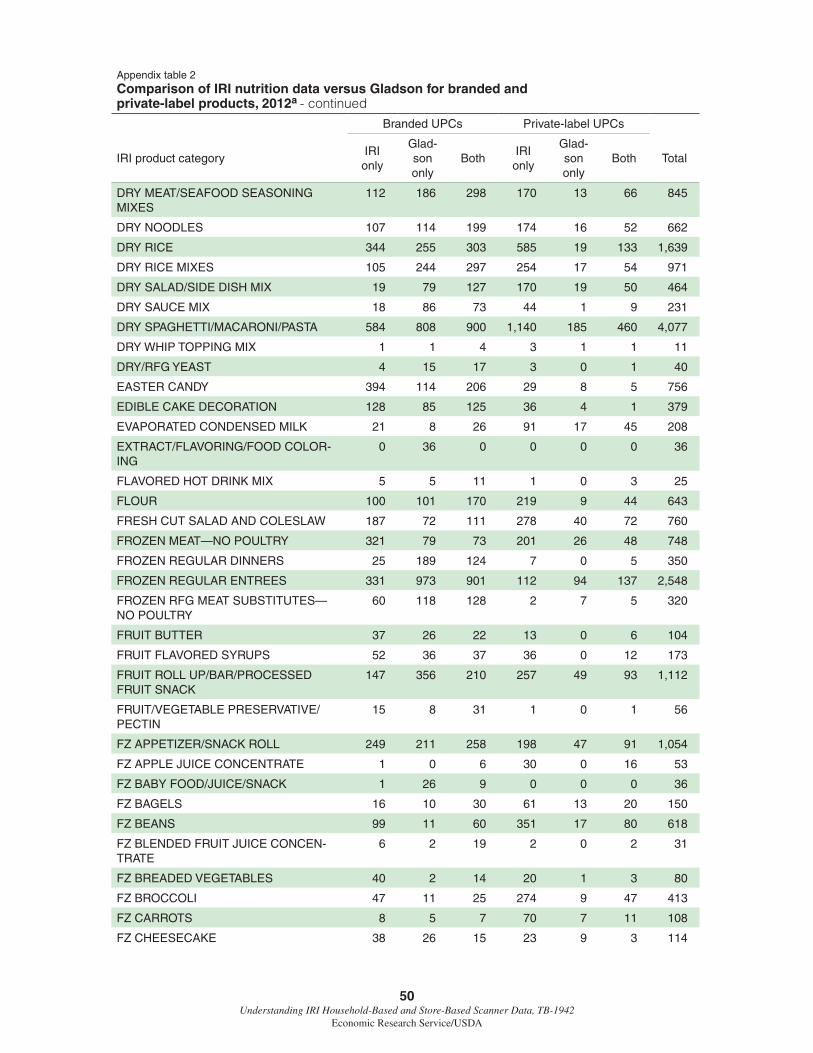
50 Understanding IRI Household-Based and Store-Based Scanner Data, TB-1942
Economic Research Service/USDA
Appendix table 2Comparison of IRI nutrition data versus Gladson for branded and private-label products, 2012a - continued
Branded UPCs Private-label UPCs
IRI product categoryIRI
only
Glad-son only
BothIRI
only
Glad-son only
Both Total
DRY MEAT/SEAFOOD SEASONING MIXES
112 186 298 170 13 66 845
DRY NOODLES 107 114 199 174 16 52 662
DRY RICE 344 255 303 585 19 133 1,639
DRY RICE MIXES 105 244 297 254 17 54 971
DRY SALAD/SIDE DISH MIX 19 79 127 170 19 50 464
DRY SAUCE MIX 18 86 73 44 1 9 231
DRY SPAGHETTI/MACARONI/PASTA 584 808 900 1,140 185 460 4,077
DRY WHIP TOPPING MIX 1 1 4 3 1 1 11
DRY/RFG YEAST 4 15 17 3 0 1 40
EASTER CANDY 394 114 206 29 8 5 756
EDIBLE CAKE DECORATION 128 85 125 36 4 1 379
EVAPORATED CONDENSED MILK 21 8 26 91 17 45 208
EXTRACT/FLAVORING/FOOD COLOR-ING
0 36 0 0 0 0 36
FLAVORED HOT DRINK MIX 5 5 11 1 0 3 25
FLOUR 100 101 170 219 9 44 643
FRESH CUT SALAD AND COLESLAW 187 72 111 278 40 72 760
FROZEN MEAT—NO POULTRY 321 79 73 201 26 48 748
FROZEN REGULAR DINNERS 25 189 124 7 0 5 350
FROZEN REGULAR ENTREES 331 973 901 112 94 137 2,548
FROZEN RFG MEAT SUBSTITUTES—NO POULTRY
60 118 128 2 7 5 320
FRUIT BUTTER 37 26 22 13 0 6 104
FRUIT FLAVORED SYRUPS 52 36 37 36 0 12 173
FRUIT ROLL UP/BAR/PROCESSED FRUIT SNACK
147 356 210 257 49 93 1,112
FRUIT/VEGETABLE PRESERVATIVE/PECTIN
15 8 31 1 0 1 56
FZ APPETIZER/SNACK ROLL 249 211 258 198 47 91 1,054
FZ APPLE JUICE CONCENTRATE 1 0 6 30 0 16 53
FZ BABY FOOD/JUICE/SNACK 1 26 9 0 0 0 36
FZ BAGELS 16 10 30 61 13 20 150
FZ BEANS 99 11 60 351 17 80 618
FZ BLENDED FRUIT JUICE CONCEN-TRATE
6 2 19 2 0 2 31
FZ BREADED VEGETABLES 40 2 14 20 1 3 80
FZ BROCCOLI 47 11 25 274 9 47 413
FZ CARROTS 8 5 7 70 7 11 108
FZ CHEESECAKE 38 26 15 23 9 3 114
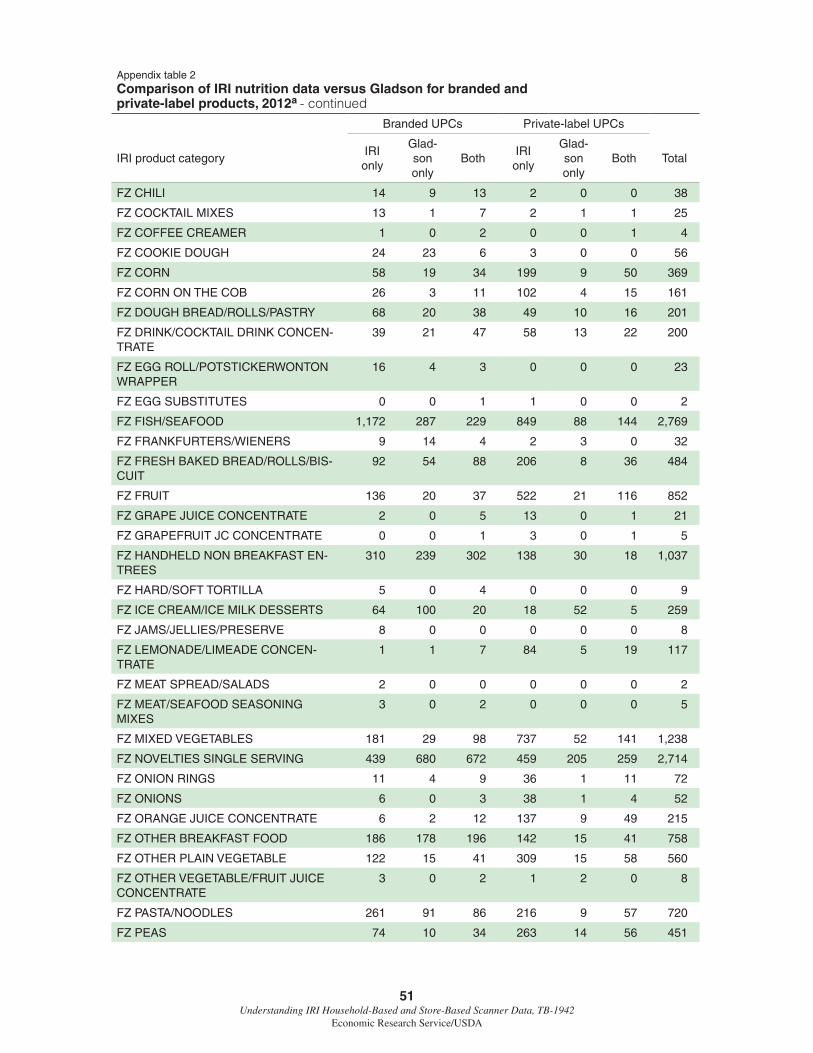
51 Understanding IRI Household-Based and Store-Based Scanner Data, TB-1942
Economic Research Service/USDA
Appendix table 2Comparison of IRI nutrition data versus Gladson for branded and private-label products, 2012a - continued
Branded UPCs Private-label UPCs
IRI product categoryIRI
only
Glad-son only
BothIRI
only
Glad-son only
Both Total
FZ CHILI 14 9 13 2 0 0 38
FZ COCKTAIL MIXES 13 1 7 2 1 1 25
FZ COFFEE CREAMER 1 0 2 0 0 1 4
FZ COOKIE DOUGH 24 23 6 3 0 0 56
FZ CORN 58 19 34 199 9 50 369
FZ CORN ON THE COB 26 3 11 102 4 15 161
FZ DOUGH BREAD/ROLLS/PASTRY 68 20 38 49 10 16 201
FZ DRINK/COCKTAIL DRINK CONCEN-TRATE
39 21 47 58 13 22 200
FZ EGG ROLL/POTSTICKERWONTON WRAPPER
16 4 3 0 0 0 23
FZ EGG SUBSTITUTES 0 0 1 1 0 0 2
FZ FISH/SEAFOOD 1,172 287 229 849 88 144 2,769
FZ FRANKFURTERS/WIENERS 9 14 4 2 3 0 32
FZ FRESH BAKED BREAD/ROLLS/BIS-CUIT
92 54 88 206 8 36 484
FZ FRUIT 136 20 37 522 21 116 852
FZ GRAPE JUICE CONCENTRATE 2 0 5 13 0 1 21
FZ GRAPEFRUIT JC CONCENTRATE 0 0 1 3 0 1 5
FZ HANDHELD NON BREAKFAST EN-TREES
310 239 302 138 30 18 1,037
FZ HARD/SOFT TORTILLA 5 0 4 0 0 0 9
FZ ICE CREAM/ICE MILK DESSERTS 64 100 20 18 52 5 259
FZ JAMS/JELLIES/PRESERVE 8 0 0 0 0 0 8
FZ LEMONADE/LIMEADE CONCEN-TRATE
1 1 7 84 5 19 117
FZ MEAT SPREAD/SALADS 2 0 0 0 0 0 2
FZ MEAT/SEAFOOD SEASONING MIXES
3 0 2 0 0 0 5
FZ MIXED VEGETABLES 181 29 98 737 52 141 1,238
FZ NOVELTIES SINGLE SERVING 439 680 672 459 205 259 2,714
FZ ONION RINGS 11 4 9 36 1 11 72
FZ ONIONS 6 0 3 38 1 4 52
FZ ORANGE JUICE CONCENTRATE 6 2 12 137 9 49 215
FZ OTHER BREAKFAST FOOD 186 178 196 142 15 41 758
FZ OTHER PLAIN VEGETABLE 122 15 41 309 15 58 560
FZ OTHER VEGETABLE/FRUIT JUICE CONCENTRATE
3 0 2 1 2 0 8
FZ PASTA/NOODLES 261 91 86 216 9 57 720
FZ PEAS 74 10 34 263 14 56 451

52 Understanding IRI Household-Based and Store-Based Scanner Data, TB-1942
Economic Research Service/USDA
Appendix table 2Comparison of IRI nutrition data versus Gladson for branded and private-label products, 2012a - continued
Branded UPCs Private-label UPCs
IRI product categoryIRI
only
Glad-son only
BothIRI
only
Glad-son only
Both Total
FZ PIE/PASTRY SHELLS 8 14 10 79 2 16 129
FZ PIES 30 80 127 14 4 1 256
FZ PIZZA 299 409 460 437 96 118 1,819
FZ PIZZA CRUSTS/DOUGH 26 12 5 7 0 8 58
FZ PLAIN POTATO/FRENCH FRY/HASH BROWNS
107 20 90 415 24 133 789
FZ POT PIES 14 33 43 9 3 1 103
FZ PREBAKED MUFFINS 7 3 21 1 0 0 32
FZ PREPARED DIPS 9 2 7 3 2 2 25
FZ PREPARED PUDDING/MOUSSE 4 0 0 1 0 2 7
FZ PREPARED VEGETABLE (IN SAUCE) 19 9 60 9 9 11 117
FZ PRETZELS 10 6 18 16 0 5 55
FZ READY TO EAT COOKIES 1 1 0 0 2 2 6
FZ RFG POULTR/POULTRY SUBSTI-TUTES
821 245 353 394 69 88 1,970
FZ SAUCE/GRAVY/MARINADE 21 3 9 2 0 0 35
FZ SAUSAGE 115 31 56 44 3 4 253
FZ SIDE DISH 114 89 98 43 17 18 379
FZ SOUP 61 30 61 8 1 6 167
FZ SPINACH 30 5 15 163 4 35 252
FZ SQUASH/ZUCCHINI 11 0 3 45 0 8 67
FZ STUFFING 7 0 2 1 0 0 10
FZ SWEET GOODS—NO CHEESECAKE 75 96 70 45 19 22 327
FZ WAFFLES 32 60 65 223 26 85 491
FZ WHIP TOPPINGS 6 7 19 177 6 47 262
FZ YOGURT/TOFU—CARTON 105 120 118 60 17 40 460
GELATIN DESSERT MIX 37 80 88 237 27 81 550
GIFT BOX CHOCOLATES 141 111 75 2 4 1 334
GLAZED FRUIT 29 3 20 18 2 6 78
GRAHAM CRACKER CRUMBS 1 1 3 3 1 2 11
GRAHAM CRACKERS 30 72 33 101 24 62 322
GROUND COFFEE (INCLUDE FLA-VORED)
17 46 12 5 1 5 86
GROUND DECAFFEINATED COFFEE (INCLUDE FLAVORED)
0 5 13 0 0 0 18
HALLOWEEN CANDY 184 62 54 20 13 8 341
HARD SUGAR CANDY/PACKAGE/ROLL CANDY
198 579 184 95 37 18 1,111
HOMINY GRITS 22 11 20 43 0 9 105
HOT CEREAL/OATMEAL 111 196 199 496 79 192 1,273
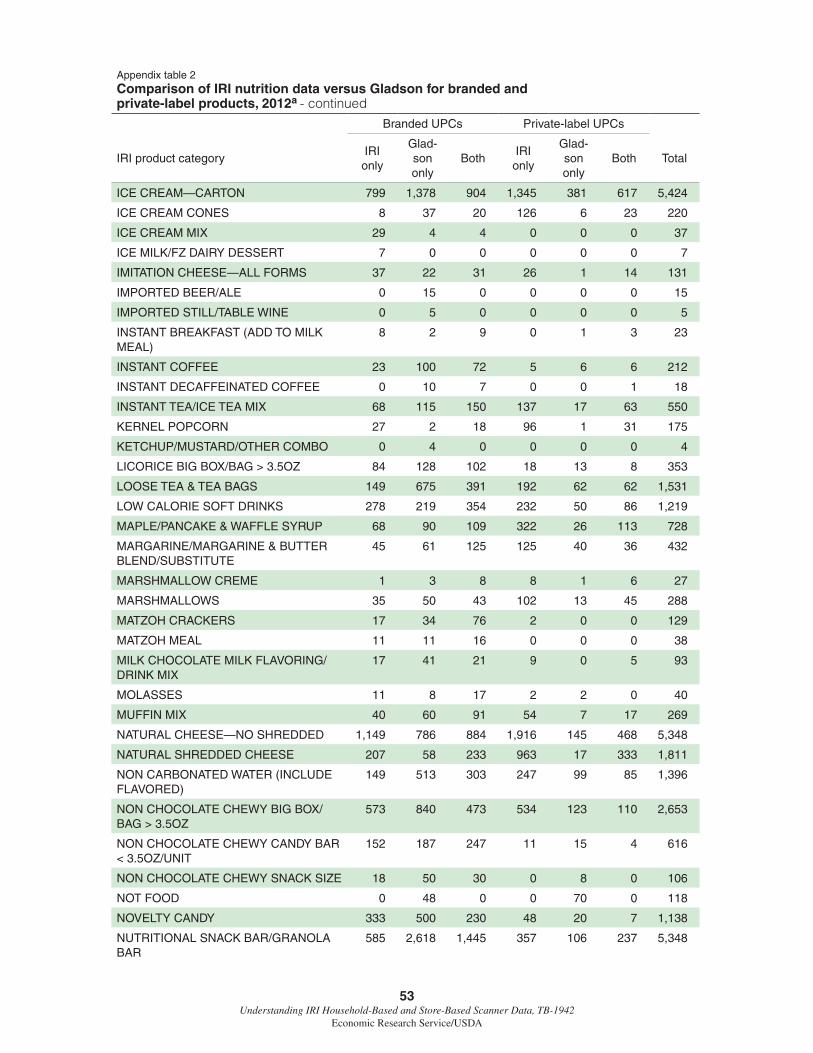
53 Understanding IRI Household-Based and Store-Based Scanner Data, TB-1942
Economic Research Service/USDA
Appendix table 2Comparison of IRI nutrition data versus Gladson for branded and private-label products, 2012a - continued
Branded UPCs Private-label UPCs
IRI product categoryIRI
only
Glad-son only
BothIRI
only
Glad-son only
Both Total
ICE CREAM—CARTON 799 1,378 904 1,345 381 617 5,424
ICE CREAM CONES 8 37 20 126 6 23 220
ICE CREAM MIX 29 4 4 0 0 0 37
ICE MILK/FZ DAIRY DESSERT 7 0 0 0 0 0 7
IMITATION CHEESE—ALL FORMS 37 22 31 26 1 14 131
IMPORTED BEER/ALE 0 15 0 0 0 0 15
IMPORTED STILL/TABLE WINE 0 5 0 0 0 0 5
INSTANT BREAKFAST (ADD TO MILK MEAL)
8 2 9 0 1 3 23
INSTANT COFFEE 23 100 72 5 6 6 212
INSTANT DECAFFEINATED COFFEE 0 10 7 0 0 1 18
INSTANT TEA/ICE TEA MIX 68 115 150 137 17 63 550
KERNEL POPCORN 27 2 18 96 1 31 175
KETCHUP/MUSTARD/OTHER COMBO 0 4 0 0 0 0 4
LICORICE BIG BOX/BAG > 3.5OZ 84 128 102 18 13 8 353
LOOSE TEA & TEA BAGS 149 675 391 192 62 62 1,531
LOW CALORIE SOFT DRINKS 278 219 354 232 50 86 1,219
MAPLE/PANCAKE & WAFFLE SYRUP 68 90 109 322 26 113 728
MARGARINE/MARGARINE & BUTTER BLEND/SUBSTITUTE
45 61 125 125 40 36 432
MARSHMALLOW CREME 1 3 8 8 1 6 27
MARSHMALLOWS 35 50 43 102 13 45 288
MATZOH CRACKERS 17 34 76 2 0 0 129
MATZOH MEAL 11 11 16 0 0 0 38
MILK CHOCOLATE MILK FLAVORING/DRINK MIX
17 41 21 9 0 5 93
MOLASSES 11 8 17 2 2 0 40
MUFFIN MIX 40 60 91 54 7 17 269
NATURAL CHEESE—NO SHREDDED 1,149 786 884 1,916 145 468 5,348
NATURAL SHREDDED CHEESE 207 58 233 963 17 333 1,811
NON CARBONATED WATER (INCLUDE FLAVORED)
149 513 303 247 99 85 1,396
NON CHOCOLATE CHEWY BIG BOX/BAG > 3.5OZ
573 840 473 534 123 110 2,653
NON CHOCOLATE CHEWY CANDY BAR < 3.5OZ/UNIT
152 187 247 11 15 4 616
NON CHOCOLATE CHEWY SNACK SIZE 18 50 30 0 8 0 106
NOT FOOD 0 48 0 0 70 0 118
NOVELTY CANDY 333 500 230 48 20 7 1,138
NUTRITIONAL SNACK BAR/GRANOLA BAR
585 2,618 1,445 357 106 237 5,348

54 Understanding IRI Household-Based and Store-Based Scanner Data, TB-1942
Economic Research Service/USDA
Appendix table 2Comparison of IRI nutrition data versus Gladson for branded and private-label products, 2012a - continued
Branded UPCs Private-label UPCs
IRI product categoryIRI
only
Glad-son only
BothIRI
only
Glad-son only
Both Total
NUTRITIONAL SNACK/TRAIL MIX 375 340 219 355 113 141 1,543
NUTS FOR BAKING/COOKING 328 68 147 350 29 98 1,020
OLIVE OIL 195 374 231 311 30 89 1,230
OTHER CORN SNACK—NO TORTILLA CHIP
126 149 89 37 13 20 434
OTHER DRIED FRUIT—NO PRO-CESSED SNACK
389 289 229 198 60 74 1,239
OTHER SALTED SNACK—NO NUTS 660 777 600 306 28 98 2,469
PANCAKE/FRENCH TOAST/WAFFLE MIX
46 90 114 115 17 42 424
PEANUT BUTTER COMBO—PEANUT BUTTER & JELLY
10 4 3 20 1 0 38
PEPPER 0 46 0 0 5 0 51
PIECRUST MIX 0 0 5 4 0 1 10
PIZZA CRUST MIX 2 9 11 9 2 2 35
PLAIN MINTS 88 183 69 102 24 19 485
POPCORN OIL 3 1 3 1 0 0 8
POTATO CHIPS 850 1,019 726 420 63 125 3,203
POTATO PANCAKE/DUMPLING MIX 3 6 21 0 0 0 30
POWDERED MILK 14 25 16 64 4 26 149
PREMIXED COCKTAILS/COOLERS—WINE/SPIRITS/MALT
0 117 0 0 0 0 117
PREPARED MUSTARD 50 302 180 302 44 126 1,004
PRETZELS 260 283 288 229 27 87 1,174
PROCESSED SHREDDED CHEESE 5 1 5 2 0 2 15
PUDDING/PIE FILLING/MOUSSE MIXES 50 111 130 215 15 79 600
RAISINS 33 49 46 188 15 67 398
READY TO EAT CEREAL 540 953 832 1,477 395 612 4,809
REGULAR GUM (NO SUGARLESS) 134 312 121 18 11 1 597
REGULAR SOFT DRINKS 777 907 825 739 167 242 3,657
RFG ALL OTHER FRUIT JUICE 19 68 9 2 0 1 99
RFG APPETIZERS/SNACK ROLL 159 25 20 3 2 2 211
RFG APPLE JUICE 6 7 9 5 1 0 28
RFG BACON 522 36 169 288 5 77 1,097
RFG BAGELS/BIALYS 28 14 20 50 0 6 118
RFG BAKED BEANS 9 0 4 19 1 1 34
RFG BISCUIT DOUGH 11 8 29 363 7 43 461
RFG BLENDED FRUIT JUICE 45 23 50 18 1 8 145
RFG BOTTLED JUICE & DRINK SMOOTHIE
31 85 62 5 1 1 185

55 Understanding IRI Household-Based and Store-Based Scanner Data, TB-1942
Economic Research Service/USDA
Appendix table 2Comparison of IRI nutrition data versus Gladson for branded and private-label products, 2012a - continued
Branded UPCs Private-label UPCs
IRI product categoryIRI
only
Glad-son only
BothIRI
only
Glad-son only
Both Total
RFG BREAD 16 1 5 1 0 0 23
RFG BREAKFAST ENTREE 42 15 16 33 0 0 106
RFG BREAKFAST SAUSAGE/HAM 508 49 141 114 2 32 846
RFG BUTTER ALL FLAVORS 78 49 86 170 11 49 443
RFG CAKE (NO SNACK/COFFEE CAKE) 50 2 1 45 3 0 101
RFG CANNED/BOTTLED HAM 16 7 7 0 0 0 30
RFG CHEESECAKE 98 23 10 76 0 2 209
RFG CIDER 87 4 12 37 2 6 148
RFG COCKTAIL MIXES 2 0 0 0 0 0 2
RFG COFFEE CONCENTRATE 6 0 0 0 0 0 6
RFG COFFEE CREAMER 41 48 138 118 15 48 408
RFG COOKIE/BROWNIE DOUGH 41 44 77 54 10 25 251
RFG CRANBERRY COCKTAIL/DRINK 5 3 6 1 0 1 16
RFG CRANBERRY JUICE/CRANBERRY JUICE BLEND
3 0 2 0 0 0 5
RFG DAIRY CREAM/HALF & HALF/SOY TOPPING
268 141 223 466 28 113 1,239
RFG DINNER SAUSAGE (POLISH/ITAL-IAN)
1,260 217 302 362 38 75 2,254
RFG DINNER/SANDWICH ROLL/CROIS-SANT
2 1 1 7 0 0 11
RFG DOUGH (BREAD/ROLLS/BUN) 7 11 21 123 8 30 200
RFG DOUGH (PASTRY/DUMPLING) 9 11 28 128 6 24 206
RFG DRINK CONCENTRATE/SYRUP 0 0 0 1 0 0 1
RFG EGG SUBSTITUTES 16 4 11 55 10 25 121
RFG EGGROLL/WONTON WRAPPER 15 5 8 2 0 0 30
RFG ENGLISH MUFFIN 6 0 6 19 4 6 41
RFG FISH/HERRING/SEAFOOD 370 79 88 125 5 28 695
RFG FLAVORED MILK/EGG NOG/BUT-TER MILK
511 327 391 317 17 57 1,620
RFG FLAVORED SPREADS 125 136 110 80 12 10 473
RFG FRANKFURTER/WIENERS 395 67 181 110 17 28 798
RFG FRESH EGGS 241 88 47 336 19 60 791
RFG FRESH SOUPS 45 24 6 133 4 48 260
RFG FRUIT DRINK ALL FLAVORS 133 100 145 44 8 14 444
RFG FRUIT JUICE LIQUID CONCEN-TRATE
8 0 0 0 0 0 8
RFG FRUIT NECTAR 11 9 6 3 0 0 29
RFG GRAPE JUICE 2 1 3 0 1 0 7
RFG GRAPEFRUIT COCKTAIL/DRINK 2 0 0 0 0 0 2

56 Understanding IRI Household-Based and Store-Based Scanner Data, TB-1942
Economic Research Service/USDA
Appendix table 2Comparison of IRI nutrition data versus Gladson for branded and private-label products, 2012a - continued
Branded UPCs Private-label UPCs
IRI product categoryIRI
only
Glad-son only
BothIRI
only
Glad-son only
Both Total
RFG GRAPEFRUIT JUICE 11 10 10 13 7 3 54
RFG GRATED CHEESE 35 10 17 31 1 5 99
RFG HANDHELD NON BREAKFAST ENTREE
194 37 59 138 2 4 434
RFG HARD/SOFT TORTILLA 86 13 21 12 2 18 152
RFG HONEY 0 0 0 1 0 0 1
RFG HORSERADISH/HORSERADISH SAUCE
51 16 39 15 3 4 128
RFG KEFIR/SUBSTITUTES MILK/SOY MILK
54 129 99 91 15 43 431
RFG LARD 7 0 2 0 0 0 9
RFG LEMON/LIME JUICE 1 2 0 0 0 0 3
RFG LEMONADE 37 31 61 22 2 7 160
RFG MARINATED VEGETABLE/FRUIT/EGG
27 10 11 4 2 0 54
RFG MEAT SPREAD/SALAD 53 14 12 46 1 1 127
RFG MEAT/CHEESE/CRACKER/DES-SERT
30 87 71 4 0 0 192
RFG MEAT/SEAFOOD SEASONING MIXES
3 0 6 0 0 0 9
RFG MILKSHAKE/NON DAIRY DRINK 21 29 21 7 0 0 78
RFG MUFFIN 2 0 0 0 0 0 2
RFG MUSTARD 1 0 0 0 0 0 1
RFG NON DAIRY TOPPINGS 8 0 0 12 0 2 22
RFG NON SLICED LUNCH MEAT 252 86 39 21 30 6 434
RFG ORANGE JUICE 163 133 161 381 29 71 938
RFG PASTRY/DANISH/COFFEE CAKE 6 11 0 9 6 1 33
RFG PEANUT BUTTER (ALL) 7 0 5 1 0 0 13
RFG PEPPER/PIMENTO/OLIVES 13 4 6 5 0 1 29
RFG PICKLES 39 7 29 14 1 15 105
RFG PIE (NO SNACK PIE) 45 2 3 28 1 0 79
RFG PINEAPPLE JUICE 1 1 1 0 1 1 5
RFG PIZZA CRUST/DOUGH 19 10 7 39 14 9 98
RFG PIZZA/PIZZA KITS 37 9 16 84 4 5 155
RFG PORK PRODUCT HOCK/FEET 88 7 6 0 5 0 106
RFG POT PIES 10 3 8 6 1 2 30
RFG PREPARED CHILI 20 13 6 11 0 4 54
RFG PREPARED DINNER/ENTREE 204 184 97 158 63 46 752
RFG PREPARED DIPS 310 161 173 225 16 48 933
RFG PREPARED SALAD FRUIT/COLE-SLAW
173 26 59 388 12 54 712

57 Understanding IRI Household-Based and Store-Based Scanner Data, TB-1942
Economic Research Service/USDA
Appendix table 2Comparison of IRI nutrition data versus Gladson for branded and private-label products, 2012a - continued
Branded UPCs Private-label UPCs
IRI product categoryIRI
only
Glad-son only
BothIRI
only
Glad-son only
Both Total
RFG PREPARED TEAS 149 84 118 116 12 4 483
RFG PUDDING/MOUSSE/GELATIN/PARFAIT
152 120 112 114 14 55 567
RFG RELISHES/APPETIZER RELISH 3 0 4 3 1 0 11
RFG RTD COFFEE 6 5 17 0 2 0 30
RFG SALAD DRESSING—POURABLE/SPREAD
89 56 169 21 18 18 371
RFG SALAD TOPPING/BACON BITS 1 0 0 2 0 0 3
RFG SAUCE/GRAVY/MARINADE 253 38 109 130 11 34 575
RFG SAUERKRAUT 22 2 11 16 0 5 56
RFG SIDE DISHES 107 68 53 65 13 26 332
RFG SKIM/LOW-FAT MILK 655 309 582 848 35 178 2,607
RFG SLICE/SHAVED LUNCH MEAT 596 482 457 544 128 202 2,409
RFG SNACK CAKE/DOUGHNUT < 5OZ 7 6 9 2 0 0 24
RFG UNCOOKED MEATS 311 42 24 192 270 3 842
RFG VEGETABLE JUICE/COCKTAIL 11 15 13 0 0 0 39
RFG WEIGHT CONTROL/PROTEIN SUPPLEMENT
5 16 2 0 0 0 23
RFG WHOLE MILK 243 98 210 301 9 57 918
RFG YOGURT 517 606 851 996 271 313 3,554
RFG YOGURT DRINKS 84 55 95 18 1 8 261
RFG/DELI PASTA/NOODLE 80 39 41 41 20 56 277
RICE CAKES/POPCORN CAKE 35 83 58 101 21 44 342
RICOTTA CHEESE 34 11 59 128 5 33 270
RTD BREAKFAST MEALS 15 25 7 0 2 0 49
RTE POPCORN/CARAMEL CORN 455 181 207 83 11 34 971
RTS FROSTING/FROSTING MIX 60 41 147 97 4 39 388
SALAD TOPPING/BACON BIT 73 59 85 97 9 37 360
SALT/SALT SEASONING/SALT SUBSTI-TUTES
0 321 0 0 85 0 406
SALTED APPLE CHIPS 1 0 4 0 0 0 5
SALTINE CRACKERS 21 15 17 109 15 52 229
SHERBET/SORBET/ICE CARTON 99 137 65 174 36 76 587
SHERRY/VERMOUTH/CHAMPAGNE 0 11 0 0 0 0 11
SNACK NUTS 657 913 520 1,254 375 500 4,219
SOUR CREAM 90 88 108 190 19 64 559
SPECIALTY NUT BUTTER 23 75 82 16 18 9 223
SPECIALTY NUT/COCONUT CANDY 197 214 103 66 26 14 620
SPICE/SEASONING—NO SALT/PEPPER 0 1,468 0 0 81 0 1,549
SPIRITS/LIQUOR 0 21 0 0 0 0 21
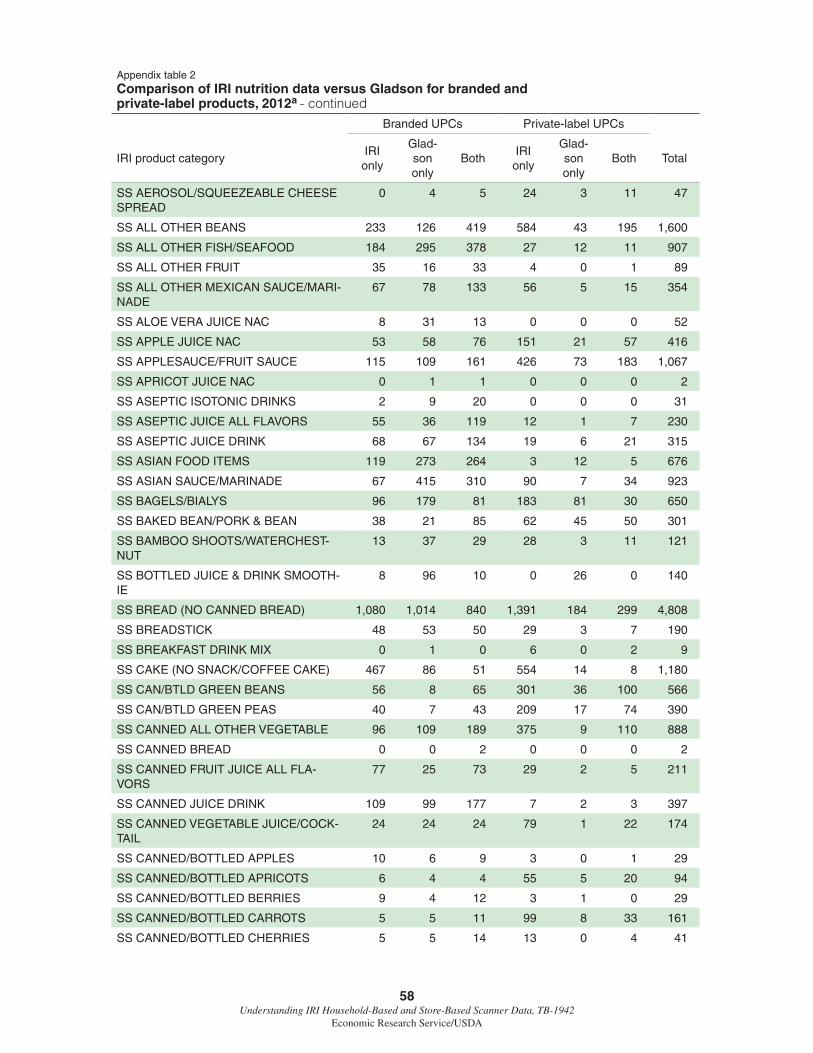
58 Understanding IRI Household-Based and Store-Based Scanner Data, TB-1942
Economic Research Service/USDA
Appendix table 2Comparison of IRI nutrition data versus Gladson for branded and private-label products, 2012a - continued
Branded UPCs Private-label UPCs
IRI product categoryIRI
only
Glad-son only
BothIRI
only
Glad-son only
Both Total
SS AEROSOL/SQUEEZEABLE CHEESE SPREAD
0 4 5 24 3 11 47
SS ALL OTHER BEANS 233 126 419 584 43 195 1,600
SS ALL OTHER FISH/SEAFOOD 184 295 378 27 12 11 907
SS ALL OTHER FRUIT 35 16 33 4 0 1 89
SS ALL OTHER MEXICAN SAUCE/MARI-NADE
67 78 133 56 5 15 354
SS ALOE VERA JUICE NAC 8 31 13 0 0 0 52
SS APPLE JUICE NAC 53 58 76 151 21 57 416
SS APPLESAUCE/FRUIT SAUCE 115 109 161 426 73 183 1,067
SS APRICOT JUICE NAC 0 1 1 0 0 0 2
SS ASEPTIC ISOTONIC DRINKS 2 9 20 0 0 0 31
SS ASEPTIC JUICE ALL FLAVORS 55 36 119 12 1 7 230
SS ASEPTIC JUICE DRINK 68 67 134 19 6 21 315
SS ASIAN FOOD ITEMS 119 273 264 3 12 5 676
SS ASIAN SAUCE/MARINADE 67 415 310 90 7 34 923
SS BAGELS/BIALYS 96 179 81 183 81 30 650
SS BAKED BEAN/PORK & BEAN 38 21 85 62 45 50 301
SS BAMBOO SHOOTS/WATERCHEST-NUT
13 37 29 28 3 11 121
SS BOTTLED JUICE & DRINK SMOOTH-IE
8 96 10 0 26 0 140
SS BREAD (NO CANNED BREAD) 1,080 1,014 840 1,391 184 299 4,808
SS BREADSTICK 48 53 50 29 3 7 190
SS BREAKFAST DRINK MIX 0 1 0 6 0 2 9
SS CAKE (NO SNACK/COFFEE CAKE) 467 86 51 554 14 8 1,180
SS CAN/BTLD GREEN BEANS 56 8 65 301 36 100 566
SS CAN/BTLD GREEN PEAS 40 7 43 209 17 74 390
SS CANNED ALL OTHER VEGETABLE 96 109 189 375 9 110 888
SS CANNED BREAD 0 0 2 0 0 0 2
SS CANNED FRUIT JUICE ALL FLA-VORS
77 25 73 29 2 5 211
SS CANNED JUICE DRINK 109 99 177 7 2 3 397
SS CANNED VEGETABLE JUICE/COCK-TAIL
24 24 24 79 1 22 174
SS CANNED/BOTTLED APPLES 10 6 9 3 0 1 29
SS CANNED/BOTTLED APRICOTS 6 4 4 55 5 20 94
SS CANNED/BOTTLED BERRIES 9 4 12 3 1 0 29
SS CANNED/BOTTLED CARROTS 5 5 11 99 8 33 161
SS CANNED/BOTTLED CHERRIES 5 5 14 13 0 4 41

59 Understanding IRI Household-Based and Store-Based Scanner Data, TB-1942
Economic Research Service/USDA
Appendix table 2Comparison of IRI nutrition data versus Gladson for branded and private-label products, 2012a - continued
Branded UPCs Private-label UPCs
IRI product categoryIRI
only
Glad-son only
BothIRI
only
Glad-son only
Both Total
SS CANNED/BOTTLED CITRUS FRUIT 27 18 43 129 13 34 264
SS CANNED/BOTTLED CORN 52 21 103 336 28 111 651
SS CANNED/BOTTLED GRAPES 1 0 1 0 0 0 2
SS CANNED/BOTTLED HAM 18 5 8 1 0 0 32
SS CANNED/BOTTLED MIXED FRUIT 50 32 53 355 27 95 612
SS CANNED/BOTTLED MUSHROOMS 41 17 45 194 0 59 356
SS CANNED/BOTTLED PEACHES 56 16 56 358 29 99 614
SS CANNED/BOTTLED PEARS 24 4 28 234 17 64 371
SS CANNED/BOTTLED PINEAPPLE 41 20 42 227 23 74 427
SS CANNED/BOTTLED POTATO/SWEET POTATO
37 8 30 196 10 56 337
SS CANNED/BOTTLED PRUNES/PLUMS 2 1 4 11 3 3 24
SS CANNED/BOTTLED SAUERKRAUT 32 19 38 82 2 21 194
SS CANNED/BOTTLED SPINACH 5 0 12 60 4 20 101
SS CANNED/BOTTLED TOMATO 165 96 258 817 35 309 1,680
SS CANNED/BOTTLED VEGETABLE 36 18 49 135 8 42 288
SS CANNED/PREPARED TEA 197 544 441 78 44 35 1,339
SS CHERRY JUICE NAC 5 4 14 11 5 8 47
SS CHILI/HOTDOG SAUCE 19 27 50 44 1 18 159
SS CIDER NAC 55 6 20 58 1 13 153
SS CLAM JUICE 6 5 11 2 0 0 24
SS COFFEE CAPPUCINO DRINKS 19 104 50 10 13 2 198
SS COFFEE CREAMER 33 40 49 296 47 128 593
SS COLESLAW/FRUIT SALAD DRESS-ING
4 5 12 3 0 1 25
SS CRACKERS WITH FILLINGS 56 136 153 28 10 13 396
SS CRANBERRY COCKTAIL/JUICE DRINK NAC
60 51 106 297 60 99 673
SS CRANBERRY SAUCE 11 6 11 98 14 24 164
SS CRANBERRY/JUICE/CRANBERRY JUICE BLEND NAC
26 23 58 97 25 36 265
SS DAIRY SAUCE/CHEESE 32 15 29 16 2 4 98
SS DOUGHNUT 153 169 101 151 59 18 651
SS DRIED BREAKFAST FOOD 6 0 0 0 0 0 6
SS DRINK CONCENTRATE/SYRUP 117 9 10 6 4 0 146
SS DRY DIP MIX 25 54 50 35 4 5 173
SS DRY SOUPS/SOUP MIXES 161 345 426 91 20 28 1,071
SS EGG SUBSTITUTES 4 3 4 0 0 2 13
SS ENGLISH MUFFIN 43 74 61 95 28 29 330
SS FRESH ROLL/BUN/CROISSANTS 605 422 423 933 80 151 2,614

60 Understanding IRI Household-Based and Store-Based Scanner Data, TB-1942
Economic Research Service/USDA
Appendix table 2Comparison of IRI nutrition data versus Gladson for branded and private-label products, 2012a - continued
Branded UPCs Private-label UPCs
IRI product categoryIRI
only
Glad-son only
BothIRI
only
Glad-son only
Both Total
SS FROST/WHIPPED/YOGURT DRINK MIX
28 2 19 0 0 0 49
SS FRUIT DRINK MIX 108 320 267 356 104 135 1,290
SS FRUIT DRINK NAC 291 529 388 192 59 56 1,515
SS FRUIT JUICE BLEND NAC 58 282 103 73 52 23 591
SS FRUIT JUICE LIQUID CONCEN-TRATE
15 14 21 1 5 0 56
SS FRUIT NECTAR NAC 40 93 47 3 1 1 185
SS GARLIC SPREAD 15 19 14 4 1 1 54
SS GRAPE JUICE NAC 21 38 49 104 20 42 274
SS GRAPEFRUIT COCKTAIL NAC 14 6 15 60 1 14 110
SS GRAPEFRUIT JUICE NAC 13 5 9 37 6 11 81
SS GRATED CHEESE 37 21 46 107 3 35 249
SS HARD/SOFT TORTILLAS/TACO KIT 368 242 327 210 22 44 1,213
SS HOLLANDAISE/BEARNAISE/DILL SAUCE
4 6 4 1 0 1 16
SS HONEY 164 160 99 244 30 58 755
SS HORSERADISH/HORSERADISH SAUCE
20 25 47 12 1 2 107
SS ICE POP NOVELTIES 60 53 49 38 9 7 216
SS INSTANT POTATOES 60 60 93 314 18 85 630
SS ISOTONIC DRINK MIX 34 121 61 38 3 11 268
SS ISOTONIC DRINKS NON-ASEPTIC 285 828 430 90 69 30 1,732
SS JAMS/JELLIES/PRESERVE 192 577 437 683 111 246 2,246
SS LEMON/LIME JUICE NAC 17 10 23 78 0 27 155
SS LEMONADE 66 59 73 48 14 19 279
SS LIQUID COCKTAIL MIXES 113 84 177 31 5 16 426
SS LUNCH MEATS 221 90 154 94 12 45 616
SS MARASCHINO CHERRIES 11 9 13 157 11 46 247
SS MARINATED VEGETABLE/FRUIT/EGG
236 261 288 82 6 21 894
SS MEAT SAUCE/MARINADE/GLAZE 180 527 443 233 12 79 1,474
SS MEAT SUBTITUTES/VEGETABLE PROTEIN PRODUCT
29 1 31 0 0 1 62
SS MEAT/MEAT SPREAD 141 53 90 110 11 33 438
SS MEXICAN FOOD ITEMS 11 119 28 2 5 1 166
SS MICROWAVE PACKAGE DINNER/ENTREE
46 65 146 27 12 15 311
SS MICROWAVE POPCORN 142 202 172 342 73 114 1,045
SS MUFFIN 190 85 82 222 24 8 611

61 Understanding IRI Household-Based and Store-Based Scanner Data, TB-1942
Economic Research Service/USDA
Appendix table 2Comparison of IRI nutrition data versus Gladson for branded and private-label products, 2012a - continued
Branded UPCs Private-label UPCs
IRI product categoryIRI
only
Glad-son only
BothIRI
only
Glad-son only
Both Total
SS NON FRUIT DRINKS—NO COFFEE 14 67 43 1 5 3 133
SS OLIVES 187 351 301 572 36 203 1,650
SS ORANGE JUICE NAC 21 16 21 19 7 3 87
SS OTHER FRUIT JUICE NAC 19 31 36 29 9 18 142
SS OTHER VEGETABLE JUICE/COCK-TAIL NAC
25 50 48 111 22 50 306
SS PASTRY/DANISH/COFFEE CAKE 408 255 191 311 53 34 1,252
SS PEPPERS/PIMENTOS 216 273 379 217 9 57 1,151
SS PICANTE SAUCE 17 9 28 46 2 15 117
SS PICKLES 201 224 234 704 90 175 1,628
SS PIE/PASTRY FILLING 54 57 76 154 10 48 399
SS PIES (NO SNACK PIES) 255 19 7 251 0 9 541
SS PINEAPPLE JUICE NAC 8 1 6 28 2 5 50
SS PIZZA KITS/MIXES TOPPINGS 2 6 6 2 0 0 16
SS POURABLE SALAD DRESSING 116 1,020 537 613 158 300 2,744
SS POWDER COCKTAIL MIXES 7 39 29 1 2 5 83
SS PREPARED BARBECUE SAUCE 167 359 265 219 38 78 1,126
SS PREPARED CHILI 85 75 135 109 16 22 442
SS PREPARED DIP 67 88 79 55 2 12 303
SS PREPARED HOT/CAJUN SAUCE 99 196 207 89 3 19 613
SS PREPARED ITALIAN SAUCE 174 595 493 497 128 176 2,063
SS PREPARED LIQUID GRAVY 19 19 38 177 13 48 314
SS PREPARED PASTA DISHES 20 49 59 193 36 115 472
SS PREPARED PIZZA SAUCE 23 30 44 44 1 9 151
SS PREPARED PUDDING/GELATIN 39 65 49 156 25 49 383
SS PREPARED SALAD 15 38 21 28 8 4 114
SS PREPARED SEAFOOD SAUCE 21 42 40 58 5 21 187
SS PREPARED SLOPPY SAUCE 16 0 11 32 0 18 77
SS PREPARED TACO SAUCE 18 12 27 18 2 8 85
SS PREPARED TARTAR SAUCE 18 25 29 49 0 12 133
SS PRUNE/FIG JUICE NAC 2 3 10 66 2 22 105
SS REFRIED BEANS ONLY 40 44 84 86 13 45 312
SS REGULAR PREPARED DINNER/ENTREE
68 113 69 60 28 19 357
SS RELISH/APPETIZER RELISH 73 75 86 177 16 54 481
SS RTD MILK/MILK SUBSTITUTES 85 64 185 61 8 34 437
SS RTU PIE CRUST 21 25 31 52 2 16 147
SS SALAD DRESSING MIX 5 32 26 13 0 7 83
SS SALMON 50 60 50 30 9 9 208
SS SALSA 176 361 376 326 63 185 1,487

62 Understanding IRI Household-Based and Store-Based Scanner Data, TB-1942
Economic Research Service/USDA
Appendix table 2Comparison of IRI nutrition data versus Gladson for branded and private-label products, 2012a - continued
Branded UPCs Private-label UPCs
IRI product categoryIRI
only
Glad-son only
BothIRI
only
Glad-son only
Both Total
SS SANDWICH SPREAD/MAYONNAISE 69 185 155 193 58 54 714
SS SNACK/CUPCAKE/BROWNIE < 5OZ 414 473 326 275 39 18 1,545
SS SOUP 178 412 597 1,137 168 384 2,876
SS SOUP STARTER/BOUILLON/BOTH 136 244 311 433 33 146 1,303
SS SPARKLING JUICE NAC 75 122 85 18 22 17 339
SS STEAK/WORCESTERSHIRE SAUCE 13 103 57 106 28 37 344
SS STUFFING MIX 33 55 34 95 17 41 275
SS TOASTER PASTRY/TART 57 61 84 212 49 79 542
SS TOMATO PASTE/SAUCE/PUREE/ASPIC
111 48 88 309 12 125 693
SS TUNA 70 147 158 127 36 62 600
SS VEGETABLE/ANIMAL SHORTENING/LARD
14 10 18 42 7 13 104
SS YOGURT/YOGURT DRINKS 7 3 13 1 0 0 24
SUGAR SUBSTITUTES 63 108 111 151 33 58 524
SUGARLESS GUM 268 288 355 3 7 0 921
SUNFLOWER/PUMPKIN SEEDS 172 149 153 103 35 33 645
TAFFY/CANDY APPLE KIT 10 3 18 5 0 1 37
TOASTED CORN NUT SNACKS 20 20 33 3 0 0 76
TORTILLA/TOSTADA CHIPS 375 497 327 183 27 101 1,510
UNIFORM WEIGHT FRESH OTHER FRUIT
0 75 0 0 31 0 106
UNIFORM WEIGHT FRESH OTHER VEGETABLE
0 56 0 0 17 0 73
UNIFORM WEIGHT FRESH APPLES 0 60 0 0 35 0 95
UNIFORM WEIGHT FRESH BEANS 0 7 0 0 2 0 9
UNIFORM WEIGHT FRESH BROCCOLI 0 4 0 0 6 0 10
UNIFORM WEIGHT FRESH CABBAGE 0 4 0 0 2 0 6
UNIFORM WEIGHT FRESH CARROTS 0 20 0 0 39 0 59
UNIFORM WEIGHT FRESH CAULI-FLOWER
0 1 0 0 1 0 2
UNIFORM WEIGHT FRESH CELERY 0 2 0 0 7 0 9
UNIFORM WEIGHT FRESH CUCUMBER 0 0 0 0 1 0 1
UNIFORM WEIGHT FRESH GRAPE-FRUIT
0 1 0 0 3 0 4
UNIFORM WEIGHT FRESH LETTUCE 0 9 0 0 13 0 22
UNIFORM WEIGHT FRESH MIXED VEGETABLE
0 38 0 0 46 0 84
UNIFORM WEIGHT FRESH MUSH-ROOM
0 35 0 0 34 0 69
UNIFORM WEIGHT FRESH ONIONS 0 9 0 0 5 0 14
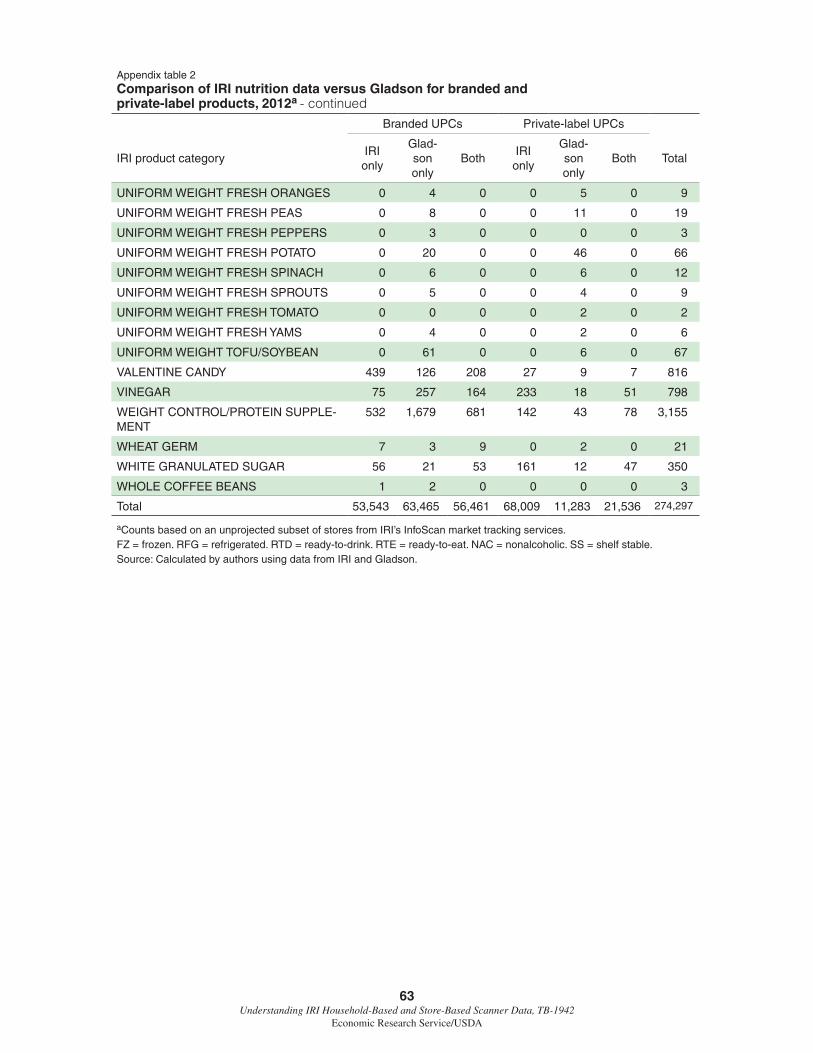
63 Understanding IRI Household-Based and Store-Based Scanner Data, TB-1942
Economic Research Service/USDA
Appendix table 2Comparison of IRI nutrition data versus Gladson for branded and private-label products, 2012a - continued
Branded UPCs Private-label UPCs
IRI product categoryIRI
only
Glad-son only
BothIRI
only
Glad-son only
Both Total
UNIFORM WEIGHT FRESH ORANGES 0 4 0 0 5 0 9
UNIFORM WEIGHT FRESH PEAS 0 8 0 0 11 0 19
UNIFORM WEIGHT FRESH PEPPERS 0 3 0 0 0 0 3
UNIFORM WEIGHT FRESH POTATO 0 20 0 0 46 0 66
UNIFORM WEIGHT FRESH SPINACH 0 6 0 0 6 0 12
UNIFORM WEIGHT FRESH SPROUTS 0 5 0 0 4 0 9
UNIFORM WEIGHT FRESH TOMATO 0 0 0 0 2 0 2
UNIFORM WEIGHT FRESH YAMS 0 4 0 0 2 0 6
UNIFORM WEIGHT TOFU/SOYBEAN 0 61 0 0 6 0 67
VALENTINE CANDY 439 126 208 27 9 7 816
VINEGAR 75 257 164 233 18 51 798
WEIGHT CONTROL/PROTEIN SUPPLE-MENT
532 1,679 681 142 43 78 3,155
WHEAT GERM 7 3 9 0 2 0 21
WHITE GRANULATED SUGAR 56 21 53 161 12 47 350
WHOLE COFFEE BEANS 1 2 0 0 0 0 3
Total 53,543 63,465 56,461 68,009 11,283 21,536 274,297
aCounts based on an unprojected subset of stores from IRI’s InfoScan market tracking services.FZ = frozen. RFG = refrigerated. RTD = ready-to-drink. RTE = ready-to-eat. NAC = nonalcoholic. SS = shelf stable.Source: Calculated by authors using data from IRI and Gladson.