understanding interactions between drivers and pedestrian...
TRANSCRIPT

Understanding Interactions between Drivers and Pedestrian Features at Signalized Intersections
SHRP2 Implementation Assistance Program (IAP) – Round 4
Concept to Countermeasures – Research to Deployment Using SHRP2 Safety Data
PREPARED FOR Federal Highway Administration (FHWA) and
American Association of State Highway and Transportation Officials (AASHTO) Safety Task Force
PREPARED BY Pei-Sung Lin, Achilleas Kourtellis, Zhenyu Wang, Rui Guo and Darryll Dockstader
Center for Urban Transportation Research (CUTR) and Florida Department of Transportation (FDOT)
September 2015
Page | i
Table of Contents Introduction ................................................................................................................................... 1
Goals ............................................................................................................................................1 Objectives ....................................................................................................................................1
Literature Review ......................................................................................................................... 2 Data Used ....................................................................................................................................... 3
SHRP2-RID Dataset ....................................................................................................................3 SHRP2-NDS Dataset ...................................................................................................................3
Method of Analysis ....................................................................................................................... 5 Tool Development and Data Reduction .......................................................................................5 Statistical Analysis .......................................................................................................................7
Research Results ........................................................................................................................... 7 Individual Analysis: Interactions between Drivers and Pedestrian Features ...............................8 Individual Analysis: Comparison between Feature Group and Control Group ...........................9 Individual Analysis: Comparison of Speed before and after Implementation .............................9 Individual Analysis: Comparison of Compliant Behaviors by Gender at Feature Sites ...........10 Individual Analysis: Comparison of Compliant Behaviors by Age at Feature Sites .................11 Overall Analysis: Impacts of Pedestrian Presence ....................................................................11 Overall Analysis: Impacts of Driver Demographics at Feature Sites ........................................12 Overall Analysis: Impacts of Driver Characteristics on Compliant Behaviors .........................12 Summary of Findings .................................................................................................................14 Summary of Lessons Learned ....................................................................................................14
Future Directions ........................................................................................................................ 15 Phase 2 Proposal ......................................................................................................................... 17
Research Objectives ...................................................................................................................17 Data Needs .................................................................................................................................17 Research Approach/Methods .....................................................................................................18 Project Milestones and Timeline ...............................................................................................19 Project Budget ............................................................................................................................19 Project Management and Project Team .....................................................................................20 Management Approach and Risk Mitigation .............................................................................20
References .................................................................................................................................... 20 APPENDIX ................................................................................................................................ A-1
Phase 2 Budget ........................................................................................................................ A-1 Phase 2 Schedule .................................................................................................................... A-1

Page | ii
List of Figures Figure 1. Example of pedestrian detection using NDS Automatic Video Processing Tool ......... 5 Figure 2. Example of traffic signal detection using NDS Automatic Video Processing Tool ..... 5 Figure 3. Example of event collection using NDS Data Reduction and Analysis Tool ............... 6 Figure 4. Interactions between drivers and different pedestrian features ..................................... 8 Figure 5. Comparison of compliant behaviors with features between feature group and
control group ..................................................................................................................9 Figure 6. Comparison of average speed before and after implementation of “Turning
Vehicles Yield to Pedestrians” sign .............................................................................10 Figure 7. Comparison of compliant behaviors by gender .......................................................... 10 Figure 8. Comparison of compliant behaviors by age................................................................ 11 Figure 9. Comparison of compliant behaviors with/without pedestrian presence ..................... 12 Figure 10. Comparison of compliant behaviors by gender and age ............................................. 12 Figure 11. Comparison of risk and distraction levels by gender and age .................................... 13 Figure 12. Comparison of compliant behaviors by risk levels ..................................................... 14
List of Tables Table 1. Description of Intention and Compliant Behaviors for Each Pedestrian Feature ............. 2 Table 2. Range of Trip Numbers for Each Pedestrian Feature ....................................................... 4 Table 3. Event Information Collected during Data Reduction ....................................................... 6

Page | 1
Summary Report
Introduction Florida experienced serious pedestrian safety problems and had the highest pedestrian fatality rate in the U.S. from 2008–2011 based on National Highway Traffic Safety Administration (NHTSA) Traffic Safety Facts annual reports. Florida continues to be in the top five states with the highest pedestrian fatality rates. The 2014 edition of Dangerous by Design ranked four metropolitan areas in Florida as the top four most dangerous areas to walk in the U.S.—Metro Orlando, Tampa-St. Petersburg, Jacksonville, and Miami. This is due primarily to the rapid spread of low-density neighborhoods that rely on wider streets with higher speeds to connect homes, offices, shops, and schools—roads that tend to be more dangerous for people walking.
One of Florida’s highest priorities is investigating major contributing causes for pedestrian fatalities and developing effective countermeasures to significantly improve pedestrian safety. The intention of this project was to research and understand the interactions between drivers and pedestrian features (e.g., pedestrian signs, pedestrian signals, traffic signals, crosswalks, and pavement markings) at signalized intersections. Understanding these interactions can help the Florida Department of Transportation (FDOT) develop effective countermeasures to improve pedestrian safety. The Strategic Highway Research Program 2 (SHRP 2) Naturalistic Driving Study (NDS) recorded the driving behavior of a large sample of drivers in their personal vehicles, offering project researchers comprehensive naturalistic driving behavioral data for researching the interactions between drivers and various pedestrian features at selected signalized intersections through which they drove. This provides a unique opportunity to research the proposed research question in this Phase 1 project, “Based on information from the SHRP2 NDS and Road Information Database (RID) datasets, how do drivers interact with pedestrian features at signalized intersections?”
The project team identified four pedestrian features used at signalized intersections that are directly related to pedestrian safety. With the use of these signs and high compliance rates, pedestrian safety can be increased at intersections by reducing conflicts between vehicles and crossing pedestrians. Based on the feature intention, driver behaviors compliant with each feature (compliant behaviors) were identified for each feature. Table 1 shows the selected features, feature intentions, and associated compliant behaviors.
Goals The first major goal of this Phase 1 project was to understand the interaction between drivers and pedestrian features at signalized intersections using the SHRP2 NDS datasets and to obtain initial results and findings. The second major goal was to demonstrate that the research team effectively used the NDS and RID databases to conduct research and analysis, leading to development of effective countermeasures in Phase 2 to improve pedestrian safety at signalized intersections.
Objectives The specific objectives of Phase 1 of this project were to:
1. Acquire knowledge and request data from the SHRP2 NDS and RID datasets to conduct initial analysis of driver interactions with pedestrian features at signalized intersections.

Page | 2
2. Develop effective data extraction and analysis tools and identify specific parameters and factors that will aid in initial analysis in the Phase 1 project and full analysis in the Phase 2 project pertaining to the Phase 1 research question, “Based on information from the SHRP2 NDS and RID datasets, how do drivers interact with pedestrian features at signalized intersections?”
3. Conduct initial analysis using a more manageable dataset of acquired NDS data, provide initial findings on the research question, and offer recommendations that can be implemented by FDOT in a Phase 2 project.
4. Demonstrate the effective and successful use of the SHRP2 NDS datasets via the Phase 1 project to provide recommendations and guidance for a Phase 2 project.
Table 1. Description of Intention and Compliant Behaviors for Each Pedestrian Feature Feature Name Feature Sign Feature Intention Compliant
Behaviors
Stop Here on Red
Used to tell drivers to stop at the stop bar where the sign is installed to ensure everyone’s safety; if vehicles stop at the stop bar and not on the crosswalk, they can avoid hitting pedestrians crossing at the crosswalk.
Stop before stop line on
red
No Turn on Red
Used primarily at intersections with a higher number of conflicts between vehicles making a right turn on a red light and vehicles or pedestrians crossing; especially in Florida, turning right on red is a major cause of pedestrian crashes at intersections.
Stop on red and wait for green signal
Turning Vehicles Yield to
Pedestrians
Informs turning vehicles making a right or left turn at intersections to yield to crossing pedestrians; Applies when the traffic signal is red or green
Yield to pedestrians on green or red
Right on Red Arrow after
Stop +
Photo Enforced
Installed together in Tampa Bay to direct drivers to stop on red before making a right turn; usually coupled with red light cameras for enforcement; Installed where there is a higher number of violations of drivers not making a stop on red before proceeding to make a right
Stop, observe, and turn on
red
Literature Review Understanding the interactions between drivers and pedestrian features is important for developing effective countermeasures to improve pedestrian safety at signalized intersections. Driver interactions with pedestrian features include driver speeds, braking patterns, and yielding and stopping behaviors. Most commonly, drivers who fail to comply with pedestrian-related features near the crosswalks of signalized intersections can increase accident risk for pedestrians.
By using traditional data collection methods, several studies were conducted to evaluate the effectiveness of pedestrian signs. Herman (2000) designed a treatment-and-control study to evaluate the effects of “No Turn on Red/Yield to Pedestrians” variable message signs. A video camera was set up on a sidewalk along a main road to record pedestrian and motorist behavior at selected intersections. The sites with the signs were found to have a lower ratio of motorists who

Page | 3
illegally turned right on right, but there were no significant differences in terms of the number of right-turn-on-green motorists who yielded to pedestrians. Karkee et al. (2006) conducted a “before-and-after” study to test differences in several measures for “Turning Traffic Must Yield to Pedestrians” signs. Data were collected during AM and PM peak hours during each study period, and results showed increases in yielding behavior and both pedestrian and vehicle delay.
A study performed by Pulugurtha et al. (2010) evaluated the effects of traffic signs based on field observations of pedestrian and driver behaviors. Results showed a general improvement in driver yielding behavior due to installation of “Yield to Pedestrian” signs. Similarly, using field observation or fixed video recording methods, Pecheux et al. (2009), and Fitzpatrick et al. (2014) included some general findings for pedestrian features such as “Yield to Pedestrian” signs in their pedestrian safety studies. Although these previous studies attempted to evaluate the effectiveness of traffic signs, the traditional methods failed to collect important safety-related factors such as driver speed profiles, braking patterns, driver characteristics (e.g., gender, age, frequency of risk-taking), vehicle factors, and various roadway/environmental conditions. The SHRP2 NDS datasets and RID databases provide rich and unique information for understanding the interaction between drivers and pedestrian features at signalized intersections to increase pedestrian safety.
Data Used The main datasets used were the RID and NDS datasets. A brief description of the data from both follows.
SHRP2-RID Dataset The RID dataset includes the road characteristics and environment used by participants in the SHRP2 NDS study. The following characteristics were used for this project:
• Lanes – number, width, and type (thru, turn, passing, acceleration, car pool, etc.) • All Manual on Uniform Traffic Control Devices (MUTCD) signs • Intersections – location, number of approaches, control (signalized only) • Median presence – type (depressed, raised, flush, barrier) • AADT (Annual Average Daily Traffic)
The CUTR team obtained the RID and used it to identify the locations and types of pedestrian features for analysis. Based on the location of the features (signs, markings), AADT, and lane configuration, 15 intersections were selected for filtering from the SHRP2 NDS trip data acquired from the Virginia Tech Transportation Institute (VTTI).
SHRP2-NDS Dataset The SHRP2-NDS dataset includes data from participants, vehicles, and trips. The CUTR team specified the number of trips and participant data per intersection to be obtained. In total, 2,700 trip segments were obtained from the NDS dataset, which were divided into short segments passing though the intersections and longer (full) trips of participants that were identified passing through the predefined intersections.
To conduct the analysis, the short trips (n=2,430) were further stratified into required movements based on the intersection geometry and lanes for each feature, since not all approaches of an intersection had the specific feature. The purpose of stratifying the data in this manner was to

Page | 4
maximize the number of useful trips, because specific features apply only to specific movements, i.e., no right turn on red applies only to right turns. The number of trips/participants required for each intersection was equally divided among the 2,430 trips. It was decided that for each feature, three intersections would be used: two intersections with similar characteristics (AADT, lanes, and speed limit) and the feature sign, and one with similar characteristics without the feature sign to serve as the control intersection for comparison. The requested trips and provided trips are shown in Table 2.
Table 2. Range of Trip Numbers for Each Pedestrian Feature
Pedestrian Feature Intersections with
Specified Pedestrian Feature (2 intersections)
Control Intersections (1 intersection)
Total Trips (3 intersections)
“Stop Here on Red” sign Requested Range:
243–297 Provided: 270
Requested Range: 243–297
Provided: 270 486-594
(Ideal: 540)
“No Turn on Red” sign Requested Range:
243–297 Provided: 270
Requested Range: 243–297
Provided: 270
486–594 (Ideal: 540)
“Turning Vehicles Yield to Pedestrians” sign
Requested Range: 243–297
Provided: 270
Requested Range: 243–297
Provided: 270
486–594 (Ideal: 540)
“Right on Red Arrow after Stop” sign & “Photo Enforced” sign
Requested Range: 243–297
Provided: 270
Requested Range: 243–297
Provided: 270
486–594 (Ideal: 540)
One of the primary advantages of the NDS dataset is that researchers can follow the same driver through full trips or multiple trips and determine his/her driving behavior. Without these data, a participant’s traversal from an intersection does not offer much in consistency or motivation. Therefore, in addition to the 2,430 segments of trips of participants passing through (or turning) at the specified intersections, a sample of full trips also was requested.
Using the trips/participants selected from the previous session, full trips were provided for 54 participants for a total of 270 trips using the following criteria:
• Trip Type – trips on surface roads only (no portion on freeways or expressways) • Trip Duration – trips between 15–30 minutes, excluding deleted time for origin and
destination identification • Minimum Requirement for Trip – each trip should pass through at least one intersection
with the specified pedestrian feature and associated movement • Preferred Trips – each trip passes through at least two different intersections with two
different specified pedestrian features and associated movements
Age and gender were requested to get a better representation of all ages. An equal breakdown between age groups and gender was requested for 54 drivers. In addition to the forward videos, time series data including acceleration, speed, braking, gas pedal position, steering, and GPS coordinates were requested. Also, information on age, gender, driving behavior, risk perception and risk taking, and medical condition and medications was obtained.

Page | 5
Method of Analysis Quantitative data analysis was used for this research to provide quantifiable and easy-to-understand results. The method of data analysis included the following major steps:
• Tool development • Data reduction • Statistical analysis
Tool Development and Data Reduction NDS data comprise a large-scale dataset containing video data and sensor data, so processing can be time-consuming. To improve the data processing efficiency, two software tools were developed to assist researchers in data reduction in an automatic and/or semi-automatic manner.
NDS Automatic Video Processing Tool The NDS Automatic Video Processing Tool (AVPT) was designed primarily to (1) automatically detect and track pedestrians (Figure 1) and (2) automatically detect traffic signal indications in NDS videos (Figure 2). Pedestrian detection was based on the Neural Network classifier. A sliding window-based algorithm was used to resolve the major challenge in the NDS video processing—movement of both the camera and pedestrians.
Figure 1. Example of pedestrian detection using NDS Automatic Video Processing Tool
Figure 2. Example of traffic signal detection using NDS Automatic Video Processing Tool
NUMBER OF PEDESTRIANS DETECTED = 2 NUMBER OF PEDESTRIANS DETECTED = 1
THE RIGHTMOST SIGNAL IS RED THE RIGHTMOST SIGNAL IS GREEN

Page | 6
Traffic signal detection was achieved by recognizing any circle-shaped co-linear objects in red or green (based on color intensities) at a certain height in the video frame. This function can be used to collect the status of traffic signal indications (red, yellow, green) for a given movement (left turn, thru, or right turn) at an intersection. The AVPT can help researchers to:
• Detect pedestrian presence, pedestrian counts, and pedestrian location relative to drivers • Identify screen time from video (for linking to other events) • Automatically filter videos with pedestrian presence • Automatically classify videos with different traffic signal indications
NDS Data Reduction and Analysis Tool The NDS Data Reduction and Analysis Tool (DRAT) was developed to assist researchers in reviewing and analyzing NDS videos and sensor data. The major functions of the tool are:
• Identifying pre-defined events when researchers review NDS videos • Detecting driver behaviors (stopping, sudden braking, etc.) by scanning NDS sensor data • Linking collected data from different sources (videos, sensors, questionnaires, RID) • Converting raw data to final data format for analysis
A screenshot of the DRAT is shown in Figure 3.
Figure 3. Example of event collection using NDS Data Reduction and Analysis Tool
In Phase 1, this tool was used to provide samples of pedestrian and signal scenarios for training and testing the NDS AVPT and to collect information on other than pedestrian and traffic signals, such as driver behaviors, roadway/weather conditions, and travel lanes.
Researchers used the two tools they developed in Phase 1 to collect useful information from the original NDS videos, sensor data, and supplemental data. The collected data (events) included intersection features, driver behaviors and causes, status of traffic signal indications, and pedestrian and driver characteristics, as shown in Table 3. The collected data were imported into a project database and converted to the final format based on analysis requirements.
Table 3. Event Information Collected during Data Reduction
Category Event
Intersection Features
Lane configuration Pedestrian feature type and location Weather condition Lighting condition

Page | 7
Category Event
Driver Behaviors Behaviors approaching feature sign and causes Behaviors near stop line and causes Behaviors near crosswalk on leaving leg and causes
Pedestrian Presence Relative location and counts, if present
Traffic Signal Signal indication status Time of signal change
Driver Characteristics Age Gender Risk and distraction (based on questionnaires)
Statistical Analysis The cross-sectional analysis was used in this study to assess the safety effectiveness of the selected pedestrian feature. In this analysis, the observed compliant driver behaviors (as shown in Table 1) were categorized into two groups: feature group (with the pedestrian feature) and control group (without the pedestrian feature). A series of comparisons of the compliant behaviors were conducted between each feature group and its control group. The higher the proportion of compliant behaviors observed, the better the safety performance is. Chi-Square tests were used to determine whether the proportion of compliant driver behaviors at feature sites (PFE) was significantly different from that at control sites (PCE).
H0: PFE = PCE (proportion of compliant driver behaviors at feature sites is the same as that at control sites)
Ha: PFE ≠ PCE (proportion of compliant driver behaviors at feature sites is different from that at control sites)
The proportion comparisons also were conducted between different driver characteristics (gender, age, and risk groups) for each pedestrian feature. In addition, the difference in compliant behaviors by different driver characteristics and pedestrian presence were compared based on the overall data. All hypothesis tests were conducted at a minimum confidence level of 90%.
Research Results The data analysis in Phase 1 helps to answer the major Phase 1 research question, “Based on information from the SHRP2 NDS and RID datasets, how do drivers interact with pedestrian features at signalized intersections?”
Statistical analysis results are presented for each of the four pedestrian features separately. For each feature, the following information is presented:
• Interactions between drivers and pedestrian features • Comparison of compliant behaviors with features between feature and control sites • Comparison of average speed before and after implementation of feature (for “Turning
Vehicles Yield to Pedestrians” sign only) • Comparison of compliant behaviors at feature sites by driver gender and age group
In addition, overall comparisons (including all features) were conducted to explore:
• Impact of pedestrian presence on driver-feature interactions
Page | 8
• Effects of driver demographics (gender, age) on driver-feature interactions • Impact of driver characteristics (risk, distraction) on compliant behaviors
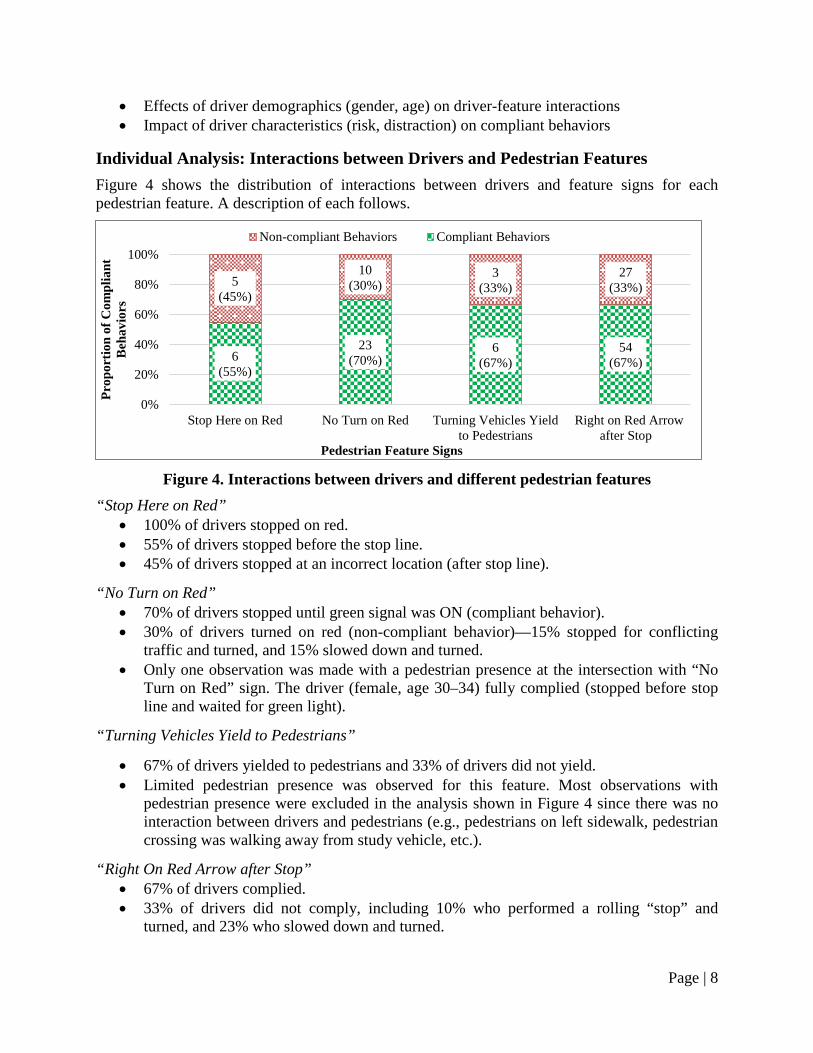
Individual Analysis: Interactions between Drivers and Pedestrian Features Figure 4 shows the distribution of interactions between drivers and feature signs for each pedestrian feature. A description of each follows.
Figure 4. Interactions between drivers and different pedestrian features
“Stop Here on Red” • 100% of drivers stopped on red. • 55% of drivers stopped before the stop line. • 45% of drivers stopped at an incorrect location (after stop line).
“No Turn on Red” • 70% of drivers stopped until green signal was ON (compliant behavior). • 30% of drivers turned on red (non-compliant behavior)—15% stopped for conflicting
traffic and turned, and 15% slowed down and turned. • Only one observation was made with a pedestrian presence at the intersection with “No
Turn on Red” sign. The driver (female, age 30–34) fully complied (stopped before stop line and waited for green light).
“Turning Vehicles Yield to Pedestrians”
• 67% of drivers yielded to pedestrians and 33% of drivers did not yield. • Limited pedestrian presence was observed for this feature. Most observations with
pedestrian presence were excluded in the analysis shown in Figure 4 since there was no interaction between drivers and pedestrians (e.g., pedestrians on left sidewalk, pedestrian crossing was walking away from study vehicle, etc.).
“Right On Red Arrow after Stop” • 67% of drivers complied. • 33% of drivers did not comply, including 10% who performed a rolling “stop” and
turned, and 23% who slowed down and turned.
6 (55%)
23 (70%)
6 (67%)
54 (67%)
5 (45%)
10 (30%)
3 (33%)
27 (33%)
0%
20%
40%
60%
80%
100%
Stop Here on Red No Turn on Red Turning Vehicles Yieldto Pedestrians
Right on Red Arrowafter Stop
Prop
ortio
n of
Com
plia
nt
Beh
avio
rs
Pedestrian Feature Signs
Non-compliant Behaviors Compliant Behaviors

Page | 9
• Observations of stopping behaviors caused by external factors such as conflicting traffic were removed from the analysis shown in Figure 4.
Individual Analysis: Comparison between Feature Group and Control Group Figure 5 shows the results of comparison of driver compliant behaviors with features between each feature and its associated control group.
• Three pedestrian features (“Stop Here on Red,” “No Turn on Red,” and “Right on Red Arrow after Stop”) increased the compliant behaviors to the feature intention when compared to control groups. The difference for “Right on Red Arrow after Stop” sign was significant at a confidence level of 95%.
• The feature of “No Turn on Red” showed the highest increase in compliant behavior (64% = 70% - 6%), followed by “Right on Red Arrow after Stop” (36% = 67% - 31%) and “Stop Here on Red” (33% = 55% - 22%).
• The “Turning Vehicles Yield to Pedestrians” sign showed the same percentage of yielding behavior as that of the control group, but the observations of pedestrian presence at feature or control sites were very limited.
Figure 5. Comparison of compliant behaviors with features
between feature group and control group
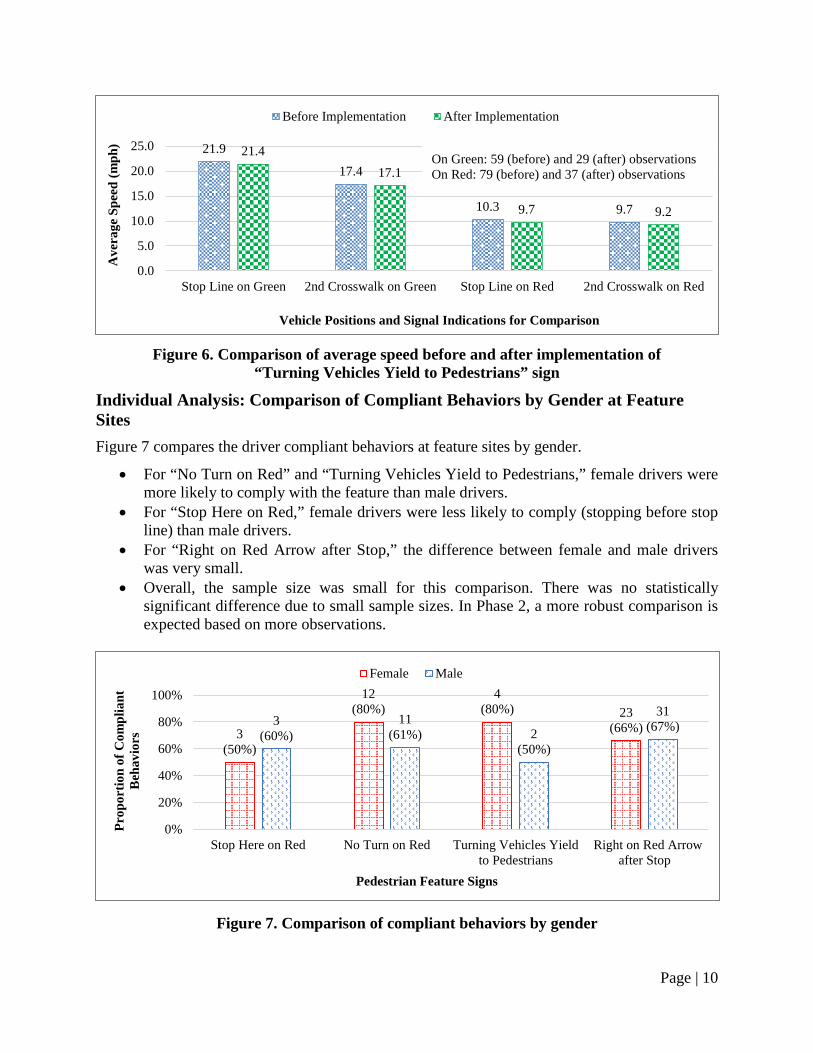
Individual Analysis: Comparison of Speed before and after Implementation
Figure 6 shows the results of comparison of average speed before and after installing “Turning Vehicles Yield to Pedestrians” sign at the same site.
• The average speeds of right-turning vehicles at both the stop line and the second crosswalk were used to evaluate the impact of the feature on driver behaviors before and after the implementation of the feature sign. A lower speed indicates a safer environment for pedestrians.
• Compared to the “before implementation” group, the “Turning Vehicles Yield to Pedestrians” sign reduced the average speed at both the stop line and the second crosswalk slightly on both green and red signal indications.
• In Phase 2, a more robust comparison is expected based on more observations.
2 (22%) 4
(6%)
4 (67%)
29 (31%)
6 (55%)
23 (70%)
6 (67%)
54 (67%)
0%
20%
40%
60%
80%
100%
Stop Here on Red No Turn on Red Turning VehiclesYield to Pedestrians
Right on Red Arrowafter Stop*
Prop
ortio
n of
Com
plia
nt
Beh
avio
rs
Pedestrian Feature Signs
Control Group Feature Group
*Statistically significant at a confidence level of 95%
Page | 10
Figure 6. Comparison of average speed before and after implementation of
“Turning Vehicles Yield to Pedestrians” sign
Individual Analysis: Comparison of Compliant Behaviors by Gender at Feature Sites Figure 7 compares the driver compliant behaviors at feature sites by gender.
• For “No Turn on Red” and “Turning Vehicles Yield to Pedestrians,” female drivers were more likely to comply with the feature than male drivers.
• For “Stop Here on Red,” female drivers were less likely to comply (stopping before stop line) than male drivers.
• For “Right on Red Arrow after Stop,” the difference between female and male drivers was very small.
• Overall, the sample size was small for this comparison. There was no statistically significant difference due to small sample sizes. In Phase 2, a more robust comparison is expected based on more observations.
Figure 7. Comparison of compliant behaviors by gender
21.9
17.4
10.3 9.7
21.4 17.1
9.7 9.2
0.0
5.0
10.0
15.0
20.0
25.0
Stop Line on Green 2nd Crosswalk on Green Stop Line on Red 2nd Crosswalk on Red
Ave
rage
Spe
ed (m
ph)
Vehicle Positions and Signal Indications for Comparison
Before Implementation After Implementation
On Green: 59 (before) and 29 (after) observations On Red: 79 (before) and 37 (after) observations
3 (50%)
12 (80%)
4 (80%) 23
(66%) 3 (60%)
11 (61%) 2
(50%)
31 (67%)
0%
20%
40%
60%
80%
100%
Stop Here on Red No Turn on Red Turning Vehicles Yieldto Pedestrians
Right on Red Arrowafter Stop
Prop
ortio
n of
Com
plia
nt
Beh
avio
rs
Pedestrian Feature Signs
Female Male

Page | 11
Individual Analysis: Comparison of Compliant Behaviors by Age at Feature Sites Figure 8 compares the driver compliant behaviors at feature sites by age.
• At sites with “No Turn on Red” and “Turning Vehicles Yield to Pedestrians” signs, older drivers (60+) were more likely to comply with the feature (100%).
• At sites with “Right on Red Arrow after Stop,” mid-aged drivers (25-59) showed the highest proportion of compliance (94%), followed by older drivers (63%) and younger drivers (60%).
• Only the comparison for “Right on Red Arrow after Stop” is statistically significant.
Figure 8. Comparison of compliant behaviors by age
Overall Analysis: Impacts of Pedestrian Presence Figure 9 shows the overall comparison of the compliant behaviors with/without pedestrians between feature and control groups.
• Drivers showed much higher compliance at the feature sites than that at the control sites (67% vs. 29%) when pedestrians were not present at intersections. The difference was statistically significant. This finding is very important, indicating that drivers will most likely comply with pedestrian features at feature sites even though there are no pedestrians present or drivers do not see them.
• Drivers were generally sensitive to pedestrian presence at both feature sites and control sites. The compliance percentages for both groups were higher when pedestrians were present than those when pedestrians were absent.
• Drivers were more likely to comply with the feature at feature sites when pedestrians were present than that at control sites (77% vs. 50%). However, there was no evidence to show the difference was statistically significant due to a small sample size.
• A small number of pedestrian observations reduced the confidence of the statistical analysis. More pedestrian observations are required to make a robust comparison.
5 (63%)
10 (59%)
5 (71%) 34
(60%)
1 (100%)
8 (73%)
0/1 (0%)
15 (94%)
0/2 (0%)
5 (100%)
1 (100%)
5 (63%)
0%
20%
40%
60%
80%
100%
Stop Here on Red No Turn on Red Turning Vehicles Yieldto Pedestrians
Right on Red Arrowafter Stop*
Prop
ortio
n of
Com
plia
nt
Beh
avio
rs
Pedestrian Feature Signs
16-24 25-59 60+
*Statistically significant at a confidence level of 95%

Page | 12
Figure 9. Comparison of compliant behaviors with/without pedestrian presence
Overall Analysis: Impacts of Driver Demographics at Feature Sites Figure 10 shows the overall comparison of the driver compliant behaviors by gender and age.
• Female showed a slightly higher percentage of compliance than male drivers at feature sites (69% vs. 64%).
• Mid-aged drivers (25–59) showed the highest percentage of compliance at feature sites (83%), followed by older drivers (60+, 69%) and younger drivers (16–24, 61%). The differences were statistically significant at a confidence level of 90%.
• A possible explanation is that younger drivers take more risks and older driver detection/control abilities are reduced. Safety countermeasures at intersections should consider the specific needs for younger and older drivers.
Figure 10. Comparison of compliant behaviors by gender and age
Overall Analysis: Impacts of Driver Characteristics on Compliant Behaviors The NDS Dataset includes data from questionnaires of participants taken during intake in the Driving Study. These were general questions about their driving habits. Two questionnaires were used to determine risky behavior: the “Risk-Taking” and the “Driver Behavior” questionnaires.
27 (29%)
7 (50%)
69 (67%)
20 (77%)
0%
20%
40%
60%
80%
100%
Without Pedestrians* With Pedestrians
Prop
ortio
n of
Com
plia
nt
Beh
avio
rs
Control Group Feature Group
*Statistically significant at a confidence level of 95%
42 (69%) 47
(64%) 54
(61%)
24 (83%) 11
(69%)
0%
20%
40%
60%
80%
100%
Female Male 16 - 24 25 - 59 60 +
Gender Age*
Prop
ortio
n of
Com
plia
nt
Beh
avio
rs
*Statistically significant at a confidence level of 90%

Page | 13
Ten questions were considered to determine the level of risk-taking, e.g., “Do you run red lights, fail to yield, make illegal turns, etc.?” and driver attention, e.g., “Do you conduct secondary tasks while driving?” “Do you adjust the CD player or pick up things?” “Do you take your eyes off the road to talk to your passenger?” Based on the replies to those questions, drivers were clustered into two groups according to a perceived risk level and distraction level. Chi-square tests were conducted to compare the percentage of drivers belonging to a group (based on self-evaluation) by driver characteristics, as shown in Figure 11.
• By self-evaluation, more female drivers were clustered in the groups of “more risky” and “more distracted” than male drivers. The difference was significant in terms of distraction.
• By self-evaluation, younger drivers (16–24) took significantly more risks than age groups 25-59 and 60+ drivers; younger drivers (16–24) and mid-aged drivers (25–59) were significantly more likely to be distracted than older drivers (60+).
• By self-evaluation, older drivers (60+) took significantly fewer risks and were less likely to be distracted than other drivers.
Figure 11. Comparison of risk and distraction levels by gender and age
To link the subjective risk to objective behavior observations, the compliance behaviors were compared by risk levels for “No Turn on Red” and “Right on Red Arrow after Stop” signs. Due to limited sample size, the other feature signs were not compared. As shown in Figure 12, drivers in the “less risky” group were more likely to comply with the “No Turn on Red” sign than drivers in the “more risky” group. A larger sample size is expected to draw confident conclusions.
To investigate the consistency of compliant driver behaviors by gender and age groups, some initial observations from the Phase 1 project are provided below.
• Female drivers tended to be more consistent to comply with the feature than male drivers. • Mid-aged drivers tended to be more consistent to comply with the feature than others. • Due to a small sample in Phase 1, it is difficult to reach a confident conclusion on driver
compliance consistency with the feature. A larger sample is expected to obtain greater insights into compliance patterns by driver characteristics and intersection features.
91 (45%)
102 (49%) 80
(39%) 71 (34%)
0%
20%
40%
60%
80%
100%
Risk Group Distraction Group*Perc
enta
ge o
f Dri
vers
in a
Gro
up
Female Male
122 (53%) 112
(48%) 41 (39%)
51 (47%)
7 (10%)
10 (14%)
0%
20%
40%
60%
80%
100%
Risk Group* Distraction Group*Perc
enta
ge o
f Dri
vers
in a
Gro
up
16-24 24-59 60+
*Statistically significant at a confidence level of 95% *Statistically significant at a confidence level of 95%

Page | 14
The understanding of consistency of compliant driver behaviors by gender and age groups can help identify demographics to focus educational outreach and law enforcement.
Figure 12. Comparison of compliant behaviors by risk levels
Summary of Findings • The proportion of compliant driver behaviors, which is defined based on a specific
feature intention, is an effective measure of the interactions between drivers and pedestrian features. The “No Turn on Red” sign has the highest rate of compliance (70%), followed by “Right on Red Arrow after Stop” (67%), “Turning Vehicles Yield to Pedestrians” (67%), and “Stop Here on Red” (55%).
• Three features (“Stop Here on Red,” “No Turn on Red,” and “Right on Red Arrow after Stop”) increased the likelihood of compliant behaviors compared to control groups.
• Drivers had a much higher compliance percentage at the feature sites than at the control sites (67% vs. 29%) when pedestrians were not present at intersections. The difference was statistically significant.
• Drivers were generally sensitive to pedestrian presence at both the feature sites and the control sites. Their compliance percentages for both groups were higher when pedestrians were present than those when pedestrians were absent.
• Drivers were more likely to comply with the feature at feature sites when pedestrians were present than at control sites (77% vs. 50%). However, there was no evidence to show the difference was statistically significant due to a small sample size.
• Based on self-evaluation, female drivers were significantly more likely to believe they are easily distracted when driving compared to male drivers. Older drivers (60+) believe they take significantly fewer risks and are less distracted than other drivers.
• Female drivers tended to comply more consistently with the feature than male drivers. • Mid-aged drivers tended to comply more consistently with the feature than others.
Summary of Lessons Learned • The assessment of the pedestrian feature signs, especially “Turning Vehicles Yield to
Pedestrians,” needs more pedestrian observations.
6 (55%)
28 (67%)
17 (77%) 26
(67%)
0%
20%
40%
60%
80%
100%
No Turn on Red Right on Red Arrow after Stop
Prop
ortio
n of
Com
plia
nt
Beh
avio
rs
Pedestrian Feature Signs
More Risky Less Risky

Page | 15
• The limited sample sizes may result in insignificant comparisons of compliant behaviors by driver characteristics (e.g., age, gender, risk and distraction levels). A larger sample size is expected to draw confident conclusions, and obtain insight into compliance patterns by driver characteristics and intersection features.
• During Phase 1, 2,700 videos were requested and provided by VTTI, but 16% were not usable for several reasons. VTTI should check closely and ensure the quality of the video data before sending them out to researchers. The research team should find a way to quickly check the video data received from VTTI to make sure all the video data are usable for the study. In this way, if there is any issue on the video data, the research team can contact VTTI to resolve the problem in the early stage of the study.
• In Phase 1 project the research team demonstrated the capabilities and methodologies to effectively use the SHRP 2 NDS and RID databases to study interactions between drivers and pedestrian features at signalized intersection. With larger datasets in Phase 2, the research team can obtain the needed sample size and apply the proven approach in Phase 1 to conduct the research and obtain robust conclusions, which can result in effective countermeasure development to improve pedestrian and bicycle safety at signalized intersections.
Future Directions The ultimate goal of this research project was to use the SHRP2 NDS and RID datasets to better understand the interaction between drivers and pedestrian features at signalized intersections, and to develop effective countermeasures to significantly increase pedestrian safety. Through the Phase 1 project, researchers obtained initial research results and a preliminary understanding of interactions between drivers and pedestrian features at signalized intersections and built an NDS Automatic Video Processing Tool and a Data Reduction and Analysis Tool for managing and analyzing large NDS datasets. The research team also demonstrated the capability to effectively work with the NDS and RID databases. The Phase 1 project has built a solid foundation for Phase 2 towards achieving the final goal of this research project.
The initial research results and preliminary findings in Phase 1 offer valuable insight into the effectiveness of specific pedestrian features and the effect of driver characteristics on their compliance with individual pedestrian features. A small sample size was used in Phase 1 to examine selected pedestrian features at signalized intersections, calibrate proposed methodologies for data analyses, and test the Automatic Video Processing Tool and the Data Reduction and Analysis Tool. A larger sample size is needed in Phase 2 for researchers to conduct detailed qualitative and quantitative analyses to obtain a full understanding on the effectiveness of selected pedestrian features at signalized intersections and the effect of driver characteristics on their compliance with individual pedestrian features.
Based on the success and lessons learned from Phase 1, the research team will modify and enhance the research plan, NDS data request, analysis methodologies, and research tools developed in Phase 1 to successfully complete the research project in Phase 2 on (1) interactions between drivers and pedestrian features at signalized intersections and (2) driver characteristics, behaviors, and performance with respect to studied pedestrian features. Based on the Phase 1 experience, the potential outcomes of the research in Phase 2 include the following:

Page | 16
1. Full understanding and detailed findings of the effectiveness of selected pedestrian features at signalized intersections with and without the presence of pedestrians.
2. Full understanding and detailed findings of driver behaviors and their compliance with studied pedestrian features at signalized intersection with respect to age, gender, and driving attitudes.
3. Development of countermeasures for implementation to effectively improve pedestrian and bicycle safety at signalized intersections based on the effectiveness of studied pedestrian features and driver characteristics.
4. Development of robust research tools to extract and analyze NDS data and recorded videos at signalized intersections to detect the presence of pedestrians, identify traffic signal indications, and organize NDS data for detailed analysis.
At present, FDOT and local traffic agencies do not have a clear understanding of the effectiveness of pedestrian features at signalized intersections, with and without the presence of pedestrians. They also do not know the population and demographics on which to focus for educational outreach and law enforcement that will result in significant improvement of their compliance with pedestrian features at signalized intersections. If the research continues into Phase 2, it likely will result in important outcomes and findings that will lead to the future development of implementable countermeasures or changes in policy/practice, including engineering, education, and enforcement approaches that could lead to crash reductions, resulting in major safety improvements for pedestrians at signalized intersections in Florida. The research results on driving behaviors at signalized intersections also will result in new insights concerning crash causal mechanisms. The potential implementation of countermeasures in engineering, education, and enforcement based on the outcomes and findings from the proposed Phase 2 (described in the next section) can result in substantial benefits to pedestrian safety, as described below.
From the engineering perspective, the pedestrian features at signalized intersections with high effectiveness (high compliance from drivers) could be integrated into FDOT and local traffic agency policy/practice and be widely implemented to improve pedestrian safety at little additional expense. For pedestrian features with low compliance, FDOT and local traffic agencies should reexamine their policy/practice for implementation or significantly reduce the number of such pedestrian features at signalized intersections.
From the education perspective, the understanding of driver behaviors and their non-compliance with specific pedestrian features with respect to age, gender, and driving attitudes can help FDOT and local traffic agencies develop educational outreach/campaigns to focus on specific demographics of drivers to improve their compliance.
From the law enforcement perspective, FDOT can coordinate with law enforcement agencies in Florida via existing high-visibility contracts for enforcing the pedestrian and bicycle laws for the important pedestrian features at signalized intersections with low compliance.
A combined engineering, education, and enforcement approach could produce many more benefits in reducing traffic-related fatalities, injuries, and crashes than implementation of any individual approach. Therefore, if the research were to continue into Phase 2, it likely will result in an implementable safety improvement that can be effectively put into practice.
The future direction of the proposed research in Phase 2 will build on the foundation of Phase 1 to finalize the research and produce tangible outcomes and detailed findings, which will lead to

Page | 17
the development of implementable countermeasures. The proposed Phase 2 research will continue to align with the AASHTO Safety Task Force’s focus areas: (1) driver speed, (2) roadway features and driver performance, (3) preceding contributory events, (4) vulnerable road users, and (5) intersections.
Phase 2 Proposal The research team proposes to proceed in Phase 2 based on the foundation built in Phase 1 to finalize the research project and answer the research question in detail: “How do drivers interact with pedestrian features at signalized intersections when pedestrians are or are not present?” The pedestrian features for this research project include (1) “Stop Here on Red” sign, (2) “No Turn on Red” sign, (3) “Turning Vehicles Yield to Pedestrians” sign, (4) “Right on Red Arrow after Stop” and “Photo Enforced” sign, and (5) “Permitted Left Turn Signal.” Driver interactions with pedestrian features include driver speeds, braking patterns, yielding behaviors, and attention and/or distraction. The Phase 1 project successfully demonstrated the success of proof-of-concept to development of countermeasures. The Phase 2 project will complete the research and develop effective and implementable countermeasures, which can lead to significant improvement of pedestrian safety at signalized intersections.
Research Objectives The major objectives of the Phase 2 project are to (1) fully investigate and better understand the interactions between drivers and pedestrian features at signalized intersections, (2) produce tangible outcomes and detailed findings, and (3) recommend implementable countermeasures in engineering, education, and enforcement regarding pedestrian features at signalized intersections to improve pedestrian safety in Florida and in other states with similar problems.
Data Needs The data needed to conduct the Phase 2 project are essentially the same as in Phase 1. The major difference is the amount of data needed for a large sample for statistical analyses on the effectiveness of pedestrian features and comprehensive analyses on the impact of driver characteristics and behaviors on their compliance with pedestrian features. A large sample size with pedestrian presence is also needed. This was an issue with Phase 1 data – pedestrian presence was found in only 7.5% of the requested short videos. In addition, not all pedestrian presence warrants attention from a driver; only pedestrians close to a crosswalk or actively crossing are of concern. This area can be a larger focus in Phase 2 so that a detailed analysis can be performed and comprehensive results obtained. Besides the presence of pedestrians, a larger number of videos can provide a larger sample of drivers arriving at an intersection when the signal is red instead of green, since the studied features apply primarily to the red signal indication. Because the traffic signal indication is not available in the NDS dataset, videos of only red signal activity cannot be requested. With the use of the video detection tool developed by the research team, more videos can be scanned to flag the change of signal, thereby providing a sample that is certain to show red signal indications when drivers arrive at an intersection. The research team may acquire data as needed from another site to supplement Tampa data.
During Phase 1, 2,700 videos were requested and provided by VTTI, but 16% were not usable for several reasons: the video was obstructed by an object on the vehicle’s windshield, the video resolution was so low that features could not be determined, the video was blurred (out of focus), there was no video (file was blank), and the video segment provided started in the wrong place

Page | 18
since the main interest was when a driver was passing through an intersection. With a larger sample size and adequate funding, the researchers can scrap these videos and request more to account for this occurrence. This could not be accomplished in Phase 1 due to limited funds and time.
In Phase 2, the number of video segments for each feature site will be doubled by either adding more intersections or requesting more traversals per intersection. This will ensure adequate data for analysis. Also, the number of full trips will be doubled to allow for more information per participant to observe driving behaviors at multiple intersections. This number also will account for the unusable videos and videos of green time through an intersection (red time is preferred).
Personally Identifiable Information (PII) data will not be used in Phase 2.
Research Approach/Methods The research approach and methods in Phase 2 are similar to those in Phase 1 with some modification and enhancement. To achieve the research objectives of Phase 2, the following supporting tasks are proposed.
Task 1: Establishment of Data Parameters for NDS Data Request (Months 1–2) This task will define the pedestrian features at signalized intersections for research including those in Phase 1, determine additional NDS datasets needed for Phase 2, and identify specific parameters to be used by VTTI to filter and produce the requested datasets for the data analysis. This task will ensure that sufficient NDS datasets are requested for conducting research on each selected pedestrian feature, the effect of the presence of pedestrians at signalized intersections, and the impact of driver characteristics and demographics on compliance with the intention of the pedestrian features.
Task 2: IRB Approval, Data Sharing Agreement, and Data Acquisition from VTTI (Months 2–4) This task includes submitting the necessary protocol for data analysis to the Institutional Review Board (IRB) at the University of South Florida (USF) for review and approval. The task also consists of coordinating with VTTI (SHRP2-NDS dataset) to produce the Data Sharing Agreements (DSA) between USF and VTTI based on data request produced in Task 1. The CUTR research team at USF will work closely with VTTI to obtain the requested datasets.
Task 3: Enhancement of Data Extraction and Data Analysis Tools (Months 5–7) This task will further enhance the capabilities and accuracy of the data extraction and data analysis tools developed in Phase 1 to detect videos with the presence of pedestrians and traffic signal indications at signalized intersections. After completion of the Phase 2 project, these tools will be available for other researchers to conduct their research projects.
Task 4: Data Compilation and Data Analysis (Months 5–12) This task will validate, compile, and analyze the data extracted and processed from the requested NDS databases from VTTI for each selected pedestrian feature at signalized intersections similar to that in Phase 1. The research team will use the data extraction and data analysis tools developed in Phase 1 and enhanced in Phase 2 to speed up the data reduction and data compilation processes from large datasets obtained for Phase 2 for detailed analyses. Quantitative methods including statistical analysis will be applied to compare the effect of

Page | 20
Round 4 Phase 1 project, we are confident that the proposed research team will successfully complete the proposed Phase 2 project.
Project Management and Project Team The proposed research team includes project manager Mr. Darryll Dockstader of the FDOT Research Center and project panel members Mr. Joe Santos of the FDOT Safety Office and Mr. Stephen Benson and Mr. Matthew Weaver of FDOT District 7, who have extensive experience in pedestrian safety. The Principal Investigator (PI) is Dr. Pei-Sung Lin with CUTR at the University of South Florida, who will coordinate and share information with FDOT at all stages of the project. The CUTR team includes Dr. Pei-Sung Lin (PI), Dr. Achilleas Kourtellis (Co-PI), Dr. Zhenyu Wang (Co-PI), Professor Rangachar Kasturi (Researcher), Dr. Rui Guo (Postdoc Researcher), and three graduate research assistants.
Management Approach and Risk Mitigation Project manager Mr. Darryll Dockstader, project PI Dr. Pei-Sung Lin, and project Co-PI Dr. Achilleas Kourtellis are very communicative and responsive to all inquiries, as evidenced by their interactions with FHWA project manager Ms. Ann Do, and their responses to Prof. Paul Jovanis for two IAP assessment interviews during Phase 1. To ensure the completion of each task of the Phase 2 project in a timely manner, project milestones and a timeline are provided in the Appendix. No PII data or facial video data will be used for Phase II. All project data, IRB related items, data sharing agreements, data analysis files, and project reports are saved on secured servers at CUTR/USF. CUTR is a secure research facility with controlled access to its entrances. CUTR backs up daily to secure servers all data and files saved in its network drives.
References 1) Fitzpatrick, K., Iragavarapu, V., et al. (2014). “Characteristics of Texas Pedestrian Crashes
and Evaluation of Driver Yielding at Pedestrian Treatments” (No. FHWA/TX-13/0-6702-1). TxDOT Report FHWA/TX-13/0-6702-1.
2) Herman, H. (2000). “The Effects of No Turn on Red/Yield to PEDS: Variable Message Signs on Motorist and Pedestrian Behavior.” University of North Carolina at Chapel Hill, Florida Department of Transportation, 15-20.
3) Karkee, G., Pulugurtha, S. S., & Nambisan, S. S. (2006). “Evaluating the Effectiveness of ‘Turning Traffic Must Yield to Pedestrians (R 10-15)’ Sign.” Applications of Advanced Technology in Transportation, 400-405, ASCE.
4) Pecheux, K., Bauer, J., & McLeod, P. (2009). “Pedestrian Safety Engineering and ITS-Based Countermeasures Program for Reducing Pedestrian Fatalities, Injury Conflicts, and Other Surrogate Measures Final System Impact Report.” Federal Highway Administration, Washington, DC.
5) Pulugurtha, S. S., Nambisan, S. S., et al. (2010). “Evaluation of Effectiveness of Traffic Signs to Enhance Pedestrian Safety.” Transportation Research Board 89th Annual Meeting (No. 10-1016).