understanding gartner's hype cycles, 2011 hype … · gartner's hype cycle, introduced in...
TRANSCRIPT

G00214001
Understanding Gartner's Hype Cycles, 2011Published: 19 July 2011
Analyst(s): Jackie Fenn, Mark Raskino
Hype Cycles help technology planners to decide when to invest in atechnology. If a company launches its efforts too soon, it may sufferunnecessarily through the painful and expensive lessons associated withdeploying an immature technology. If it delays action for too long, it runs theeven-greater risk of being left behind by competitors that have succeeded inmaking the technology work to their advantage.
Key FindingsHype Cycles:
■ Establish the expectation that most technologies will inevitably progress through the pattern ofoverenthusiasm and disillusionment.
■ Provide a snapshot of the relative maturity of technologies within a certain segment, such as atechnology area, horizontal or vertical business market, or a certain demographic audience.
■ Show the speed at which each technology is progressing through the Hype Cycle by indicatinghow long it will take to reach the Plateau of Productivity and the start of mainstream adoption.
Recommendations■ Do not invest in a technology just because it is being hyped, nor ignore a technology just
because it is not living up to early overexpectations.
■ Be selectively aggressive and move early with technologies that are potentially beneficial toyour business. For technologies that are of lower impact, let others learn the hard lessons,putting off your adoption until the technology is more mature.
■ Use the Priority Matrix that accompanies each Hype Cycle to evaluate the potential benefit ofeach technology and determine investment priorities.
Table of Contents

Analysis..................................................................................................................................................3
What Is the Hype Cycle?..................................................................................................................3
Positioning a Technology on the Hype Cycle....................................................................................6
On the Rise................................................................................................................................7
At the Peak.................................................................................................................................8
Sliding Into the Trough................................................................................................................9
Climbing the Slope...................................................................................................................10
Entering the Plateau.................................................................................................................10
Why the Hype Cycle Matters..........................................................................................................11
How to Use the Hype Cycle............................................................................................................15
Hype Cycle Speed: The "Years to Mainstream Adoption" Assessment.....................................18
The Priority Matrix and Benefit Ratings......................................................................................18
Market Penetration and Maturity Assessments.........................................................................20
Hype Cycle Q&A.............................................................................................................................23
Advanced Hype Cycle Topics.........................................................................................................27
Behind the Hype Cycle.............................................................................................................27
Hype Cycle Speed....................................................................................................................29
Special Hype Cycle Circumstances..........................................................................................31
Recommended Reading.......................................................................................................................32
List of Tables
Table 1. Maturity Levels........................................................................................................................21
Table 2. Typical Correspondence Between Hype Cycle Technology Fields...........................................23
List of Figures
Figure 1. The Hype Cycle.......................................................................................................................4
Figure 2. Phases of the Hype Cycle........................................................................................................7
Figure 3. Hype Cycle Traps..................................................................................................................13
Figure 4. Hype Cycle Opportunities......................................................................................................14
Figure 5. Adoption Patterns by Type A, Type B and Type C Organizations...........................................16
Figure 6. Key Hype Cycle Questions.....................................................................................................17
Figure 7. Priority Matrix.........................................................................................................................19
Figure 8. Components of the Hype Cycle.............................................................................................27
Figure 9. Double "Peak" of Hype Triggered by Meaningful Improvements and Adoption.......................28
Page 2 of 33 Gartner, Inc. | G00214001

Figure 10. "Horse Tail" Effect of Industry-Specific Hype Cycles.............................................................29
Figure 11. Fast-Track Hype Cycle.........................................................................................................30
Figure 12. Long-Fuse Hype Cycle........................................................................................................31
Analysis
What Is the Hype Cycle?
The Hype Cycle is a graphical depiction of a common pattern that arises with each new technologyor other innovation. Each year Gartner creates more than 80 Hype Cycles in various technology(such as cloud computing and ERP), topic (smart cities, sustainability and green IT) and industry(retail, life insurance) domains as a way for clients to track technology maturity and future potential.This document is a companion to these Hype Cycles. It explains why the Hype Cycle is importantfor organizations deciding which new technologies to adopt and when, how the positioning isdetermined, and what actions should be taken by strategic and technology planners based onknowledge of the Hype Cycle.
Gartner's Hype Cycle, introduced in 1995, characterizes the typical progression of innovation, fromoverenthusiasm through a period of disillusionment to an eventual understanding of the innovation'srelevance and role in a market or domain (see Figure 1).
Gartner, Inc. | G00214001 Page 3 of 33

Figure 1. The Hype Cycle
Technology Trigger
Peak ofInflated
Expectations
Trough of Disillusionment
Slope of EnlightenmentPlateau of
Productivity
time
expectations
Years to mainstream adoption:
less than 2 years 2 to 5 years 5 to 10 years more than 10 yearsobsoletebefore plateau
Source: Gartner (July 2011)
A technology (or related innovation) passes through several stages on its path to productivity:
■ Technology Trigger: The Hype Cycle starts when a breakthrough, public demonstration,product launch, or some other event generates press and industry interest in a technologyinnovation.
■ Peak of Inflated Expectations: A wave of "buzz" builds and the expectations for this newtechnology rise above the current reality of its capabilities. In some cases an investment bubbleforms, as happened with the Web, social media and cloud computing.
■ Trough of Disillusionment: Inevitably, impatience for results begins to replace the originalexcitement about potential value. Problems with performance, slower-than-expected adoptionor a failure to deliver financial returns in the time anticipated all lead to missed expectations,and disillusionment sets in.
■ Slope of Enlightenment: Some early adopters overcome the initial hurdles, begin to experiencebenefits and recommit efforts to move forward. Drawing on the experience of the earlyadopters, understanding grows about where and how the technology can be used to goodeffect and, just as importantly, where it brings little or no value.
Page 4 of 33 Gartner, Inc. | G00214001
■ Plateau of Productivity: With the real-world benefits of the technology demonstrated andaccepted, growing numbers of organizations feel comfortable with the now greatly reducedlevels of risk. A sharp uptick ("hockey stick") in adoption begins, and penetration acceleratesrapidly as a result of productive and useful value.
Note that, although many of Gartner's Hype Cycles are focused on specific technologies, the samepattern of hype and disillusionment applies to higher-level concepts such as IT methodologies andmanagement disciplines. In this document, we will refer to the individual elements mapped on theHype Cycles as "technologies," but in many cases, the Hype Cycles also position higher-leveltrends and ideas such as strategies, standards, management concepts, competencies andcapabilities.
The horizontal axis of the Hype Cycle is labeled "time," reflecting the fact that a single technologywill progress through each stage as time passes. In practice, most Gartner Hype Cycles are asnapshot showing the relative positions of a set of technologies at a single point in time. However,single-topic Hype Cycles can be useful to predict the future path of a technology. One notableexample was the e-business Hype Cycle published in 1999, which accurately predicted the dot-com bust of 2001 and the eventual emergence of e-business as "business as usual."
The vertical axis is labeled "expectations." The distinctive vertical shape of the Hype Cycle curveshows how expectations surge and contract over time as a technology progresses, based on themarket's assessment of its future expected value. Historically, this axis was labeled "visibility," butthis was changed in 2009. The original label focused on the level of buzz and market discourse thatdrives the peak, but the current label more accurately reflects the deeper root cause and nature ofthe buzz as the technology progresses (a technology may be in the trough yet still visible in the formof negative press). In particular, it highlights the changing sentiment of potential and actual adoptersof the technology and the shifting pressures surrounding investment decisions.
The vertical scale of each technology's hype curve typically varies, based on the technology'soverall perceived importance to business and society. For visualization purposes, we havenormalized the scale of these individual hype curves so they will all fit in one Hype Cycle graphic.For example, mesh networks are an interesting method of leveraging peer-to-peer wirelessnetworking bandwidth, but they will be relevant primarily to wireless network service providers, thusreaching a relatively low amplitude of overall expectation and hype. Other technologies that willappeal to a large number of companies (for example, cloud computing) or consumers (for example,media tablets) will attain much higher levels of exposure and hype. Therefore, even when meshnetworking is at the peak of its hype curve, it may still receive less overall "hype volume" than cloudcomputing or media tablets.
The Hype Cycle ends at the start of the Plateau of Productivity, where mainstream adoption of thetechnology surges. As with the height of the Peak of Inflated Expectations, the final height of thePlateau of Productivity varies according to whether the technology is broadly applicable and highlyvisible, or benefits only a niche market. For a model that tracks technologies through the entire lifecycle until they can no longer be viably used or exploited, see "Understanding Gartner's IT MarketClocks, 2010."
Gartner, Inc. | G00214001 Page 5 of 33

For a comprehensive discussion of the Hype Cycle, its traps and opportunities, and advice abouttiming innovation adoption, see "Mastering the Hype Cycle: How to Choose the Right Innovation atthe Right Time," by Jackie Fenn and Mark Raskino, Harvard Business School Press, October 2008.
Positioning a Technology on the Hype Cycle
Gartner analysts position technologies on the Hype Cycle based on a consensus assessment ofhype and maturity. They select a variety of relevant market signals and proxy indicators to establishthe level of expectations. Some of these inputs may be quantitative, but overall, the Hype Cycle is astructured, qualitative research tool. During the first part of the Hype Cycle, when there are manyuncertainties regarding a technology, its position on the curve is guided more by its hype levels thanits maturity. At the later stages, as more information about maturity, performance and adoptionbecomes available, the hype plays a lesser role in determining the technology's position on theHype Cycle.
A technology may have radically different positions on different Hype Cycles. This occurs whenthere are different applications of a technology — for example, speech recognition in the call centermay be more mature (approaching the Plateau of Productivity) than speech recognition on thedesktop (pulling out of the Trough of Disillusionment). Application considerations may lead todifferent positions of the same technology on different horizontal (for example, customerrelationship management) or vertical (for example, government) Hype Cycles.
In Hype Cycle reports, technologies are presented in five categories representing the various stageson the Hype Cycle. These stages are characterized by distinct investment, product and marketpatterns that technology planners can use to understand where a technology is on the Hype Cycle(see Figure 2).
Page 6 of 33 Gartner, Inc. | G00214001

Figure 2. Phases of the Hype Cycle
Startup companies, first round of venture capital funding
time
Slope of EnlightenmentTrough of
DisillusionmentPeak of Inflated
Expectations
TechnologyTrigger
Plateau ofProductivity
R&D
First-generation products, high price, lots of customization needed
Early adopters investigate
Mass media hype begins
Negative press begins
Supplier consolidation and failures
Second/third rounds of venture capital funding
Methodologies and best practices developing
Supplier proliferation
Activity beyond early adopters
Less than 5 percent of the potential audience has adopted fully
Second-generation products, some services
Third-generation products, out of the box, product suites
High-growth adoption phase starts: 20 to 30 percent of the potential audience has adopted the innovation
expectations On the Rise
At the Peak
Sliding Into the Trough
Climbing the Slope
Entering the Plateau
Source: Gartner (July 2011)
On the Rise
A Technology Trigger is anything that sets off a period of rapid development and growing interest,and it will be different for each technology. It may be a product launch, a major improvement inprice/performance, adoption by a respected company, or simply a rush of media interest thatsocializes and legitimizes the concept. It may also be a trigger external to the IT industry, such asnew legislation or the demands of an economic or political crisis. Some technologies can have anextremely long research and development preamble before they reach a meaningful trigger point,including several false starts with minor peaks and troughs. The Hype Cycle cannot start until thereis a "marketplace of minds" actively discussing how to apply the innovation.
Many types of innovation can follow the Hype Cycle, including things such as managementtechniques (for example, Six Sigma) that are not usually thought of as technologies. However, ourresearch content is mostly technology, so we refer to Technology Trigger as one case of a moregeneral Innovation Trigger.
The gap between trigger and peak is often quite short. For an innovation that takes 10 years fromtrigger to plateau, the rise from trigger to peak might take only one to two years. The most common
Gartner, Inc. | G00214001 Page 7 of 33

indicator that an innovation is past the trigger is that it becomes available for purchase from acommercial vendor rather than a lab. Other indicators that an innovation is past the trigger but hasnot yet reached the peak include:
■ Only a handful of suppliers are selling the innovation (often only one or two).
■ The suppliers are funded by seed rounds of venture capital.
■ An established provider brings a radically innovative product to market (such as Apple's iPad orMicrosoft's Kinect).
■ The innovation requires significant customization to work in an operational environment. Thecustomization is performed primarily by the supplier.
■ The price is high relative to the cost of production and to the cost of related, but more-established, products.
■ Suppliers are not yet able to provide references.
■ Consumer-driven innovation, such as social media, often experiences a particularly short pre-peak period as the trigger for success is rapid, viral adoption.
At the Peak
At the Peak of Inflated Expectations, the technology seems to be featured on the front cover ofevery business and industry magazine. Suppliers adopt the latest buzzwords into their marketingarsenals to make their offerings more attractive, and the marketplace is flooded with overlapping,competing and complementary offerings. When investors see an emerging hot spot in the market,they want "one of those" in their portfolio, which encourages the proliferation of companies withsimilar offerings.
As word of the new technology spreads, companies that like to be ahead of the curve seek out thetechnology and jump on it before their competitors. The suppliers of the technology boast abouttheir early prestigious customers, and other companies want to join in so they aren't left behind. Abandwagon effect kicks in, and the technology is pushed to its limits as companies try it out in arange of settings. At this point, the technology is viewed as a panacea, with little regard to itssuitability for each application. Stories in the press capture the excitement around the technologyand reinforce the need to become a part of it or be left behind. The pressure on companies to adoptthe technology, in many cases without a full understanding of the associated challenges and risks,is intense.
Hype bubbles in the consumer world may last from a few months to a year or so, but in thecommercial world, the peak of hype usually lasts at least a year because of the slower pace ofcorporate decision-making and investment. Major peaks, such as the dot-com era or "green"technology, may last for two or three years.
Indicators that an innovation is at the peak include:
Page 8 of 33 Gartner, Inc. | G00214001

■ The trade and business press run frequent stories about the innovation and how early adoptersare using it.
■ A popular name catches on in place of the original, more-academic or specialist engineeringterminology; for example, the wireless networking technology called 802.11g became "Wi-Fi."
■ Analysts, bloggers and the press speculate about the future impact and transformational powerof the innovation.
■ Simple, highly exaggerated, nonspecific declarative marketing slogans appear, such as "I havecloud power" and "cloud is the answer."
■ A surge of suppliers (often 30 or more) offer variations on the innovation.
■ Suppliers with products in related markets align their positioning and their marketing with thetheme of the innovation.
■ Suppliers can provide one or two references of early adopters.
■ Investors aggressively hunt down a representative supplier for their portfolio. Some early-stageventure capitalists may sell at this point.
■ Toward the end of the peak, one or two early leading suppliers are bought by establishedcompanies in expensive, high-profile acquisitions.
Sliding Into the Trough
The same few stories of early success have been repeated over and over, but now a deeper lookoften shows those same companies still struggling to derive meaningful value. Many of thesefailures center on inappropriate uses of the technology. Less-favorable stories start to emerge asmost companies realize things aren't as easy as they first seemed. The media, always needing anew angle to keep readers interested, switches to featuring the challenges rather than theopportunities of the technology. Because the technology does not live up to the early overinflatedexpectations of enterprises and the media, it is rapidly discredited.
There is not always an actual drop in the overall adoption numbers as an innovation slides into thetrough. Instead, the anticipated rapid growth in adoption may simply be delayed. What suppliersand investors anticipated as a "hockey stick" uptake remains a depressingly slow growth path. As aresult, supplier consolidation and failure occurs because there is too little adoption growth tosustain so many similar products.
Amid the disillusionment, trials are ongoing and vendors are improving products based on earlyfeedback regarding problems and issues. Some early adopters find benefit in adopting thetechnology. For some slow-moving technologies, workable and cost-effective solutions emerge andprovide value in niche domains, even while the technology remains in the Trough of Disillusionment.
Indicators that an innovation is, or will soon be, in the trough include:
Gartner, Inc. | G00214001 Page 9 of 33

■ The tenor of press articles turns negative, featuring the challenges and failures around theinnovation. Terms like "DOA," "failure" and "backlash" are used in headlines.
■ There is general cynicism about the transformational potential of the innovation.
■ Supplier consolidation starts, including buyouts by larger companies and investors.
■ Second- and third-round funding by investors is required to sustain suppliers.
■ The same few case studies and references for successful adopters are used by suppliers.
Climbing the Slope
Over time, a technology matures as suppliers improve products on the basis of early feedback, andobstacles in performance, integration, user adoption and business case justification are overcome.Methodologies for applying it successfully are codified, and best practices for its use are socialized.
By the Slope of Enlightenment, many of the big lessons have been learned, and the reputation ofthe technology is rising again. What's learned is incorporated into second- and third-generationproducts, and methodologies and tools are created to ease the development process. For sometechnologies there is a significant new capability or a performance improvement that changes thevalue proposition and makes the innovation more broadly useful. The marketing around thesematuring products or the new capability often acts as a mini-trigger to launch the innovation out ofthe trough. In other cases, the change or improvement is slow and subtle and may catchorganizations unaware unless the progress is being actively tracked.
At the beginning of the Slope of Enlightenment, the penetration often is significantly less than 5% ofthe potential market segment. This will grow to 20% to 30% as the technology enters the Plateau ofProductivity. The journey up the slope may last from one to three years.
Indications that the innovation is moving up the slope include:
■ Suppliers of the innovation offer second- or third-generation products that work with little or noconsulting from the supplier.
■ For technology innovations, suppliers offer product suites that incorporate the innovation into abroader range of tools.
■ Consulting and industry organizations publish methodologies for how to adopt the innovation.
■ Press articles focus on the maturing capabilities and market dynamics of the suppliers.
■ New success stories and references start to proliferate.
■ Reliable figures regarding costs, value and time to value become available.
Entering the Plateau
The Plateau of Productivity represents the beginning of mainstream adoption, when the real-worldbenefits of the technology are predictable and broadly acknowledged. By the time they reach theplateau, technologies are increasingly delivered as out-of-the-box solutions. As a technology
Page 10 of 33 Gartner, Inc. | G00214001
matures, particularly if it is a major, high-profile innovation, an "ecosystem" of related products andservices often evolves around it. This may trigger a fresh Hype Cycle around the components of theecosystem.
As a technology achieves full maturity and supports thousands of enterprises and millions of users,the hype around it typically disappears and is replaced by a solid body of knowledge about the bestways to apply and deploy it.
Indicators that a technology has reached the plateau include:
■ Trade journals and websites start to focus on best-practices articles about how to deploy theinnovation.
■ Clear leaders emerge from the many suppliers that joined the market during the Slope ofEnlightenment.
■ Investment activities focus on acquisitions and IPOs.
■ Many examples of successful deployments can be found in multiple industries.
■ The terminology around the innovation becomes part of everyday speech, such as Googling,texting and blogging.
Why the Hype Cycle Matters
The constant barrage of positive and negative hype often leads organizations to behave in waysthat may not represent the best use of their resources. The peaks and troughs of the Hype Cycleexert pressure to adopt risky technologies without knowing the potential value, and also maskopportunities to embrace less-visible technologies that may be highly relevant. This leads to thefour traps of the Hype Cycle: adopting too early, giving up too soon, adopting too late or hanging ontoo long (see Figure 3).
■ Adopting Too Early and Giving Up Too Soon: Technologies should not be adopted justbecause they are at the Peak of Inflated Expectations, nor should they necessarily beabandoned at the Trough of Disillusionment. Rather, enterprises should identify whichtechnologies are potentially beneficial to their business and evaluate those items earlier in theHype Cycle. The additional risk of adopting early is justified only for potentially high-benefittechnologies.
■ Adopting Too Late: Beware of the "noise filter" that most business and IT strategists apply asan essential coping strategy in a world of information overload. By blocking out all but the mostvisible trends, planners find their attention limited to two points on the Hype Cycle: the Peak ofInflated Expectations (when the noise overwhelms the filter) and the Plateau of Productivity(when the actions of successful competitors become a problem). During the Trough ofDisillusionment and early Slope of Enlightenment phases, the filter can create a blind spot thatmay cause an enterprise to miss some urgent and important opportunities. This is compoundedby the fact that the peak and trough are very visible shifts, but the beginning of the slope can bea much more subtle change, and so easier to miss. If an organization finds a potentially
Gartner, Inc. | G00214001 Page 11 of 33

interesting technology early in the Hype Cycle but planners feel that the technology is not yetready, a good strategy is to identify target performance levels or price points and track progressthrough the "quiet phase" to identify when the technology is finally ready to drive value.
■ Hanging On Too Long: Although Gartner only plots technologies on the Hype Cycle up to thebeginning of the Plateau of Productivity, a full Hype Cycle could be viewed as extending to a"Swamp of Diminishing Returns" when legacy systems start to bog down new initiatives, and a"Cliff of Obsolescence" where maintaining the system become a significant pain point. Like thebeginning of the slope, the decline into these end-of-life issues can be slow and easily misseduntil they start to cause problems. Gartner's IT Market Clock address these phases of the lifecycle in more detail.
Page 12 of 33 Gartner, Inc. | G00214001

Figure 3. Hype Cycle Traps
Time
Slope of Enlightenment
Trough ofDisillusionment
Peak of Inflated
Expectations
TechnologyTrigger
Plateau ofProductivity
Exp
ecta
tio
ns
Adopting too early
Hanging on too long
Giving up too soon
Adopting too late
Cliff of Obsolescence
Swamp of Diminishing
Returns
Source: Gartner (July 2011)
Gartner, Inc. | G00214001 Page 13 of 33

While it's important to understand the traps that can snare unwary adopters, it's equally importantto examine the opportunities that arise from the inevitability of the Hype Cycle. Any time you canpredict major shifts in behavior — such as the major turning points on the Hype Cycle — you cantake advantage by being ahead of the crowd.
Two types of opportunity arise from the Hype Cycle. The first set of opportunities comes fromtiming your adoption of each innovation with precision to optimize the amount of value you canderive. If you're going to invest your organization's time and money (and also some of its limitedcapacity for change) in an innovation, you want to make sure not only that it's the right one, but thatyou jump in at the time that gives you the longest lifetime value at an acceptable level of risk. Thesecond type of opportunity lies in harnessing the energy of the Hype Cycle in the broadermarketplace by taking advantage of the needs and actions of other players. Avoiding the traps thatothers fall into is one element of this. If you can be smarter than the crowd even some of the time inavoiding the money pits of adopting too early or giving up too soon, and the lost opportunity costsof adopting too late or hanging on too long, you'll come out ahead. But if on top of that you cananticipate the tendencies of suppliers, investors, competitors, and skilled individuals at each stageof the Hype Cycle, you'll be able to find the best deals, the best talent, the best publicity, and manyother opportunities to advance your innovation adoption efforts (see Figure 4).
Figure 4. Hype Cycle Opportunities
Getting the jump on competitors
Optimizing supplier relationships
Finding your angle
Maximizing publicity value
Time
Slope of EnlightenmentTrough ofDisillusionment
Peak of Inflated
Expectations
TechnologyTrigger
Plateau ofProductivity
Ex
pe
cta
tio
ns
Acquiring talent
Banking your experience
Planning your purchases Leading the
mainstream wave
Leveraging lower costs and risks
Expanding a niche
Imagining the implications
Source: Gartner (July 2011)
Page 14 of 33 Gartner, Inc. | G00214001

The Hype Cycle is most useful in explaining why the recommendations of technology planninggroups may be different from what enterprises are hearing or reading in the media. At the Peak ofInflated Expectations, technology planners will caution, "Don't get caught up in the hype. Let'sadopt it only if it is strategically important to us. Otherwise, let's wait for others to learn the hardlessons." In the Trough of Disillusionment, technology planners will recommend, "Let's start lookingat the technology now because there are some solid products emerging, as well as real-worldexperience about how to use the technology."
For more details on best practices in the innovation adoption process, see "Driving the STREETProcess for Innovation and Emerging Technology Management."
How to Use the Hype Cycle
The Hype Cycle incorporates a measurement of knowledge and risk. At the beginning of the cycle,companies know little about a technology and cannot make informed judgments about its costs andbenefits. Therefore, the risk is high. As the technology enters the Plateau of Productivity,organizations know more about the technology; thus, they can make informed decisions aboutwhen and where to apply it. Therefore, the risk is much lower.
To make a good decision about when to adopt a technology, you need to balance three variables:how potentially valuable the innovation is to you, where the technology is currently positioned onthe Hype Cycle, and how good your organization is at tolerating and managing risk.
In general, Type A (aggressive) organizations deliberately try to adopt more innovations early in theHype Cycle because they are prepared to brave the risks associated with early adoption in returnfor the reward. Type Cs (conservative) deliberately try to minimize risks by adopting late in the HypeCycle, once the innovation hits the Plateau of Productivity. The Type B majority try to hit the middleof the Hype Cycle to learn from the Type As but not wait so long that they lag behind theircompetitors and become Type Cs. The trouble is, if an organization operates exclusively within itscomfort zone, it will miss opportunities. It will always tend to adopt everything early, or late, in linewith its enterprise personality (see Figure 5).
Gartner, Inc. | G00214001 Page 15 of 33

Figure 5. Adoption Patterns by Type A, Type B and Type C Organizations
A CB
Pilots
A CB
Deployment
Source: Gartner (July 2011)
Organizations should recognize their risk comfort zones, but be prepared to step outside themdepending on the strategic importance of an innovation. That is, they should aim to be selectivelyaggressive. For example, because of the additional risk, even Type A companies should beselectively aggressive regarding which technologies they adopt early. Conversely, Type B and TypeC enterprises should consider adopting technologies early if the technologies contribute to keybusiness objectives. Special care should be taken at extreme highs and lows of economic cycleswhen natural Type Bs can be drawn into Type A behavior by market "group think" (e-businessopportunity risk-taking in 2000 and overzealous high-risk offshoring in an attempt to lower costs in2003).
Some innovation leaders use Hype Cycles as a way to structure a discussion about their innovationcandidates with their executives. One useful focusing mechanism is to divide the chart into twoparts: pre- and post-trough (see Figure 6). For pre-trough technologies, the team asks itself,"What's here that we could be using?"—that is, where is it worthwhile for the organization to adoptaggressively, even if it is outside the organization's usual comfort level? For technologies positionedafter the trough, the team asks, "What's here that we are not using?" In other words, what are theymissing, and do they need to do something about it? The insight from these discussions can informan emerging technology team's ranking and prioritization decisions.
Page 16 of 33 Gartner, Inc. | G00214001

Figure 6. Key Hype Cycle Questions
Exp
ecta
tio
ns
Time
What's here that we're not using? Was
that a deliberate decision?
What's here that we could be using?
Source: Gartner (July 2011)
The Hype Cycle is one of several graphical tools that Gartner uses to assess technologies andinnovations:
■ Priority Matrix: Associated with each Hype Cycle is a companion graphic that shows the sametechnologies mapped against axes — benefit and years to mainstream adoption. Whereas theHype Cycle is a useful educational tool for helping enterprises understand the inevitable patternof excitement and disillusionment, the Priority Matrix may be more effective for internalprioritization within the technology planning function.
■ Magic Quadrants: Some Hype Cycle entries are also associated with a Magic Quadrant orMarketScope that provides detailed analysis of the technology's marketplace. Clients useMagic Quadrants as a first step to understanding the technology providers they might considerfor a specific investment opportunity. Magic Quadrants provide a graphical competitivepositioning of four types of technology providers, where market growth is high and providerdifferentiation is distinct: leaders, visionaries, niche players and challengers.
■ IT Market Clock: Hype Cycles track the expectations of technologies from their emergencethrough early maturity. IT Market Clocks highlight the market progress of IT assets from the firsttime they can be used to when they must be retired. Both models depict "relative time," and thetwo overlap, although the coverage of the IT Market Clock is longer. The IT Market Clock iscomplementary to Gartner's Hype Cycle methodology and fulfills a separate objective. In simpleterms, the Hype Cycle supports "technology hunting" decisions, while the IT Market Clocksupports "farming" decisions for assets already in use. Many technologies that move off
Gartner, Inc. | G00214001 Page 17 of 33

Gartner Hype Cycles when mature will continue to be represented as assets on IT MarketClocks as they progress through their useful market lives.
The Hype Cycle Toolkit (see "Toolkit: My Hype Cycle, 2010") is a planning tool based on Gartner'sannual Hype Cycle research. It pulls into a single spreadsheet more than 1,800 technologiesfeatured in the Hype Cycles published as part of the annual Special Report during July and August.Technology planners can filter, search and sort the spreadsheet entries to generate a shortlist oftechnologies for discussion in IT portfolio and strategic planning meetings. There is also a feature toauto-populate a custom Hype Cycle with technologies selected by the user.
Hype Cycle Speed: The "Years to Mainstream Adoption" Assessment
Technologies do not move at a uniform speed through the Hype Cycle. To represent the varyingspeeds, each technology on the Hype Cycle is assigned to a category representing how long it willtake to reach the Plateau of Productivity from the technology's current position on the Hype Cycle— that is, how far the technology is from the start of mainstream adoption:
■ Less than two years
■ Two to five years
■ Five to 10 years
■ More than 10 years
■ Obsolete Before Plateau (that is, the technology will never reach the plateau, as it will fail in themarket or be overtaken by other competing solutions)
The Priority Matrix and Benefit Ratings
The Gartner Hype Cycle is widely used to provide a snapshot of a set of technologies in terms oftheir level of hype and their rate of maturation. The Hype Cycle is an excellent educational tool toshow business and other executives the common pattern of excitement and subsequentdisillusionment that inevitably accompanies new technology.
However, for internal planning and the prioritization of emerging technologies, technology plannersmust look beyond the hype and assess technology opportunities in terms of their relative impact onthe enterprise. A useful graphical tool for presenting this information is the Priority Matrix (see Figure7). Most Gartner Hype Cycle reports also contain a Priority Matrix for the same set of technologiesfeatured on the Hype Cycle.
Page 18 of 33 Gartner, Inc. | G00214001

Figure 7. Priority Matrix
benefit years to mainstream adoption
less than 2 years 2 to 5 years 5 to 10 years more than 10 years
transformational Invest aggressively if not already adopted
Conservative (Type C) investment profile
Moderate (Type B) investment profile
Aggressive (Type A) investment profile
high Conservative (Type C) investment profile
Moderate (Type B) investment profile
Aggressive (Type A) investment profile
Invest with caution
moderate Moderate (Type B) investment profile
Aggressive (Type A) investment profile
Invest with caution Invest with extreme caution
low Aggressive (Type A) investment profile
Invest with caution Invest with extreme caution
Invest with extreme caution
As of June 2009
Source: Gartner (July 2011)
In the Priority Matrix, the vertical axis focuses on the potential benefit of the technology (rather thanon the hype/expectation levels presented in the Hype Cycle). Options for the benefit rating are:
■ Transformational: Enables new ways of doing business within and across industries that willresult in major shifts in industry dynamics
■ High: Enables new ways of performing horizontal or vertical processes that will result insignificantly increased revenue or cost savings for an enterprise
■ Moderate: Provides incremental improvements to established processes that will result inincreased revenue or cost savings for an enterprise
■ Low: Slightly improves processes (for example, improved user experience), but in a manner thatwill be difficult to translate into increased revenue or cost savings
The horizontal axis groups the technologies according to the same years-to-mainstream-adoptionrating used on the Hype Cycle. The years-to-mainstream-adoption rating is a simple measure of riskbased on the projected rate of maturation for a technology. If desired, a more complex risk ratingcould be derived from a combination of the market penetration and maturity ratings, the years-to-
Gartner, Inc. | G00214001 Page 19 of 33

mainstream-adoption rating and position on the Hype Cycle, and other project-specific factors suchas cost and level of organizational disruption. Note that technologies rated as "Obsolete BeforePlateau" do not appear on the Priority Matrix.
High-priority investments are in the top left of the Priority Matrix, where the technologies willpotentially have a high impact and have reached a reasonable level of maturity. Companies that areconservative in their technology adoption (Type C organizations) may limit their focus to this area.Companies that are more-aggressive technology adopters (Type A and Type B organizations) arelikely already using technologies that will mature in less than two years. Therefore, they will probablywant to evaluate technologies further to the right or lower on the Priority Matrix — for example,technologies that will not be in widespread use for at least five years, but that may provide acompetitive edge in the interim.
As with the Hype Cycle position and the years-to-mainstream-adoption assessment, Gartneranalysts provide a subjective, peer-reviewed opinion on the most-appropriate benefit rating of eachtechnology. The benefit rating assigned by Gartner reflects an average, cross-industry benefit. Forindustry-specific Hype Cycles, it reflects the average benefit within that industry. The potentialbenefit for a specific organization may vary considerably from this average perspective, sotechnology planners should be prepared to replace the average benefit rating with their owncustomized version for technologies in their portfolio.
There may also be some intercompany and interindustry variations on the horizontal years-to-mainstream-adoption axis — but typically to a lesser degree than on the benefit axis. When creatingits own Priority Matrix, an organization may wish to replace the simple years-to-mainstream-adoption assessment of risk with a more sophisticated risk rating for the horizontal axis. Additionalrisk factors might include cost and potential disruption to infrastructure and processes.
The value of the Priority Matrix lies in focusing the discussion on where a company should target itsevaluation of emerging technologies. In particular, it is a useful framework for:
■ Making explicit judgments about the potential benefits of a technology in a company.
■ Defending against personality-driven investment decisions, whereby an influential individualchampions a technology or project that may not be the best investment for the company. ThePriority Matrix lets technology planners show how the proposed technology compares withother candidates in terms of relative benefit and risk.
Market Penetration and Maturity Assessments
In addition to the data points used to create the Hype Cycle and Priority Matrix graphics, GartnerHype Cycle reports contain descriptions of each technology on the Hype Cycle, including thetechnology's definition, a justification for its positioning, its business impact areas, user advice andselected vendors (which are examples, not a comprehensive listing). It also includes two otherrating-style descriptions — maturity and market penetration.
Table 1 shows the options for the maturity rating, although mature mainstream, legacy and obsoletetechnologies are not typically included on the Hype Cycle.
Page 20 of 33 Gartner, Inc. | G00214001

Table 1. Maturity Levels
Maturity Level Status
Embryonic In labs
Emerging Commercialization by vendorsPilots and deployments by industry leaders
Adolescent Evolving technology capabilities, methodologies, and associated infrastructure andecosystemsAdoption levels typically between 5% and 20% of target audience
Early mainstream Technology is proven and value is relatively predictable in many, but not all,environmentsCapabilities continue to evolveAdoption level typically ranges from 20% to 50% of target audience
Maturemainstream
Proven technology with well-understood value propositionTechnology is commoditized; not much evolution in vendors or capabilitiesAdoption levels above 50%
Legacy Still functional, but not appropriate for new developmentsVendors focus on maintenance revenueCost of migration constrains replacement
Obsolete Used/resale/maintenance markets only
Source: Gartner (July 2011)
Ranges for the market penetration, which refers to current penetration as a percentage of theanticipated target market, are:
■ Less than 1% of target audience
■ 1% to 5% of target audience
■ 5% to 20% of target audience
■ 20% to 50% of target audience
■ More than 50% of target audience
For some technologies, assessing the market penetration is relatively straightforward. For a mobilephone, for example, the percentage of the population that owns one would be a simple measure ofprogress. However, there are a number of complicating factors in arriving at a figure for marketpenetration, including:
Gartner, Inc. | G00214001 Page 21 of 33
■ Estimating the ultimate penetration level: At the dawn of an innovation, the projected targetmarket may be wildly misjudged. When mobile phones were first commercialized in 1984 at aprice around $4,000, the target market might have been viewed as "all mobile businessexecutives." More ambitiously, some may have hypothesized that one day every person in acountry might have a mobile phone and that would be the maximum extent of the market. Somemight also anticipate the amount of use based on substituting half, or even all, of the existinglandline telephony minutes consumed per person at that time. Nobody would have forecast thevolume of minutes consumed today, the time spent using the device for other things (such asgame playing) or that the total number of active handsets would commonly exceed 100% of thepopulation. Realistically, for the purposes of Hype Cycle research, the anticipated target marketis likely to be the saturation that analysts expect in a 10- to 20-year horizon (as opposed to a20- to 50-year horizon).
■ Determining when an individual has "adopted" a technology: If a user has joined a social-networking site but only visited twice in the past year, should that be viewed as having"adopted" social networking in determining the current penetration? In general, we wouldregard a technology as adopted only if it is used regularly.
■ Determining when an organization has "adopted" a technology: Organizational adoption iscomplicated by the distinction between an organization's acquisition of a technology, and theextent of its use within the organization. Since any given technology or discipline mightpenetrate deeply in a small number of organizations — or, conversely, may penetrate onlyslightly in a large number of organizations — the percentage of organizations using a giventechnology or discipline does not necessarily equate to the number of actual current users (forexample, as measured by seats or copies of software) as a percentage of all future users. Thepenetration level must consider the number of copies or seats of a technology deployed withinthe enterprise. This issue will be compounded by the proliferation of cloud and SaaS models.
■ Determining the appropriate measure of granularity for adoption: For some technologies, the"target user base" within the organization is not individual users, but development teams (forexample, reusing SOA across a large enterprise) or whole business units (for example, optinginto a master data management strategy). For these more complex organizational innovations,the measure of progress is harder still to ascertain as it involves the scope of adoption. UsingSOA in a couple of small projects is not the same as a full-scale adoption of SOA as anenterprise standard. Deploying one function in a CRM suite is not the same as rolling out acustomer-centric corporate strategy. For complex technologies and innovations, the measure ofcurrent penetration needs to consider the level of sophistication of current deployments versuswhat is possible in the medium to long term.
The way that market penetration is calculated varies among innovations, but each method mustconsider penetration of the innovation across the relevant audience and within each participant.This applies to both individual and organizational adoption. To stay true to standard industrydefinitions of market penetration, the default measure for Hype Cycle market penetration is thepercentage of "numbers of copies/seats" acquired to date and used by customers versus the"number of copies/seats" that can be reasonably expected to be deployed across the life of thetechnology or discipline. Market penetration levels for each technology are reviewed with each
Page 22 of 33 Gartner, Inc. | G00214001

update to reflect changes in adoption and addressable market. In cases where the addressablemarket grows significantly, our assessment of market penetration may be revised downward.
In some cases, the more relevant statistic is the raw percentage of organizations that have adopteda given technology or discipline, without regard for the level of internal penetration. In these cases,the percentage of adopting organizations is used instead of true market penetration, and explainedin the justification or business impact sections of the technology's description.
The expected correspondence between the various fields of a technology is shown in Table 2.There may be exceptions to this typical pattern, for example when a technology is mature but notwell penetrated (i.e., stuck as a niche technology), or when a technology is very slow moving so isclimbing the slope but is still more than five years to mainstream adoption. Such exceptions areexplained in the "Position and Adoption Speed Justification" descriptions.
Table 2. Typical Correspondence Between Hype Cycle Technology Fields
Hype CycleSection
Maturity Level Years to MainstreamAdoption
Market Penetration as % ofTarget Audience
On the Rise Embryonic orEmerging
More than 10 years or Five to10 years
Less than 1% of target audience or1% to 5% of target audience
At the Peak Emerging orAdolescent
More than 10 years or Five to10 years or Two to five years
1% to 5% of target audience or5% to 20% of target audience
Sliding intothe Trough
Emerging orAdolescent
Five to 10 years or Two tofive years or Less than twoyears
1% to 5% of target audience or5% to 20% of target audience
Climbing theSlope
Adolescent orEarly Mainstream
Two to five years or Lessthan two years
5% to 20% of target audience or20% to 50% of target audience
Entering thePlateau
Early Mainstreamor MatureMainstream (rarelyused)
Less than two years 20% to 50% of target audience orMore than 50% of target audience(rarely used)
Source: Gartner (July 2011)
Hype Cycle Q&A
Does the Hype Cycle apply to IT only or does it work for surgical treatment/politics/bio-fuels/management techniques/love?
The Hype Cycle was derived in technology observation, but works for many situations where thefollowing conditions are true:
Gartner, Inc. | G00214001 Page 23 of 33

■ There is an "innovation" to be transferred or purveyed from one to another
■ There is an open discourse market of adopters for that innovation
■ The innovation cannot be "right first time," but must be modified, engineered and evolvedthrough application use and learning by that market.
We have found many examples of where people outside of Gartner have applied the Hype Cycle tonon-IT topics such as nanotechnology, medicine and food products. Even Sarah Palin referencedthe Hype Cycle in the 2008 election campaign (see http://blogs.gartner.com/hypecyclebook/2008/09/17/hype-hype-everywhere/). Gartner has also created Hype Cycles in nontechnology areassuch as regulations (see "Hype Cycle for Legal and Regulatory Information Governance, 2010") andbusiness trends (see "Executive Perspectives: Strategic Business Capabilities and the Gartner HypeCycle"). However, it does not apply to pure fashion or fads, which tend to just trend up and down,with nothing — no artifact, core idea, talent or other value — to pull the fad out of the trough and onto eventual productivity. As for love, the authors have had more than one client comment that theHype Cycle applies perfectly to their personal relationships.
Why is it called the Hype Cycle, when it's not a true cycle, just a curve?
The actual shape of each Hype Cycle is a dampened wave, not a cycle, in that it doesn't have aloop backward like a true cycle would. This is because it is not the technologies themselves thatloop around and around. They progress inexorably toward maturity (or obsolescence), albeit at aslower pace than we want or expect. The cycle itself relates to the behavior of people. Asindividuals, as marketplaces and industries, we go round and round a cycle of enthusiasm anddisillusionment with each new technology or trend.
Is the Hype Cycle based on empirical science?
The Hype Cycle is a structured, qualitative analytical tool. There is no single measure for"expectations" (the Y axis variable), although proxies can be found and are used by our analysts tohelp establish positions (see "The New Hype Cycle Y-Axis Measure: Expectations"). The HypeCycle is not a mechanically derived quantitative chart. It does involve expert judgment. We believeits strength lies in combining data and human judgment. Management is not a pure science. TheHype Cycle is a working management decision tool, not an academic endeavor, though wewelcome third-party research that further evolves the model and guidance on related adoptiondecisions.
Is the Hype Cycle the same as Geoffrey Moore's Crossing the Chasm?
The Trough of Disillusionment coincides with the "chasm" in Geoffrey Moore's classic book ontechnology marketing, "Crossing the Chasm." During this stage, vendors need to increase productadoption from a few early adopters to a majority of enterprises to begin the climb up the Slope ofEnlightenment. We view Moore's Chasm work and the Hype Cycle as analytic "yin and yang." TheChasm is written from the innovation originator (vendor) perspective, while the Hype Cycle takes theinnovation adopter (buyer) point of view. The main management issues and key decisions faced byeach side are different.
Page 24 of 33 Gartner, Inc. | G00214001

Does everything take the same time to pass through the Hype Cycle?
No, and people often misunderstand this by skim reading, or seeing the Hype Cycle republished onthe Web without its supporting key. We show each item taking a different time to plateau. You maynotice there is no fixed timeline on the chart. If you fixed the timeline on the X axis, disparatetechnologies could not be compared, specifically because they do move, although at different rates.We occasionally publish a Hype Cycle for a single technology or concept with a fixed dateline (forexample see "Emerging Trend: The E-Book's Day Is Finally Ready to Dawn").
Do things go around the Hype Cycle several times?
In most cases, no. On a very few occasions, over a very long period, there may be more than oneHype Cycle iteration as a technology seems to cycle between the Peak and the Trough. We refer tothese as Phoenix technologies. Agents are a prime example of a Phoenix technology. Agenttechnology is embedded in certain product classes that have matured (for example, networkmanagement and comparison shopping), but there are many other capabilities and interpretationsof agent functionality that re-emerge year after year. In this case, the individual applications movethrough the Hype Cycle, while the higher-level concept seems to cycle.
Do things fall off the Hype Cycle?
If innovations are tracked at the level of capabilities, rather than specific ways of delivering thecapability, then very little "falls off" the Hype Cycle. Failure typically occurs where there are multipleways to deliver the same capability or benefit. For example, broadband connectivity has made itsway through the Hype Cycle over the past decade, but some of the techniques to deliver thecapability (e.g., ISDN, broadband over power lines) have fallen off the Hype Cycle along the way,while others (cable modem and DSL) have reached maturity. The actual capabilities — broadband,speech recognition, biometrics and videoconferencing, for example — do not fall off the cycle,whereas specific techniques, protocols, operating systems, products and devices may besupplanted by alternatives. Obsolescence before the plateau is most common in the area oftelecommunications and standards.
Do companies and products follow the Hype Cycle?
Occasionally, and under very specific conditions, the fortunes of one company can follow the HypeCycle. As an example, for Amazon's first eight years, its stock price followed a perfect Hype Cyclecurve. For this to happen, the company needs to be associated with just a single innovation.
However, it is not usually helpful to use the Hype Cycle this way. We typically use the Hype Cycle totrack technologies at the "class of products" level rather than at the level of individual products andvendors, so you'll see "cloud computing" on a Gartner Hype Cycle rather than "Amazon S3."Sometimes a single vendor becomes so synonymous with a new capability that coming up with ageneric description feels like an unnatural act. Most people identify with "YouTube" more than"consumer-generated media" and "Twitter" remains more recognizable than "microblogging," evenas the capability becomes embedded in other social networking tools. However, in general, the
Gartner, Inc. | G00214001 Page 25 of 33

capability level, rather than a specific company, product or service, is a more useful way to trackand evaluate a technology.
Can a technology be at different points on the Hype Cycle in different geographies?
Yes. Gartner creates industry-specific and region-specific Hype Cycles to show that sometechnologies are more important, and may be at different positions, in different industries orgeographic regions. There may be some industries and regions where technologies are generallyfurther behind or ahead than the general position, but in most cases the variation is more specificthan that. For example, even though technology adoption may be lagging in many emergingeconomies, mobile peer-to-peer payments are much further ahead than in developed nationsbecause of the lack of alternative infrastructure for centralized banking.
Has the Hype Cycle accelerated since you first published it?
A question we get quite frequently is whether the Hype Cycle has "sped up" since we firstintroduced it in 1995. At the heart of this question is a feeling that the pace of innovation hasaccelerated and that we are being hit with new technologies at an ever-increasing rate.
When we look at the velocity that innovations are moving through the Hype Cycle, there is one typeof innovation that does seem to move at a much higher speed. These are the innovations that arisefrom the consumer Web world, in particular those that involve collaboration and social networking.These technologies, as typified by YouTube, Facebook and Twitter, seem to launch fully formed andmove rapidly from the early adopters to the Peak of Inflated Expectations, often in less than a year.There is still some inevitable disillusionment as individuals figure out how to manage a new sourceof potential information overload, and companies scratch their heads about finding the businessvalue. For corporate adoption in particular, it may still take several years for the innovation to movefrom the Peak to the Plateau of Productivity. But overall, the path is distinctly more rapid than atraditional, multidecade Hype Cycle.
The feature that distinguishes these technologies is that they are born not from years of visible,documented laboratory R&D, but from the viral melting pot of the Web. For every Facebook andTwitter, a thousand similar ideas were also launched that didn't have quite the right set of features,or the right interface, to rise above the crowd. Once the next viral site emerges, it has already won aDarwinian battle and is ready for broader adoption.
Outside of this class of technology, it seems that in most cases the overall speed through the HypeCycle hasn't necessarily increased. Some of the innovations that will start to hit the Peak this year— such as augmented reality, tablets and touch technologies — have already been in the labs fordecades. In particular, technologies that involve fundamental hardware advances, such as a newtype of display or networking capability, tend to have a long period of laboratory fermentation.Overall the pace varies considerably: "podcasting" took only three or four years to completelytraverse the Hype Cycle, but "mobile commerce" has taken 15 years so far and probably hasanother five years or more to go.
Going forward, we are likely to see a growing proportion of innovations arising in the consumerworld, particularly with the growth of platforms and app stores that encourage and reward a broad
Page 26 of 33 Gartner, Inc. | G00214001
set of innovators. It will be important to track these sources as well as traditional labs and vendors.But the Hype Cycle still seems to be holding up as a pattern that reflects our attitudes to most typesof innovation, and accounting for both "fast track" and "long fuse" technologies. Perhaps what isaccelerating is not so much the pace of innovation itself, but rather society's splintering levels ofattention, causing us to cycle more rapidly between our peaks of enthusiasm for each next newthing.
Advanced Hype Cycle Topics
Behind the Hype Cycle
In looking at the rationale for the Hype Cycle, it becomes clear that the cycle is not so much abouttechnology as it is about human attitudes toward innovation. The same Hype Cycle applies to newbusiness models and management approaches, and to consumer phenomena such as rising movieor music stars. Investors are intensely aware of the hype effect as a new company gains popularityand visibility.
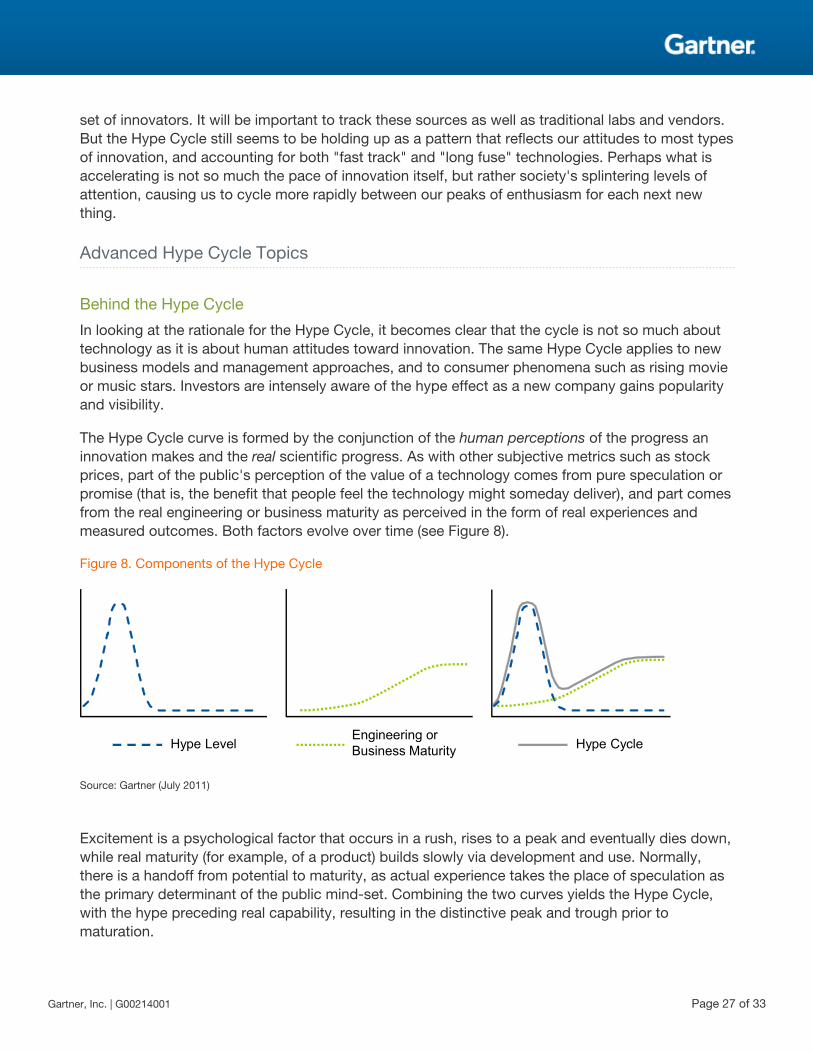
The Hype Cycle curve is formed by the conjunction of the human perceptions of the progress aninnovation makes and the real scientific progress. As with other subjective metrics such as stockprices, part of the public's perception of the value of a technology comes from pure speculation orpromise (that is, the benefit that people feel the technology might someday deliver), and part comesfrom the real engineering or business maturity as perceived in the form of real experiences andmeasured outcomes. Both factors evolve over time (see Figure 8).
Figure 8. Components of the Hype Cycle
Hype LevelEngineering or Business Maturity Hype Cycle
Source: Gartner (July 2011)
Excitement is a psychological factor that occurs in a rush, rises to a peak and eventually dies down,while real maturity (for example, of a product) builds slowly via development and use. Normally,there is a handoff from potential to maturity, as actual experience takes the place of speculation asthe primary determinant of the public mind-set. Combining the two curves yields the Hype Cycle,with the hype preceding real capability, resulting in the distinctive peak and trough prior tomaturation.
Gartner, Inc. | G00214001 Page 27 of 33

The Hype Cycle shows two stages of upward direction (that is, increasing expectations) — the lead-up to the Peak of Inflated Expectations and the rise up to the Slope of Enlightenment. The first riseis the primarily unsubstantiated hype that occurs when a technology is first discussed in the media.Some technologies experience multiple rounds of vacuous hype before beginning a more seriousgrowth path based on an understanding of where and how to apply the technology. The secondstage of rising expectations is associated with the beginning of real adoption growth. In manytechnology markets, another "minipeak" of hype may occur, triggered by product vendors, thatlaunches the technology up the Slope of Enlightenment (see Figure 9). As with the first peak, thismini-peak often plays a beneficial role in alerting people that something has changed in the maturityor value proposition of the technology.
Figure 9. Double "Peak" of Hype Triggered by Meaningful Improvements and Adoption
Technology Trigger
Peak ofInflated
Expectations
Trough of Disillusionment Slope of Enlightenment
Plateau of Productivity
time
expectations
Source: Gartner (July 2011)
There can also be significant variation across industries. As the number of uses for the technologyexpands across different industries, they follow different paths up the Slope of Enlightenment andreach different Plateau of Productivity heights. Figure 10 shows this effect as a "horse tail" ofplateau heights, in this case using a simplified view for the evolution of radio frequency identification(RFID) and its applications during the past decade. For a while, during the mid-1990s, the earliestproponents of the technology, such as Texas Instruments, were exploring all sorts of possible uses.
Page 28 of 33 Gartner, Inc. | G00214001
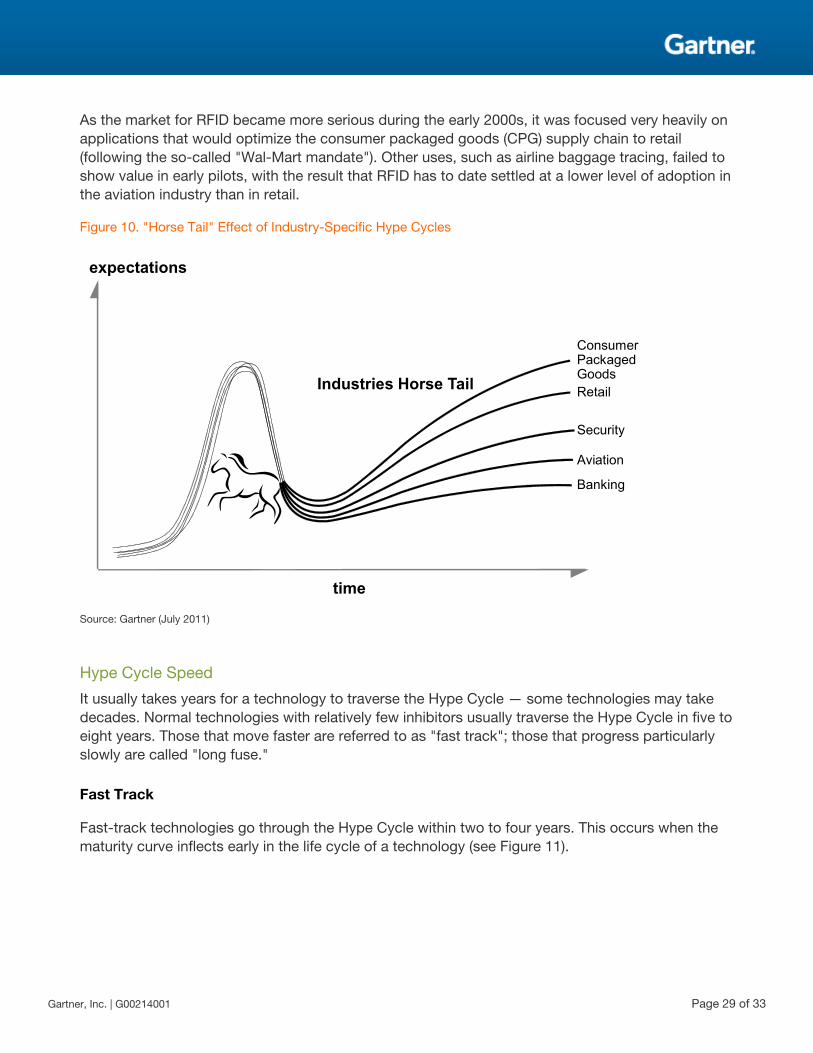
As the market for RFID became more serious during the early 2000s, it was focused very heavily onapplications that would optimize the consumer packaged goods (CPG) supply chain to retail(following the so-called "Wal-Mart mandate"). Other uses, such as airline baggage tracing, failed toshow value in early pilots, with the result that RFID has to date settled at a lower level of adoption inthe aviation industry than in retail.
Figure 10. "Horse Tail" Effect of Industry-Specific Hype Cycles
time
Industries Horse Tail
ConsumerPackagedGoodsRetail
Security
Aviation
Banking
expectations
Source: Gartner (July 2011)
Hype Cycle Speed
It usually takes years for a technology to traverse the Hype Cycle — some technologies may takedecades. Normal technologies with relatively few inhibitors usually traverse the Hype Cycle in five toeight years. Those that move faster are referred to as "fast track"; those that progress particularlyslowly are called "long fuse."
Fast Track
Fast-track technologies go through the Hype Cycle within two to four years. This occurs when thematurity curve inflects early in the life cycle of a technology (see Figure 11).
Gartner, Inc. | G00214001 Page 29 of 33

Figure 11. Fast-Track Hype Cycle
Negligible TroughFaster Maturity
Hype LevelEngineering or Business Maturity
Hype Cycle
Source: Gartner (July 2011)
Many examples of fast-track technologies are innovations that arise from the consumer Web world.The move from consumer technology to the more-demanding constraints of the enterprise (withrespect to security, compliance, retention and more) is usually the cause of the trough in thesecases.
Fast-track technology indicators include:
■ High value
■ Simplicity of use by organizations and users
■ Several strong vendors that support the technology
■ Use of the current infrastructure
■ Rapid transition from consumer to corporate use
Long Fuse
Long-fuse technologies spend a longer-than-average time in the Trough of Disillusionment, resultingin a slower overall traversal of the Hype Cycle — sometimes as long as one or two decades (seeFigure 12). For example, PDAs were in the Trough of Disillusionment for several years after theApple Newton, until the PalmPilot was launched and firmly established a viable new class of device.Another example is object orientation, which took 10 to 15 years to migrate from academia andother research organizations to become a mainstream development technique; the delay was partlydue to skills and development process barriers. Many long-fuse technologies seem to beperpetually emerging and cycling between the peak and trough in public attention (for example,biometrics and artificial intelligence).
Page 30 of 33 Gartner, Inc. | G00214001

Figure 12. Long-Fuse Hype Cycle
Extended TroughSlower Maturity
Hype LevelEngineering or Business Maturity
Hype Cycle
Source: Gartner (July 2011)
Long-fuse technology indicators include:
■ Inherent complexity that requires advances in basic science and engineering (for example,quantum computing and heads-up displays).
■ User acceptance or regulatory issues (for example, biometrics).
■ Reliance on a new infrastructure or ecosystem that needs time to evolve (for example, public-key infrastructure and digital signatures require regulation and standardized businessapplications, smart cards need readers and fuel cells require a distribution network).
■ Dependence on professional skills that are unavailable or in short supply (for example, datamining, simulation or complex design).
■ Major changes to business processes or the creation of a new business model (for example,customer relationship management).
■ A science-fiction-style fascination with the technology that is far ahead of its real capabilities(for example, artificial intelligence, nanocomputing and robotics).
Special Hype Cycle Circumstances
Technologies can experience special or unusual circumstances as they move through the HypeCycle:
■ Technologies can become embedded. That is, they cease to exist as a technology category orconcept; instead, the functionality is embedded in other products (for example, neural networksare now delivered as one of multiple techniques in analytic tools, rather than the stand-aloneproducts of the early 1990s).
■ Technologies can be split into several subconcepts (for example, cloud computing splits intopublic cloud and private cloud), as users differentiate between different application contextsand contextual requirements. Similarly, technologies from different disciplines can merge and
Gartner, Inc. | G00214001 Page 31 of 33

then re-emerge. For example, in the 1990s, machine learning from artificial intelligence andregression models from statistics merged to become data mining.
■ "Phoenix" technologies continually cycle through enthusiasm and disillusionment (for example,intelligent agents and biometrics). Major events often can trigger new attention on a technology,such as terrorist attacks or disease outbreaks. Even some prominent media articles, or thecomplete lack thereof, can make some technologies cycle through repeatedly. Thesetechnologies usually are extremely slow-moving technologies with methodological challenges.
■ "Zombie" technologies (for example, Internet terminals, interactive TV, video on demand andpower line networking) are placed on hold because they have failed to deliver on their promises.These technologies basically work, but they do not have enough user interest or businessjustification to drive adoption. They usually are in the Trough of Disillusionment for a long timebefore they become obsolete or re-emerge, often as embedded functionality in othertechnologies.
■ Technologies can become obsolete or "extinct" prior to reaching the Plateau of Productivity.This premature obsolescence typically results from the emergence of a competing technology.For example, VoxML was overtaken by VoiceML; analog high-definition TV has ceded to digitalhigh-definition TV.
As part of the normal evolution of technology, the target audience for the technology may changefrom what was originally intended. The technology's applicability may grow to encompass newclasses of users or shrink to become successful only in niche applications. Technologies that havebeen reduced to niche applications include the artificial intelligence technologies that were hypedduring the 1980s, such as expert systems, virtual reality, genetic algorithms and fuzzy logic. Theiroriginal hype indicated that they should have had more impact on the world. However, thesetechnologies may re-emerge from their current niche applications.
Recommended ReadingSome documents may not be available as part of your current Gartner subscription.
"Mastering the Hype Cycle: How to Choose the Right Innovation at the Right Time," Jackie Fennand Mark Raskino, Harvard Business School Press, October 2008
"Executive Perspectives: Strategic Business Capabilities and the Gartner Hype Cycle'
'Driving the STREET Process for Innovation and Emerging Technology Management'
"Applying the Hype Cycle as a Portfolio Review Tool in a Recession"
"A Hype Cycle Variant: The Industries 'Horse Tail'"
"The New Hype Cycle Y-Axis Measure: Expectations"
"Understanding Gartner's IT Market Clocks, 2010"
Page 32 of 33 Gartner, Inc. | G00214001

Regional Headquarters
Corporate Headquarters56 Top Gallant RoadStamford, CT 06902-7700USA+1 203 964 0096
Japan HeadquartersGartner Japan Ltd.Aobadai Hills, 6F7-7, Aobadai, 4-chomeMeguro-ku, Tokyo 153-0042JAPAN+81 3 3481 3670
European HeadquartersTamesisThe GlantyEghamSurrey, TW20 9AWUNITED KINGDOM+44 1784 431611
Latin America HeadquartersGartner do BrazilAv. das Nações Unidas, 125519° andar—World Trade Center04578-903—São Paulo SPBRAZIL+55 11 3443 1509
Asia/Pacific HeadquartersGartner Australasia Pty. Ltd.Level 9, 141 Walker StreetNorth SydneyNew South Wales 2060AUSTRALIA+61 2 9459 4600
© 2011 Gartner, Inc. and/or its affiliates. All rights reserved. Gartner is a registered trademark of Gartner, Inc. or its affiliates. Thispublication may not be reproduced or distributed in any form without Gartner’s prior written permission. The information contained in thispublication has been obtained from sources believed to be reliable. Gartner disclaims all warranties as to the accuracy, completeness oradequacy of such information and shall have no liability for errors, omissions or inadequacies in such information. This publicationconsists of the opinions of Gartner’s research organization and should not be construed as statements of fact. The opinions expressedherein are subject to change without notice. Although Gartner research may include a discussion of related legal issues, Gartner does notprovide legal advice or services and its research should not be construed or used as such. Gartner is a public company, and itsshareholders may include firms and funds that have financial interests in entities covered in Gartner research. Gartner’s Board ofDirectors may include senior managers of these firms or funds. Gartner research is produced independently by its research organizationwithout input or influence from these firms, funds or their managers. For further information on the independence and integrity of Gartnerresearch, see “Guiding Principles on Independence and Objectivity” on its website, http://www.gartner.com/technology/about/ombudsman/omb_guide2.jsp.
Gartner, Inc. | G00214001 Page 33 of 33