understanding changes in watersheds due to non-climate ... fileunderstanding changes in watersheds...
TRANSCRIPT

Understanding Changes in Watersheds due to Non-Climate Stressors: Influences of
People, Land Use and Land Cover Change
Hidayat Pawitan, Ph.D.
Dept. Geophysics and Meteorology
&
Center for Climate Risk and Opportunity Management
Bogor Agricultural University
Training Workshop on Climate Change Adaptation in Watersheds for Water, Food and Environmental Security,
15-18 October 2013 at SEARCA, College, Los Baños, Laguna
Introduction and Objectives initiatives on climate change adaptation for water, food and environmental security in Southeast Asia It aims to enable participants to:
1) understand the issues and challenges in watershed management in a changing climate in relation to water, food and environmental security;
2) analyze gaps toward sustainable watersheds in a changing climate for water, food, and environmental security; and
3) draw up an agenda for action towards sustainable watersheds for water, food and environmental security in a changing climate within their work contexts, be it in research, teaching, action programs and practices, and policies.
Management of watersheds and protection of water resources play a very important role for the attainment of water, food and environmental security
INTRODUCTION
• Country rich in water and environmental resources does not guarantee free from water, food and environmental securities due to excessive human pressures and interventions
• There is strong indication of relationship between land degradation and poverty in the form of vicious circle of poverty
• Efforts are being done through national programs to solve this linking the sustainable watershed management and community livelihoods
IPCC Report Calls Climate Changes Unprecedented Randy Showstack (Eos, Oct.08, 2013)
Warming of the Earth's climate “is unequivocal and since the 1950s many of the observed changes are unprecedented over decades to millennia,” according to a new assessment report by the Intergovernmental Panel on Climate Change (IPCC). The 27 September summary for policy makers of IPCC's report “Climate Change 2013: The Physical Science Basis” also states that “it is extremely likely that human influence has been the dominant cause of the observed warming since the mid-20th century.”
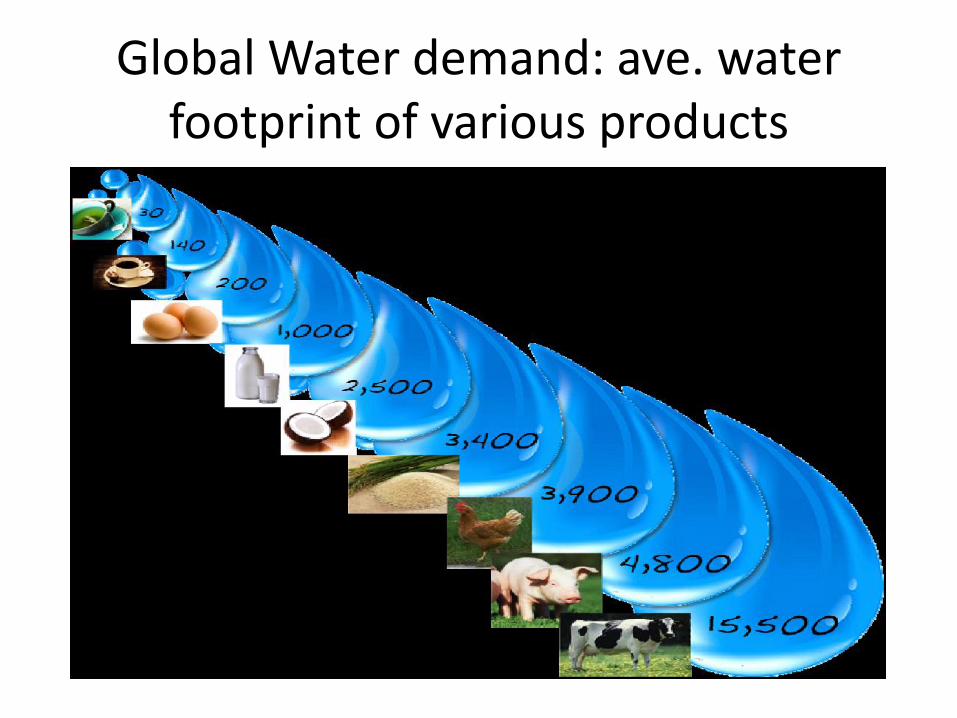
Global Water demand: ave. water footprint of various products

Trends of water related disasters

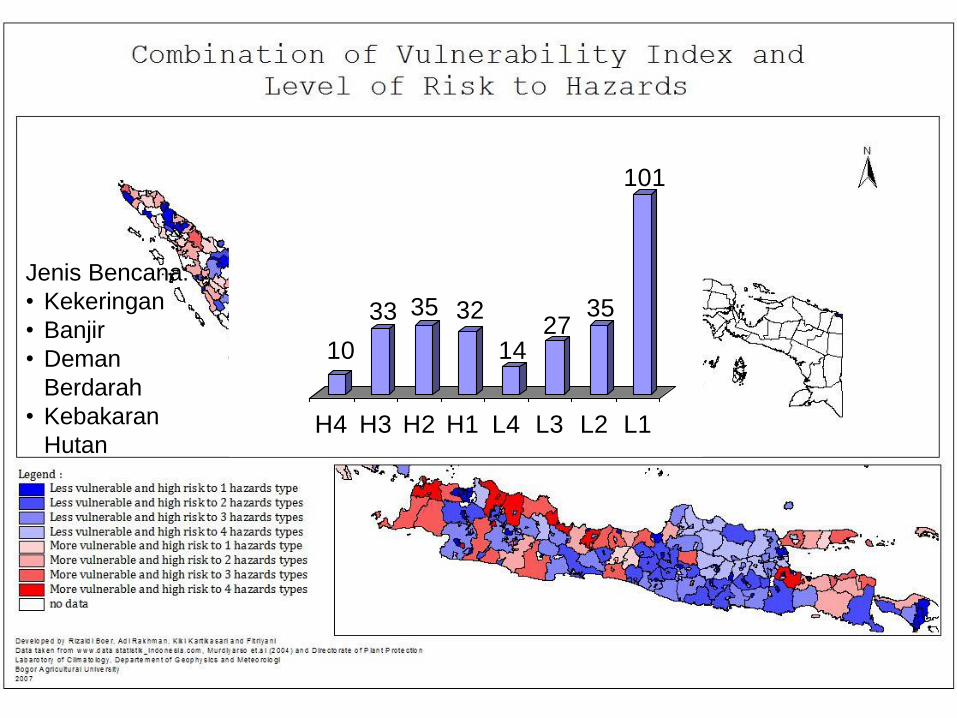
Jenis Bencana:
• Kekeringan
• Banjir
• Deman
Berdarah
• Kebakaran
Hutan
10
33 35 32
1427
35
101
0
20
40
60
80
100
120
H4 H3 H2 H1 L4 L3 L2 L1

Climates, Landscapes, and Civilizations Colin Schultz (2013)
Humans are now the dominant driver of global climate change. From ocean acidification to sea level rise, changes in precipitation patterns, and rising temperatures, global warming is presenting us with an uncertain future. However, this is not the first time human civilizations have faced a changing world. In the AGU monograph Climates, Landscapes, and Civilizations, editors Liviu Giosan, Dorian Q. Fuller, Kathleen Nicoll, Rowan K. Flad, and Peter C. Clift explore how some ancient peoples weathered the shifting storms while some faded away. In this interview, Eos speaks with Liviu Giosan about the decay of civilizations, ancient adaptation, and the surprisingly long history of humanity's effect on the Earth
Parts of Amazon on the verge of forest-to-grassland shift
Colin Schultz (2013) The stability of the Amazon rainforest and the ecosystem's resilience to widespread deforestation may be much lower than previously thought. The replacement of stands of trees with grassland changes evapotranspiration rates and atmospheric moisture convergence, which, in turn, reduce regional rainfall. This feedback effect could drive further deforestation. Previous research indicated that a dramatic shift from forest to grassland could overtake the Amazon when the total deforested area hits 40% to 50% of the forest's current size. New research by Pires and Costa, however, found that the deforestation needed to trigger this equilibrium shift is much lower, closer to just 10%.

ISSUES AND CHALLENGES IN
WATERSHED MANAGEMENT:
Impacts on Water, food, and
environmental security
Bogor Agricultural University
Anthropogenic influences
• From four million to forty million people in Java and Madura was the title of the Boeke report (1941)
indicating the population increase from 1800 to 1930, when
the first census of conducted in Java and Madura.
• It was reported that since old days, population density in Java had
been very diverse, from 9 persons/km2 to 880 person/km2 in 1815
with average 35 person/km2, and this average increased to 330 (1930)
and 1000 (2000).
• This increase of population has severely affected the land
uses and continuous changes in vegetation covers, with
consequences in changes in hydrologic regimes and
environmental qualities.
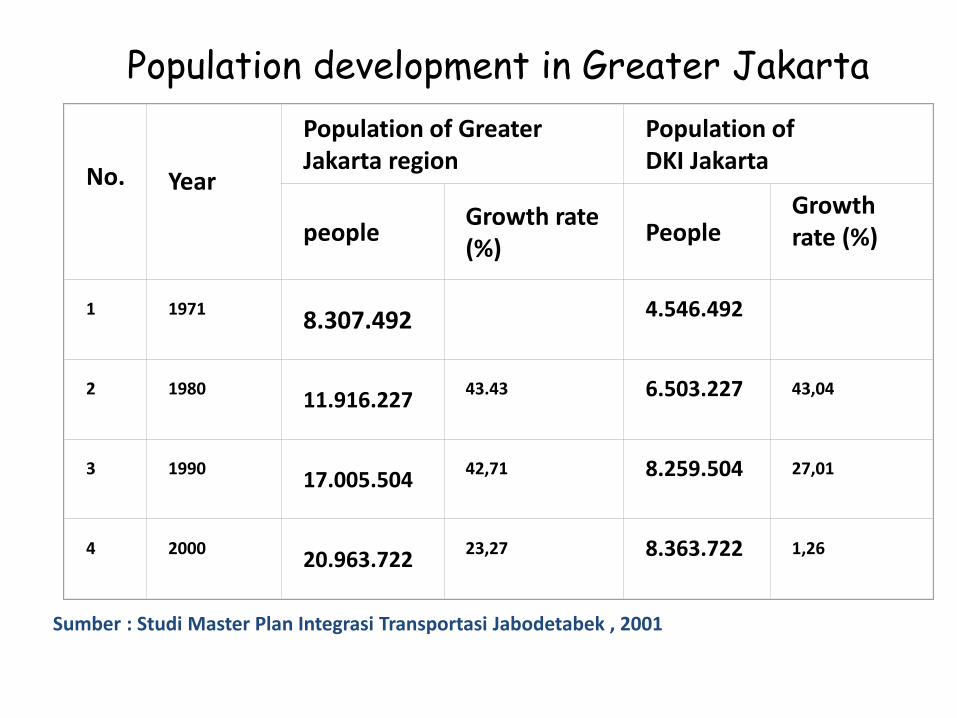
Population development in Greater Jakarta
Sumber : Studi Master Plan Integrasi Transportasi Jabodetabek , 2001
No.
Year
Population of Greater Jakarta region
Population of DKI Jakarta
people Growth rate (%)
People Growth rate (%)
1
1971 8.307.492
4.546.492
2
1980
11.916.227 43.43
6.503.227
43,04
3
1990
17.005.504 42,71
8.259.504
27,01
4
2000
20.963.722 23,27
8.363.722
1,26
Bogor Agricultural University
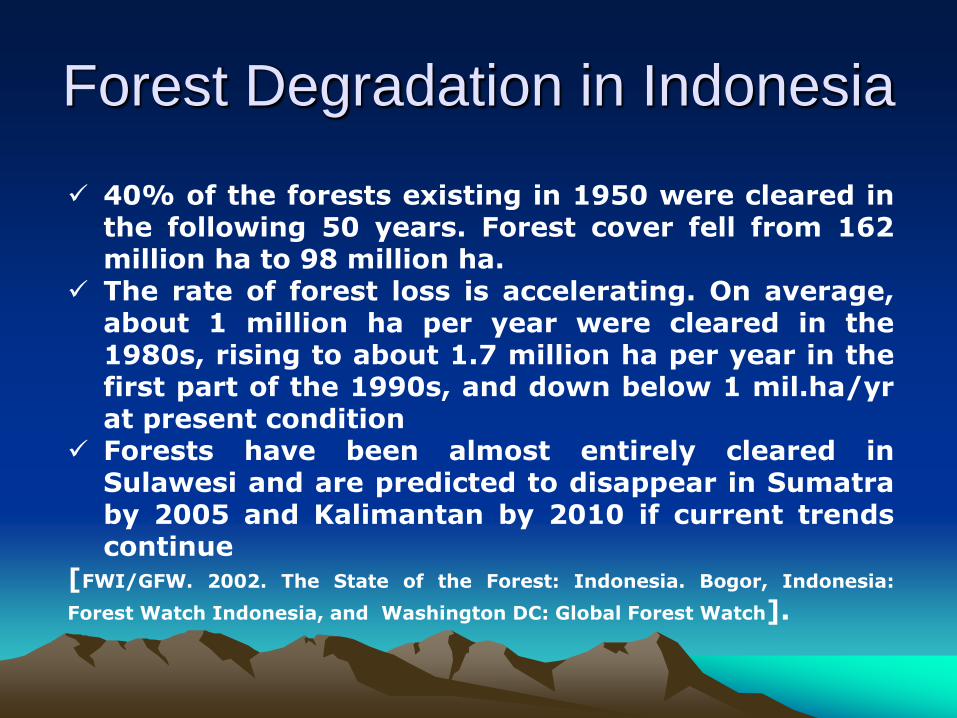
Forest Degradation in Indonesia
40% of the forests existing in 1950 were cleared in the following 50 years. Forest cover fell from 162 million ha to 98 million ha.
The rate of forest loss is accelerating. On average, about 1 million ha per year were cleared in the 1980s, rising to about 1.7 million ha per year in the first part of the 1990s, and down below 1 mil.ha/yr at present condition
Forests have been almost entirely cleared in Sulawesi and are predicted to disappear in Sumatra by 2005 and Kalimantan by 2010 if current trends continue
[FWI/GFW. 2002. The State of the Forest: Indonesia. Bogor, Indonesia:
Forest Watch Indonesia, and Washington DC: Global Forest Watch].
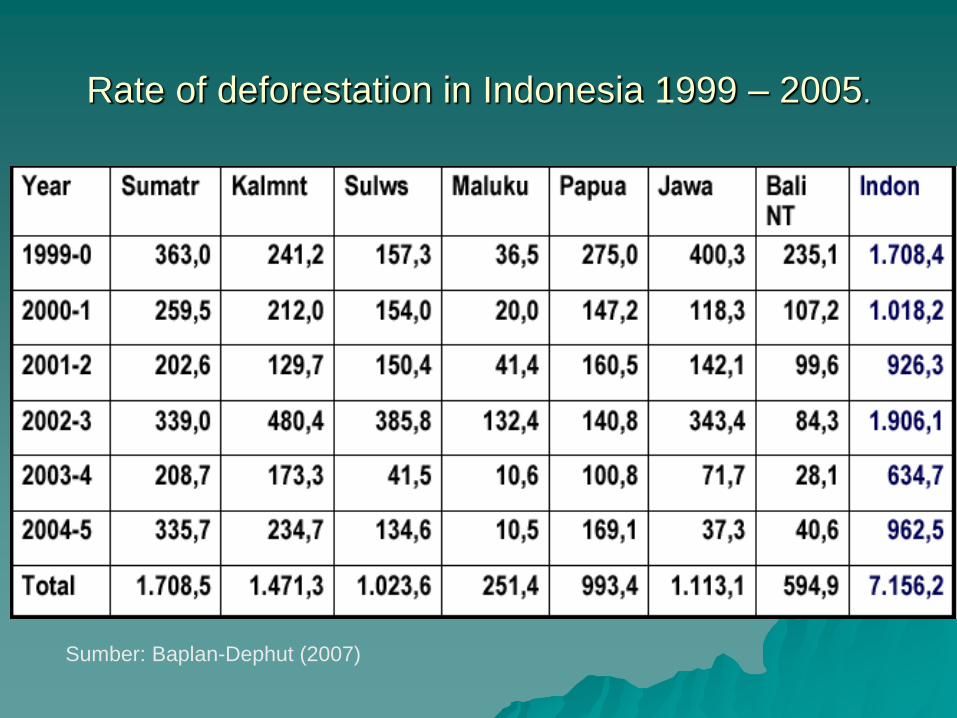
Rate of deforestation in Indonesia 1999 – 2005.
Sumber: Baplan-Dephut (2007)
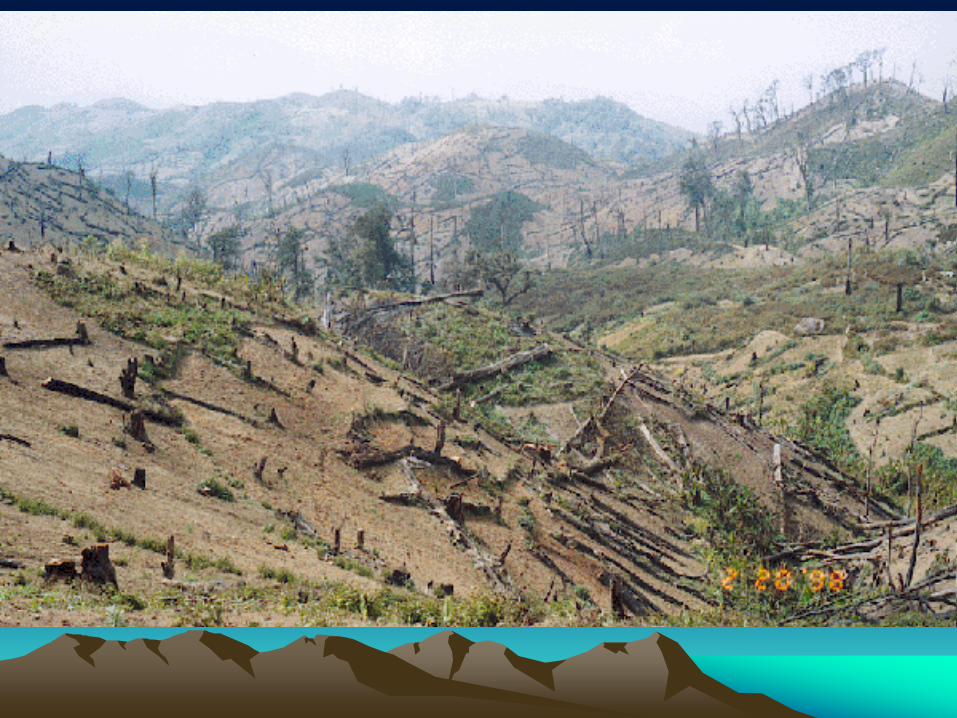

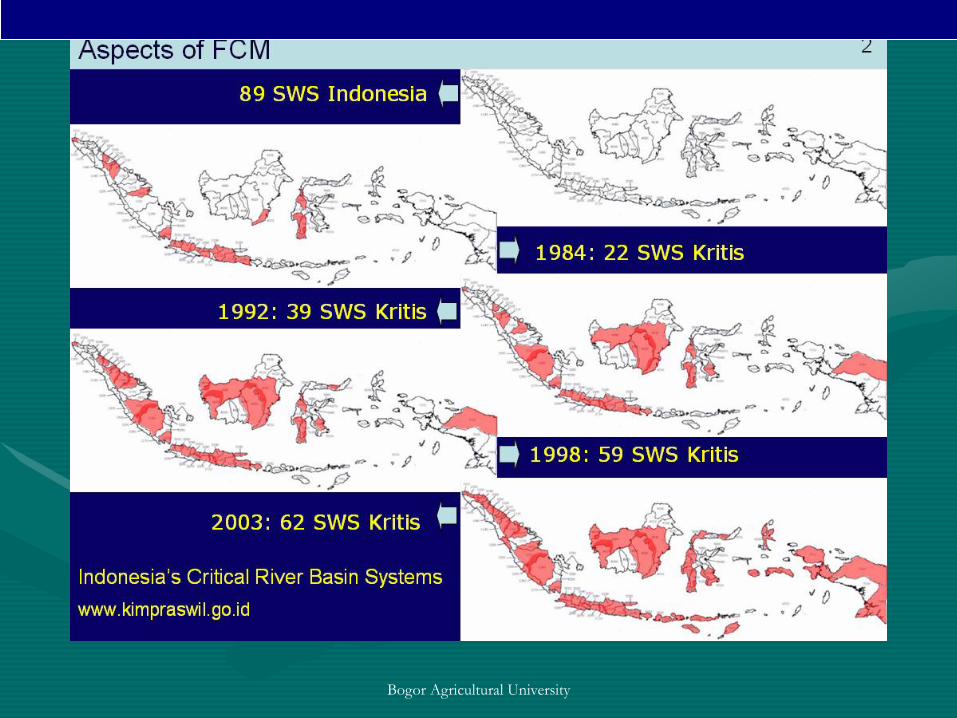
Poor Vegetative Cover

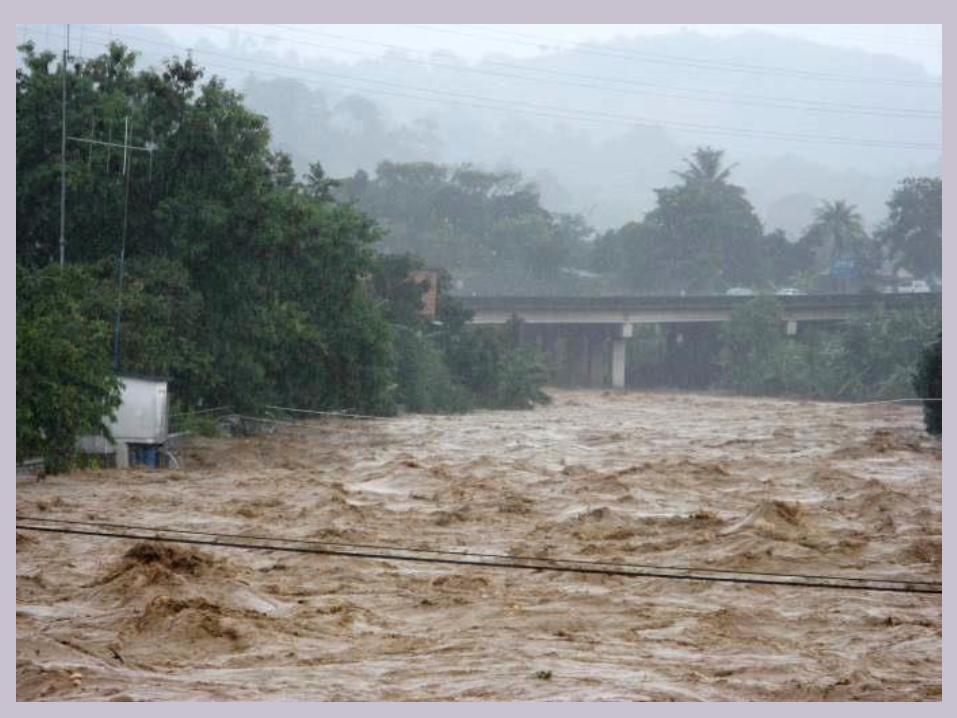

Discharges of 52 rivers in Indonesia
Persentase aliran sungai dengan debit rendah yang berpotensi menimbulkan risiko kekeringan (a) dan
dengan debit tinggi yang berpotensi menimbulkan banjir (b) semakin meningkat (analyzed from Loebies, 2001).
(a) (b)
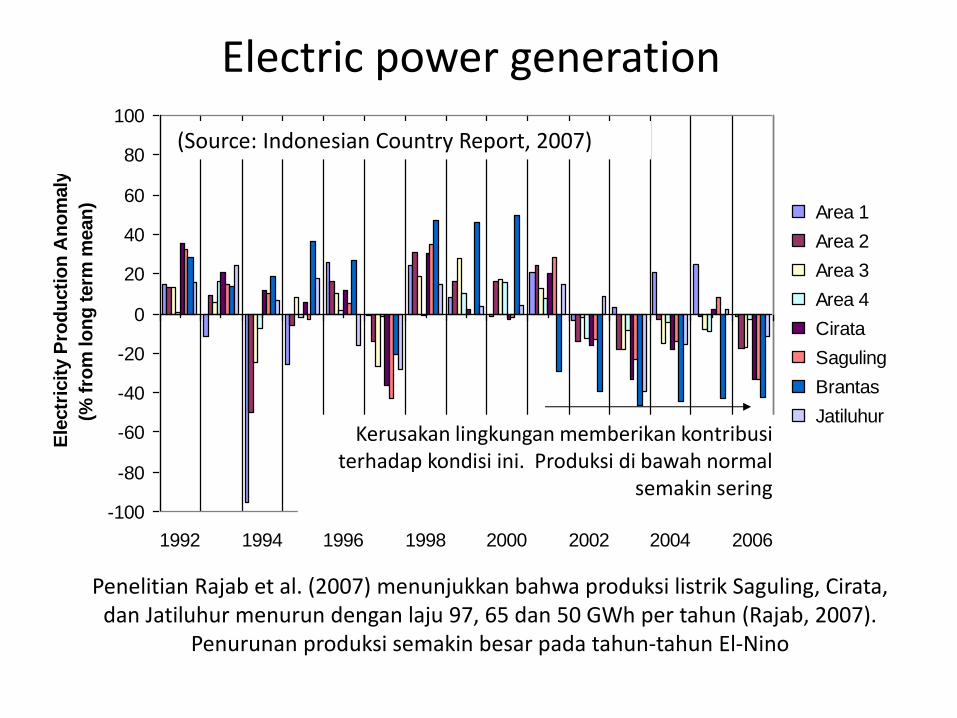
Electric power generation
-100
-80
-60
-40
-20
0
20
40
60
80
100
1992 1994 1996 1998 2000 2002 2004 2006
Ele
ctr
icit
y P
rod
ucti
on
An
om
aly
(% f
rom
lo
ng
term
mean
)
Area 1
Area 2
Area 3
Area 4
Cirata
Saguling
Brantas
Jatiluhur
(Source: Indonesian Country Report, 2007)
Kerusakan lingkungan memberikan kontribusi terhadap kondisi ini. Produksi di bawah normal
semakin sering
Penelitian Rajab et al. (2007) menunjukkan bahwa produksi listrik Saguling, Cirata, dan Jatiluhur menurun dengan laju 97, 65 dan 50 GWh per tahun (Rajab, 2007).
Penurunan produksi semakin besar pada tahun-tahun El-Nino
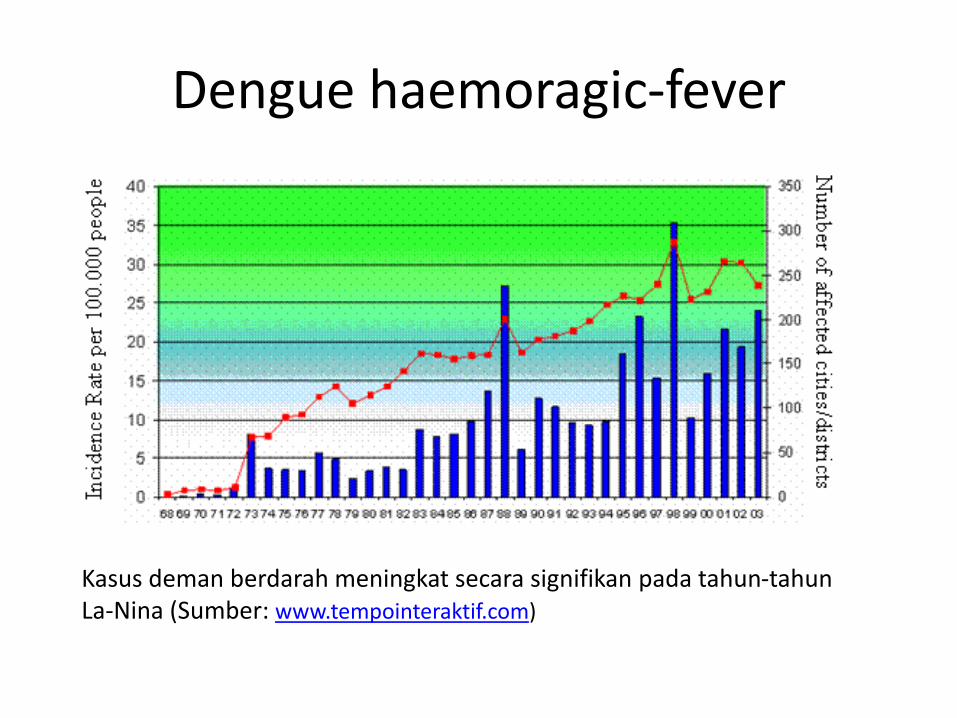
Dengue haemoragic-fever
Kasus deman berdarah meningkat secara signifikan pada tahun-tahun La-Nina (Sumber: www.tempointeraktif.com)

0
2
4
6
8
10
1950 1960 1970 1980 1990 2000 2010 2020 2030 2040 2050
Population (billions)
Africa Asia and Oceania
Europe Latin America and Caribbean
North America
World Population
0
100
200
300
400
500
600
700
1945 1955 1965 1975 1985 1995
Cars Buses and Trucks
Life Style
At the Origin of the Problem
Economic
Growth
Energy
Consumption
Energy System
Is C-based GHG
Human
Societies

Factors/aspects involved:
Biophysical: natural, ecological systems
Socio-economic: behavioral, cultural, social systems
Organizational & institutional: including legal aspects
Political aspects

INDONESIAN CONTEXT:
• Population growth (annual rate of 1,49%, 2000-2010) reach up
the Indonesia population in 2010 to about 236,7 million people
• Increasing the needs of water.
• The increasing needs are ironically followed by the
decreasing of water availability especially due to
decreasing water quality.
• These are caused by individuals and in grouped human
behaviors and accelerated by the government policies which
were actually expected to regulate the individuals and groups
behavior to create the appropriate water supply-demand balance,
but in facts many cases reversibly toward decreasing water
supply.
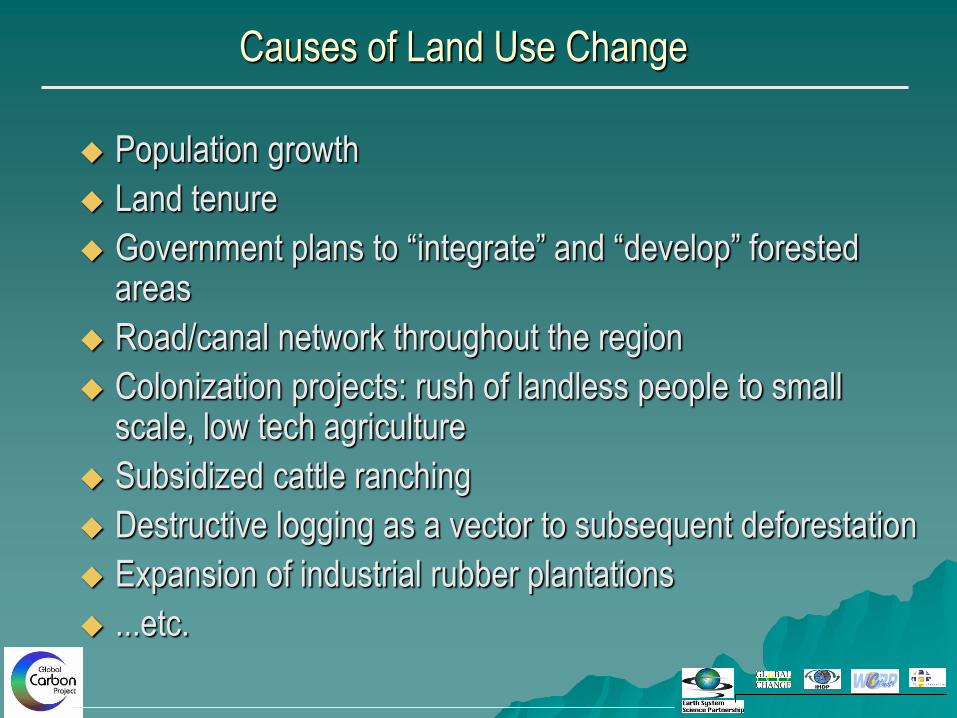
Causes of Land Use Change
Population growth
Land tenure
Government plans to “integrate” and “develop” forested areas
Road/canal network throughout the region
Colonization projects: rush of landless people to small scale, low tech agriculture
Subsidized cattle ranching
Destructive logging as a vector to subsequent deforestation
Expansion of industrial rubber plantations
...etc.
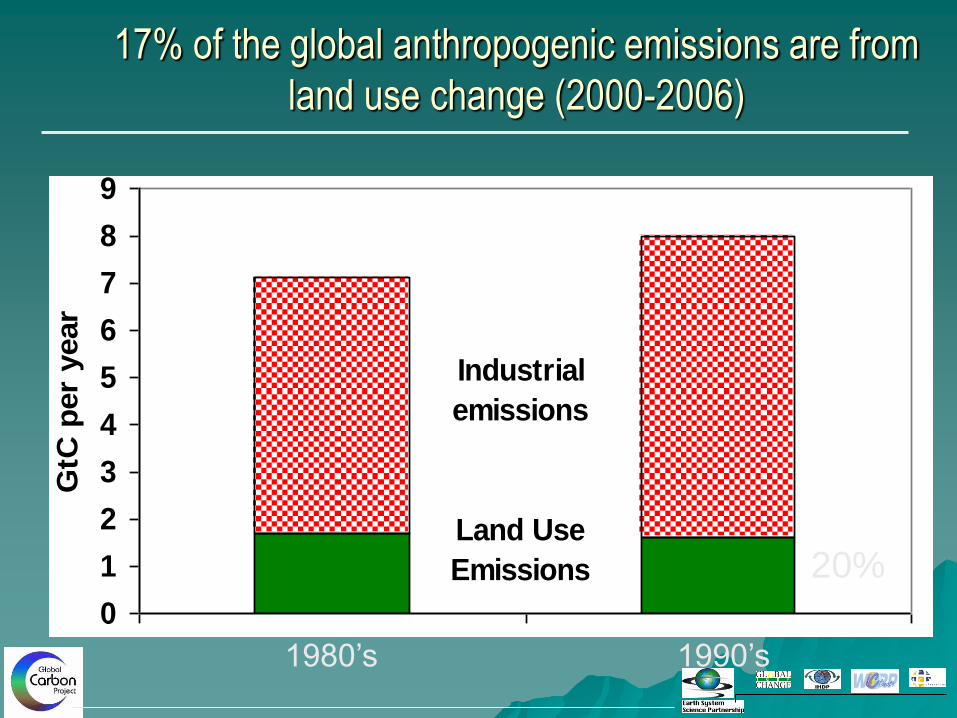
Where atmospheric CO2 comes from
0
1
2
3
4
5
6
7
8
9
1980-89 1990-99
GtC
per
year
Industrial
emissions
Land Use
Emissions
1980’s 1990’s
17% of the global anthropogenic emissions are from
land use change (2000-2006)
20%

1840 1860 1880 1900 1920 1940 1960 1980 2000
Year
1.4
1.2
1.0
0.8
0.6
0.4
0.2
0.0
Land Use Change
[50% of Global]
Houghton and Hackler 1999
Fossil Fuel
[3% of Global]
Annual Net C Emissions in South and Southeast Asia (Pg)

More fertilizer: (N)
More food, but more pollution too
0
20
40
60
80
100
120
140
160
1961 1966 1971 1976 1981 1986 1991
(mill
ion
met
ric
ton
s)
Africa
Asia
South and Central America
Europe
North America
Oceania
World

Severity of soil degradation in South and Southeast Asia
Source: ISRIC/UNEP/FAO 1997
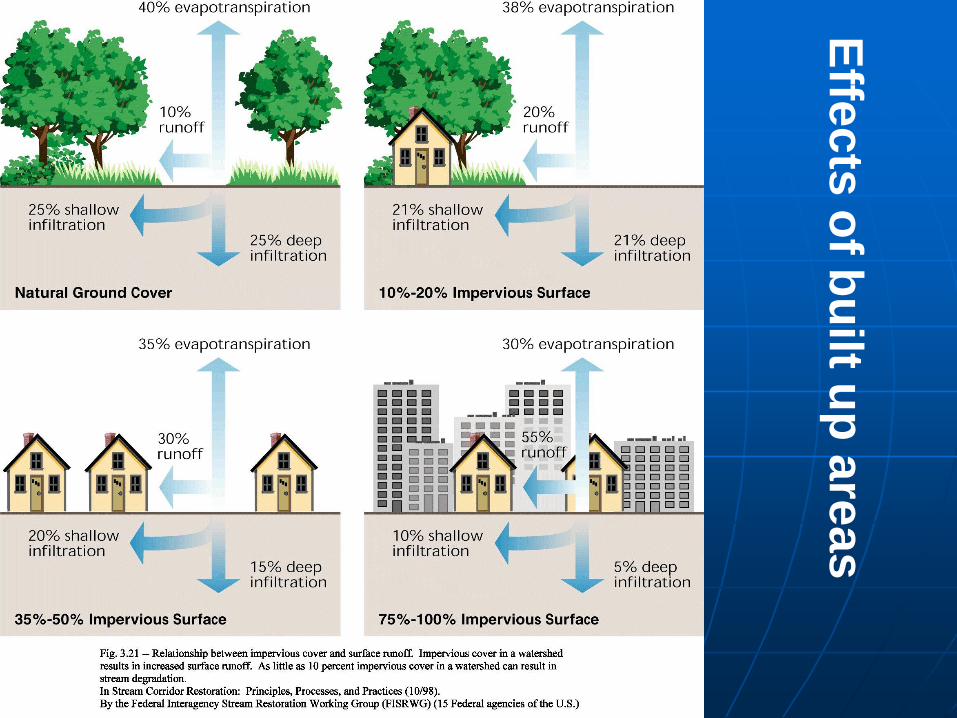
Effe
cts
of b
uilt u
p a
rea
s
„…to be sustainable humanity
must live within nature’s carrying capacity”
“National natural capital accounting with the ecological footprint
concept”, Wackernagel at al. 1999 Ecological Econimics 29

TOWARD SUSTAINABLE
WATERSHEDS
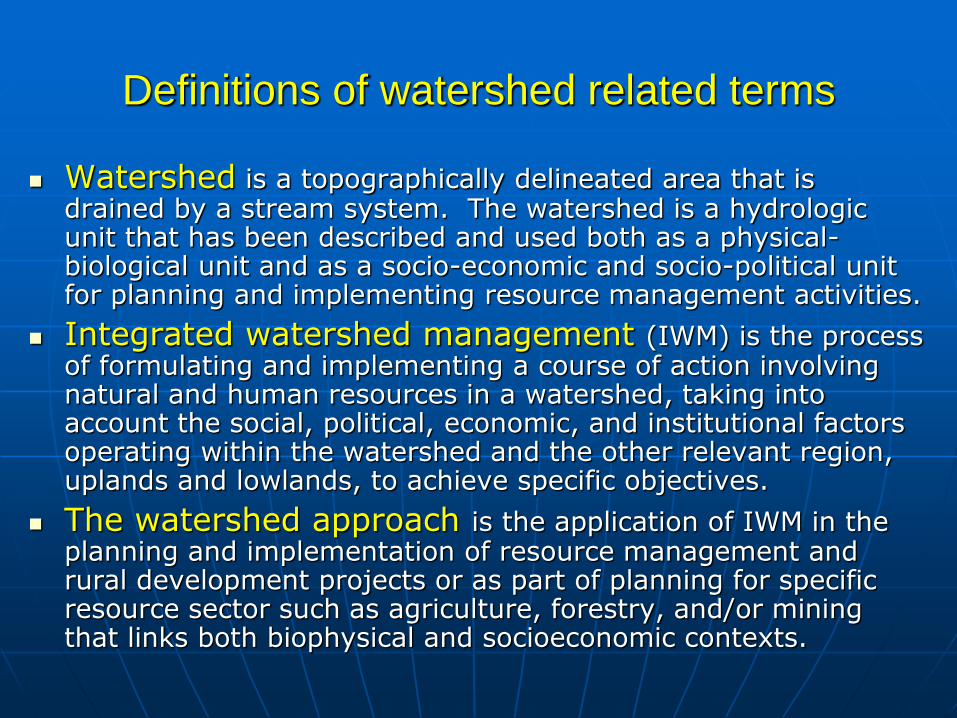
Definitions of watershed related terms
Watershed is a topographically delineated area that is drained by a stream system. The watershed is a hydrologic unit that has been described and used both as a physical-biological unit and as a socio-economic and socio-political unit for planning and implementing resource management activities.
Integrated watershed management (IWM) is the process of formulating and implementing a course of action involving natural and human resources in a watershed, taking into account the social, political, economic, and institutional factors operating within the watershed and the other relevant region, uplands and lowlands, to achieve specific objectives.
The watershed approach is the application of IWM in the planning and implementation of resource management and rural development projects or as part of planning for specific resource sector such as agriculture, forestry, and/or mining that links both biophysical and socioeconomic contexts.

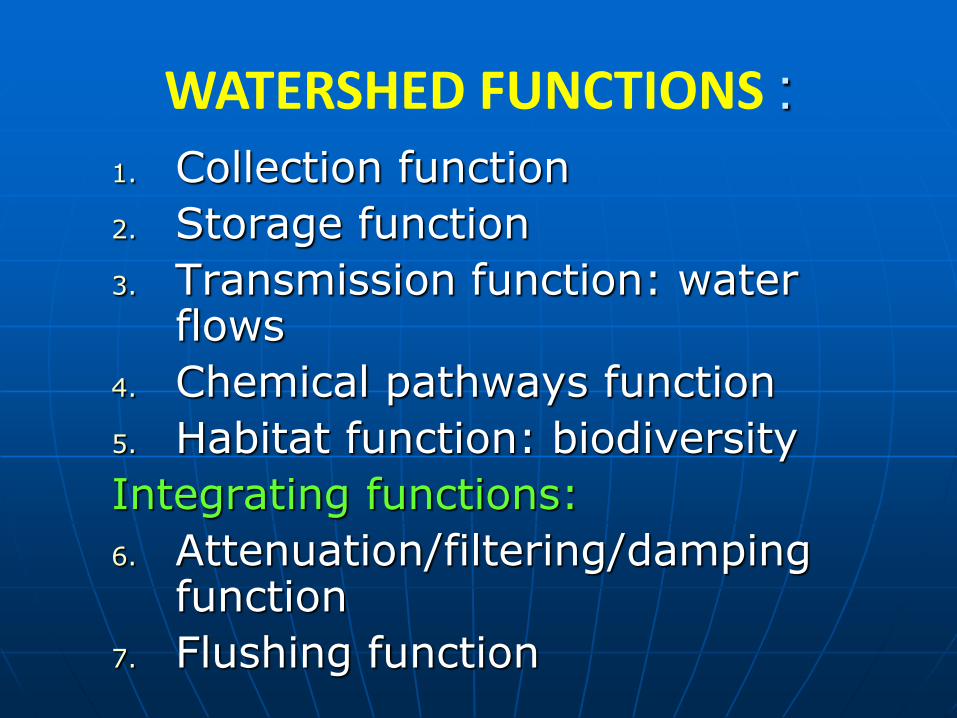
WATERSHED FUNCTIONS :
1. Collection function
2. Storage function
3. Transmission function: water flows
4. Chemical pathways function
5. Habitat function: biodiversity
Integrating functions:
6. Attenuation/filtering/damping function
7. Flushing function
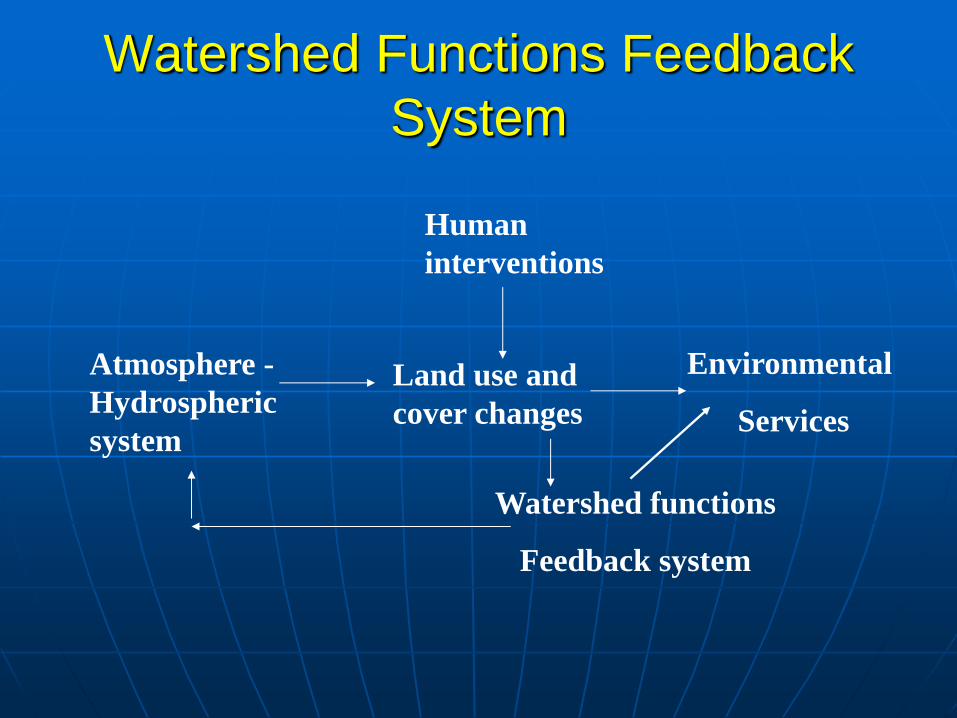
Watershed Functions Feedback
System
Land use and
cover changes
Human
interventions
Atmosphere -
Hydrospheric
system
Watershed functions
Feedback system
Environmental
Services
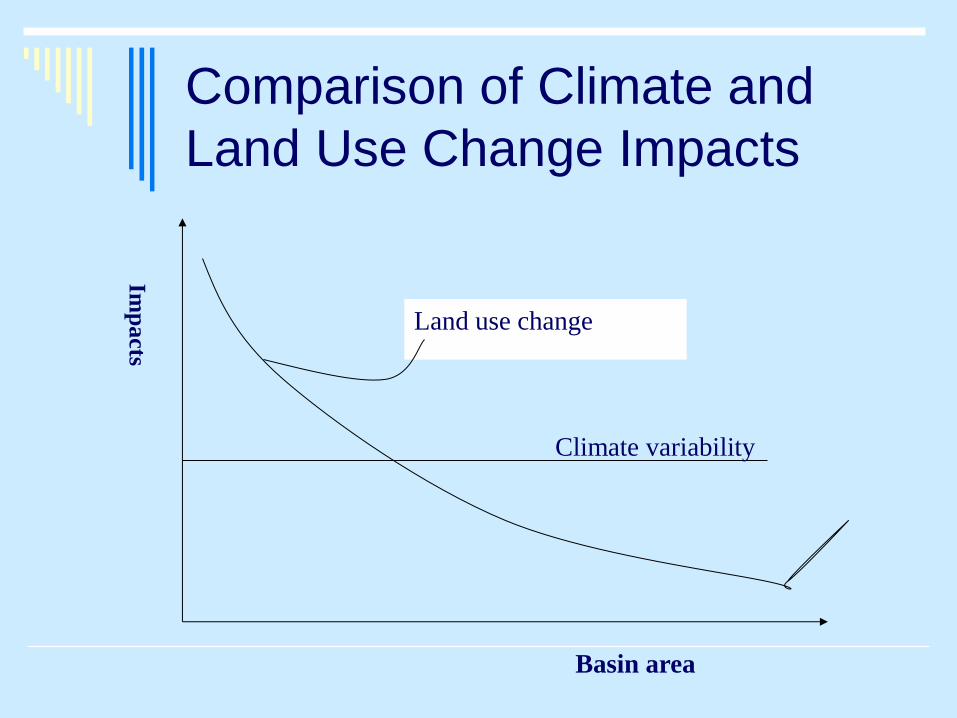
Comparison of Climate and
Land Use Change Impacts
Basin area
Imp
acts
Land use change
Climate variability
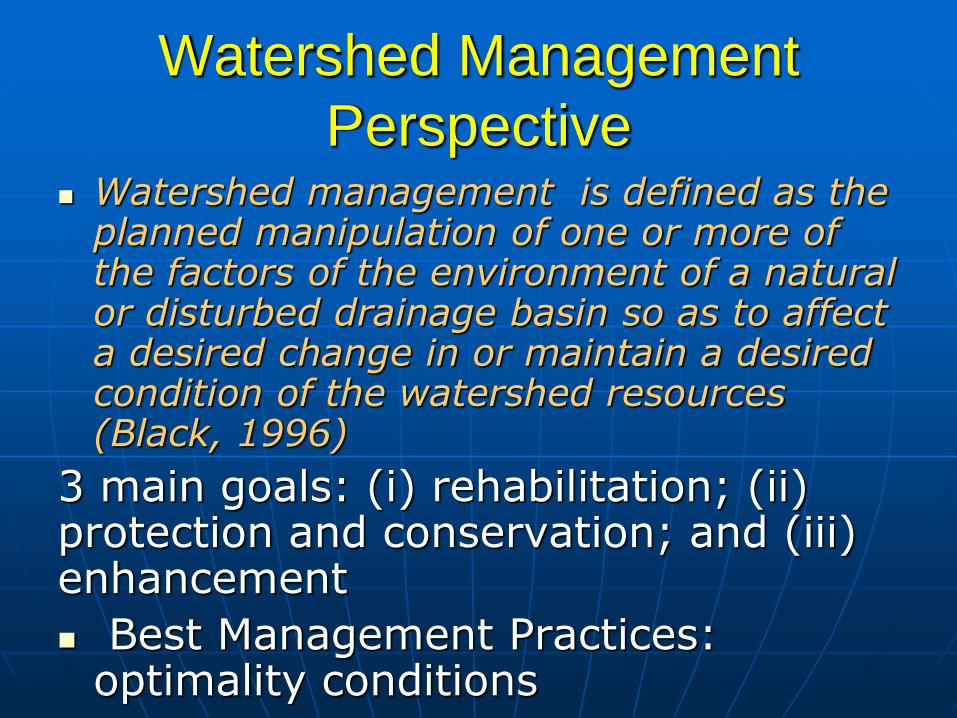
Watershed Management
Perspective Watershed management is defined as the
planned manipulation of one or more of the factors of the environment of a natural or disturbed drainage basin so as to affect a desired change in or maintain a desired condition of the watershed resources (Black, 1996)
3 main goals: (i) rehabilitation; (ii) protection and conservation; and (iii) enhancement
Best Management Practices: optimality conditions

Several types of reforestation are now
being practiced in the tropics
• Large scale (>1000 ha) industrial plantations covering one or more watersheds. – Clear felled after short rotations of <10 years (e.g. for pulpwood).
OR
– Clear felled after 20-40 years (e.g. for sawlogs)
• Small scattered farm woodlots or plantations covering <5 ha. – These form just one component of the landscape mosaic
• Natural forest regrowth – protected from further disturbances; this varies in age, biodiversity, tree cover. – in some cases these might be enriched with commercially
valuable species
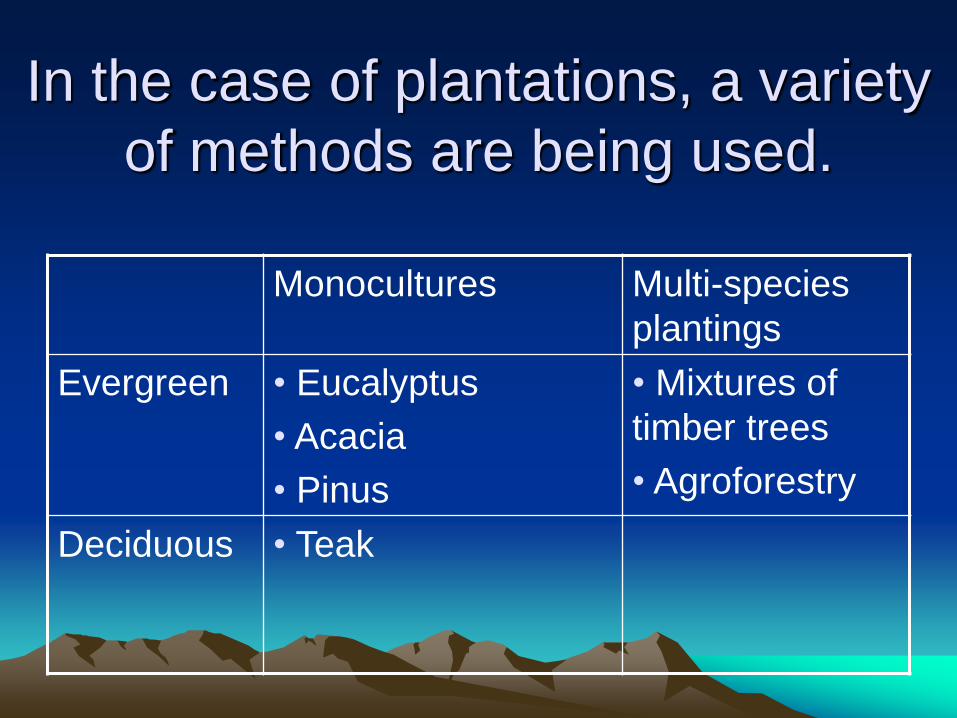
In the case of plantations, a variety
of methods are being used.
Monocultures Multi-species
plantings
Evergreen • Eucalyptus
• Acacia
• Pinus
• Mixtures of
timber trees
• Agroforestry
Deciduous • Teak
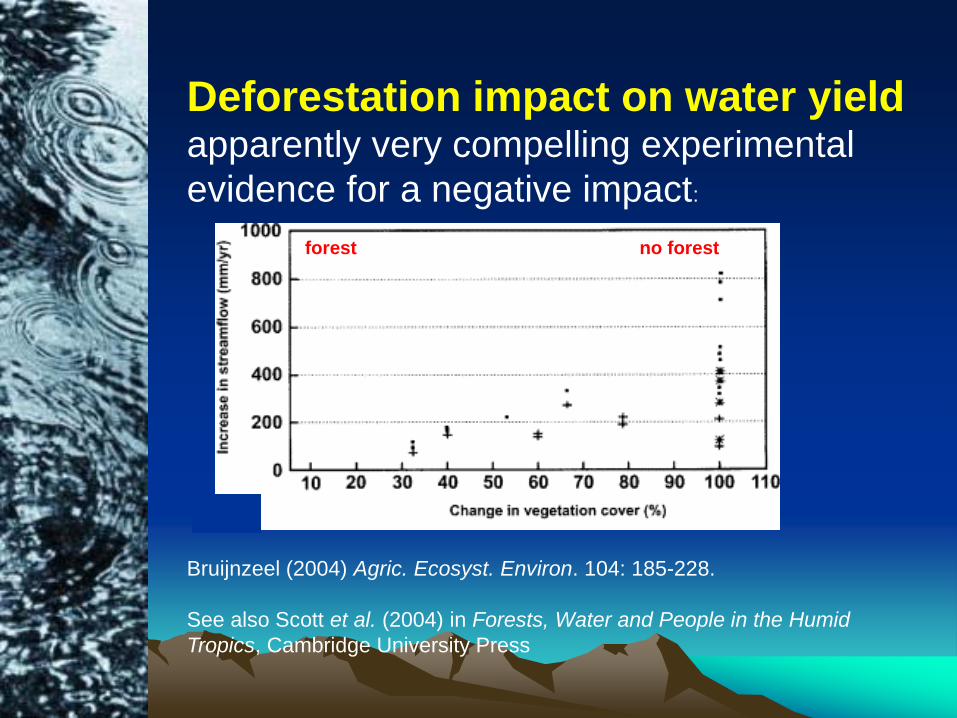
Deforestation impact on water yield apparently very compelling experimental
evidence for a negative impact:
Bruijnzeel (2004) Agric. Ecosyst. Environ. 104: 185-228.
See also Scott et al. (2004) in Forests, Water and People in the Humid
Tropics, Cambridge University Press
First 3yrs after tropical forest clearance forest no forest

AGENDA FOR ACTION
TOWARDS SUSTAINABLE
WATERSHEDS: NEEDS OF
INTEGRATION

Environmental Sciences and Management
Pollution and overexploitation of natural
resources
Degradation of evolutionary developed
biogeochemical cycles, energy flow and water circulation
Technical Sciences and Management
- an urgent need for reduction of energy, matter consumption and wastes per GNP -
ECOHYDROLOGY –integrative science - restitution of water, energy and nutrients pathways in degraded ecosystems - enhancement of ecosystem Carrying Capacity against human impact
The major threats to the environment
Sustainable Development
Ecoefficiency & Factor four

FUNCTION
MEASURES:
• production
• rehabilitation
• protection
• chemical
pathways/flushing
•Habitat/biodiversities
•Attenuation
Watershed management:
manipulating the hydrosphere &
biosphere to guarantee sustainability
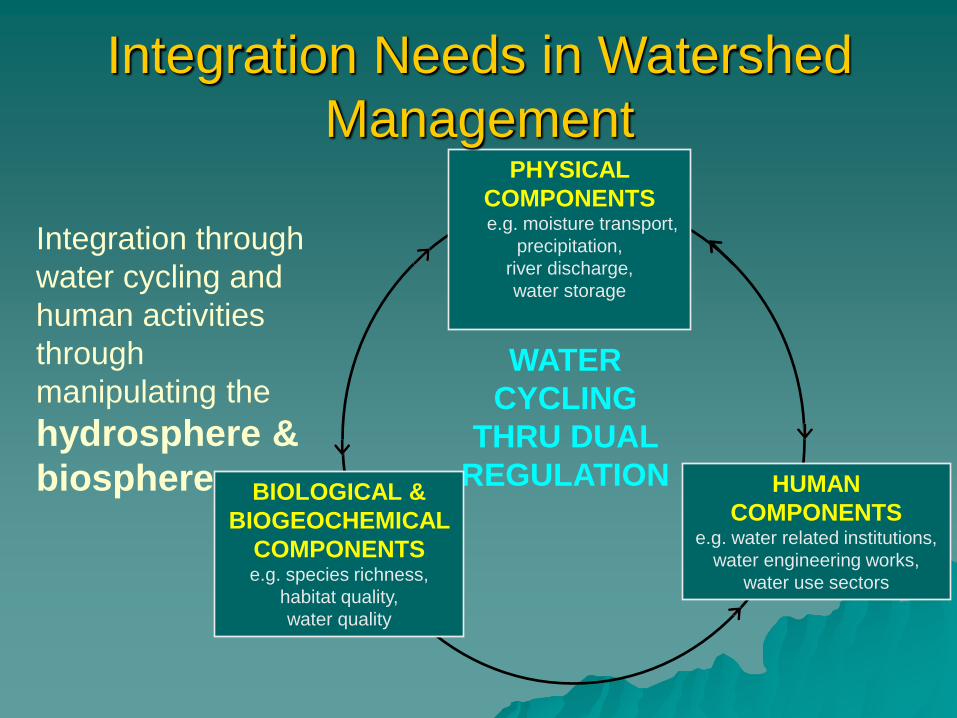
HUMAN
COMPONENTS e.g. water related institutions,
water engineering works,
water use sectors
WATER
CYCLING
THRU DUAL
REGULATION
PHYSICAL
COMPONENTS e.g. moisture transport,
precipitation,
river discharge,
water storage
BIOLOGICAL &
BIOGEOCHEMICAL
COMPONENTS e.g. species richness,
habitat quality,
water quality
Integration through
water cycling and
human activities
through
manipulating the
hydrosphere &
biosphere
Integration Needs in Watershed
Management
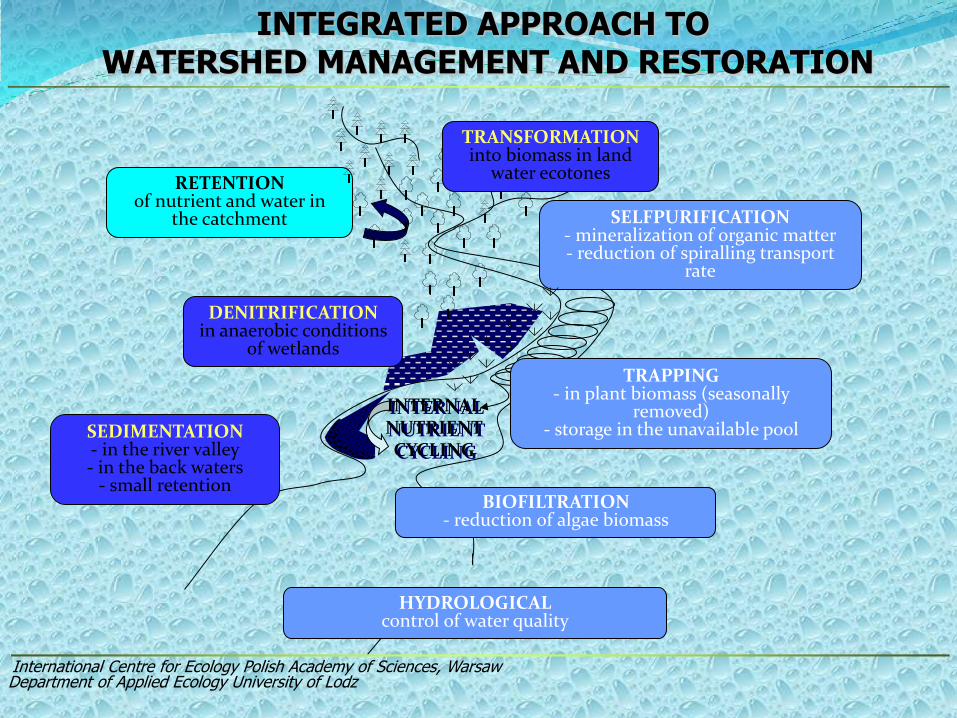
RETENTION of nutrient and water in
the catchment
DENITRIFICATION in anaerobic conditions
of wetlands
TRAPPING - in plant biomass (seasonally
removed) - storage in the unavailable pool SEDIMENTATION
- in the river valley - in the back waters
- small retention BIOFILTRATION
- reduction of algae biomass
HYDROLOGICAL control of water quality
SELFPURIFICATION - mineralization of organic matter - reduction of spiralling transport
rate
TRANSFORMATION into biomass in land
water ecotones
INTEGRATED APPROACH TO WATERSHED MANAGEMENT AND RESTORATION
International Centre for Ecology Polish Academy of Sciences, Warsaw Department of Applied Ecology University of Lodz
INTERNAL NUTRIENT CYCLING

CONVERSION OF WATER POLLUTANTS INTO BIOMASS AND IT’S USE FOR CONVERSION OF PLASTIC WATSES INTO ENERGY
Example for a Sustainable Development Tool
employment
opportunities
Sewage treatment
plant
sewage
Plastic waste 20-100kg/capita/year
reduction of fossil fuel use decrease of CO2 emission
CO2 assimilation
& plastics recycling technology
constructed wetland
- willow plantation POLYMER ENERGY
TECHNOLOGY
ENERGY-
hydrocarbons
Improvement of environment quality
plastic recycling
biomass = bioenergy for domestic use
PHYTOTECHNOLOGY IMPROVEMENT OF
WATER QUALITY
CITY
WATER
International Centre for Ecology Polish Academy of Sciences, Warsaw Department of Applied Ecology University of Lodz
Bogor Agricultural University
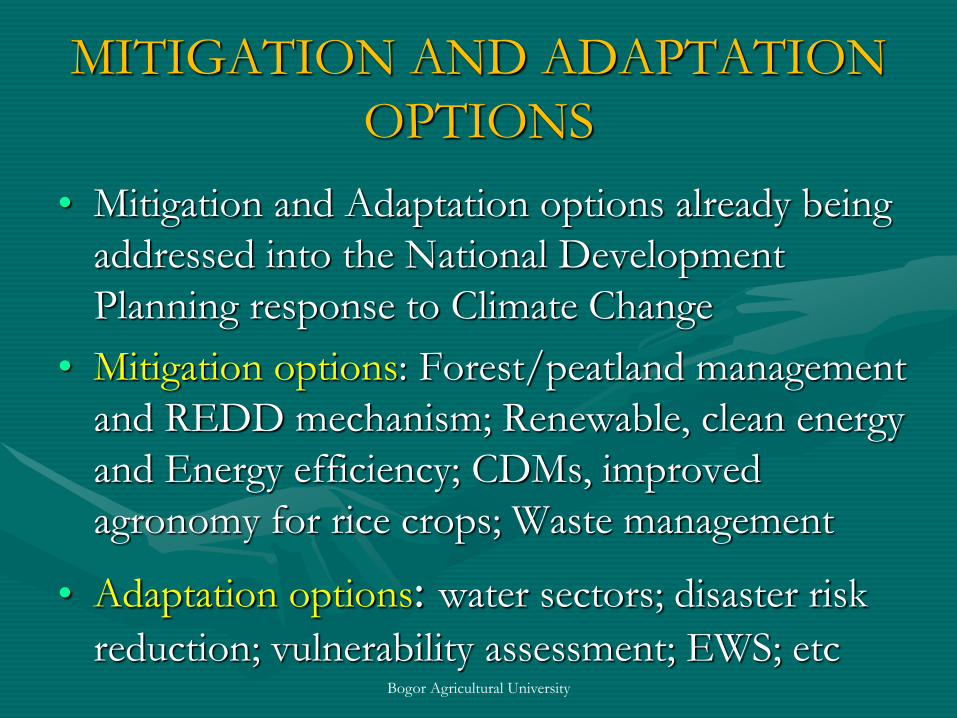
MITIGATION AND ADAPTATION
OPTIONS
• Mitigation and Adaptation options already being
addressed into the National Development
Planning response to Climate Change
• Mitigation options: Forest/peatland management
and REDD mechanism; Renewable, clean energy
and Energy efficiency; CDMs, improved
agronomy for rice crops; Waste management
• Adaptation options: water sectors; disaster risk
reduction; vulnerability assessment; EWS; etc

Bogor Agricultural University
Water Sector Adaptation Programs
• Capacity building – Through knowledge improvement of water managers in
using climate information to manage climate risks
• Technology Transfer – Through construction of effective early warning system
using space technology, radar, etc.
• Framework and methods to determine impacts, vulnerability and necessary adaptation efforts
• Setting up standard and criteria for structural and infrastructures planning, and spatial planning that proof adaptable to possible climate change

Changes in climate and climate variability
On-going programs and actions to address
current climate risks
Changes in population, land use and socio-economic conditions
Needs for Adaptation to address future
climate risks
4 1
5
2 3
Strategy: National Action Plan on Climate Change (the RAN-PI)
Program: The ICCAP
Projects: Pilots, research activities
Less
on
lear
nt
and
b
est
pra
ctic
es
Lesson
learnt an
d
best p
ractices
Policy: Presidential Regulation
Bogor Agricultural University
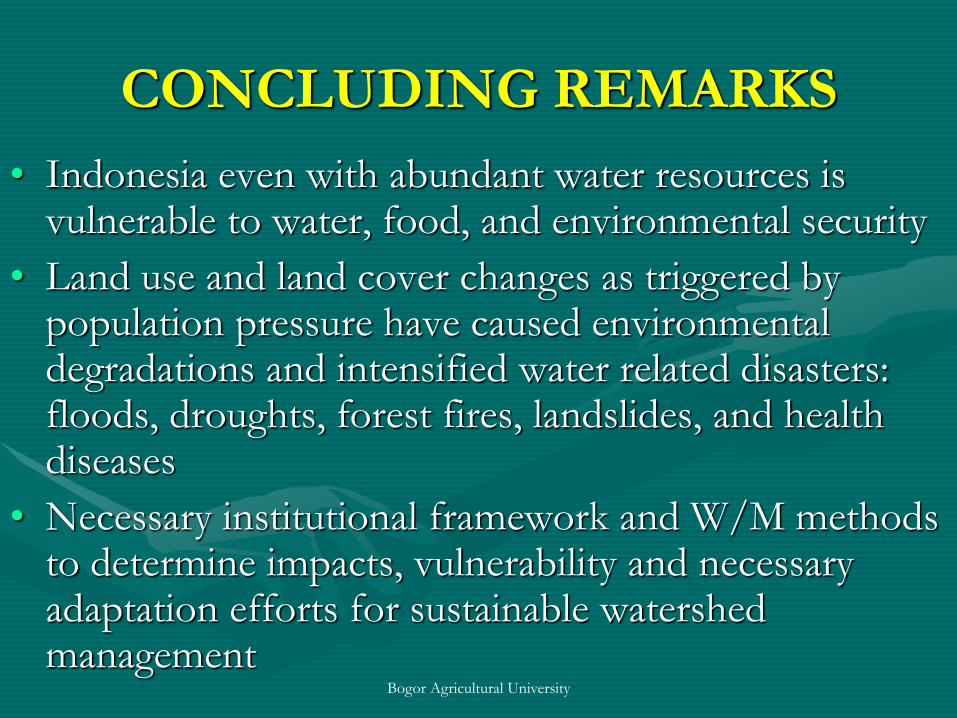
CONCLUDING REMARKS
• Indonesia even with abundant water resources is vulnerable to water, food, and environmental security
• Land use and land cover changes as triggered by population pressure have caused environmental degradations and intensified water related disasters: floods, droughts, forest fires, landslides, and health diseases
• Necessary institutional framework and W/M methods to determine impacts, vulnerability and necessary adaptation efforts for sustainable watershed management

Bogor Agricultural University
THANK YOU
TERIMA KASIH