understanding california home sellers presented by carmen hirciag, mba senior research analyst 1
TRANSCRIPT
1
UNDERSTANDING CALIFORNIA HOME SELLERSPresented byCarmen Hirciag, MBASenior Research Analyst
2
CA HOUSING MARKET

Sales of Existing Detached HomesMar. 2015: 391,680 Units (+2.3% YTD, +7.3% YTY)
Jan-
05
Jul-0
5
Jan-
06
Jul-0
6
Jan-
07
Jul-0
7
Jan-
08
Jul-0
8
Jan-
09
Jul-0
9
Jan-
10
Jul-1
0
Jan-
11
Jul-1
1
Jan-
12
Jul-1
2
Jan-
13
Jul-1
3
Jan-
14
Jul-1
4
Jan-
15 -
100,000
200,000
300,000
400,000
500,000
600,000
700,000
*Sales are seasonally adjusted and annualized SERIES: Sales of Existing Single Family HomesSOURCE: CALIFORNIA ASSOCIATION OF REALTORS®
Mar-15: 391,680
Mar-14: 365,120
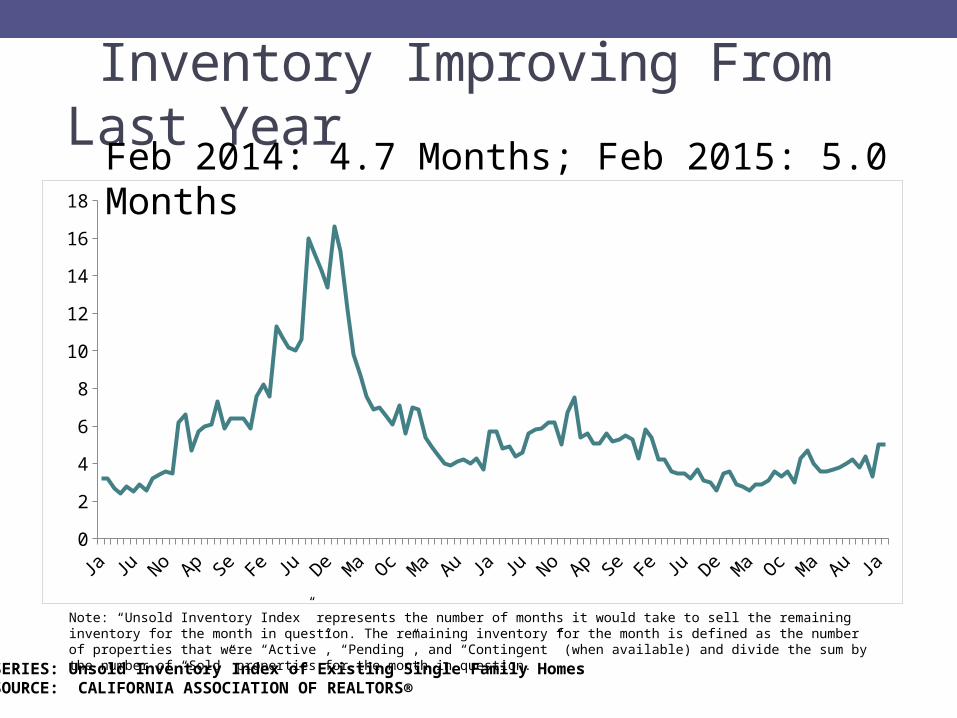
Inventory Improving From Last Year
Feb 2014: 4.7 Months; Feb 2015: 5.0 Months
Note: “Unsold Inventory Index” represents the number of months it would take to sell the remaining inventory for the month in question. The remaining inventory for the month is defined as the number of properties that were “Active”, “Pending”, and “Contingent” (when available) and divide the sum by the number of “Sold” properties for the month in question.
0
2
4
6
8
10
12
14
16
18
SERIES: Unsold Inventory Index of Existing Single Family HomesSOURCE: CALIFORNIA ASSOCIATION OF REALTORS®
5
Methodology
• Telephone surveys conducted in October - November 2014 of 381 randomly selected home sellers who sold April – September 2014.

6
ABOUT THE HOME
7
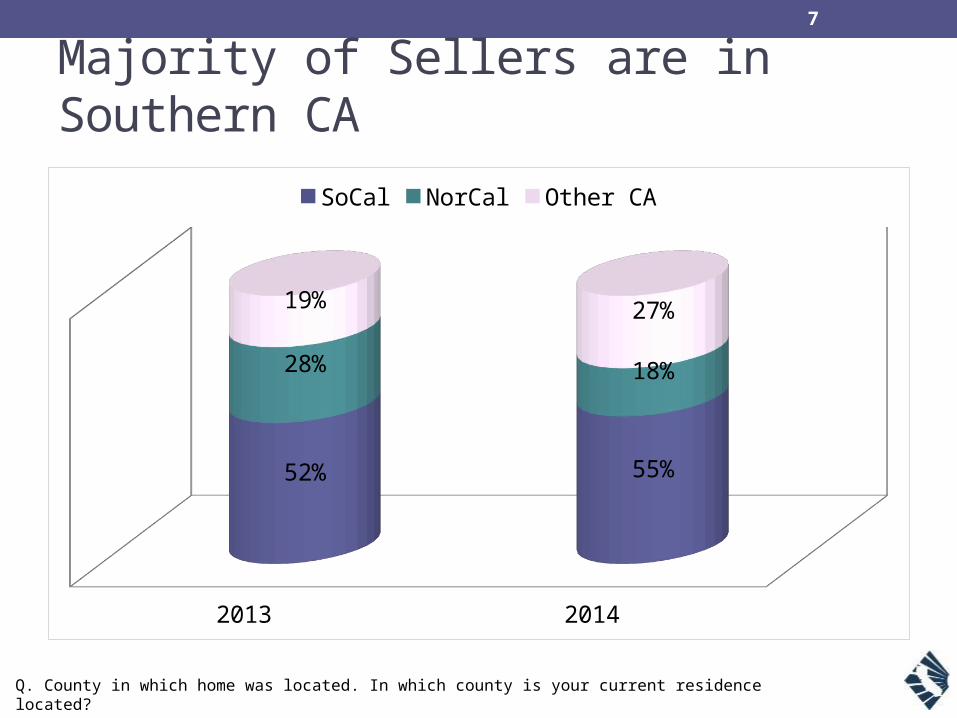
Majority of Sellers are in Southern CA
Q. County in which home was located. In which county is your current residence located?
2013 2014
52% 55%
28% 18%
19% 27%
SoCal NorCal Other CA
8
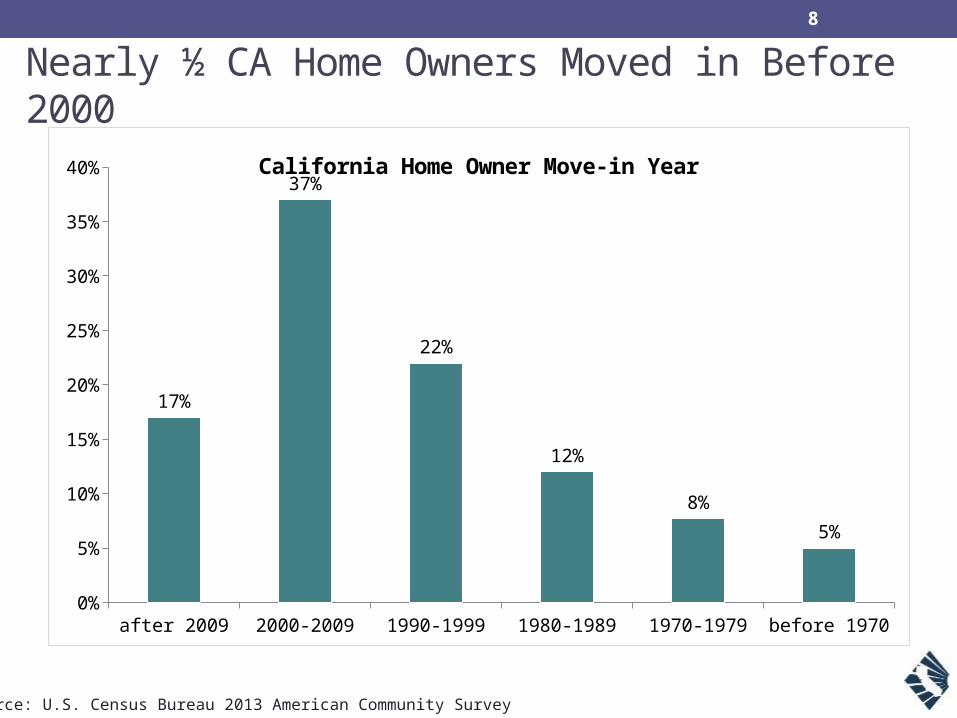
Nearly ½ CA Home Owners Moved in Before 2000
after 2009 2000-2009 1990-1999 1980-1989 1970-1979 before 19700%
5%
10%
15%
20%
25%
30%
35%
40%
17%
37%
22%
12%
8%
5%
California Home Owner Move-in Year
Source: U.S. Census Bureau 2013 American Community Survey
9
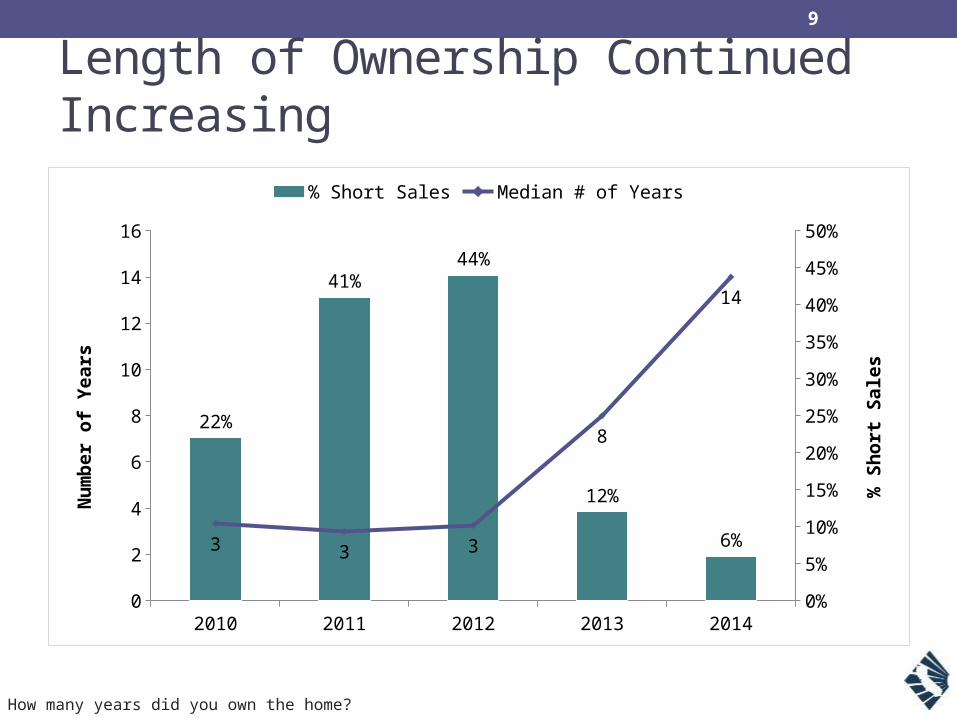
Length of Ownership Continued Increasing
2010 2011 2012 2013 20140
2
4
6
8
10
12
14
16
0%
5%
10%
15%
20%
25%
30%
35%
40%
45%
50%
22%
41%44%
12%
6%3 3 3
8
14
% Short Sales Median # of Years
Nu
mb
er
of
Ye
ars
% S
ho
rt S
ale
s
Q: How many years did you own the home?

10
Most Sales are Single Family Homes
Single-family
de-tached 86%
Condo/Town-home 12%
Other 2%
Q: What type of home was it?
11
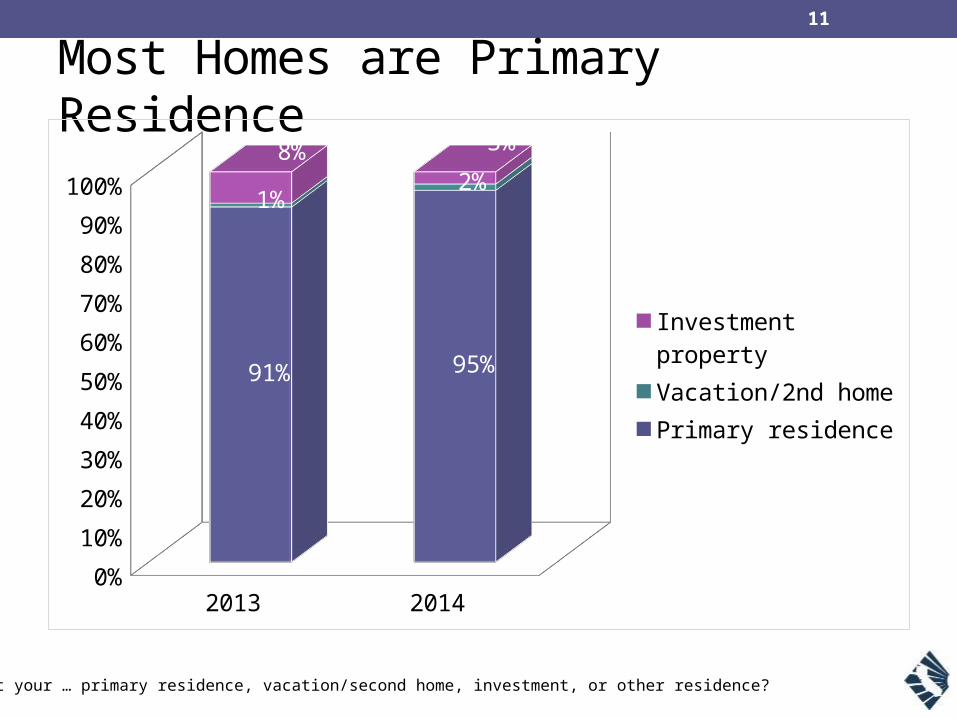
Most Homes are Primary Residence
Q: Was it your … primary residence, vacation/second home, investment, or other residence?
2013 20140%
10%
20%
30%
40%
50%
60%
70%
80%
90%
100%
91% 95%
1%2%
8% 3%
Investment propertyVacation/2nd homePrimary residence

12
Average Listing Price vs. Average Sale Price
2009 2010 2011 2012 2013 2014$0
$100,000
$200,000
$300,000
$400,000
$500,000
$600,000
$700,000
Listing Price Sale Price
13
THE SELLING PROCESS

14
Change in Family Status is #1 Reason for Selling
Q: What was your primary reason for selling your home?
Retirement
Desired larger home
Downsizing
Desired better/other location
Change in family status
0.0%
5.0%
10.0
%
15.0
%
20.0
%
25.0
%
30.0
%
35.0
%
4.5%
5.8%
13.6%
21.5%
31.8%
15
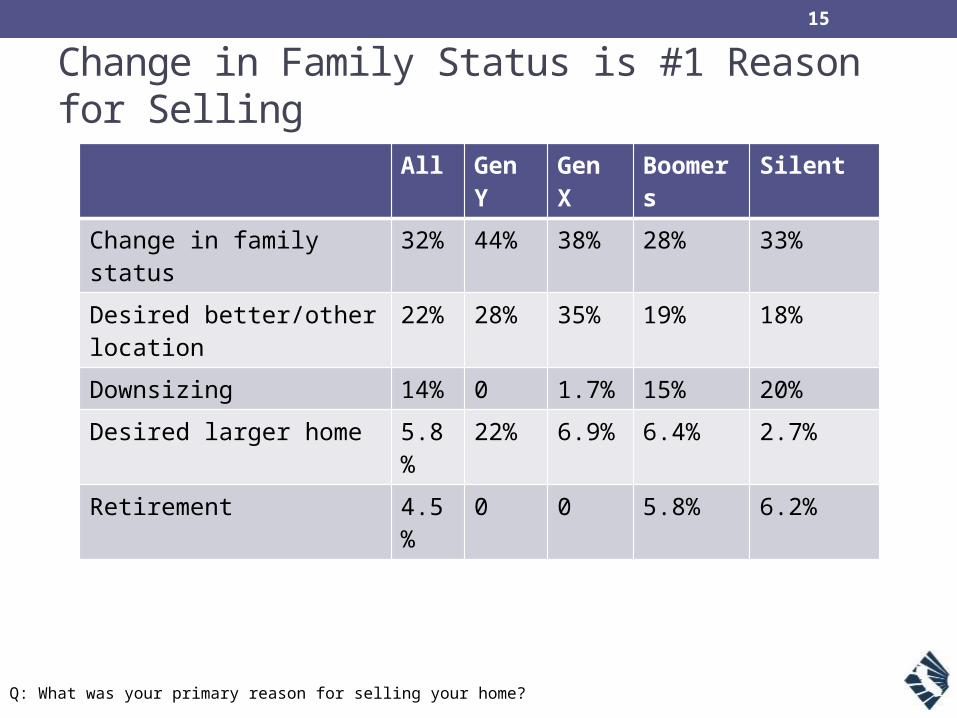
Change in Family Status is #1 Reason for Selling
Q: What was your primary reason for selling your home?
All Gen Y
Gen X
Boomers
Silent
Change in family status 32% 44% 38% 28% 33%
Desired better/other location
22% 28% 35% 19% 18%
Downsizing 14% 0 1.7% 15% 20%
Desired larger home 5.8%
22% 6.9% 6.4% 2.7%
Retirement 4.5%
0 0 5.8% 6.2%

16
62% of Sellers Received Multiple Offers
1 2 3 4 5+0%
5%
10%
15%
20%
25%
30%
35%32%
21% 20%
8%
14%
Q: How many offers did you receive from buyers?

17
Sellers Received 3.3 Offers on Average
2012 2013 20140.0
1.0
2.0
3.0
4.0
5.0
6.0
3.1
5.9
3.3
Q: How many offers did you receive from buyers?

18
Majority of Homes Were on the Market 4 Weeks or Less
< 1 1-4 5-8 9-12 10-12 13+0%
10%
20%
30%
40%
50%
60%
12%
51%
16%
6%
12%
3%
Weeks on Market
Q: How many weeks was your home listed on the market prior to the opening of a successful escrow?

19
Decline in Average Weeks on Market Reflects Tight Inventory
2005 2006 2007 2008 2009 2010 2011 2012 2013 20141.0
6.0
11.0
16.0
21.0
26.0
31.0
3.3
10.7
14.0
20.5
25.627.4
29.2
26.0
8.57.0
Average Weeks
Q: How many weeks was your home listed on the market prior to the opening of a successful escrow?
20
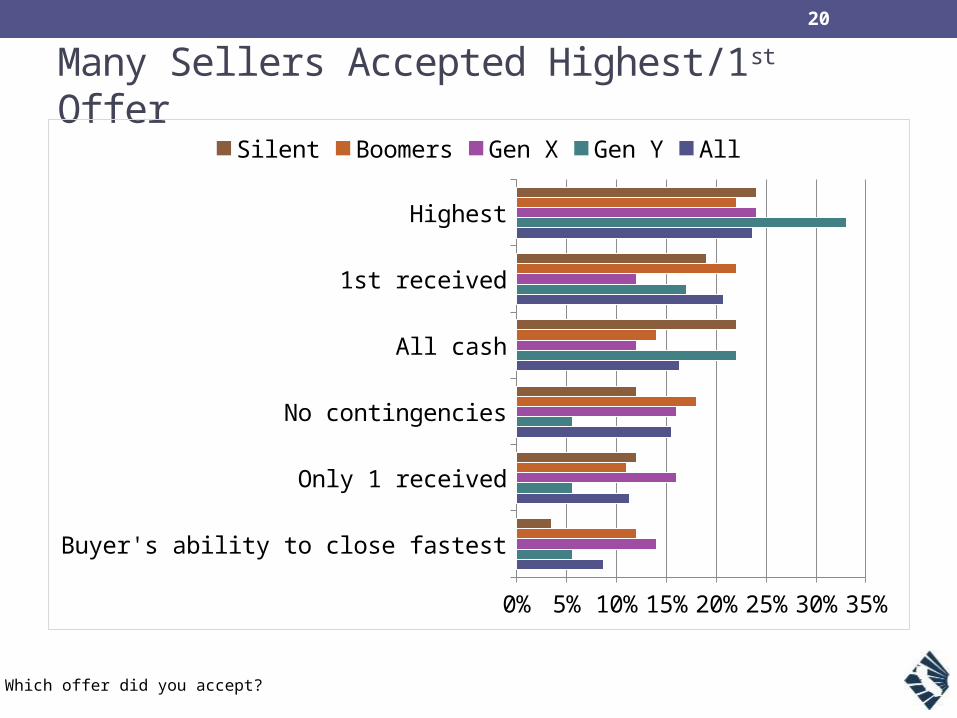
Many Sellers Accepted Highest/1st Offer
Q: Which offer did you accept?
Buyer's ability to close fastest
Only 1 received
No contingencies
All cash
1st received
Highest
0% 5% 10% 15% 20% 25% 30% 35%
Silent Boomers Gen X Gen Y All

21
1/2 Sellers Would Not Change Anything
Q: If there was one thing you could change about your recent home sale, what would it be?
Get more money for the house (7.9%)
List at higher price (6.6%)
Get a better/different agent (4.7%)
Not have to sell (4.2%)
Nothing, I wouldn’t change anything (50%)
22
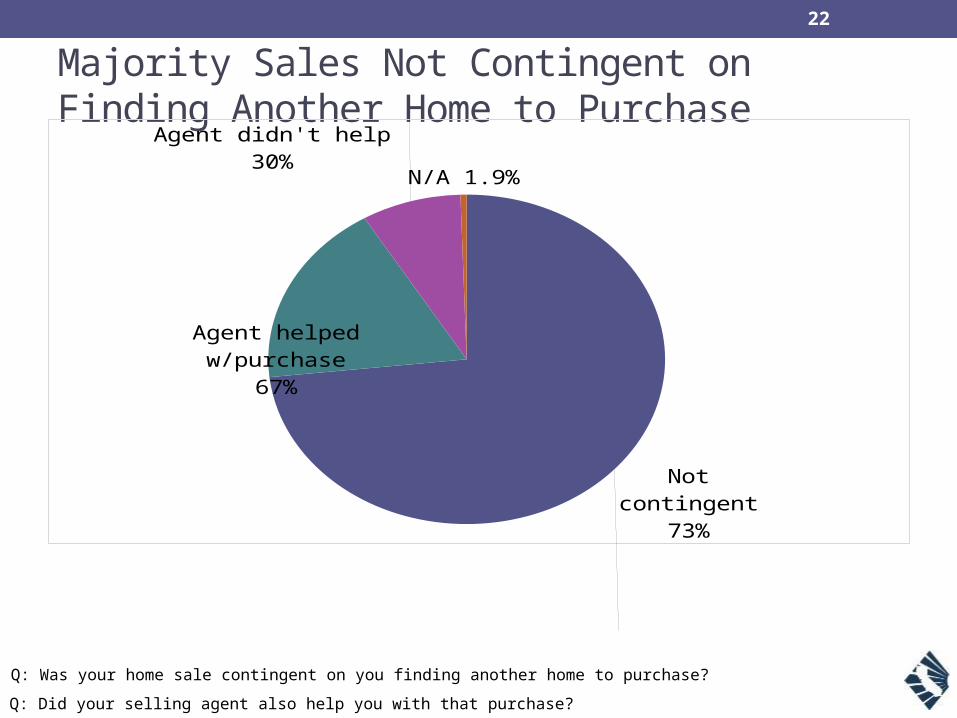
Majority Sales Not Contingent on Finding Another Home to Purchase
Q: Did your selling agent also help you with that purchase?
Not contingent 73%
Agent helped w/purchase
67%
Agent didn't help 30%
N/A 1.9%
Q: Was your home sale contingent on you finding another home to purchase?
23
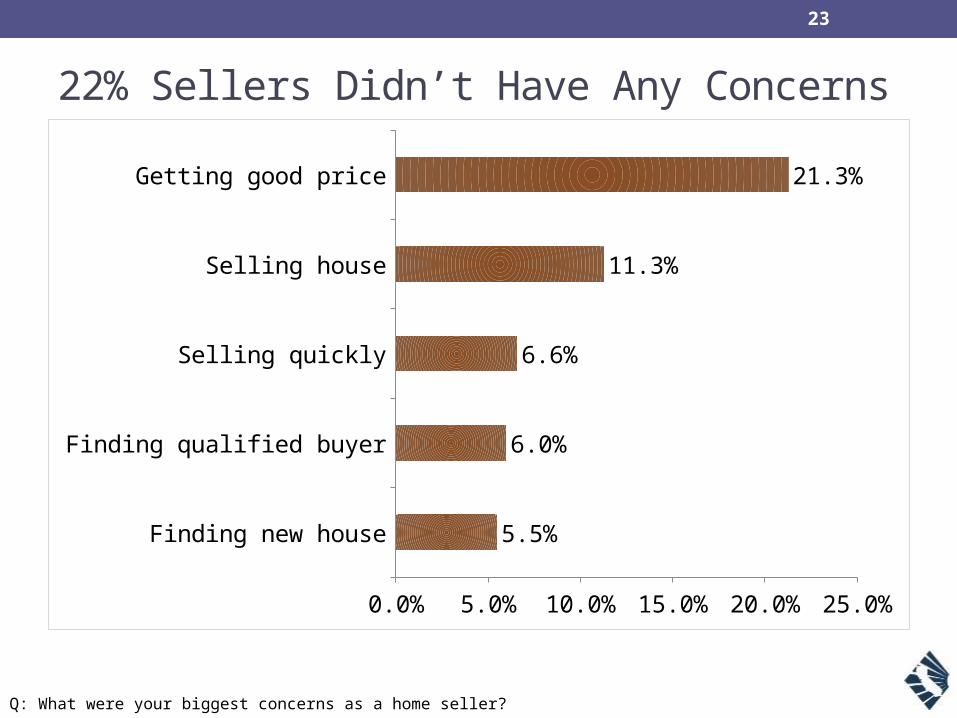
22% Sellers Didn’t Have Any Concerns
Finding new house
Finding qualified buyer
Selling quickly
Selling house
Getting good price
0.0% 5.0% 10.0% 15.0% 20.0% 25.0%
5.5%
6.0%
6.6%
11.3%
21.3%
Q: What were your biggest concerns as a home seller?

24
Technology Use

25
Most Useful Websites for Sellers
Q: What was the most useful website you visited during your home selling process?
26
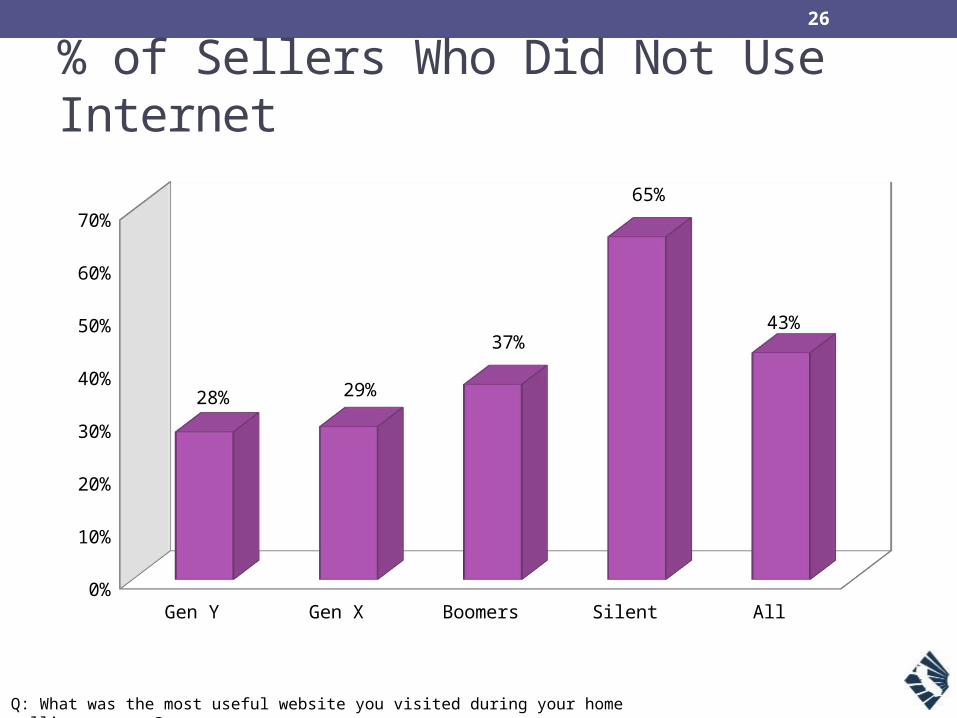
% of Sellers Who Did Not Use Internet
Gen Y Gen X Boomers Silent All0%
10%
20%
30%
40%
50%
60%
70%
28% 29%
37%
65%
43%
Q: What was the most useful website you visited during your home selling process?
27
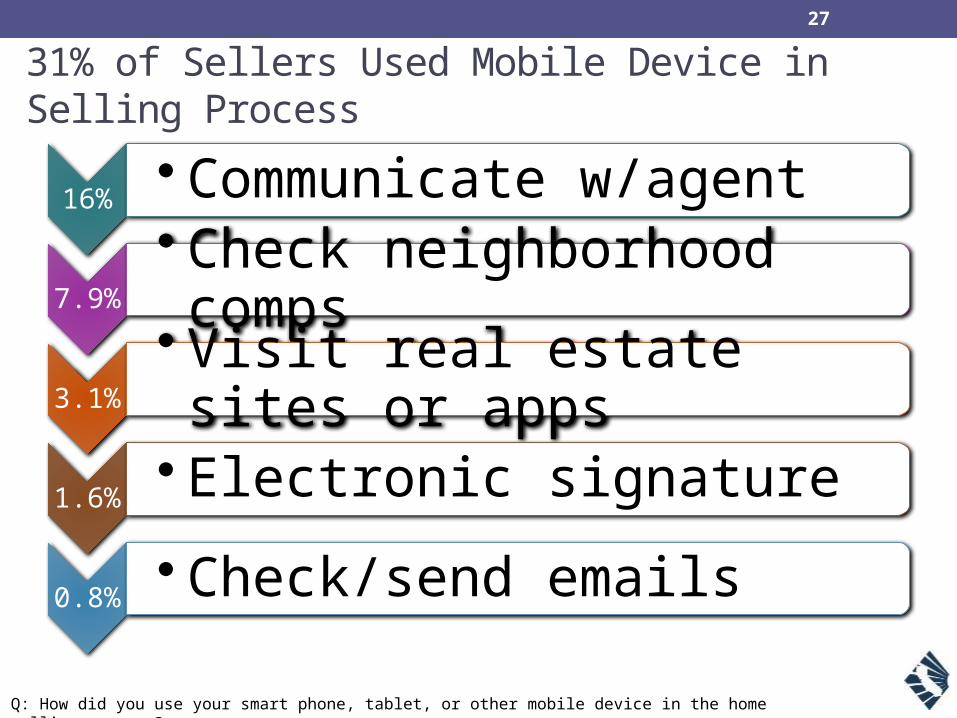
31% of Sellers Used Mobile Device in Selling Process
Q: How did you use your smart phone, tablet, or other mobile device in the home selling process?
16%
• Communicate w/agent
7.9%
• Check neighborhood comps
3.1%
• Visit real estate sites or apps
1.6%
• Electronic signature
0.8%
• Check/send emails

28
14% of Sellers Googled their Agents
2012 2013 20140%
10%
20%
30%
40%
50%
60%52%
60%
14%
Q: Did you Google your agent?

29
Most Sellers Didn’t Check Agent’s Online Ratings
Q: Did you check your agent’s online ratings by prior clients?
Checked rat-ings 16%
Didn't check ratings 83%
Unsure/can't remember
2%
30
16% of Sellers Checked Agent’s Online Ratings
Q: Which websites did you check for agent ratings?

31
SELLERS WORKING WITH AGENTS

32
Majority of Sellers Found Agent by Referral/Personal Contact
Internet
Didn't use agent
Previous client
Personal contact
Referral
0% 10% 20% 30% 40% 50% 60%
Silent Boomers Gen X Gen Y All
Q. How did you find your real estate agent?
33
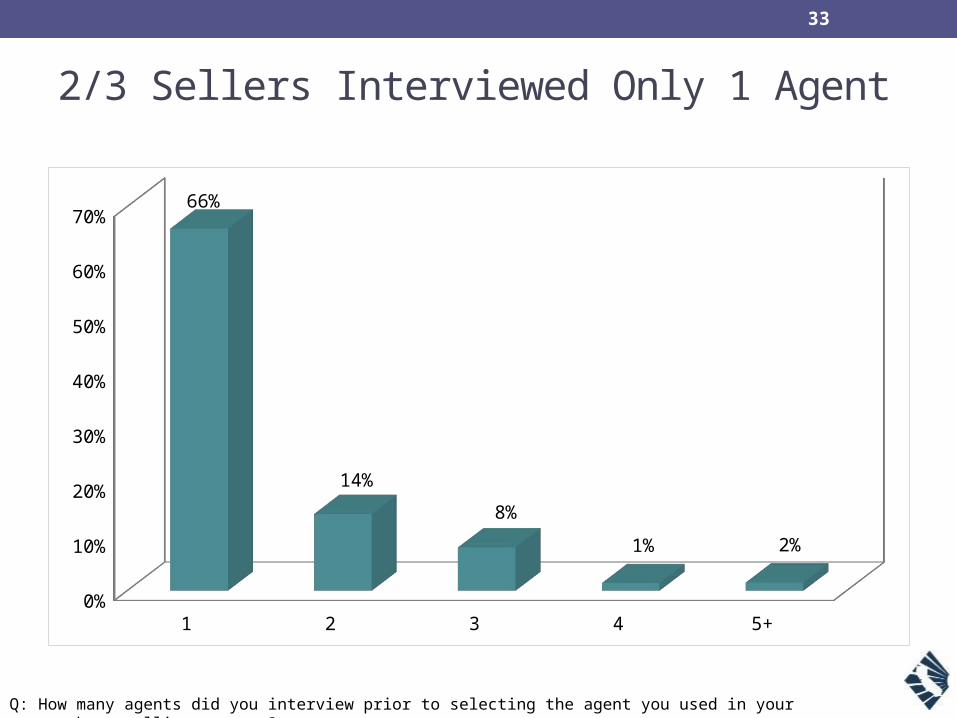
2/3 Sellers Interviewed Only 1 Agent
1 2 3 4 5+0%
10%
20%
30%
40%
50%
60%
70%66%
14%
8%
1% 2%
Q: How many agents did you interview prior to selecting the agent you used in your recent home selling process?

34
Sellers Interviewed Fewer Agents
2003 2004 2005 2006 2007 2008 2009 2010 2011 2012 2013 20140.0
1.0
2.0
3.0
4.0
5.0
6.0
7.0
2.3 2.2
3.13.5
4.4
5.4
6.2
5.0
3.5 3.6 3.5
1.5
Chart Title
Q: How many agents did you interview prior to selecting the agent you used in your recent home selling process?
35
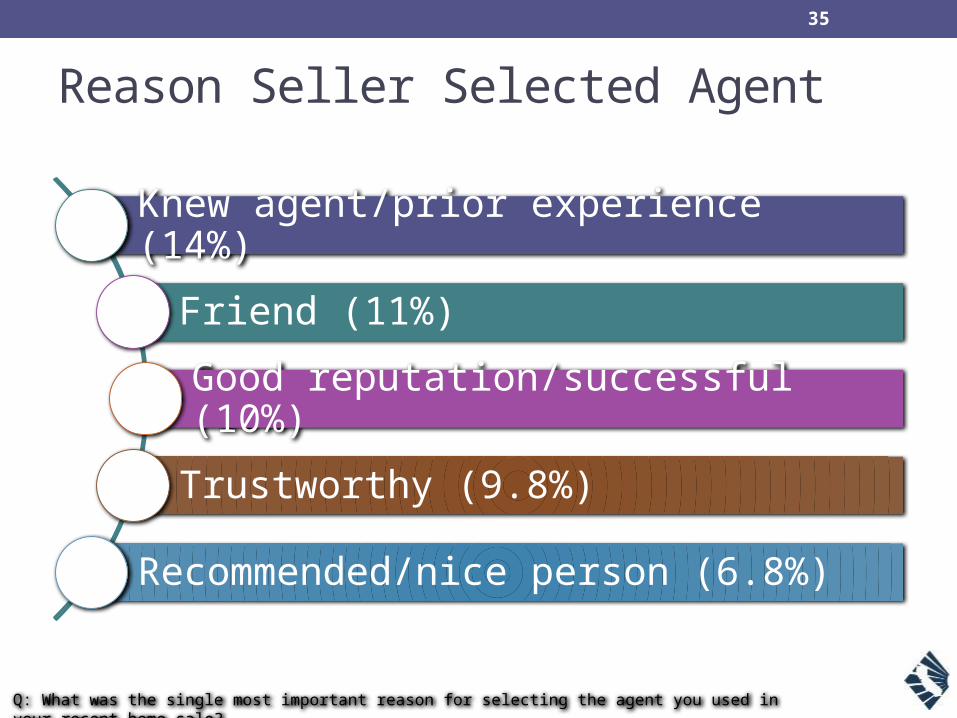
Reason Seller Selected Agent
Knew agent/prior experience (14%)
Friend (11%)
Good reputation/successful (10%)
Trustworthy (9.8%)
Recommended/nice person (6.8%)
Q: What was the single most important reason for selecting the agent you used in your recent home sale?
36
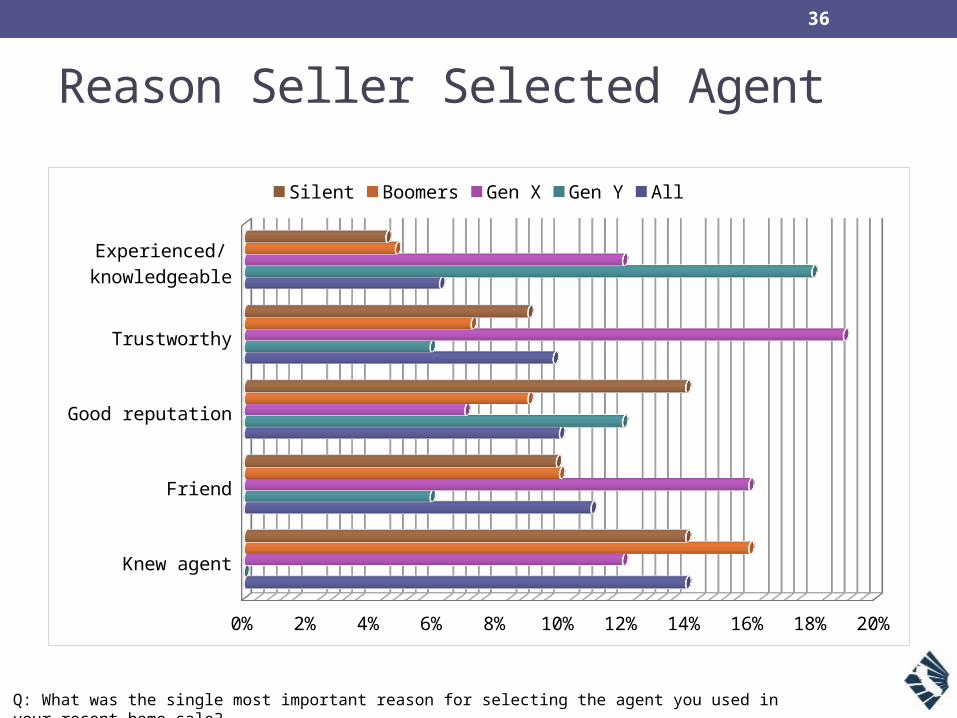
Reason Seller Selected Agent
Knew agent
Friend
Good reputation
Trustworthy
Experienced/knowledgeable
0% 2% 4% 6% 8% 10% 12% 14% 16% 18% 20%
Silent Boomers Gen X Gen Y All
Q: What was the single most important reason for selecting the agent you used in your recent home sale?
37
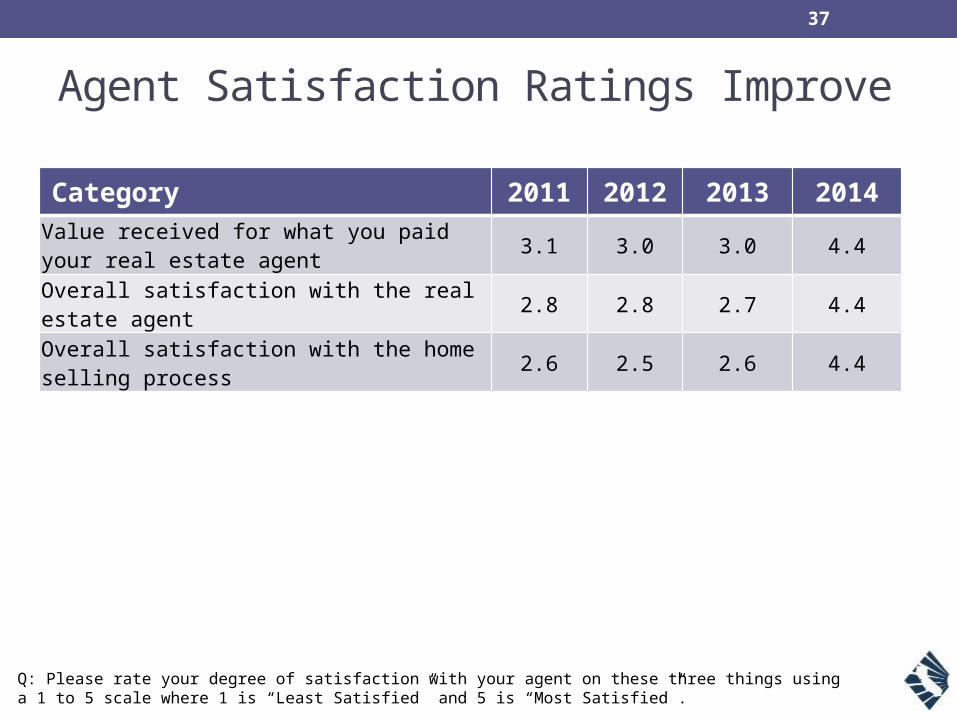
Agent Satisfaction Ratings Improve
Category2011
2012 2013 2014
Value received for what you paid your real estate agent 3.1 3.0 3.0 4.4
Overall satisfaction with the real estate agent 2.8 2.8 2.7 4.4
Overall satisfaction with the home selling process 2.6 2.5 2.6 4.4
Q: Please rate your degree of satisfaction with your agent for each of the following aspects on a scale of 1 to 5, where 1 is least satisfied and 5 is most satisfied. Q: Please rate your degree of satisfaction with your agent on these three things using a 1 to 5 scale where 1 is “Least Satisfied” and 5 is “Most Satisfied”.
38
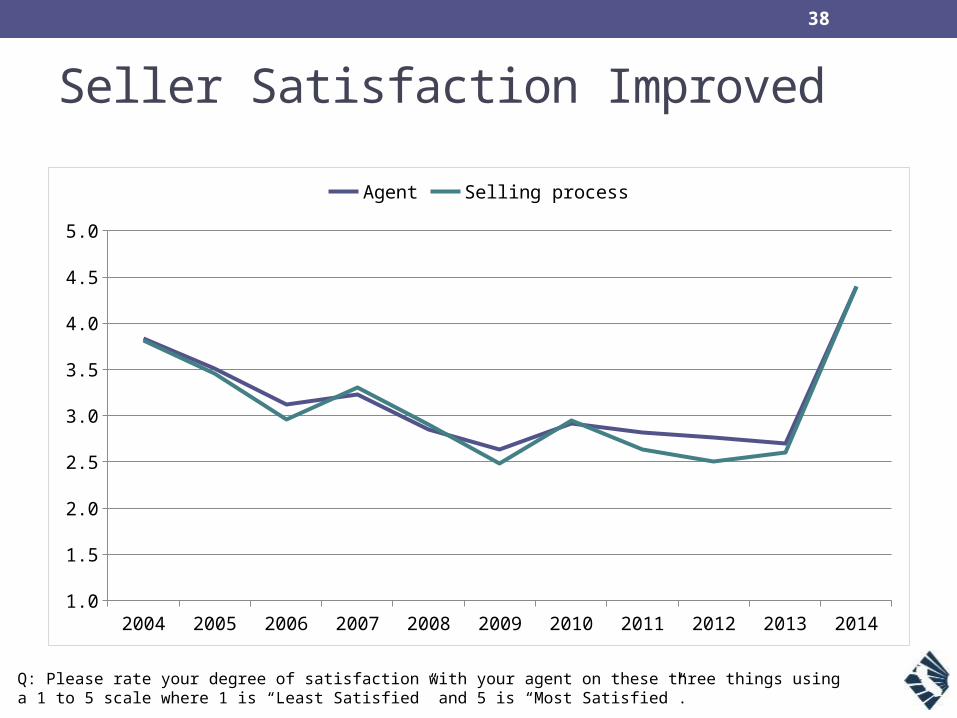
Seller Satisfaction Improved
2004 2005 2006 2007 2008 2009 2010 2011 2012 2013 20141.0
1.5
2.0
2.5
3.0
3.5
4.0
4.5
5.0
Agent Selling process
Q: Please rate your degree of satisfaction with your agent on these three things using a 1 to 5 scale where 1 is “Least Satisfied” and 5 is “Most Satisfied”.
39
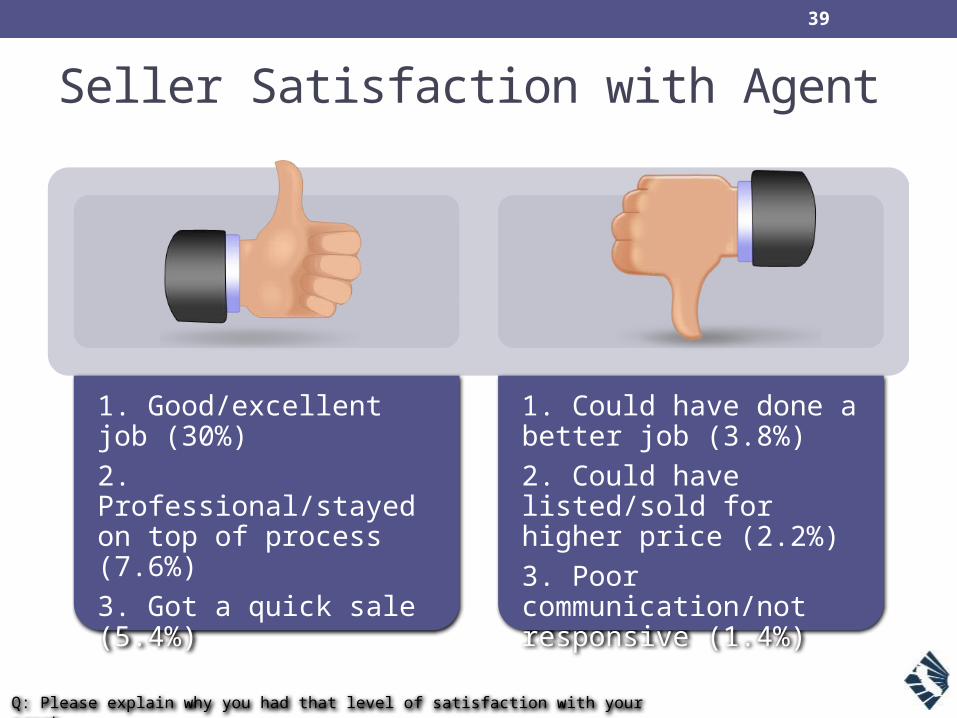
Seller Satisfaction with Agent
1. Good/excellent job (30%)2. Professional/stayed on top of process (7.6%)3. Got a quick sale (5.4%)
1. Could have done a better job (3.8%)2. Could have listed/sold for higher price (2.2%)3. Poor communication/not responsive (1.4%)
Q: Please explain why you had that level of satisfaction with your agent.
40
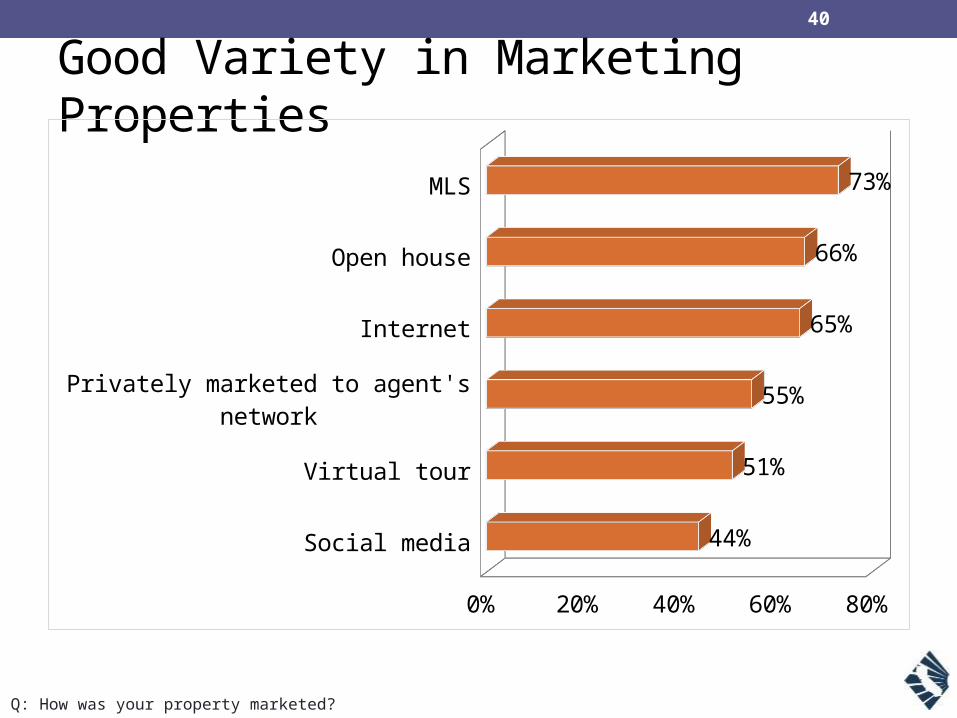
Good Variety in Marketing Properties
Q: How was your property marketed?
Social media
Virtual tour
Privately marketed to agent's network
Internet
Open house
MLS
0% 20% 40% 60% 80%
44%
51%
55%
65%
66%
73%

41
Agent / Seller Communication in Sync
In-person
Text messa
ge
Telephone
19%
12%11%
57%
22%
7%
13%
55% Preferred Actual
Q: What was the actual method of communication used most frequently with your agent?
Q: What was your preferred method of communication with your agent?
42
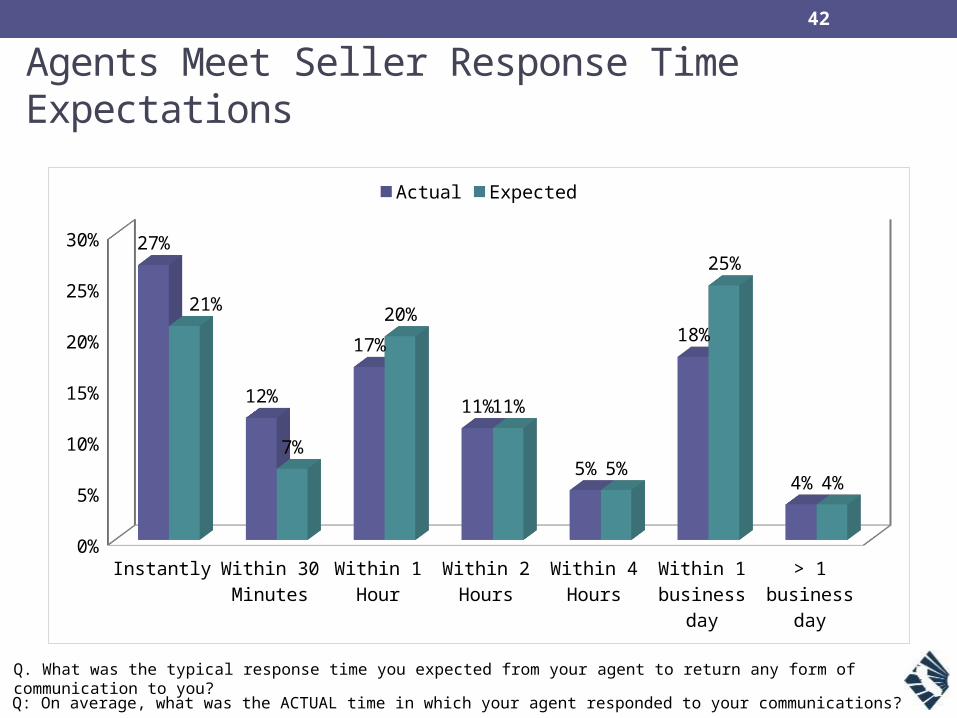
Agents Meet Seller Response Time Expectations
Instantly Within 30 Minutes
Within 1 Hour
Within 2 Hours
Within 4 Hours
Within 1 business
day
> 1 business
day
0%
5%
10%
15%
20%
25%
30% 27%
12%
17%
11%
5%
18%
4%
21%
7%
20%
11%
5%
25%
4%
Actual Expected
Q: On average, what was the ACTUAL time in which your agent responded to your communications?
Q. What was the typical response time you expected from your agent to return any form of communication to you?
43
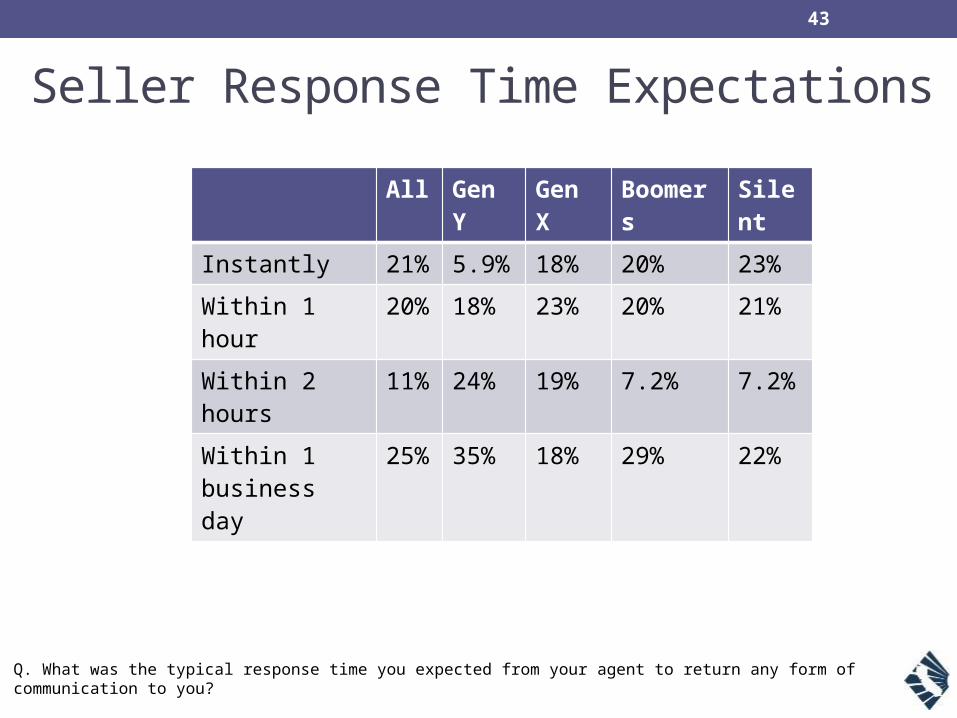
Seller Response Time Expectations
Q. What was the typical response time you expected from your agent to return any form of communication to you?
All Gen Y
Gen X
Boomers
Silent
Instantly 21%
5.9% 18% 20% 23%
Within 1 hour 20%
18% 23% 20% 21%
Within 2 hours
11%
24% 19% 7.2% 7.2%
Within 1 business day
25%
35% 18% 29% 22%
44
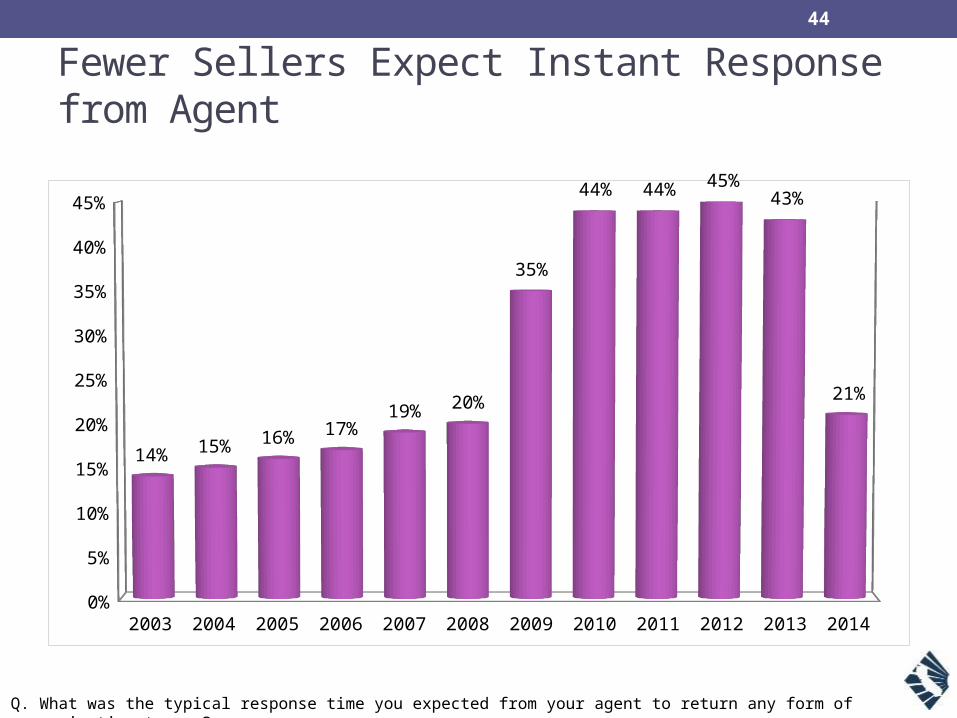
Q. What was the typical response time you expected from your agent to return any form of communication to you?
Fewer Sellers Expect Instant Response from Agent
2003 2004 2005 2006 2007 2008 2009 2010 2011 2012 2013 20140%
5%
10%
15%
20%
25%
30%
35%
40%
45%
14% 15% 16% 17%19% 20%
35%
44% 44% 45%43%
21%

45
FINANCING
46
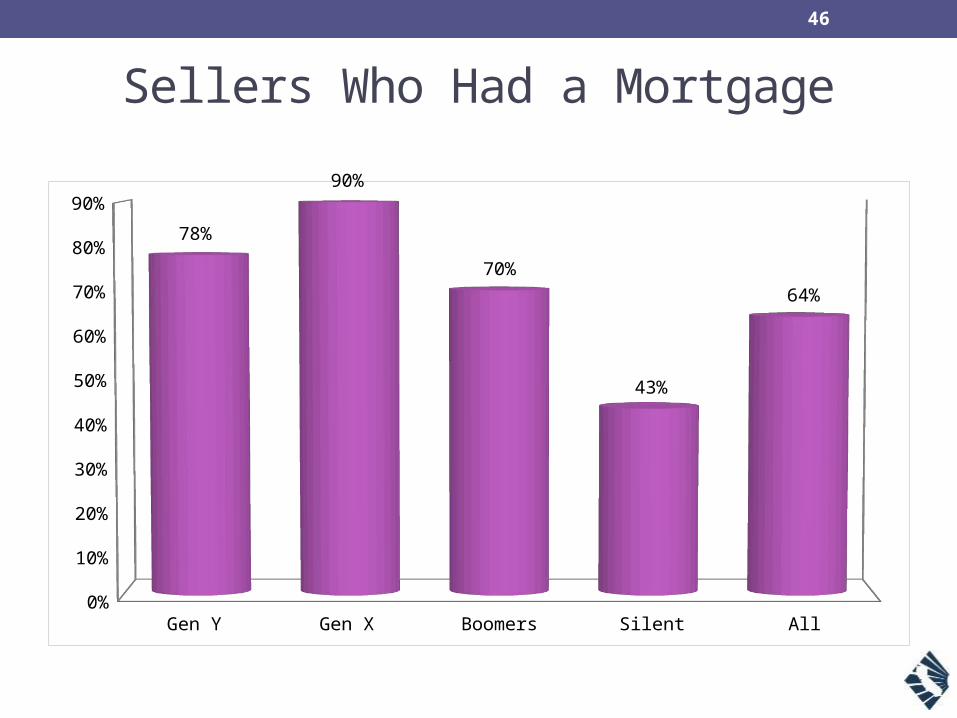
Sellers Who Had a Mortgage
Gen Y Gen X Boomers Silent All0%
10%
20%
30%
40%
50%
60%
70%
80%
90%
78%
90%
70%
43%
64%
47
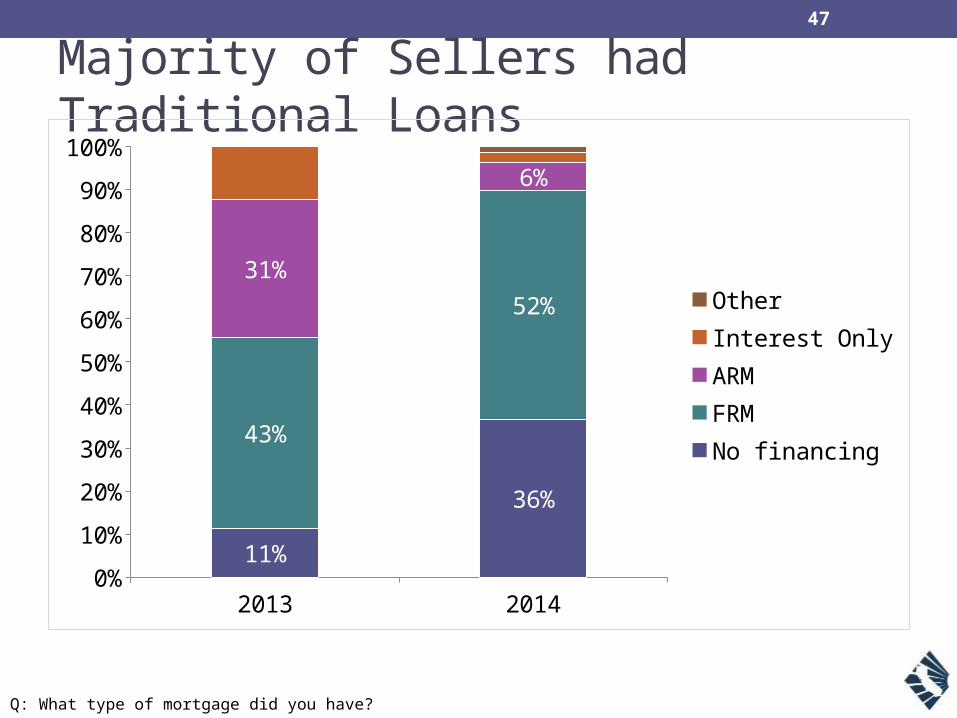
Majority of Sellers had Traditional Loans
2013 20140%
10%
20%
30%
40%
50%
60%
70%
80%
90%
100%
11%
36%
43%
52%
31%
6%
OtherInterest OnlyARMFRMNo financing
Q: What type of mortgage did you have?

48
Short Sales Continued Shrinking
2012 2013 20140%
10%
20%
30%
40%
50%
60%
70%
80%
90%
100%
56%
88% 93%
44%
12% 6%
Equity Sale Short Sale
Q: Was the home sold as a short sale?
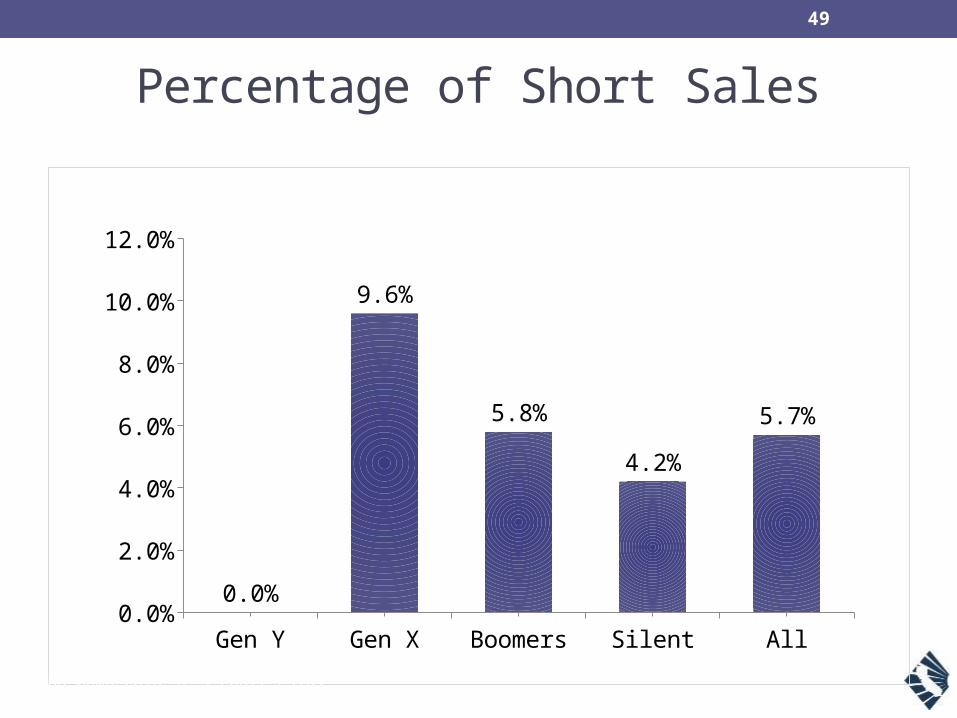
49
Percentage of Short Sales
Gen Y Gen X Boomers Silent All0.0%
2.0%
4.0%
6.0%
8.0%
10.0%
12.0%
0.0%
9.6%
5.8%
4.2%
5.7%
Q: Was the home sold as a short sale?

50
% of Loan Modifications Before Short Sale
Gen Y Gen X Boomers Silent All0%
10%
20%
30%
40%
50%
60%
0%
40%43%
50%
43%
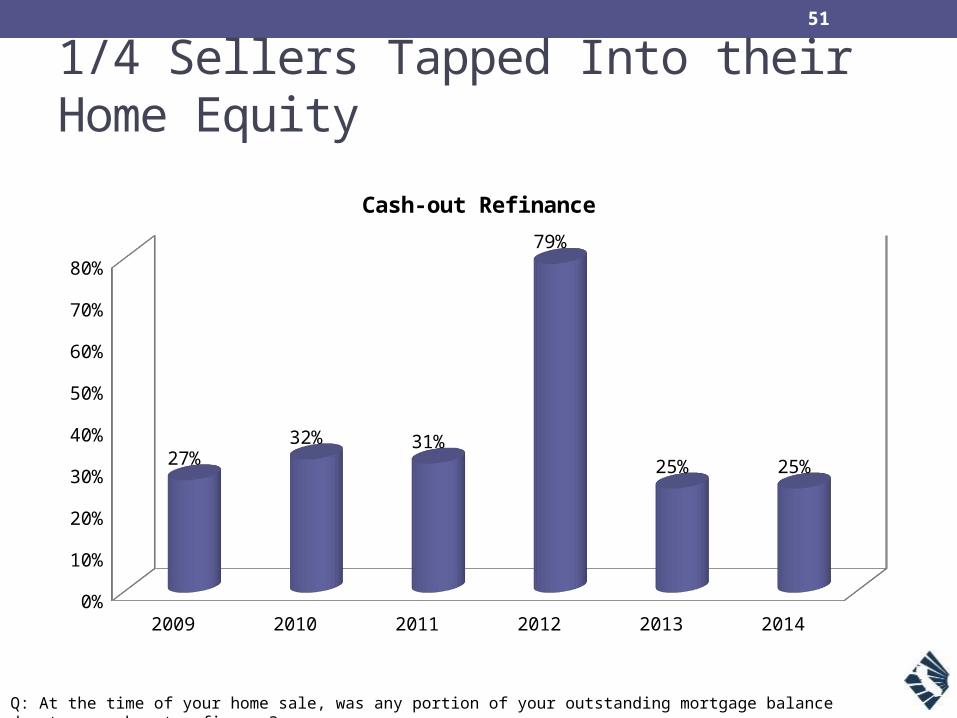
51
1/4 Sellers Tapped Into their Home Equity
2009 2010 2011 2012 2013 20140%
10%
20%
30%
40%
50%
60%
70%
80%
27%32% 31%
79%
25% 25%
Cash-out Refinance
Q: At the time of your home sale, was any portion of your outstanding mortgage balance due to a cash-out refinance?

52
Sellers Who Tapped Into their Home Equity
Gen Y Gen X Boomers Silent All0%
5%
10%
15%
20%
25%
30%
35%
0%
23%
31%
25% 25%
Cash-out Refinance
Q: At the time of your home sale, was any portion of your outstanding mortgage balance due to a cash-out refinance?
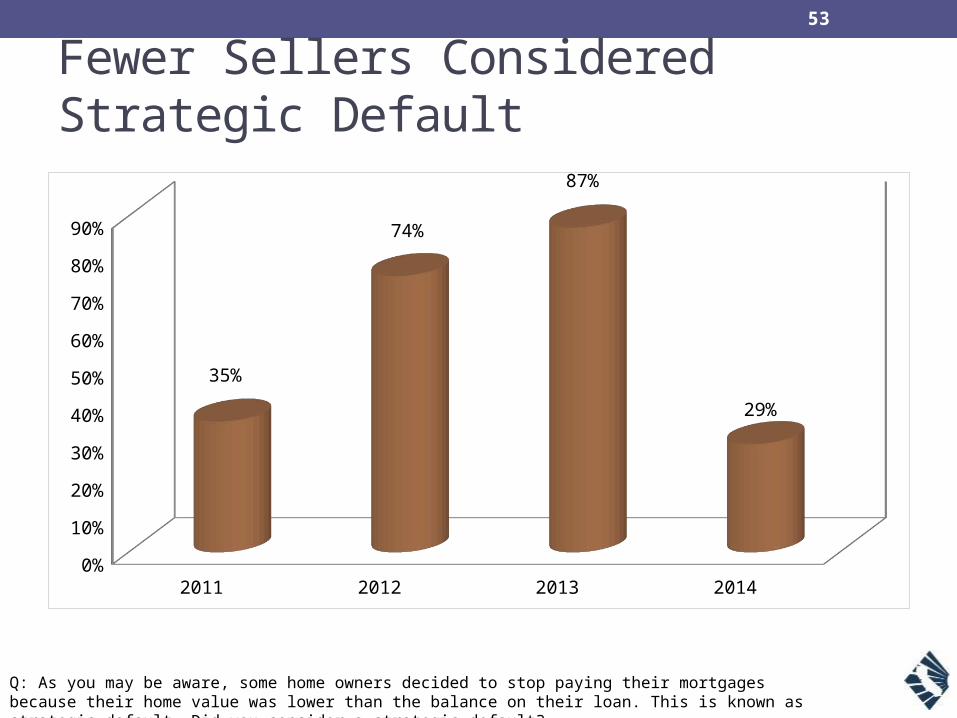
53
Fewer Sellers Considered Strategic Default
2011 2012 2013 20140%
10%
20%
30%
40%
50%
60%
70%
80%
90%
35%
74%
87%
29%
Q: As you may be aware, some home owners decided to stop paying their mortgages because their home value was lower than the balance on their loan. This is known as strategic default. Did you consider a strategic default?
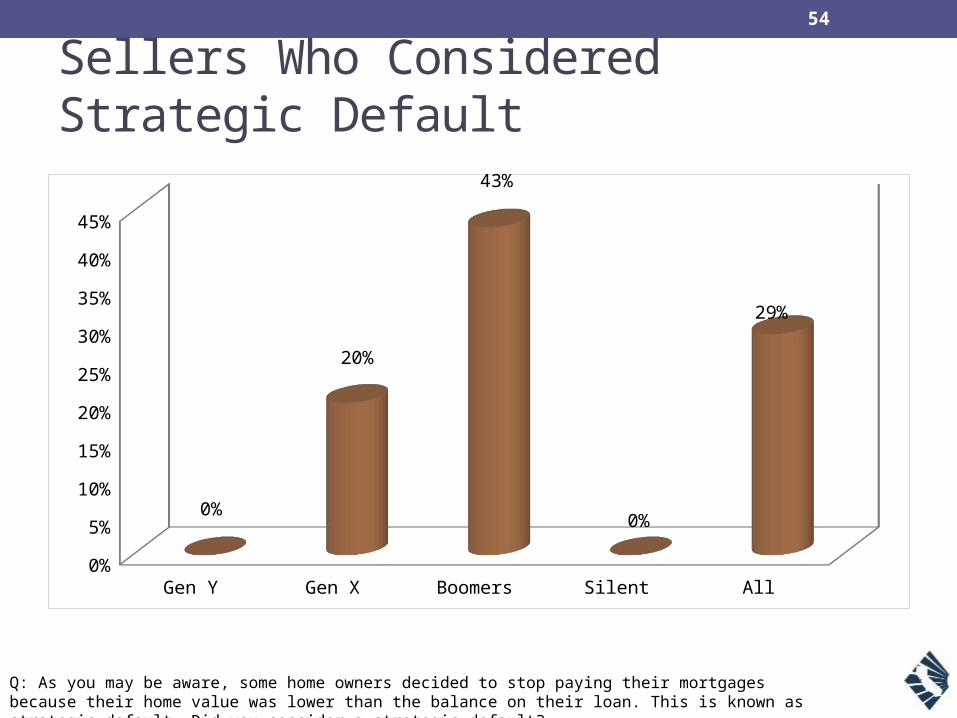
54
Sellers Who Considered Strategic Default
Gen Y Gen X Boomers Silent All0%
5%
10%
15%
20%
25%
30%
35%
40%
45%
0%
20%
43%
0%
29%
Q: As you may be aware, some home owners decided to stop paying their mortgages because their home value was lower than the balance on their loan. This is known as strategic default. Did you consider a strategic default?

55
ABOUT THE SELLER
56
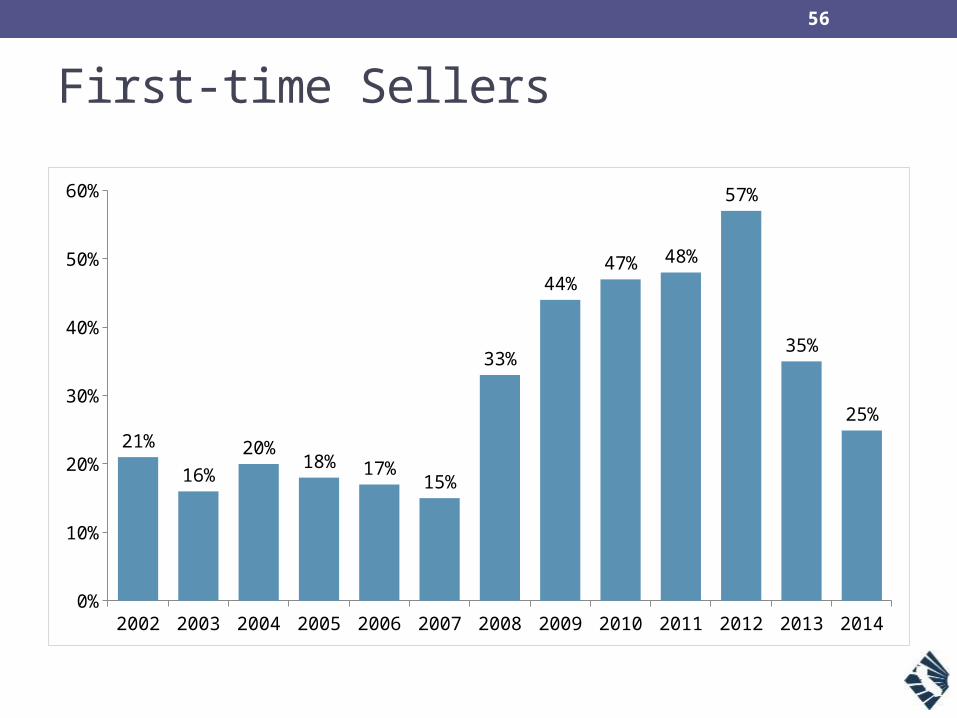
First-time Sellers
2002 2003 2004 2005 2006 2007 2008 2009 2010 2011 2012 2013 20140%
10%
20%
30%
40%
50%
60%
21%
16%
20%18% 17%
15%
33%
44%47% 48%
57%
35%
25%
Q: Was this your first experience in selling a house?

57
First-time Sellers
Gen Y Gen X Boomers Silent All0%
10%
20%
30%
40%
50%
60%
70%
80%72%
50%
21%
12%
25%
Q: Was this your first experience in selling a house?

58
Asians Have Highest Proportion of First-time Sellers
Asian Black Hispanic Other White0%
5%
10%
15%
20%
25%
30%
35%
40%
45%
50%
43%
27%
33%
21%24%
Q: Was this your first experience in selling a house?

59
More Sellers Are Repurchasing
2009 2010 2011 2012 2013 2014*0%
10%
20%
30%
40%
50%
60%
70%
80%
90%
100%
55%42%
12%
47%
69%81%
45%58%
88%
53%
31%19%
Own Rent
Q: Do you own or rent your current home?
*Data from C.A.R. Market Pulse Survey
60
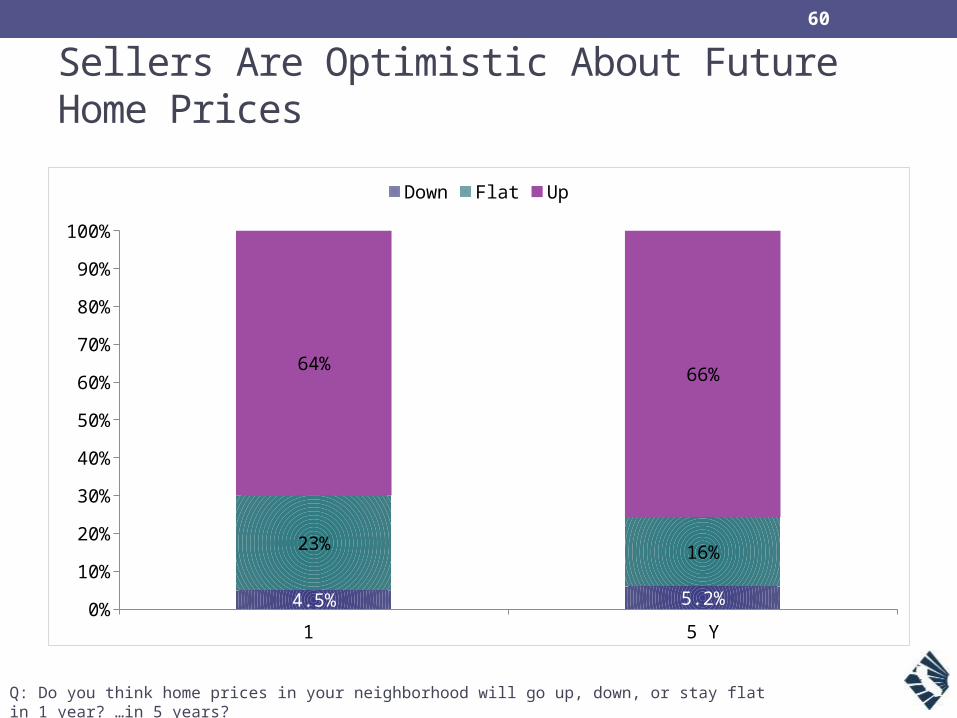
Sellers Are Optimistic About Future Home Prices
1 Year 5 Years0%
10%
20%
30%
40%
50%
60%
70%
80%
90%
100%
4.5% 5.2%
23% 16%
64%66%
Down Flat Up
Q: Do you think home prices in your neighborhood will go up, down, or stay flat in 1 year? …in 5 years?

61
Sellers Outlook About Future Home Prices
Down in 1 Year Up in 5 Years Down in 5 Years
17%
33%
17%
3%
67%
5%4%
75%
4%4%
61%
6%5%
66%
5%
Gen Y Gen X Boomers Silent All
Q: Do you think home prices in your neighborhood will go…?

62
Average Seller is 61 Years Old
2014 CA homeowners*0%
10%
20%
30%
40%
50%
60%
70%
80%
90%
100%
Gen Y (1980-1999) Gen X (1965-1979) Boomers (1946-1964)
Seniors (before 1946)
*Source: U.S. Census Bureau 2013 American Community SurveyQ: What is your age?
63
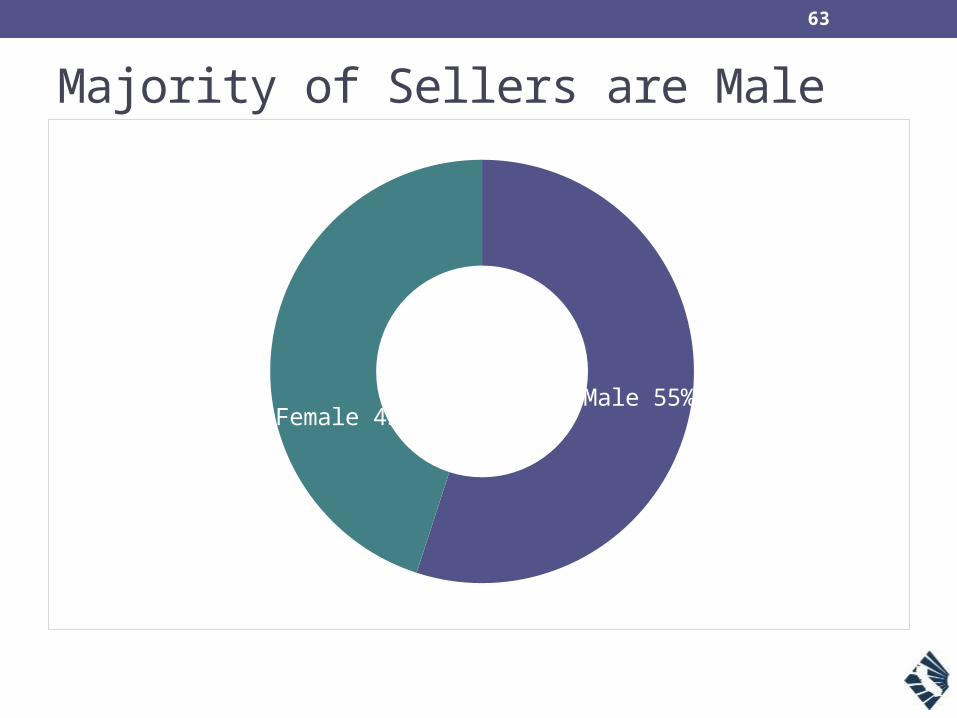
Majority of Sellers are Male
Male 55%Female 45%
64
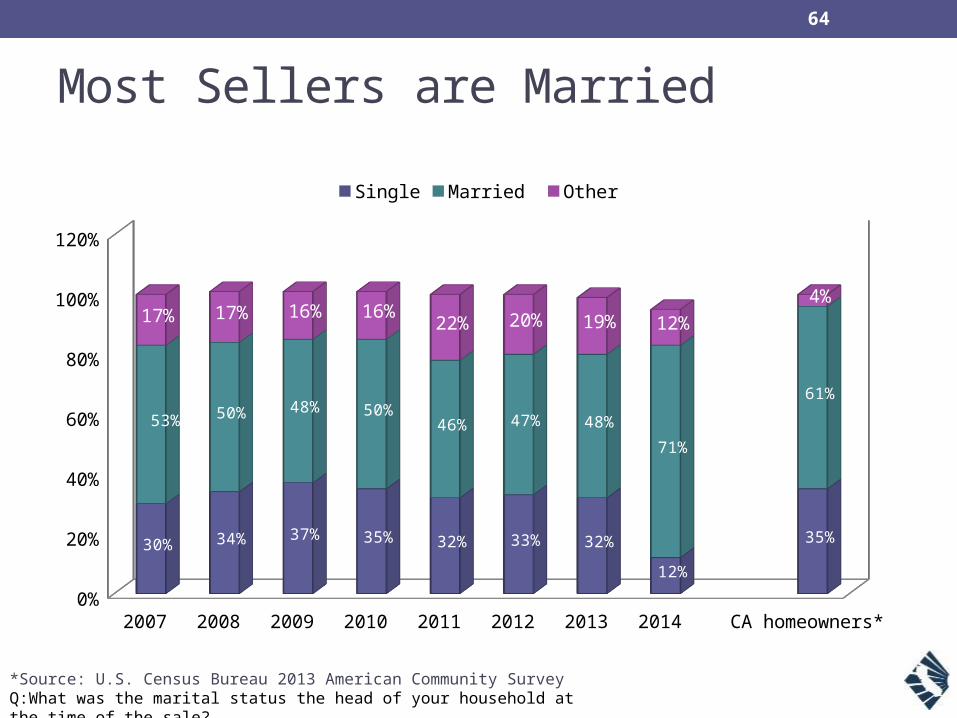
Most Sellers are Married
2007 2008 2009 2010 2011 2012 2013 2014 CA homeowners*0%
20%
40%
60%
80%
100%
120%
30% 34% 37% 35% 32% 33% 32%
12%
35%
53% 50% 48% 50%46% 47% 48%
71%
61%
17% 17% 16% 16%22% 20% 19% 12%
4%
Single Married Other
*Source: U.S. Census Bureau 2013 American Community SurveyQ:What was the marital status the head of your household at the time of the sale?
65
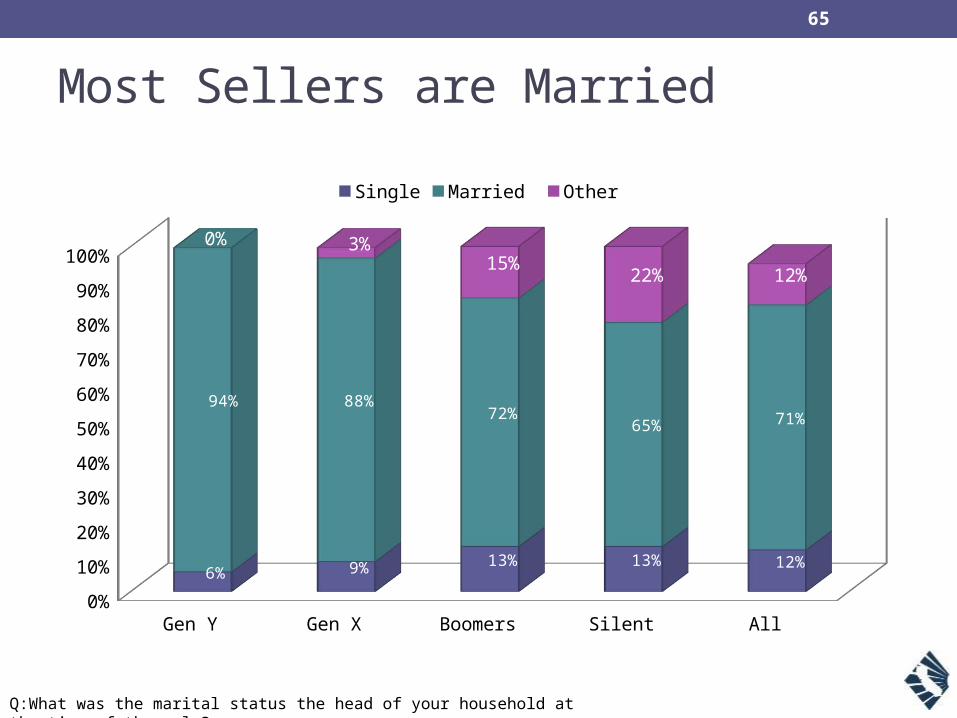
Most Sellers are Married
Gen Y Gen X Boomers Silent All0%
10%
20%
30%
40%
50%
60%
70%
80%
90%
100%
6% 9% 13% 13% 12%
94% 88%72%
65% 71%
0% 3%15%
22% 12%
Single Married Other
Q:What was the marital status the head of your household at the time of the sale?

66
Whites are the Majority
Asian
African American
Other
Hispanic
White
0.0%20.0%
40.0%60.0%
80.0%
2.1%
3.2%
4.1%
10.6%80.0%
Q: How would you describe your ethnic background?
67
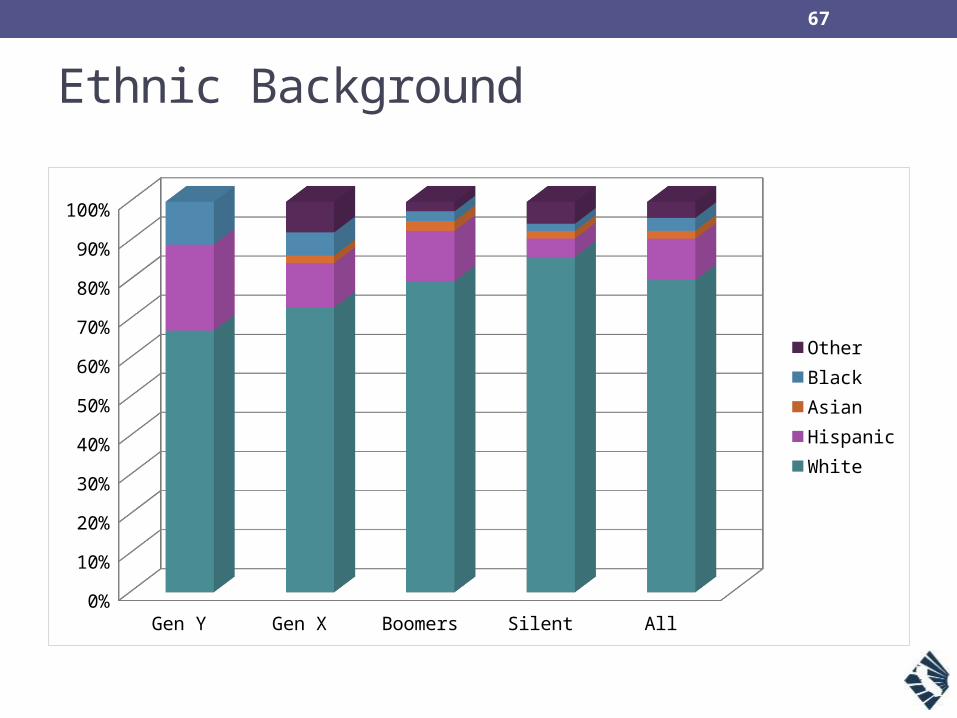
Ethnic Background
Gen Y Gen X Boomers Silent All0%
10%
20%
30%
40%
50%
60%
70%
80%
90%
100%
OtherBlackAsianHispanicWhite
68
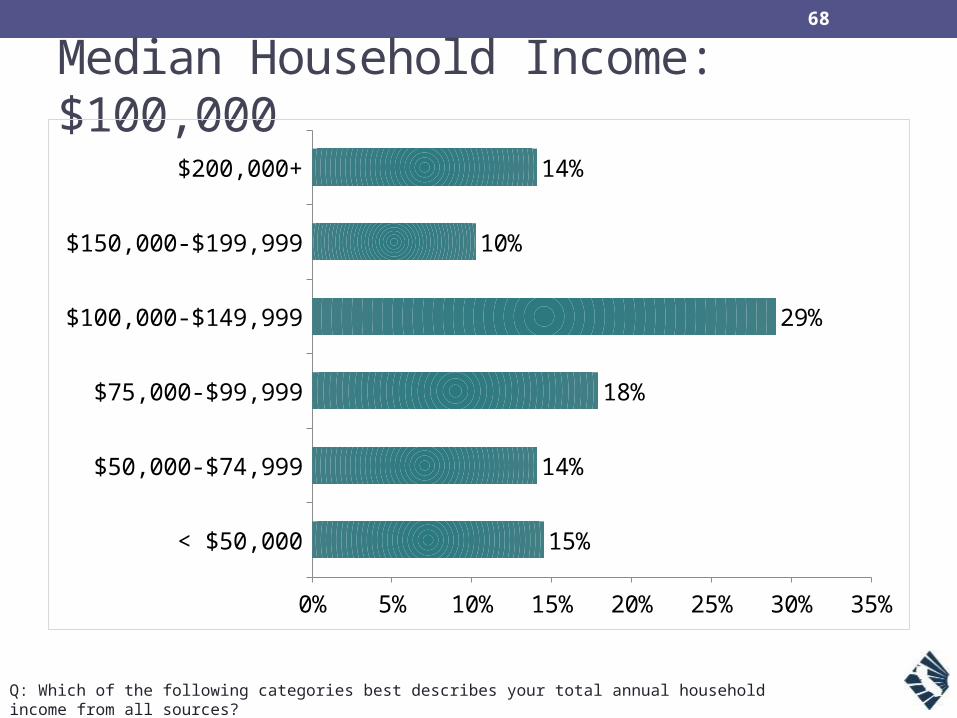
Median Household Income: $100,000
< $50,000
$50,000-$74,999
$75,000-$99,999
$100,000-$149,999
$150,000-$199,999
$200,000+
0% 5% 10% 15% 20% 25% 30% 35%
15%
14%
18%
29%
10%
14%
Q: Which of the following categories best describes your total annual household income from all sources?

69
KEY TAKEAWAYS

70
Market Stable for Sellers
Sales improving
Pricing homes correctlyMultiple offers
Homes selling faster
Few short sales
71
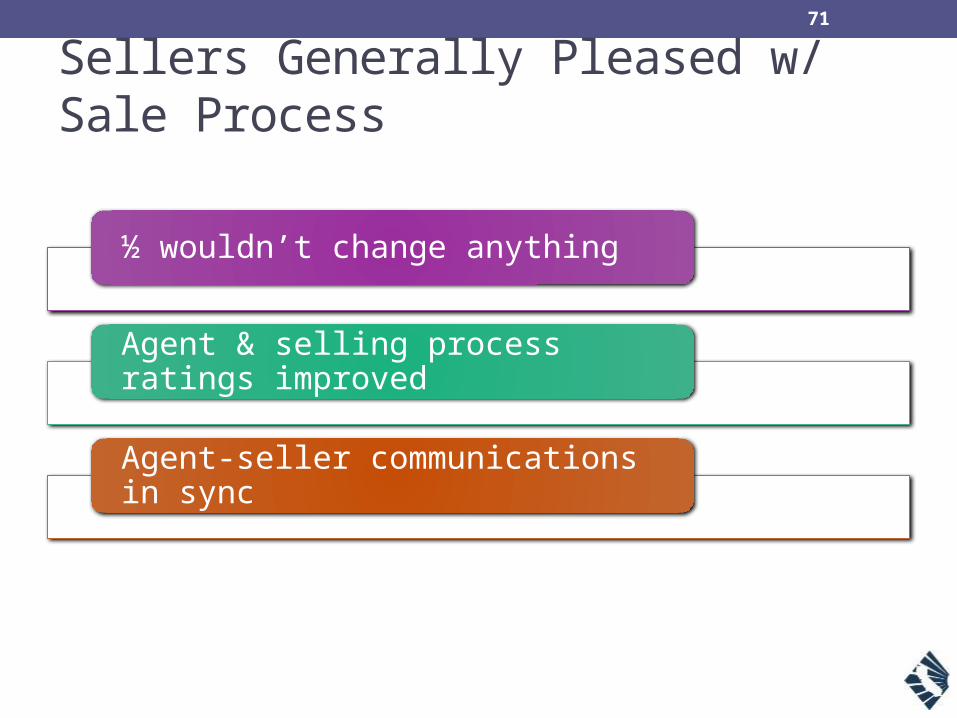
Sellers Generally Pleased w/ Sale Process
½ wouldn’t change anything
Agent & selling process ratings improved
Agent-seller communications in sync
72
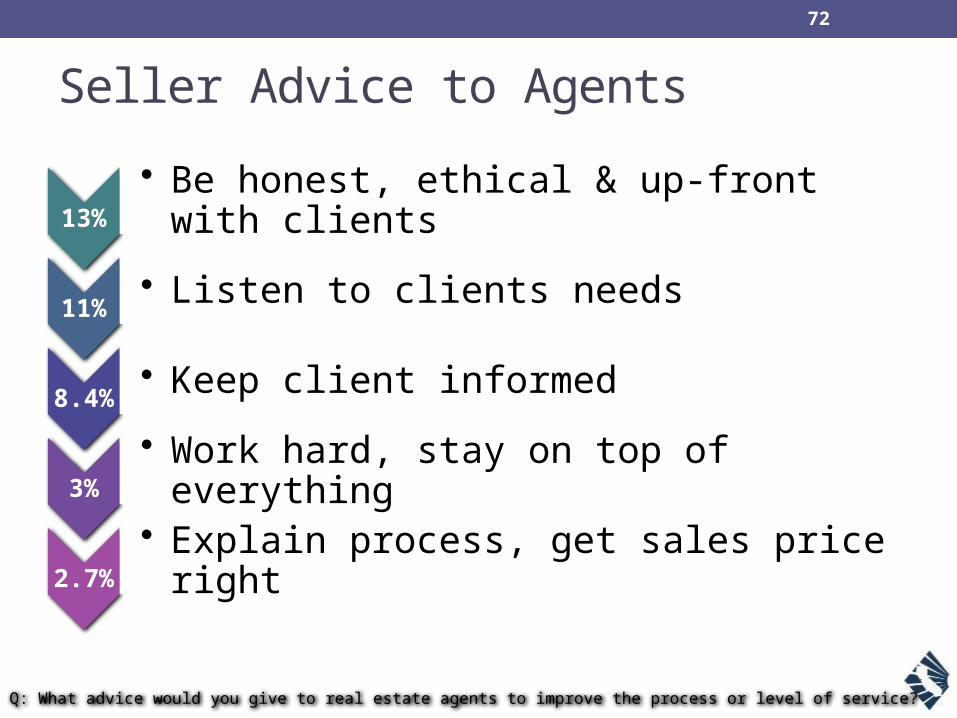
Seller Advice to Agents
13%
• Be honest, ethical & up-front with clients
11%
• Listen to clients needs
8.4%
• Keep client informed
3%
• Work hard, stay on top of everything
2.7%
• Explain process, get sales price right
Q: What advice would you give to real estate agents to improve the process or level of service?

Understanding California Home Buyers
Thursday, May 28, 20152:00 PM – 3:00 PM
To register: WWW.
CAR.ORG/MARKETDATA/VIDEOS
Join us for our next webinar…