understanding and minimizing impacts of agricultural
TRANSCRIPT

MTAC TR06-04
Understanding and Minimizing Impacts of Agricultural Pesticides on Small Water Systems Using Surface Water
by
Jane Frankenberger, Associate Professor Agricultural and Biological Engineering, Purdue University
225 S. University St., West Lafayette IN 47907 Email: [email protected]

2
Disclaimer This material is based upon work supported by the Midwest Technology Assistance Center for Small Public Water Systems (MTAC). MTAC was established October 1, 1998 to provide assistance to small public water systems throughout the Midwest via funding from the United States Environmental Protection Agency (USEPA) under section 1420(f) of the 1996 amendments to the Safe Drinking Water Act. MTAC is funded by the USEPA under Grant No. X829218-01. Any opinions, findings, and conclusions or recommendations expressed in this publication are those of the author(s) and do not necessarily reflect the views of the USEPA or MTAC.

3
Understanding and Minimizing Impacts of Agricultural Pesticides on Small Water Systems Using Surface Water
Jane Frankenberger, Associate Professor Agricultural and Biological Engineering, Purdue University
225 S. University St., West Lafayette IN 47907 Email: [email protected]
Executive Summary Several small public water systems in the Midwest have exceeded the maximum contaminant level (MCL) for atrazine, a common herbicide used through Midwestern watersheds. Water systems that use surface water are more susceptible to pesticide contamination than systems that use ground water. The overall goal of the project was to facilitate source water protection related to agricultural pesticides, with a focus on atrazine, because of the prevalence of atrazine in surface water in the Midwest compared to other agricultural pesticides. The project accomplished three objectives:
1. Compile information on levels of atrazine (ppb) in community water systems in Indiana that use surface water, and make the information accessible to the drinking water community, the agricultural community, and the public.
2. Assess the water quality impacts of potential changes to pesticide application and management practices in watersheds used by small community water systems.
3. Educate pesticide applicators and the public about watersheds used by community water supply systems, and the importance of knowing about these watersheds in making pesticide applications.
This project addressed the MTAC research priority “Measures to strengthen source water protection for small systems in the Midwest”.
Background Source water assessments are required by the Safe Drinking Water Act, and are underway or completed in all states in the Midwest. Source water protection (another step beyond assessment) is not required by federal regulations, but is a logical, cost-effective component of ensuring safe drinking water for the public. Atrazine is a pesticide used to treat weeds on more than 80% of corn grown in Midwest states. Atrazine is highly effective and relatively inexpensive. However due to its widespread use and moderately high solubility, it is widespread in surface water across the Midwest, including source water for community public water sytems. Battaglin et al. (2003) conducted a study of herbicides and their transformation products in eight Midwestern states, and found atrazine in 99% of all samples. The USGS NAWQA program found atrazine in 100% of samples in the White River, which drains most of the area that uses surface water in Indiana, and estimated an average load of 28,000 lbs/year leaving the basin in streamflow. (Crawford, 1995).

4
Systems using surface water systems are significantly more vulnerable to contamination by pesticides than systems using ground water. For example, of 682 Safe Drinking Water Act atrazine test results submitted to the Indiana Department of Environmental Management (IDEM) from 1993-2000, 34 exceeded 3 ppb (the MCL). Most of these exceedances were by small systems, and the maximum atrazine concentration in those samples was 14 ppb. Larger systems using surface water face the same problems with high pesticide levels in the source water at times, most of them have the capacity to treat the water and therefore have not generally had to distribute water with atrazine concentrations higher than 3 ppb. Atrazine was identified in an informal survey we conducted in 1998 as the top concern of operators of surface water systems. (Sediment was the second concern). The number of samples approaching or exceeding 3 ppb leads many systems to be concerned about this contaminant. However, little is known about how rural communities are addressing drinking water problems like these. (Phoenix, 2002). Protecting source water from the risk of pesticide runoff is a difficult undertaking. Homes et al. (2001) examined factors that predicted high herbicide concentrations in stream and reservoirs, but not specifically for watersheds used for drinking water. The complexity of the task is one of the reasons a detailed susceptibility analysis to agricultural pesticides is not included in most source water assessments, and is not something that the individual water systems, particularly small water systems, have the capacity to do. Out of concern for the atrazine treatment burden that water systems using surface water face, and particularly in response to the Interim Reregistration Eligibility Decision (http://www.epa.gov/oppsrrd1/REDs/atrazine_ired.pdf), the Office of the Indiana State Chemist initiated a statewide working group to address these issues. The Pesticide Watershed Work Group (as it is now called) includes representation from agricultural organizations (Farm Bureau, Corn Growers, Certified Crop Consultants, the Agribusiness Council, and an individual farmer), the Indiana Department of Environmental Management, USDA Natural Resources Conservation Service, public water suppliers (Indiana-American Water Company), USGS, and others. The Work Group developed five specific action strategies, with the goals of better informing producers, the water utilities, state agencies, and the public about impacts of atrazine use on public water systems and informing pesticide applicators about strategies and requirements for minimizing those impacts. Research carried out in this project will be used by the Work Group as a source of specific information that can be used to inform water systems operators, the public, growers, and agencies about practices that can most effectively reduce pesticide runoff. This report also includes some of the education related to the project that was carried out.
Goal 1: Compile information on levels of atrazine (ppb) in community water systems in Indiana that use surface water, and make the information accessible to the drinking water community, the agricultural community, and the public. . The Pesticide Watershed Work Group described above determined that systems that use surface water, their customers, state agencies, and the public would benefit from having

5
access to more extensive data collected by a variety of sources on atrazine concentrations in raw (source) water. The following data sources were made available by the Indiana State Chemist, which regulates pesticides in Indiana, the Indiana Department of Environmental Management, and water utilities: • The Acetochlor Registration Partnership, a monitoring program carried out by
pesticide manufacturers Monsanto and Zeneca in 1995-2001 • Atrazine Voluntary Management Program, a monitoring carried out by pesticide
manufacturer Syngenta from 1992-2002 • Data collected by the water utilities • Data collected by other groups such as local watershed partnerships that have
monitored water in the watersheds used by public water supply systems All data available of atrazine in raw and finished water in drinking water systems that use source water were drawn together and graphed for presentation to small water systems, their customers, state agencies, and the public. The data sources include (1) compliance data required for the Safe Drinking Water Act (from the Indiana Department of Environmental Management), (2) monitoring carried out by individual systems, and (3) monitoring from three programs by pesticide manufacturers (grouped together in the graphs). The graphs have approximately the same vertical scale, which increases visualization of the strikingly different atrazine concentrations measured. The untreated water sources are in shades of purple; treated water is in shades of green and blue. Where the Safe Drinking Water Act samples exceed 3 ppb, a 4-point moving average is also shown, which roughly represents the 4-sample average taken to assess compliance.
Figure 1 a-p: Atrazine concentration in finished (treated) and raw (untreated) drinking water systems serving less than 10,000 people in Indiana using surface water
Batesville Oser and Bischoff Reservoirs
0
2
4
6
8
10
12
Jan-94 Jan-95 Jan-96 Jan-97 Jan-98 Jan-99 Jan-00 Jan-01 Jan-02 Jan-03 Jan-04 Jan-05
Atr
azin
e, p
pb
SDWA Monitoring data MCL (annual average)Treated - Manufacturers Treated - Water systemUntreated - Manufacturers SDWA Average

6
Huntingburg Huntingburg Lake
0
2
4
6
Jan-94 Jan-95 Jan-96 Jan-97 Jan-98 Jan-99 Jan-00 Jan-01 Jan-02 Jan-03 Jan-04 Jan-05
Atr
azin
e, p
pb
SDWA Monitoring data MCL (annual average)SDWA Average

7
Muscatatuck State Dev. CenterMuscatatuck River - Vernon Fork
0
2
4
6
8
10
12
14
16
18
Jan-94 Jan-95 Jan-96 Jan-97 Jan-98 Jan-99 Jan-00 Jan-01 Jan-02 Jan-03 Jan-04 Jan-05
Atr
azin
e, p
pb
SDWA Monitoring data MCL (annual average) Treated - Manufacturers
Bedford East Fork White River
0
2
4
6
8
10
12
14
16
18
20
22
Jan-94 Jan-95 Jan-96 Jan-97 Jan-98 Jan-99 Jan-00 Jan-01 Jan-02 Jan-03 Jan-04 Jan-05
Atr
azin
e, p
pb
SDWA Monitoring data MCL (annual average)Untreated - Water system Treated - Water systemTreated - Manufacturers Untreated - ManufacturersSDWA Average

8
Holland Holland Lake
0
2
4
6
8
10
12
14
16
Jan-94 Jan-95 Jan-96 Jan-97 Jan-98 Jan-99 Jan-00 Jan-01 Jan-02 Jan-03 Jan-04 Jan-05
Atr
azin
e, p
pb
SDWA Monitoring data MCL (annual average)Treated - Manufacturers Untreated - Manufacturers
Jasper Patoka River
0
2
4
6
8
10
12
14
16
Jan-94 Jan-95 Jan-96 Jan-97 Jan-98 Jan-99 Jan-00 Jan-01 Jan-02 Jan-03 Jan-04
Atr
azin
e, p
pb
SDWA Monitoring data MCL (annual average)
Untreated - Water system Untreated - Manufacturers
Treated - Manufacturers SDWA Average

9
Logansport Eel River
0
2
4
6
8
10
12
14
16
18
20
22
24
26
Jan-94 Jan-95 Jan-96 Jan-97 Jan-98 Jan-99 Jan-00 Jan-01 Jan-02 Jan-03 Jan-04 Jan-05
Atr
azin
e, p
pb
SDWA Monitoring data MCL (annual evrage) Treated - Manufacturers
Untreated - Manufacturers SDWA Average
Paoli Lick Creek, Patoka River
0
2
4
6
8
Jan-94 Jan-95 Jan-96 Jan-97 Jan-98 Jan-99 Jan-00 Jan-01 Jan-02 Jan-03 Jan-04 Jan-05
Atr
azin
e,pp
b
Treated - Manufacturers MCL (annual average)

10
Oakland City Old Lake, New Lake, Patoka Reservoir
0
2
4
6
Jan-94 Jan-95 Jan-96 Jan-97 Jan-98 Jan-99 Jan-00 Jan-01 Jan-02 Jan-03 Jan-04 Jan-05
Atr
azin
e, p
pb
SDWA Monitoring data MCL (annual average) Treated - Manufacturers
Mitchell East Fork White River
0
2
4
6
8
10
12
14
16
18
Jan-94 Jan-95 Jan-96 Jan-97 Jan-98 Jan-99 Jan-00 Jan-01 Jan-02 Jan-03 Jan-04 Jan-05
Atr
azin
e, p
pb
SDWA Monitoring data MCL (annual average) Treated - Manufacturers SDWA Average

11
North Vernon Muscatatuck River
0
2
4
6
8
10
12
14
16
18
20
22
24
Jan-94 Jan-95 Jan-96 Jan-97 Jan-98 Jan-99 Jan-00 Jan-01 Jan-02 Jan-03 Jan-04 Jan-05
Atr
azin
e, p
pb
SDWA Monitoring data MCL (annual average)Treated - Manufacturers SDWA Average

12
Versailles Water Works Laughery Creek
0
2
4
6
8
10
12
14
16
18
20
22
24
26
28
30
32
Jan-94 Jan-95 Jan-96 Jan-97 Jan-98 Jan-99 Jan-00 Jan-01 Jan-02 Jan-03 Jan-04 Jan-05
Atr
azin
e, p
pb
SDWA Monitoring data MCL (ug/L)Treated - Manufacturers Untreated - ManufacturersSDWA Average
Westport Sand Creek and tw o small lakes
0
2
4
6
8
10
12
14
16
18
20
Jan-94 Jan-95 Jan-96 Jan-97 Jan-98 Jan-99 Jan-00 Jan-01 Jan-02 Jan-03 Jan-04 Jan-05
Atr
azin
e, p
pb
SDWA Monitoring data MCL (annual average)
Treated - Manufacturers Untreated - Manufacturers

13
Scottsburg Water Department Scottsburg Reservoir
0
2
4
6
8
10
12
14
16
Jan-94 Jan-95 Jan-96 Jan-97 Jan-98 Jan-99 Jan-00 Jan-01 Jan-02 Jan-03 Jan-04 Jan-05
Atr
azin
e, p
pb
Treated - Manufacturers SDWA Monitoring data MCL (annual average) Untreated - Manufacturers
Scottsburg - Stucker Fork Muscatatuck River
0
2
4
6
8
10
12
14
Jan-94 Jan-95 Jan-96 Jan-97 Jan-98 Jan-99 Jan-00 Jan-01 Jan-02 Jan-03 Jan-04 Jan-05
Atr
azin
e,pp
b
SDWA Monitoring data MCL (annual average)Untreated - Manufacturers Treated - ManufacturersSDWA Average
Springs Valley Regional Water Lost River
0
2
4
6
Jan-94 Jan-95 Jan-96 Jan-97 Jan-98 Jan-99 Jan-00 Jan-01 Jan-02 Jan-03 Jan-04 Jan-05
Atr
azin
e, p
pb
SDWA Monitoring data MCL (annual average)

14
Besides being available on the Web, these graphs have been used in many presentations to more than 300 pesticide applicators and Certified Crop Advisors, who are the people that can make the biggest changes in how pesticides are managed. It is not yet known how the availability of these graphs will impact atrazine runoff and community water systems that use surface water. The education effort to make the public more aware of them is just beginning, and will continue for years. We have worked closely with the Pesticide Watershed Work Group (http://www.ecn.purdue.edu/SafeWater/PWWG) in developing them, and will collaborate with Purdue Pesticide Programs in using them to educate pesticide users. State regulatory agencies, particularly the Office of the Indiana State Chemist and Indiana Department of Environmental Management, can use them in implementing improved strategies for regulation and education. Water systems will benefit from seeing the data from their systems together with data from other systems in the state, to provide comparison and better understanding of trends that are the same everywhere. The public, state agencies, and the agricultural community will benefit from gaining a broader picture of atrazine in source water for Indiana public water systems.
Goal 2: Quantify the water quality impacts of current and possible alternative pesticide management practices in watersheds used by small surface-water systems in Indiana Impacts on water quality of changes in agricultural management practices are not easily known, because the impacts in a specific location depend on soil, topography, local rainfall patterns, and specific management practices. Since all potential “best management practices” (BMPs) cannot be tried, simulation models are the most effective technology to use in estimating and comparing various management practices. The models have been run in various locations, including some locations in Indiana, but not in the watersheds for these community water supply systems. We used two existing hydrologic and water quality models in this study: GLEAMS (Groundwater Loading Effects of Agricultural Management Systems; Knisel et al., 1994) and SWAT (Soil and Water Assessment Tool; Arnold et al., 1998). GLEAMS has the most detailed pesticide transport and transformation components of commonly-used existing models, and is stronger at predicting the effects of management practices at the field scale. SWAT is much more developed as a watershed-scale model, and therefore is stronger at predicting concentrations at the watershed outlet. We selected the watersheds of four small community water systems for this analysis. Three of these systems (Santee Utilities Inc., Westport Water Company) are on a list of systems have exceeded 2.6 ppb of atrazine and metabolites as an annual average, and therefore need to undergo more intensive monitoring. These watersheds are described in Table 1 and shown in Figure 2.
Table 1: Small community water systems and their watersheds assessed in this study Community County Population
served Watershed area (mi2)
Agricultural land use
Santee Utilities Decatur 2500 2.5 92%

15
Scottsburg Scott 5520 3.2 71% Westport Decatur 1440 98 84%
Next page: Figure 2: Location and land use for the three watersheds used in this study

16

17
a. Study of Scottsburg and Santee Watersheds using NAPRA - GLEAMS
We studied the impact of alternative pesticide management practices on two major soil types in the small watersheds of Scottsburg and Santee using the GLEAMS model. We used the NAPRA WWW system (National Agricultural Pesticide Risk Analysis), developed by the USDA NRCS and extended by ABE at Purdue University. The system is designed to assess the potential risk of pesticide loss to shallow ground or surface water as a result of various agricultural management practices. Three management practice changes were tested: • Type of atrazine application: Surface application vs. incorporation • Timing of atrazine application: Pre-planting vs. post-emergence. • Rate of atrazine application: 1.25 lb/ac to 2 lb/ac. The model was run for 30 years, and the results grouped by exceedance probability. The 3% probability of exceedance represents a low probability event, but one which could happen and would be likely to cause significant atrazine concerns. Results are also given for the 10% and 50% exceedance probabilities.
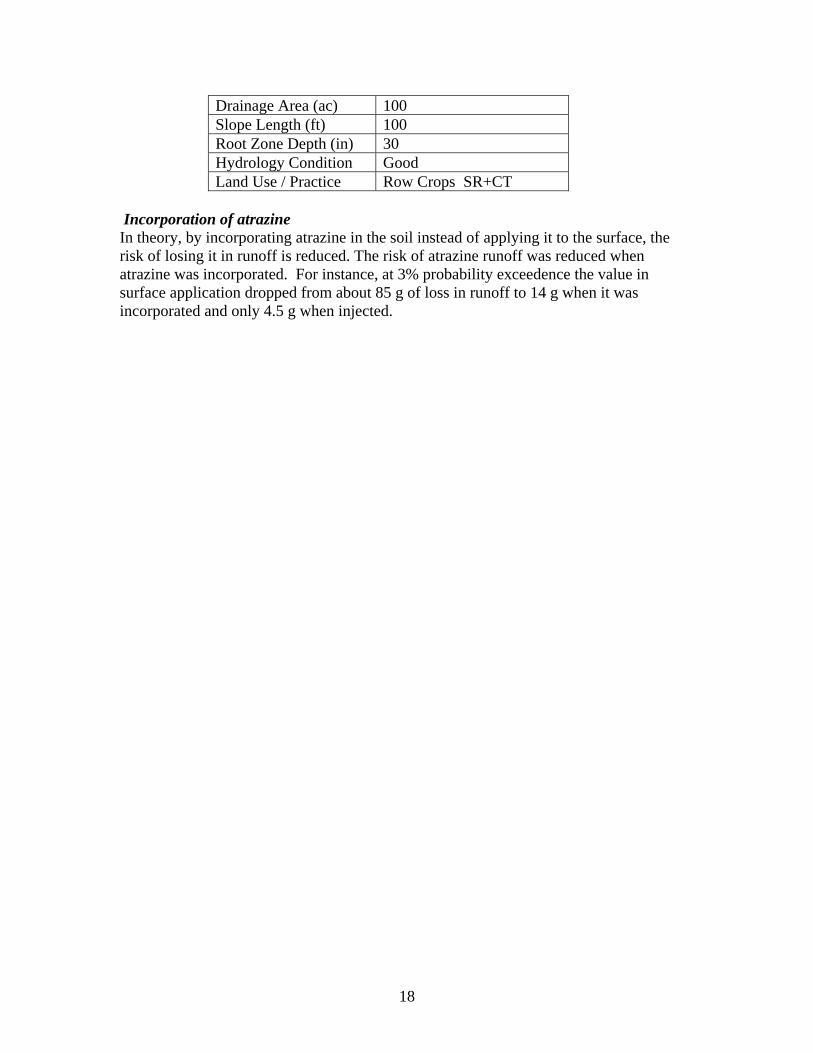
Table 2: Baseline parameters selected for GLEAMS-NAPRA simulations of atrazine application practices
Planting Date May 17 Maturity Date September 22 Harvest Date October 22 Tillage Fall Chisel/Spring Disk Application Date May 17 Foliar Fraction (%) 15 Application Method Surface Application Application Rate 1.25 (lb/ac)
18
Drainage Area (ac) 100 Slope Length (ft) 100 Root Zone Depth (in) 30 Hydrology Condition Good Land Use / Practice Row Crops SR+CT
Incorporation of atrazine In theory, by incorporating atrazine in the soil instead of applying it to the surface, the risk of losing it in runoff is reduced. The risk of atrazine runoff was reduced when atrazine was incorporated. For instance, at 3% probability exceedence the value in surface application dropped from about 85 g of loss in runoff to 14 g when it was incorporated and only 4.5 g when injected.

19
Table 3: Atrazine loss in runoff and in percolation with surface application and incorporation Nabb silt loam (Scottsburg watershed) Surface application Incorporated
Probability of exceedence (%)
Runoff (g)
Percolation (g)
Runoff (g)
Percolation (g)
3 84.81 25.71 4.47 16.82 10 15.27 16.47 4 9.93 50 3.75 5.35 1.65 3.18
Russell silt loam (Santee watershed) Surface application Incorporated
Probability of exceedence (%)
Runoff (g)
Percolation (g)
Runoff (g)
Percolation (g)
3 28.02 4.27 4.37 4.23 10 5.71 2.19 2.19 2.17 50 1.02 0.33 0.95 0.31
Fincastle silt loam (Scottsburg watershed) Surface application Incorporated
Probability of exceedence (%)
Runoff (g)
Percolation (g)
Runoff (g)
Percolation (g)
3 73.19 3 10.89 3.93 10 23.21 1.32 5.19 1.76 50 3.69 0.17 2.68 0.29
Post-emergence (delayed) application If atrazine is not applied on the planting date but several days later, runoff is expected to be reduced because atrazine is applied when weeds begin to emerge in the corn-field. Results are shown below for atrazine loss predictions in both runoff and percolation (to ground water). The incorporation has a strong effect for the low probability events, but little effect in average conditions.
Table 4: Amount of atrazine loss in runoff and leaching (percolation) in pre- and post-emergence Nabb silt loam (Scottsburg watershed)
Pre-plant Post–emergence Probability of exceedence (%)
Runoff (g)
Percolation (g)
Runoff (g)
Percolation (g)
3 84.81 25.71 23.11 18.95 10 15.27 16.47 12.01 10.68 50 3.75 5.35 2.48 3.7
Russell silt loam (Santee watershed)
Pre-plant Post–emergence Probability of exceedence (%)
Runoff (g)
Percolation (g)
Runoff (g)
Percolation (g)
3 28.02 4.27 10.75 4.58 10 5.71 2.19 2.36 2.08

20
50 1.02 0.33 0.92 0.33
Fincastle silt loam (Westport watershed) Pre-plant Post–emergence Probability of exceedence (%)
Runoff (g)
Percolation (g)
Runoff (g)
Percolation (g)
3 73.19 3 30.01 3.33 10 23.21 1.32 9.21 1.49 50 3.69 0.17 3.24 0.21
Different application rates Application rate has a very strong influence on atrazine loss. The application rate was varied 1.25 lb/acre up to the maximum allowed of 2.0 lb/acre. As expected, the rates affected the runoff and percolation roughly in proportion to the amounts.
Table 5: Atrazine loss in runoff and in percolation using different rates application. Nabb silt loam (Scottsburg watershed) Application rates 1.25 lb/ac 1.50 lb/ac 1.75 lb/ac 2.0 lb/ac Probability of exceedence (%)
Runoff (g)
Percolation (g)
Runoff (g)
Percolation (g)
Runoff (g)
Percolation (g)
Runoff (g)
Percolation
(g) 3 76.28 16.93 91.53 20.32 106.8 23.71 122 27.09
10 13.34 9.53 16.01 12.4 18.68 13.42 21.34 15.33 50 3.23 3.67 3.87 3.68 4.52 4.29 5.16 4.95
Russell silt loam (Santee watershed) Application rates 1.25 lb/ac 1.50 lb/ac 1.75 lb/ac 2.0 lb/ac Probability of exceedence (%)
Runoff (g)
Percolation (g)
Runoff (g)
Percolation (g)
Runoff (g)
Percolation (g)
Runoff (g)
Percolation (g)
3 28.02 4.27 127.60 4.51 39.21 6.26 44.82 7.16 10 5.71 2.19 48.16 2.05 8.01 2.97 9.24 3.39 50 1.02 0.33 9.79 0.22 1.45 0.54 1.66 0.68
Fincastle silt loam (Santee watershed) Application rates 1.25 lb/ac 1.50 lb/ac 1.75 lb/ac 2.0 lb/ac Probability of exceedence (%)
Runoff (g)
Percolation (g)
Runoff (g)
Percolation (g)
Runoff (g)
Percolation (g)
Runoff (g)
Percolation (g)
3 73.19 3 87.83 3.61 102.50 4.45 117 5.01 10 23.21 1.32 27.85 1.59 32.49 1.89 2.23 2.23 50 3.69 0.17 4.42 0.27 5.16 0.32 0.44 0.44
b. Study of Westport Watershed using SWAT We used the Soil Water Assessment Tool (SWAT) model to study the impacts of various atrazine management practices on runoff at the watershed scale. The model was

21
calibrated for flow and atrazine concentration using existing data, then five different management practices for atrazine were simulated. Indiana Agricultural Statistics Service data on corn planting in the south eastern district were used to estimate atrazine application dates each year. Figure 3 shows the planting dates and atrazine application dates for 2003 and 2004.
0
25
50
75
100
1-Apr 11-Apr 21-Apr 1-May 11-May 21-May 31-May 10-Juntime (day)
%
pest2003crop-2003pest-2004crop-2004
Figure 3: Planting dates (from Ag Statistics) and estimated atrazine application
A baseline application was compared to four alternative management practices • No-till throughout the watershed • Delayed application of atrazine (July 1) • Reduced rate (1 kg/ha) • Implementation of filter strips on all streams The predicted reduction in annual average atrazine due to each of these practices concentration is shown in Figures 4 and 5. Conservation tillage (no-till) was not predicted to have a significant effect on atrazine concentration in this watershed. More effective management practices are reducing the rate of application, and particularly the implementation of filter strips (riparian buffers). This finding supports the existing availability of Farm Bill cost-share programs to implement filter strips. We have worked with the Natural Resources Conservation Service to promote the Continuous Conservation Reserve Program, which would provide an annual rental payment for any riparian area where farmers agree to install filter strips.

22
0
5
10
15
20
25
5/1/03
5/8/03
5/15/0
3
5/22/0
3
5/29/0
36/5
/03
6/12/0
3
6/19/0
3
6/26/0
3
Existing No-TillReduced rate Filter strips
Figure 4: Time series of SWAT results, showing the effects of three practices
54%
32%
11%
0.05%
0% 10% 20% 30% 40% 50% 60%
Filter strips
Reduced rate (1kg/ha)
Delayed application(July 1)
No-till
% Reduction in annual average atrazine concentration
Fig. 5: Summary of predicted reduction in annual average atrazine concentration with
alternative Another way to consider the results is in terms of predicted days exceeding the MCL of 3 ppb. The existing conditions were predicted to result in exceeding this concentration on 20 days/year. The alternative management practices, except for no-till, reduce these to some extent, although there was no scenario in which the days exceeding 3 ppb would be reduced to zero.

23
11
16
14
20
20
0 5 10 15 20 25
Filter strips
Reduced rate (1kg/ha)
Delayed application(July 1)
No-till
Existing
Number of days exceeding 3 ppb
Fig. 6: Number of days that the watershed atrazine concentration is predicted to exceed 3 ppb with alternative management practices Knowing the impacts of various management practices will allow producers and the agencies who work with them to choose application strategies that will keep atrazine and other pesticides below levels of concern. It will also help target pesticide management cost-share programs to support practices that have the greatest impact.
Goal 3: Use the results to educate small water system operators, farmers, and the public about what alternative practices can reduce pesticide runoff in watersheds used by community water supply systems. Three educational strategies were used in this project. (1) Educating people about the watersheds by providing maps There are currently 41 community water systems that use surface water, located in at least part of 52 of Indiana’s 92 counties. These systems were mapped, and the maps divided into county-sized areas. The advantages of this were that (1) maps were of a similar scale, good for clarity, and (2) at many events, pesticide applicators attend based on county. These maps have all been made available both as a pdf document (http:www.ecn.purdue.edu/SafeWater/DWwatersheds.pdf) and through the interactive Web site shown below, at http://www.ecn.purdue.edu/~frankenb/Indiana/map.

24
Figure 7: Web site of accessible maps
When the user clicks on any counties that have part of a watershed within them, a high-quality map comes up. The maps have only been available a short time, so no information is yet available on usage. We expect these maps to be useful over the next several years in a number of educational settings. One means by which thousands of pesticide applicators will see them is through the Pesticide Applicator Reregistration Process (PARP) in which private pesticide applicators come to a county-based training. The county maps will be an excellent resource for presentations on atrazine stewardship. For this purpose, the maps were all put in powerpoint presentations, which county educators can download and use directly. (2) Publications on atrazine and management practice impacts Two Extension publications were developed by Purdue Extension and published using other funding during the period of this project. Since they serve the purpose of providing

25
information on pesticide runoff extremely well, we did not develop additional publications. They are: PPP-66 Atrazine and Drinking Water: Understanding the Needs of Farmers and Citizens (8 pages, 1 MB; http://btny.purdue.edu/Pubs/PPP/PPP-66.pdf) PPP-67 Atrazine Use and Weed Management Strategies to Protect Surface Water Quality (16 pages, 13 MB; http://btny.purdue.edu/Pubs/PPP/PPP-66.pdf) See Figure below for both these publications.
Figure 8: Purdue Extension publications we participated in developing We have worked to widen their use among the pesticide applicator community and provide additional data that can be used to strengthen our education program. 3) Presentations to a variety of audiences. We made presentations were made to more than 300 private pesticide applicators and Certified Crop Advisors during this project period, and our presentations included information on source water and why it is important, as well as the effects of alternative management practices. We will continue to educate on these topics using information gained in this project in the coming years. We spoke on source water protection at the Alliance of Indiana Rural Water Fall Conference (http://www.inh2o.org/) and plan to work through them and others to educate

26
the drinking water community about atrazine and the information developed in this project.
Conclusion Atrazine has been a concern for many small public water systems in Indiana. In fact, during this project period, two more small systems had MCL violations for atrazine, which shows the urgent need for this and additional efforts. Although the research was carried out on a few pilot watersheds in Indiana, the analysis of the effectiveness of atrazine management practices provides knowledge that can be applied to watersheds in other states in the region. Atrazine is widely used in the entire Midwest region (most of which is known as the "Corn Belt", where atrazine is the most prevalent herbicide). The heaviest atrazine use per unit area in the US occur in portions of Iowa, Illinois, Indiana, Ohio, Nebraska, and Delaware.. (Source: EPA Interim Reregistration Eligibility Decision (IRED), http://www.epa.gov/oppsrrd1/reregistration/atrazine/atrazineadd.pdf). Watersheds in Missouri and Illinois are among those that are targeted for watershed mitigation measures by the EPA IRED because of significantly exceeding the MCL for atrazine. Our results provide information for more than just the watersheds they are completed on; many will extend to areas with similar precipitation patterns (parts of Illinois and Ohio) and soil types that extend into neighboring states. Although some best management practices can be expected have high benefits over widespread areas (for example, reducing rates and following setback distances), others are more site-specific. Atrazine is a very common herbicide used through Midwestern watersheds, and that is unlikely to change. Data assembled and made available to the public in this project will help to educate the pesticide applicator community of the results of their activities, and we hope will encourage them to improve their pesticide application stewardship. We believe that with this information they will better understand the importance of protecting the drinking water of small communities that use surface water.
References Arnold, J.G., R. Srinivasan, R. Muttiah, and J.R. Williams, 1998. Large Area Hydrologic
Modeling and Assessment Part I. J. of the American Water Resources Association 34(1): 73-89.
Battaglin, W.S., E.M. Thurman, S.J. Kalkhoff, and S.D. Porter, 2003. Herbicides and Transformation Products in Surface Waters of the Midwestern United States. J. of the American Water Resources Association 39(4):743-756.x
Crawford, C.G., 1995. Occurrence of pesticides in the White River, Indiana, 1991-95. U.S. Geological Survey Fac Sheet 233-95.

27
Homes, M.J., J.R. Frankenberger, and B. A. Engel, 2001. Susceptibility of Indiana watersheds to herbicide contamination. J. of the Am.Water Resour.Assoc. 37(4): 987-1000.
Knisel, W.G., Leonard, R.A., and F.M. Davis, 1994. Groundwater Loading Effects of Agricultural Management systems. Version 2.10 USDA-ARS. Southeast Watershed Research Laboratory, Tifton, GA.
Phoenix, L.A., 2002. Rural municipal water supply problems: How do rural governments cope? Water Resources Impact 4(2):20-26.