understanding and interpreting the many types of more
TRANSCRIPT

3.3 Graphics in the Media
! Understanding and interpreting the many types of more complex graphics that are commonly found in news media

Multiple Bar Graphs and Line Charts
! A multiple bar graph (grouped bar graph) is a simple extension of a regular bar graph: It has two or more sets of bars that allow comparison between two or more data sets.
! All the data sets must have the same categories so that they can be displayed on the same graph.

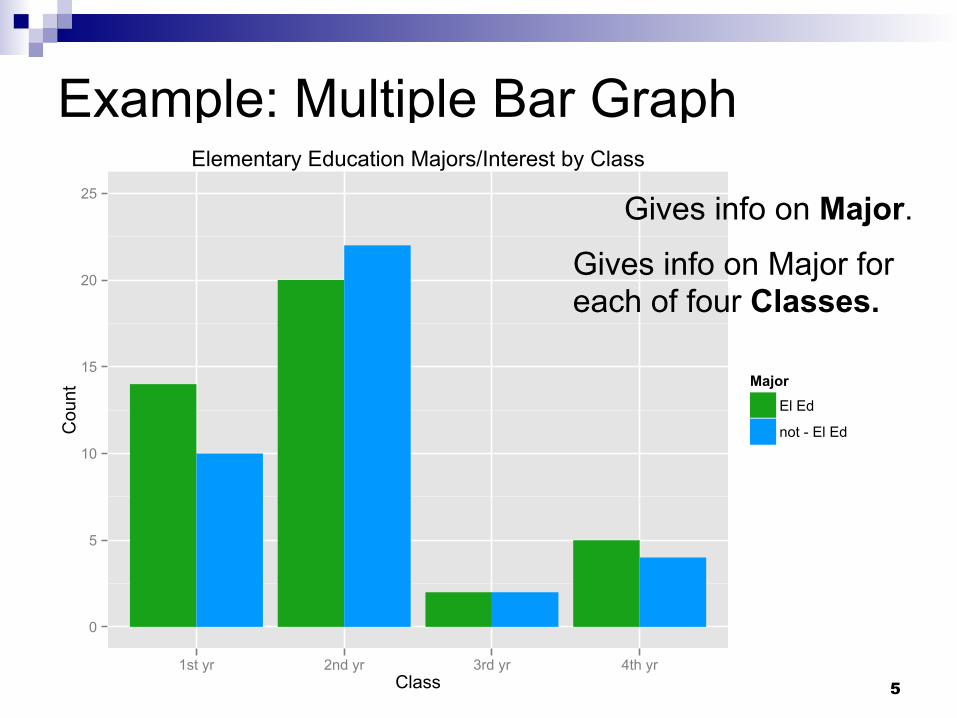
Example: Multiple Bar Graph
Gives info on three categories of Income: Allowance, Handouts, Chores.
Gives info on Income for each of three Age groups.
Used for qualitative data (i.e. x-axis is seen as categories).

4
Gives info on Tech Issues for each of 7 Years.
Gives info on three Tech Issue groups.
5
Example: Multiple Bar Graph
0
5
10
15
20
25
1st yr 2nd yr 3rd yr 4th yrClass
Count
Major
El Ed
not - El Ed
Elementary Education Majors/Interest by Class
Gives info on Major. Gives info on Major for each of four Classes.

Multiple Line Chart ! A multiple line chart follows the same
basic idea as a multiple bar chart, but shows the related data sets with lines rather than bars.
6
Used for quantitative data (i.e. x-axis is seen as numeric).

7
Example: What if the x-axis CAN be considered quantitative, but was initially considered qualitative?
Here, we see a Grouped Bar Chart with the x-axis considered qualitative. But what if we consider ‘time’ as the x-axis and create a Multiple Line Chart instead? (next slide). Time is somewhat special and can potentially be seen as a grouping variable or as a quantitative variables.
Source: Statistical Abstract of the United States.

8
Example: Line Graph
Line Chart
Source: Statistical Abstract of the United States.

9
Example: Line Graph
Source: Statistical Abstract of the United States.
Trends in Graph: 1) The most obvious trend is that
both data sets show an increase with time.
We see a second trend by comparing the bars within each year (the lines are getting closer together). This tells us that a higher percentage of computer users are going on-line.
2)
Will the black line ever eventually be higher than the red line?
Question:

In general,
! Multiple bar graphs are used for qualitative data (i.e. x-axis is categorical). It is just an extension of a single bar graph.
! Multiple line graphs are used for quantitative data (i.e. x-axis is numeric in nature). It is just an extension of a single line graph.
10

Stack Plots
! Another way to show two or more related data sets simultaneously is with a stack plot, which shows different data sets in a vertical stack
! Although data can be stacked in both bar charts and line charts, the latter are perhaps more common.
11

Stacked Bar Plots
! In the following example, each bar is divided into two categories: girls and boys. Each of the three bars represents a whole group: basketball, badminton, volleyball.
12

Stacked Bar Plots ! The plot shows that more students chose
Basketball compared to Volleyball (higher overall bar height).
! The plot shows the count (or proportion) of girls and boys in each of the sport categories.
13
NOTE: This same information could have been presented as a Grouped Bar Chart (as side-by-side bars for each gender).

Stacked Bar Plots ! Articles published in either the Media or
Specialized Reviews.
14 Source: https://www.researchgate.net

Stacked Bar Plots ! Trends: 1) Overall publications increasing
over time. 2) The Media category is accounting for a larger portion of the publications.
15 Source: https://www.researchgate.net

Grouped Bar Plot or Stacked Bar Plot? ! Grouped bar plots are good for comparing
items within categories (like comparing gender within each year below).
16
2001 2002 2003 2004 2005
M M
M M
M F
F F
F F

Grouped Bar Plot or Stacked Bar Plot?
17
2001 2002 2003 2004 2005
M M
M M
M F
F F
F F
! Stacked bar plots are good for comparing the category totals visually (total items per year below) because they aggregate all of the items within each category.
2001 2002 2003 2004 2005
Grouped Bar Plot or Stacked Bar Plot?
18
2001 2002 2003 2004 2005
M M
M M
M F
F F
F F
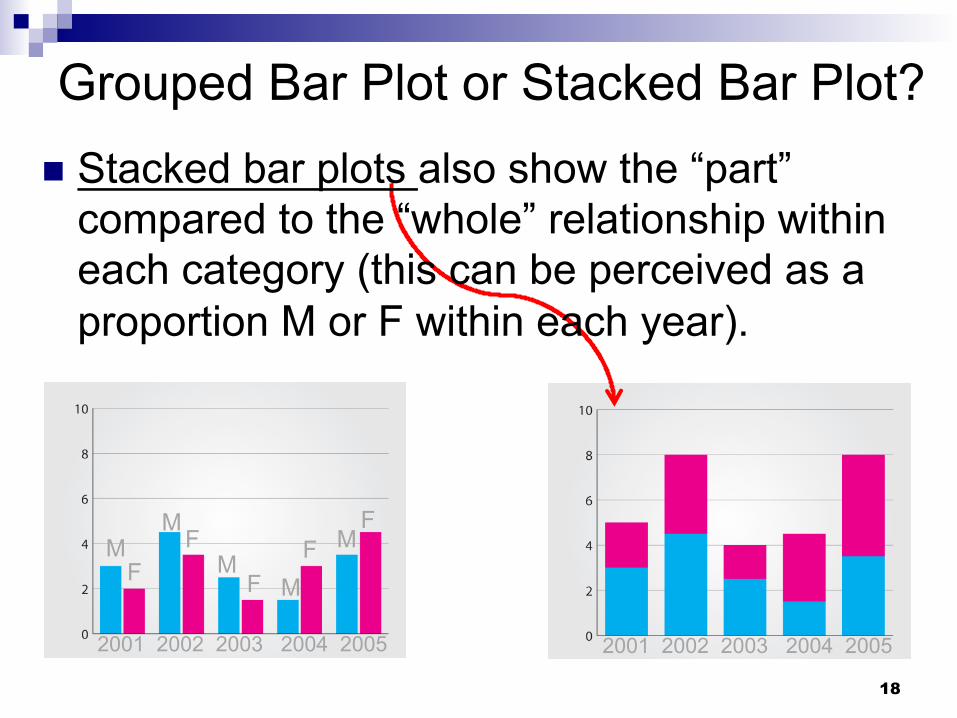
! Stacked bar plots also show the “part” compared to the “whole” relationship within each category (this can be perceived as a proportion M or F within each year).
2001 2002 2003 2004 2005

Stacked Line Chart (or plot) ! A stacked plot can use stacked wedges to
convey the information in the data.
19 Sources: National Center for Health Statistics, American Cancer Society

Example: Health Statistics ! The wedges in the stacked plot convey the
information in the data.
" Each disease (pneumonia, cardiovascular, tuberculosis, cancer) has it’s own color-coded region (or wedge).
" The thickness of the wedge at a particular time tells us its value at that time. ! e.g. In 1980, the death rate for cardiovascular
disease was about 440 deaths per 100,000 people (or as read off the stacked line chart 620-180 = 440).
20

21

Example: Health Statistics ! General trends...
" The downward slope of the top wedge shows that the overall total death rate from these four diseases decreased substantially, from nearly 800 deaths per 100,000 in 1900 to about 525 in 2003.
" Drastic decline in tuberculosis death rate (blue wedge practically disappearing over time).
" Cancer death rate increased steadily until about 1995 when it started to drop a bit (black wedge gives us this information).
22

Example: Race of individuals within each age group
23
88 yr old group (small height or total number)
http://money.cnn.com/interactive/economy/diversity-millennials-boomers/
23 yr old group (largest age group)

“Undulating Ribbon” plot ! So new that the name isn’t settled yet. ! A lot like a stacked line chart, but it is the total width
not the total height that provides information on the total amount of observations at any time.
24 Source: New York Times

“Undulating Ribbon” plot ! Quantity of tweets and topics of tweets at the 2014
State of the Union Address. " A wider plot at any given time, means more tweets. " The topic of defense was tweeted often at the later part. " The highest number of tweets being generated was
around 21 minutes 47 seconds into the speech.
25 http://twitter.github.io/interactive/sotu2014/#p1

Geographical Data ! When raw data correspond to different
geographical locations.
26

Geographical Data ! The connection to location can be very
informative.
27

Geographical Data
28
2015 What is true about the dark blue counties?

Bubble Charts (or plots)
29
! Shows 3-dimensions: x (horizontal), y (vertical) and a 3rd through the size of point.
! You can even throw-in a 4th dimension by using color.
X= murder rate Y=burglary rate Size = population of state

Hans Rosling
! Bubble plot animation ! Life expectancy & income by country over
the last 200 years. ! See video clip from “Joy of Statistics”.
30