undergraduate admissions statistics · undergraduate admissions statistics are provided in the...
TRANSCRIPT

Undergraduate Admissions Statistics2016 cycle
Published May 2017

2 | University of Cambridge
ContentsUndergraduate admissions statistics are provided in the following categories:
1 School/college type 42 Region 63 UCAS tariff 94 Subject 115 College 236 Age 277 Geodemographic classification 28 8 Ethnicity 299 Disability 3010 The admissions process 31
Notes for information• These statistics refer to applications made from September 2015 onwards for admission to courses starting in October
2016 or by deferred entry to courses starting in October 2017. Applicants holding a deferred offer from previousadmissions rounds are not included. Please note that the statistics also exclude 79 applicants (104 last year) throughUCAS who did not submit a Supplementary Application Questionnaire (SAQ) in addition to a UCAS application, asrequired to complete their submission to the University.
• The term ‘Home’ now refers to applicants who have indicated in their UCAS application that they are permanentlyresident in the UK. Where relevant, last year’s figures have been recalculated on this basis. For more information aboutthe UCAS application process please see: www.ucas.com/ucas/undergraduate/apply-and-track.
• Offer figures refer to applicants who received a conditional or unconditional offer of a place.• Acceptance figures include only those applicants who received an unconditional firm offer of a place. It excludes those
made conditional offers who were unsuccessful at confirmation.• Success rate figures show the proportion of applicants accepted at confirmation.• Percentages throughout have been rounded to one decimal place, so values given may not always add up to 100.• Please note that the statistics are not intended for use in the University’s return to the Office of Fair Access (OFFA), as
they are calculated on a different basis. OFFA reporting is on a year of entry rather than an admissions round basis, andexcludes students who withdrew post-confirmation or otherwise did not come into residence at the University.
• Equivalent tables for the previous application cycle may be found in:www.undergraduate.study.cam.ac.uk/files/publications/undergrad_admissions_statistics_2015_cyle.pdf
The following tables and charts are produced annually and are intended to provide astatistical analysis of applicants to the Cambridge Colleges.
The data has been prepared on behalf of the Admissions Forum of the CambridgeColleges by the Cambridge Admissions Office (telephone: 01223 333308, email:[email protected]).
Undergraduate Admissions Statistics – 2016 cycle

University of Cambridge | 3
SummaryPlease note that last year’s figures are shown in italics in brackets.
Table 1.1 Applications, offers and acceptances by type of school/college and gender• The total number of applications is 16,750 (16,431), an increase of 1.9%.• The total number of offers is 4,307 (4,253), an increase of 1.3%.• The total number of acceptances is 3,457 (3,449), an increase of 0.2%.• The male:female ratio of accepted students is 52:48 (52:48).• For applications from Home students attending UK schools/colleges the proportions of acceptances by
school/college type are:Maintained 62.5% (62.0%)Independent 37.5% (38.0%)
Table 3.1 Applications, offers and acceptances by UCAS tariff scores and gender• Of those accepted, 97.0% (97.7%) achieved the equivalent of A*AA (168 UCAS tariff points) or better
counting only their best three A Levels excluding General Studies and Critical Thinking.• The number of unsuccessful applicants who went on to achieve the equivalent of A*AA (168 UCAS tariff
points) or better counting only their best three A Levels excluding General Studies and Critical Thinking is 4,832 (5,075).
Table 7.1 Home applicants, offers and acceptances by HE participation neighbourhood (POLAR3 quintile)• The proportion of those accepted whose home postcode has a matching value in the POLAR3 directory and
who are in the lowest participation quintile is 3.3% (3.1%).• The proportion of those accepted whose home postcode has a matching value in the POLAR3 directory and
who are in the lowest two participation quintiles is 10.6% (9.2%). In addition, 0.6% (0.6%) of those accepted had a home postcode with no match or value in the POLAR3 directory.
Table 7.2 Home applicants, offers and acceptances by OAC flag• The proportion of those accepted whose home postcode has a matching value in the OAC directory and
who are in a flagged subgroup is 7.8% (8.1%). In addition, 0.5% (0.3%) of those accepted had a home postcode with no match or value in the OAC directory.
Table 8.1 Home applicants, offers and acceptances by ethnic origin • The proportion of those accepted whose ethnicity is known and who declare they have an ethnic minority
background or other is 21.8% (20.6%). In addition, 0.7% (1.0%) of those accepted chose not to declare their ethnic origin.
Table 9.1 Applicants, offers and acceptances by disability • The proportion of those accepted who declare they have a disability is 6.2% (5.2%).
1 Applications, offers and acceptances by school/college type
4 | University of Cambridge
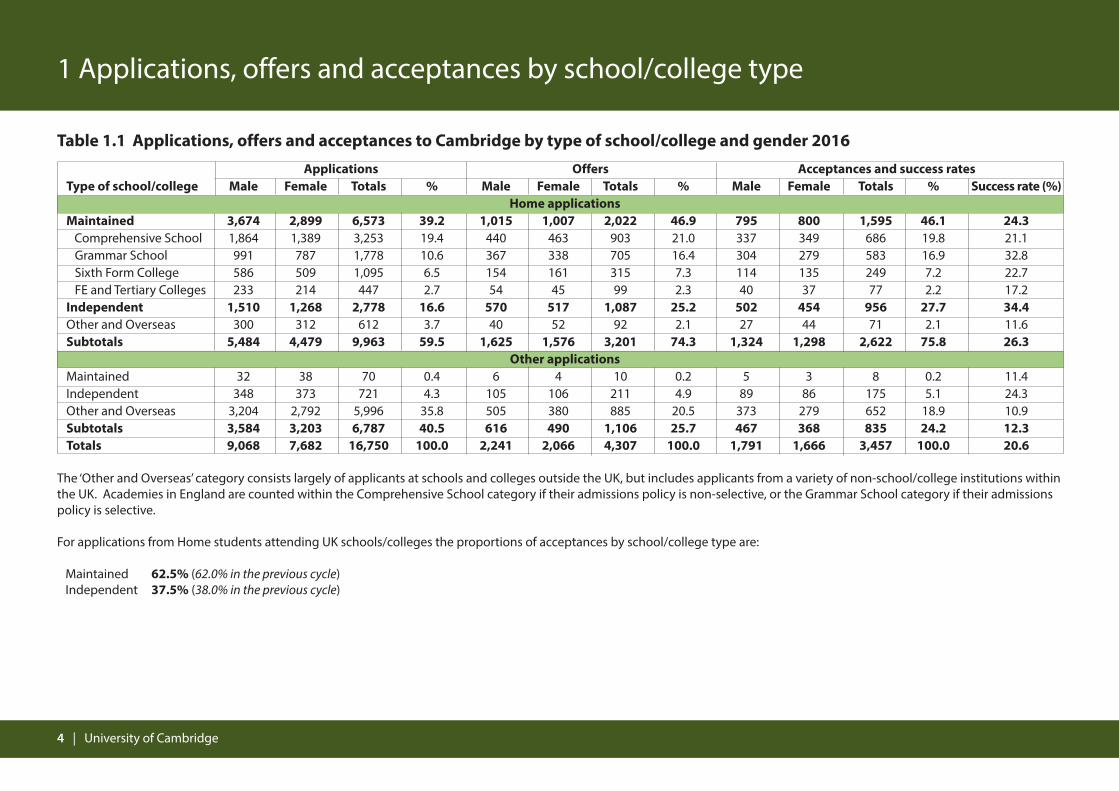
Table 1.1 Applications, offers and acceptances to Cambridge by type of school/college and gender 2016
Applications Offers Acceptances and success rates Type of school/college Male Female Totals % Male Female Totals % Male Female Totals % Success rate (%)
Home applicationsMaintained 3,674 2,899 6,573 39.2 1,015 1,007 2,022 46.9 795 800 1,595 46.1 24.3
Comprehensive School 1,864 1,389 3,253 19.4 440 463 903 21.0 337 349 686 19.8 21.1Grammar School 991 787 1,778 10.6 367 338 705 16.4 304 279 583 16.9 32.8Sixth Form College 586 509 1,095 6.5 154 161 315 7.3 114 135 249 7.2 22.7FE and Tertiary Colleges 233 214 447 2.7 54 45 99 2.3 40 37 77 2.2 17.2
Independent 1,510 1,268 2,778 16.6 570 517 1,087 25.2 502 454 956 27.7 34.4Other and Overseas 300 312 612 3.7 40 52 92 2.1 27 44 71 2.1 11.6Subtotals 5,484 4,479 9,963 59.5 1,625 1,576 3,201 74.3 1,324 1,298 2,622 75.8 26.3
Other applicationsMaintained 32 38 70 0.4 6 4 10 0.2 5 3 8 0.2 11.4Independent 348 373 721 4.3 105 106 211 4.9 89 86 175 5.1 24.3Other and Overseas 3,204 2,792 5,996 35.8 505 380 885 20.5 373 279 652 18.9 10.9Subtotals 3,584 3,203 6,787 40.5 616 490 1,106 25.7 467 368 835 24.2 12.3Totals 9,068 7,682 16,750 100.0 2,241 2,066 4,307 100.0 1,791 1,666 3,457 100.0 20.6
The ‘Other and Overseas’ category consists largely of applicants at schools and colleges outside the UK, but includes applicants from a variety of non-school/college institutions withinthe UK. Academies in England are counted within the Comprehensive School category if their admissions policy is non-selective, or the Grammar School category if their admissionspolicy is selective.
For applications from Home students attending UK schools/colleges the proportions of acceptances by school/college type are:
Maintained 62.5% (62.0% in the previous cycle)Independent 37.5% (38.0% in the previous cycle)

University of Cambridge | 5
Table 1.2 UK schools/colleges submitting Home applicants, and receiving offers andacceptances to Cambridge in any of the last three years (2014-2016)
Academies in England are counted within the Comprehensive School category if their admissions policy is non-selective,or the Grammar School category if their admissions policy is selective.
Type of school/college Applications Offers AcceptancesMaintained 2,217 1,352 1,158Comprehensive School 1,652 952 787Grammar School 230 213 206Sixth Form College 103 87 80FE and Tertiary Colleges 232 100 85
Independent 528 381 362Totals 2,745 1,733 1,520

6 | University of Cambridge
Table 2.1 Applications, offers and acceptances to Cambridge by region 2016
2 Applications, offers and acceptances by region
Applications Offers Acceptances and success ratesRegion of domicile No. % No. % No. % Success rate (%)Northern Ireland 154 0.9 43 1.0 33 1.0 21.4North East 253 1.5 87 2.0 68 2.0 26.9Wales 276 1.6 71 1.6 57 1.6 20.7Scotland 332 2.0 67 1.6 55 1.6 16.6Yorkshire & The Humber 595 3.6 176 4.1 140 4.0 23.5West Midlands 597 3.6 183 4.2 151 4.4 25.3East Midlands 598 3.6 183 4.2 143 4.1 23.9South West 678 4.0 219 5.1 188 5.4 27.7North West 811 4.8 261 6.1 215 6.2 26.5Eastern 1,278 7.6 411 9.5 325 9.4 25.4South East 2,036 12.2 726 16.9 597 17.3 29.3Greater London 2,355 14.1 774 18.0 650 18.8 27.6Overseas (outside UK) 6,787 40.5 1,106 25.7 835 24.2 12.3Totals 16,750 100.0 4,307 100.0 3,457 100.0 20.6
The regions listed are based on applicants’ Area of Permanent Residence (APR) code, as provided by UCAS.
Number of applications to Cambridge by region 2016
Greater London
Northern Ireland North EastWalesScotland
Yorkshire & The Humber
West Midlands
East Midlands
South West
North West
Eastern
South East
Overseas (outside UK)

University of Cambridge | 7
South EastSouth West
Greater LondonNorth East
North WestEastern
West Midlands East Midlands
Yorkshire & The HumberNorthern Ireland
WalesScotland
Overseas (outside UK)
Success rate by region 2016
5%0% 10% 15% 20% 25% 30% 35%

8 | University of Cambridge
Table 2.2 Applications, offers and acceptances to Cambridge by country 2016
Applications Offers Acceptances and success ratesCountry of domicile No. % No. % No. % Success rate (%)China 671 9.9 124 11.2 100 12.0 14.9Hong Kong 496 7.3 113 10.2 92 11.0 18.5Singapore 479 7.1 99 9.0 74 8.9 15.4United States of America 347 5.1 40 3.6 20 2.4 5.8France 315 4.6 37 3.3 29 3.5 9.2Germany 299 4.4 48 4.3 33 4.0 11.0Malaysia 292 4.3 43 3.9 34 4.1 11.6Italy 269 4.0 33 3.0 23 2.8 8.6India 205 3.0 17 1.5 12 1.4 5.9Spain 203 3.0 22 2.0 15 1.8 7.4Poland 193 2.8 44 4.0 36 4.3 18.7Canada 180 2.7 14 1.3 7 0.8 3.9Romania 166 2.4 36 3.3 28 3.4 16.9Ireland 162 2.4 18 1.6 13 1.6 8.0Pakistan 159 2.3 11 1.0 7 0.8 4.4Hungary 127 1.9 34 3.1 31 3.7 24.4Korea (South) 125 1.8 27 2.4 24 2.9 19.2Australia 117 1.7 28 2.5 16 1.9 13.7Belgium 111 1.6 21 1.9 19 2.3 17.1Switzerland 104 1.5 16 1.4 16 1.9 15.4Sweden 101 1.5 14 1.3 11 1.3 10.9Cyprus (European Union) 89 1.3 22 2.0 22 2.6 24.7Greece 83 1.2 11 1.0 6 0.7 7.2Netherlands 81 1.2 10 0.9 8 1.0 9.9Bulgaria 80 1.2 14 1.3 11 1.3 13.8Other EU 426 6.3 81 7.3 60 7.2 14.1Other International 907 13.4 129 11.7 88 10.5 9.7Totals 6,787 100.0 1,106 100.0 835 100.0 12.3
This table lists the top 25 countries outside the UK submitting applications to Cambridge. The countries listed are basedon applicants’ Area of Permanent Residence (APR) code. Countries submitting fewer applications than those in the top 25are aggregated as ‘Other EU’ or ‘Other International’ at the bottom of the table.

UCAS Tariff Score/A Level Applications Offers AcceptancesGrades Male % Female % Total % Male % Female % Total % Male % Female % Total %
Arts, Humanities and Social Sciences168 A*A*A* 373 6.8 423 9.6 796 8.0 195 12.2 256 16.8 451 14.4 189 14.6 251 19.8 440 17.2160 A*A*A 418 7.6 565 12.8 983 9.9 155 9.7 292 19.1 447 14.3 145 11.2 287 22.7 432 16.9152 A*A*B 30 0.5 44 1.0 74 0.7 7 0.4 11 0.7 18 0.6 6 0.5 8 0.6 14 0.5152 A*AA 364 6.6 547 12.4 911 9.2 119 7.5 189 12.4 308 9.9 108 8.3 170 13.4 278 10.9144 299 5.4 432 9.8 731 7.4 55 3.4 111 7.3 166 5.3 23 1.8 44 3.5 67 2.6136 137 2.5 193 4.4 330 3.3 14 0.9 22 1.4 36 1.2 1 0.1 3 0.2 4 0.2128 69 1.3 113 2.6 182 1.8 2 0.1 12 0.8 14 0.4 0 0.0 1 0.1 1 0.0120 32 0.6 53 1.2 85 0.9 1 0.1 4 0.3 5 0.2 0 0.0 0 0.0 0 0.0112 13 0.2 23 0.5 36 0.4 0 0.0 1 0.1 1 0.0 0 0.0 0 0.0 0 0.0104 11 0.2 11 0.2 22 0.2 0 0.0 0 0.0 0 0.0 0 0.0 0 0.0 0 0.096 3 0.1 9 0.2 12 0.1 0 0.0 1 0.1 1 0.0 0 0.0 0 0.0 0 0.088 2 0.0 4 0.1 6 0.1 0 0.0 0 0.0 0 0.0 0 0.0 0 0.0 0 0.080 0 0.0 2 0.0 2 0.0 0 0.0 0 0.0 0 0.0 0 0.0 0 0.0 0 0.072 1 0.0 2 0.0 3 0.0 0 0.0 0 0.0 0 0.0 0 0.0 0 0.0 0 0.064 0 0.0 0 0.0 0 0.0 0 0.0 0 0.0 0 0.0 0 0.0 0 0.0 0 0.048 1 0.0 0 0.0 1 0.0 0 0.0 0 0.0 0 0.0 0 0.0 0 0.0 0 0.0Subtotals 1,753 31.8 2,421 54.9 4,174 42.0 548 34.3 899 58.8 1,447 46.3 472 36.4 764 60.4 1,236 48.2
table continues on next page
3 Applications, offers and acceptances by UCAS tariff score
University of Cambridge | 9
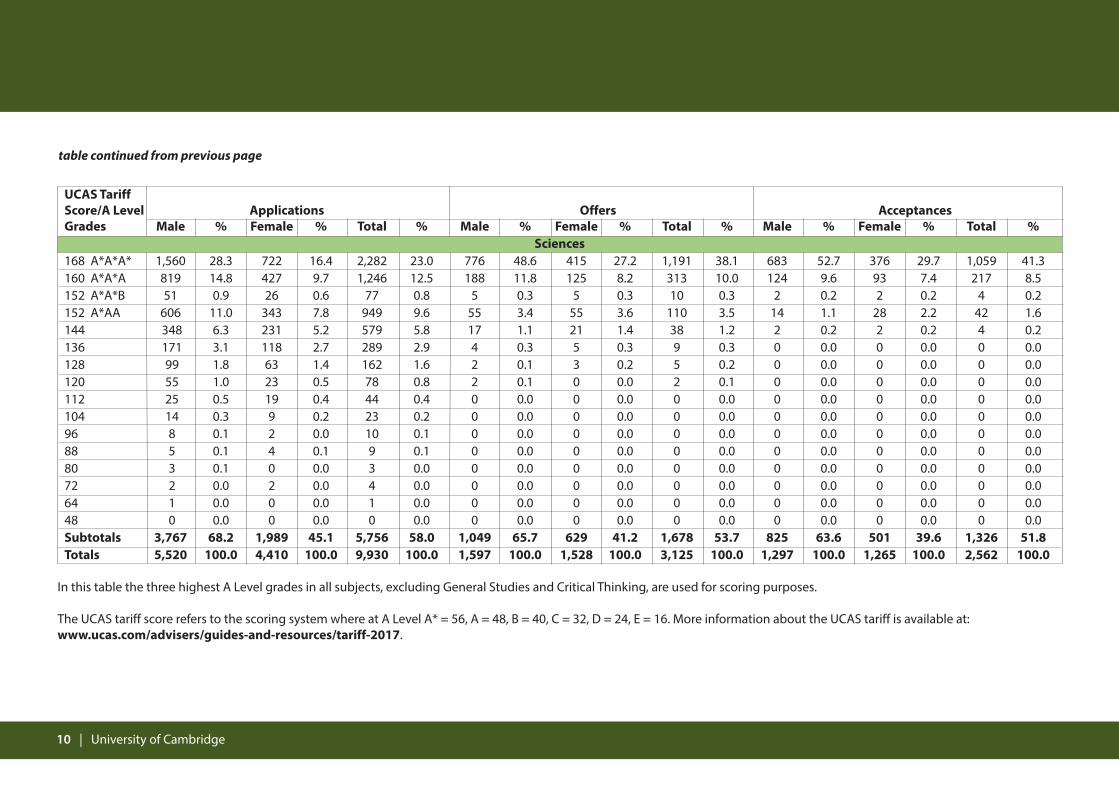
Table 3.1 Applications, offers and acceptances to Cambridge by UCAS tariff score and gender 2016Applicants achieving three or more A Levels by the end of the 2016 admissions cycle
10 | University of Cambridge
table continued from previous page
UCAS Tariff Score/A Level Applications Offers AcceptancesGrades Male % Female % Total % Male % Female % Total % Male % Female % Total %
Sciences168 A*A*A* 1,560 28.3 722 16.4 2,282 23.0 776 48.6 415 27.2 1,191 38.1 683 52.7 376 29.7 1,059 41.3160 A*A*A 819 14.8 427 9.7 1,246 12.5 188 11.8 125 8.2 313 10.0 124 9.6 93 7.4 217 8.5152 A*A*B 51 0.9 26 0.6 77 0.8 5 0.3 5 0.3 10 0.3 2 0.2 2 0.2 4 0.2152 A*AA 606 11.0 343 7.8 949 9.6 55 3.4 55 3.6 110 3.5 14 1.1 28 2.2 42 1.6144 348 6.3 231 5.2 579 5.8 17 1.1 21 1.4 38 1.2 2 0.2 2 0.2 4 0.2136 171 3.1 118 2.7 289 2.9 4 0.3 5 0.3 9 0.3 0 0.0 0 0.0 0 0.0128 99 1.8 63 1.4 162 1.6 2 0.1 3 0.2 5 0.2 0 0.0 0 0.0 0 0.0120 55 1.0 23 0.5 78 0.8 2 0.1 0 0.0 2 0.1 0 0.0 0 0.0 0 0.0112 25 0.5 19 0.4 44 0.4 0 0.0 0 0.0 0 0.0 0 0.0 0 0.0 0 0.0104 14 0.3 9 0.2 23 0.2 0 0.0 0 0.0 0 0.0 0 0.0 0 0.0 0 0.096 8 0.1 2 0.0 10 0.1 0 0.0 0 0.0 0 0.0 0 0.0 0 0.0 0 0.088 5 0.1 4 0.1 9 0.1 0 0.0 0 0.0 0 0.0 0 0.0 0 0.0 0 0.080 3 0.1 0 0.0 3 0.0 0 0.0 0 0.0 0 0.0 0 0.0 0 0.0 0 0.072 2 0.0 2 0.0 4 0.0 0 0.0 0 0.0 0 0.0 0 0.0 0 0.0 0 0.064 1 0.0 0 0.0 1 0.0 0 0.0 0 0.0 0 0.0 0 0.0 0 0.0 0 0.048 0 0.0 0 0.0 0 0.0 0 0.0 0 0.0 0 0.0 0 0.0 0 0.0 0 0.0Subtotals 3,767 68.2 1,989 45.1 5,756 58.0 1,049 65.7 629 41.2 1,678 53.7 825 63.6 501 39.6 1,326 51.8Totals 5,520 100.0 4,410 100.0 9,930 100.0 1,597 100.0 1,528 100.0 3,125 100.0 1,297 100.0 1,265 100.0 2,562 100.0
In this table the three highest A Level grades in all subjects, excluding General Studies and Critical Thinking, are used for scoring purposes.
The UCAS tariff score refers to the scoring system where at A Level A* = 56, A = 48, B = 40, C = 32, D = 24, E = 16. More information about the UCAS tariff is available at:www.ucas.com/advisers/guides-and-resources/tariff-2017.

University of Cambridge | 11
4 Applications, offers and acceptances by subject
Mathematics includes those applying for Mathematics and Mathematics with Physics. The courses in Chemical Engineering,Management Studies and Manufacturing Engineering can be taken only after Part I in another subject. Applications andacceptances for these courses are recorded under the first year subjects taken by the applicants involved.
Table 4.1 Applications, offers and acceptances to Cambridge by subject 2016
Applications Offers Acceptances and success ratesSuccess
Degree programme No. % No. % No. % rate (%)Arts, Humanities and Social Sciences
Anglo-Saxon, Norse, & Celtic 65 0.4 31 0.7 21 0.6 32.3Architecture 360 2.1 49 1.1 44 1.3 12.2Asian & Middle Eastern Studies 121 0.7 49 1.1 38 1.1 31.4Classics 146 0.9 93 2.2 78 2.3 53.4Classics (4 years) 32 0.2 16 0.4 11 0.3 34.4Economics 1,183 7.1 189 4.4 164 4.7 13.9Education 105 0.6 43 1.0 31 0.9 29.5English 726 4.3 219 5.1 190 5.5 26.2Geography 322 1.9 120 2.8 97 2.8 30.1History 607 3.6 232 5.4 199 5.8 32.8History of Art 102 0.6 32 0.7 26 0.8 25.5Human, Social, & Political Sciences 1,070 6.4 234 5.4 182 5.3 17.0Land Economy 248 1.5 67 1.6 56 1.6 22.6Law 1,048 6.3 256 5.9 217 6.3 20.7Linguistics 113 0.7 42 1.0 38 1.1 33.6Modern & Medieval Languages 385 2.3 198 4.6 176 5.1 45.7Music 130 0.8 71 1.6 61 1.8 46.9Philosophy 200 1.2 57 1.3 48 1.4 24.0Theology & Religious Studies 100 0.6 57 1.3 43 1.2 43.0Subtotals 7,063 42.2 2,055 47.7 1,720 49.8 24.4
SciencesComputer Science 719 4.3 124 2.9 99 2.9 13.8Engineering 2,351 14.0 414 9.6 337 9.7 14.3Mathematics 1,312 7.8 527 12.2 256 7.4 19.5Medicine 1,274 7.6 290 6.7 269 7.8 21.1Medicine Graduate Course 363 2.2 27 0.6 23 0.7 6.3Natural Sciences 2,943 17.6 703 16.3 618 17.9 21.0Psychological & Behavioural Sciences 497 3.0 91 2.1 75 2.2 15.1Veterinary Medicine 228 1.4 76 1.8 60 1.7 26.3Subtotals 9,687 57.8 2,252 52.3 1,737 50.2 17.9Totals 16,750 100.0 4,307 100.0 3,457 100.0 20.6
12 | University of Cambridge
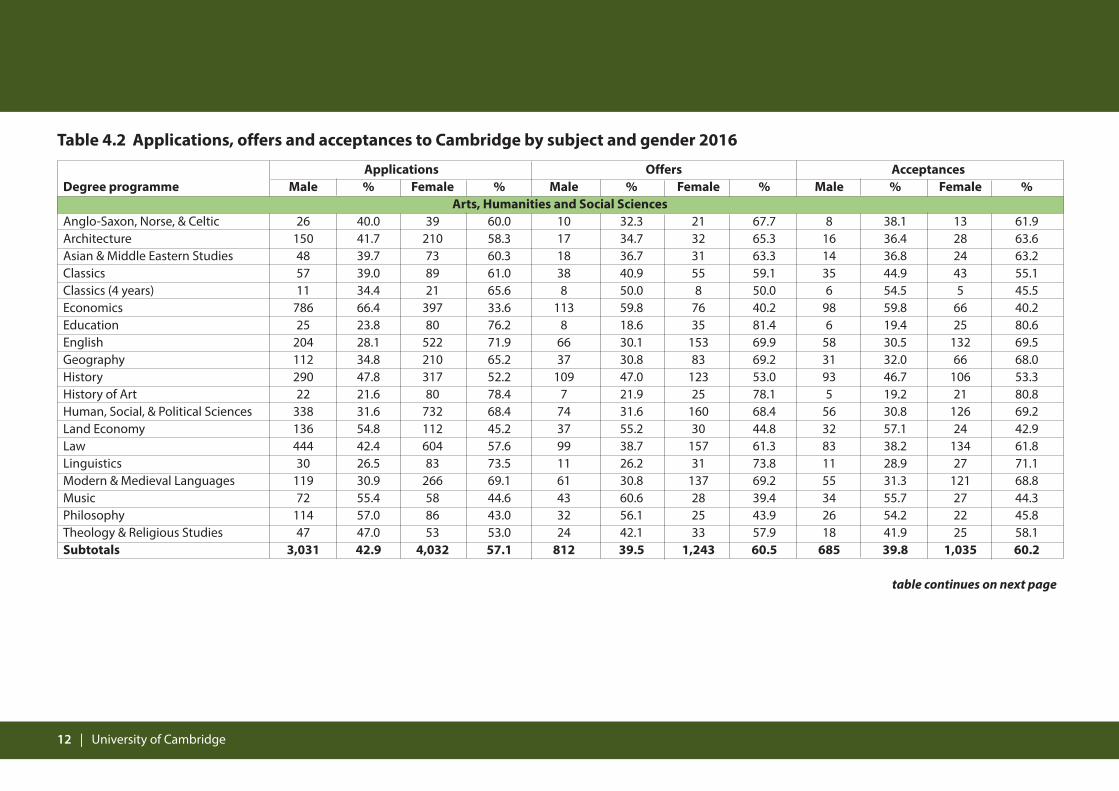
Table 4.2 Applications, offers and acceptances to Cambridge by subject and gender 2016
Applications Offers Acceptances Degree programme Male % Female % Male % Female % Male % Female %
Arts, Humanities and Social Sciences Anglo-Saxon, Norse, & Celtic 26 40.0 39 60.0 10 32.3 21 67.7 8 38.1 13 61.9Architecture 150 41.7 210 58.3 17 34.7 32 65.3 16 36.4 28 63.6Asian & Middle Eastern Studies 48 39.7 73 60.3 18 36.7 31 63.3 14 36.8 24 63.2Classics 57 39.0 89 61.0 38 40.9 55 59.1 35 44.9 43 55.1Classics (4 years) 11 34.4 21 65.6 8 50.0 8 50.0 6 54.5 5 45.5Economics 786 66.4 397 33.6 113 59.8 76 40.2 98 59.8 66 40.2Education 25 23.8 80 76.2 8 18.6 35 81.4 6 19.4 25 80.6English 204 28.1 522 71.9 66 30.1 153 69.9 58 30.5 132 69.5Geography 112 34.8 210 65.2 37 30.8 83 69.2 31 32.0 66 68.0History 290 47.8 317 52.2 109 47.0 123 53.0 93 46.7 106 53.3History of Art 22 21.6 80 78.4 7 21.9 25 78.1 5 19.2 21 80.8Human, Social, & Political Sciences 338 31.6 732 68.4 74 31.6 160 68.4 56 30.8 126 69.2Land Economy 136 54.8 112 45.2 37 55.2 30 44.8 32 57.1 24 42.9Law 444 42.4 604 57.6 99 38.7 157 61.3 83 38.2 134 61.8Linguistics 30 26.5 83 73.5 11 26.2 31 73.8 11 28.9 27 71.1Modern & Medieval Languages 119 30.9 266 69.1 61 30.8 137 69.2 55 31.3 121 68.8Music 72 55.4 58 44.6 43 60.6 28 39.4 34 55.7 27 44.3Philosophy 114 57.0 86 43.0 32 56.1 25 43.9 26 54.2 22 45.8Theology & Religious Studies 47 47.0 53 53.0 24 42.1 33 57.9 18 41.9 25 58.1Subtotals 3,031 42.9 4,032 57.1 812 39.5 1,243 60.5 685 39.8 1,035 60.2
table continues on next page

University of Cambridge | 13
Mathematics includes those applying for Mathematics and Mathematics with Physics. The courses in Chemical Engineering, Management Studies and Manufacturing Engineering canbe taken only after Part I in another subject. Applications and acceptances for these courses are recorded under the first year subjects taken by the applicants involved.
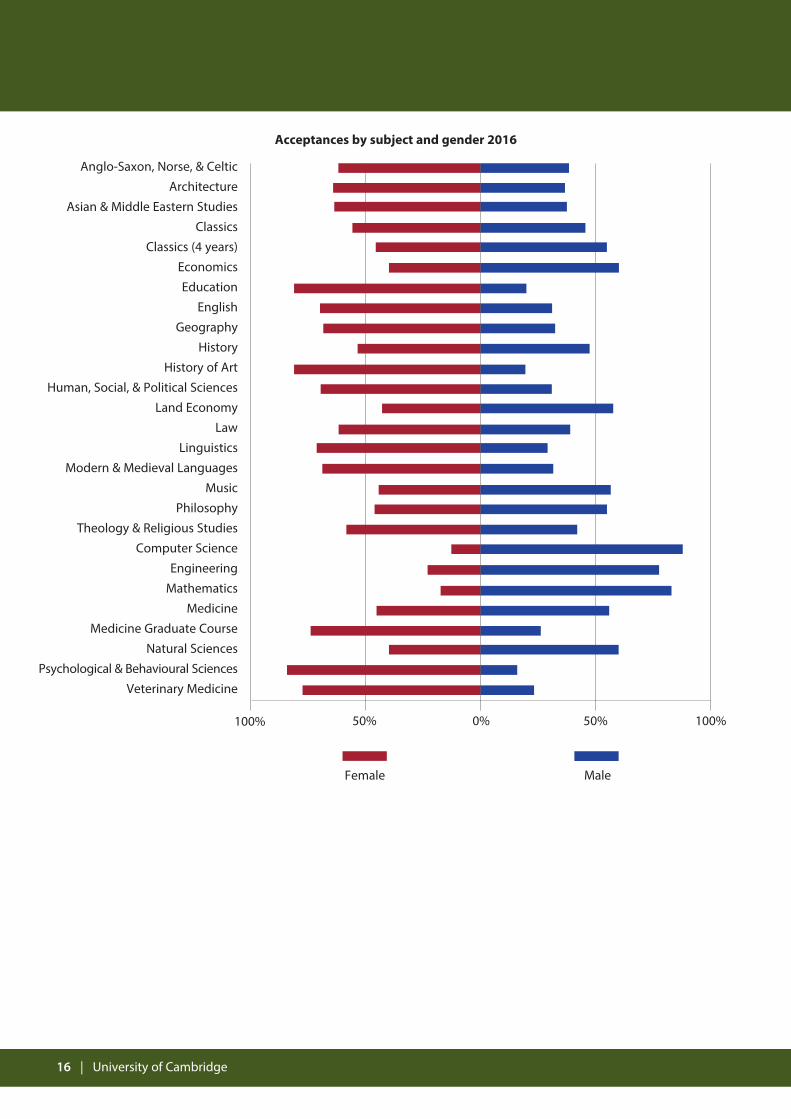
Applications Offers Acceptances Degree programme Male % Female % Male % Female % Male % Female %
SciencesComputer Science 621 86.4 98 13.6 102 82.3 22 17.7 86 86.9 13 13.1Engineering 1,854 78.9 497 21.1 311 75.1 103 24.9 259 76.9 78 23.1Mathematics 972 74.1 340 25.9 405 76.9 122 23.1 211 82.4 45 17.6Medicine 580 45.5 694 54.5 160 55.2 130 44.8 149 55.4 120 44.6Medicine Graduate Course 153 42.1 210 57.9 8 29.6 19 70.4 6 26.1 17 73.9Natural Sciences 1,718 58.4 1,225 41.6 413 58.7 290 41.3 369 59.7 249 40.3Psychological & Behavioural Sciences 98 19.7 399 80.3 14 15.4 77 84.6 12 16.0 63 84.0Veterinary Medicine 41 18.0 187 82.0 16 21.1 60 78.9 14 23.3 46 76.7Subtotals 6,037 62.3 3,650 37.7 1,429 63.5 823 36.5 1,106 63.7 631 36.3Totals 9,068 54.1 7,682 45.9 2,241 52.0 2,066 48.0 1,791 51.8 1,666 48.2
table continued from previous page
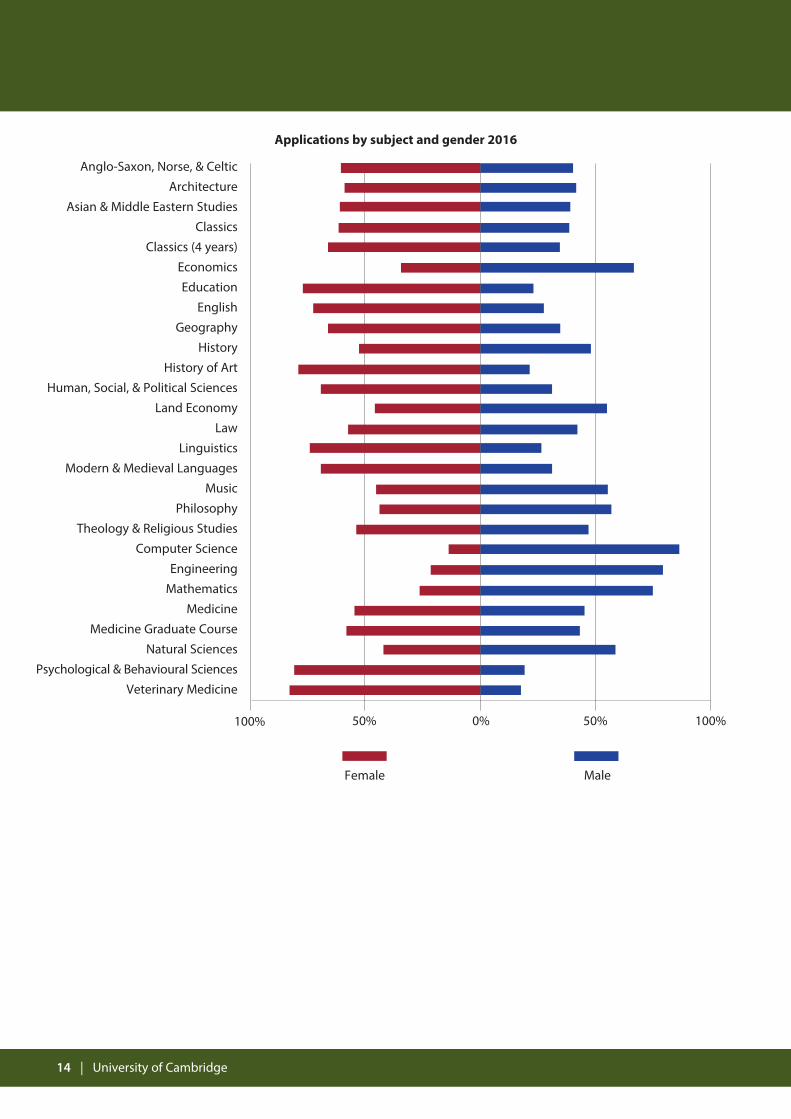
Applications by subject and gender 2016
100% 50% 0% 50% 100%
Female Male
Anglo-Saxon, Norse, & Celtic
Architecture
Asian & Middle Eastern Studies
Classics
Classics (4 years)
Economics
Education
English
Geography
History
History of Art
Human, Social, & Political Sciences
Land Economy
Law
Linguistics
Modern & Medieval Languages
Music
Philosophy
Theology & Religious Studies
Computer Science
Engineering
Mathematics
Medicine
Medicine Graduate Course
Natural Sciences
Psychological & Behavioural Sciences
Veterinary Medicine
14 | University of Cambridge

University of Cambridge | 15
Anglo-Saxon, Norse, & Celtic
Architecture
Asian & Middle Eastern Studies
Classics
Classics (4 years)
Economics
Education
English
Geography
History
History of Art
Human, Social, & Political Sciences
Land Economy
Law
Linguistics
Modern & Medieval Languages
Music
Philosophy
Theology & Religious Studies
Computer Science
Engineering
Mathematics
Medicine
Medicine Graduate Course
Natural Sciences
Psychological & Behavioural Sciences
Veterinary Medicine
Offers by subject and gender 2016
100% 50% 0% 50% 100%
Female Male
16 | University of Cambridge
Anglo-Saxon, Norse, & Celtic
Architecture
Asian & Middle Eastern Studies
Classics
Classics (4 years)
Economics
Education
English
Geography
History
History of Art
Human, Social, & Political Sciences
Land Economy
Law
Linguistics
Modern & Medieval Languages
Music
Philosophy
Theology & Religious Studies
Computer Science
Engineering
Mathematics
Medicine
Medicine Graduate Course
Natural Sciences
Psychological & Behavioural Sciences
Veterinary Medicine
Acceptances by subject and gender 2016
100% 50% 0% 50% 100%
Female Male

University of Cambridge | 17
Applications Offers Acceptances Home Home All Home Home All Home Home All
Degree programme Maintained Independent Others* Maintained Independent Others* Maintained Independent Others*Arts, Humanities and Social Sciences
Anglo-Saxon, Norse, & Celtic 28 15 22 14 9 8 11 5 5Architecture 120 62 175 24 13 12 22 12 10Asian & Middle Eastern Studies 36 33 52 17 16 16 12 15 11Classics 31 86 29 24 55 14 18 51 9Classics (4 years) 23 1 8 10 0 6 6 0 5Economics 349 189 642 62 53 74 55 49 60Education 31 18 53 18 13 12 12 11 8English 374 199 151 128 64 27 108 60 22Geography 187 90 45 70 39 11 54 34 9History 329 167 110 135 74 23 111 71 17History of Art 26 33 42 10 13 9 10 10 6Human, Social, & Political Sciences 364 190 510 116 46 71 94 36 51Land Economy 57 53 138 20 17 30 15 15 26Law 329 91 618 93 40 121 78 36 101Linguistics 47 16 48 22 9 11 20 9 9Modern & Medieval Languages 195 146 44 104 77 17 90 71 15Music 50 52 28 28 38 5 26 32 3Philosophy 90 42 68 30 15 12 25 13 10Theology & Religious Studies 38 43 19 26 23 8 18 20 5Subtotals 2,704 1,526 2,802 951 614 487 785 550 382
table continues on next page
Table 4.3 Applications, offers and acceptances to Cambridge by subject and school type 2016

Applications Offers Acceptances Home Home All Home Home All Home Home All
Degree programme Maintained Independent Others* Maintained Independent Others* Maintained Independent Others*Sciences
Computer Science 278 69 370 57 15 52 48 13 38Engineering 819 293 1,237 161 88 165 138 71 128Mathematics 723 134 450 278 81 166 108 49 99Medicine 438 201 623 152 100 37 144 94 31Medicine Graduate Course† 14 6 301 0 1 23 0 1 19Natural Sciences 1,285 462 1,192 330 155 217 294 153 170Psychological & Behavioural Sciences 209 49 230 47 12 30 40 9 24Veterinary Medicine 103 38 85 46 21 9 38 16 6Subtotals 3,869 1,252 4,488 1,071 473 699 810 406 515Totals 6,573 2,778 7,290 2,022 1,087 1,186 1,595 956 897
table continued from previous page
Mathematics includes those applying for Mathematics and Mathematics with Physics. The courses in Chemical Engineering, Management Studies and Manufacturing Engineering can betaken only after Part I in another subject. Applications and acceptances for these courses are recorded under the first year subjects taken by the applicants involved.
* The ‘All Others’ category includes Home applicants not at UK schools and colleges and all other applicants at any type of institution.
† While most applicants for the Medicine Graduate Course apply to Cambridge for entry directly following study at an HE institution, some applicants undertake further science A Levelstudy at UK schools or colleges and are categorised accordingly above. Such applicants are recorded in this table for completeness but omitted from the charts that follow as their numberis so small.
18 | University of Cambridge

Anglo-Saxon, Norse, & Celtic
Architecture
Asian & Middle Eastern Studies
Classics
Classics (4 years)
Economics
Education
English
Geography
History
History of Art
Human, Social, & Political Sciences
Land Economy
Law
Linguistics
Modern & Medieval Languages
Music
Philosophy
Theology & Religious Studies
Number of Home applications from UK schools/colleges 2016
400 300 0 200 300
Home Maintained Home Independent
Arts, Humanities and Social Sciences
200 100 100
University of Cambridge | 19

Anglo-Saxon, Norse, & Celtic
Architecture
Asian & Middle Eastern Studies
Classics
Classics (4 years)
Economics
Education
English
Geography
History
History of Art
Human, Social, & Political Sciences
Land Economy
Law
Linguistics
Modern & Medieval Languages
Music
Philosophy
Theology & Religious Studies
20 | University of Cambridge
Number of Home offers from UK schools/colleges 2016
100 0 50 100
Home Maintained Home Independent
50

University of Cambridge | 21
Anglo-Saxon, Norse, & Celtic
Architecture
Asian & Middle Eastern Studies
Classics
Classics (4 years)
Economics
Education
English
Geography
History
History of Art
Human, Social, & Political Sciences
Land Economy
Law
Linguistics
Modern & Medieval Languages
Music
Philosophy
Theology & Religious Studies
Number of Home acceptances from UK schools/colleges 2016
100 0 50 100
Home Maintained Home Independent
50

22 | University of Cambridge
Number of Home applications from UK schools/colleges 2016
1200 1000 0 400 600
Home Maintained Home Independent
Sciences
800 400 200600 200
Number of Home offers from UK schools/colleges 2016
300 0 100 200
Home Maintained Home Independent
200 100
Computer ScienceEngineeringMathematics
MedicineNatural Sciences
Psychological & Behavioural Sciences Veterinary Medicine
Computer ScienceEngineeringMathematics
MedicineNatural Sciences
Psychological & Behavioural Sciences Veterinary Medicine
Number of Home acceptances from UK schools/colleges 2016
300 0 100 200
Home Maintained Home Independent
200 100
Computer ScienceEngineeringMathematics
MedicineNatural Sciences
Psychological & Behavioural Sciences Veterinary Medicine

University of Cambridge | 23
5 Applications, offers and acceptances by College
The College of application in the data above is defined as the applicant’s first choice College (or, in the case of an openapplicant, the College to which the applicant was allocated) regardless of subsequent transfers through the pools.
The figures include only Home applicants who applied from a school or college in the UK and show the percentage ofapplications and acceptances by College from the maintained sector, including FE institutions.
* The majority of applicants to the four Mature Colleges apply from institutions other than UK schools and colleges, orindependently of a school or college. Relevant applications and acceptances are counted in this table, but differences ofone or two applicants can have a disproportionate effect on the percentages year-on-year and no particular conclusionshould be drawn from this.
Table 5.1 Proportion of Home applications, offers and acceptances to Cambridge from the maintained sector by College 2016
College Applications % Maintained Offers % Maintained Acceptances % MaintainedChrist's 433 74.4 113 67.3 94 66.0Churchill 407 84.8 142 70.4 87 67.8Clare 491 71.9 145 66.2 126 64.3Corpus Christi 284 64.4 74 58.1 60 61.7Downing 337 67.7 112 67.0 96 65.6Emmanuel 483 66.9 136 66.2 110 65.5Fitzwilliam 298 74.5 123 63.4 101 62.4Girton 255 78.0 123 70.7 107 68.2Gonville and Caius 391 59.6 144 58.3 132 55.3Homerton 269 78.4 145 70.3 124 68.5Hughes Hall* 35 94.3 12 66.7 8 62.5Jesus 492 62.6 145 66.2 123 62.6King’s 602 85.2 98 74.5 81 74.1Lucy Cavendish* 45 82.2 6 66.7 5 60.0Magdalene 232 65.9 84 64.3 69 63.8Murray Edwards 121 88.4 100 74.0 80 71.3Newnham 162 72.2 130 66.2 96 61.5Pembroke 511 65.9 123 63.4 109 62.4Peterhouse 200 66.5 63 65.1 51 60.8Queens’ 629 69.0 158 67.7 123 64.2Robinson 229 75.1 128 68.0 106 61.3St Catharine’s 426 65.3 131 61.8 110 55.5St Edmund’s* 26 80.8 10 40.0 7 42.9St John’s 568 61.3 163 46.6 137 46.0Selwyn 350 69.1 112 72.3 89 71.9Sidney Sussex 308 61.7 105 65.7 85 63.5Trinity 415 69.2 146 54.8 128 53.1Trinity Hall 297 66.0 109 65.1 91 59.3Wolfson* 55 87.3 21 76.2 16 75.0Open offers - - 8 62.5 - -Totals 9,351 70.3 3,109 65.0 2,551 62.5

24 | University of Cambridge
Number of Home applications from UK schools/colleges 2016
400 300 0 200 300
Home Maintained Home Independent
200 100 100
Christ’sChurchill
ClareCorpus Christi
DowningEmmanuelFitzwilliam
GirtonGonville and Caius
HomertonHughes Hall
JesusKing’s
Lucy CavendishMagdalene
Murray EdwardsNewnhamPembroke
PeterhouseQueens’
RobinsonSt Catharine’sSt Edmund’s
St John’sSelwyn
Sidney SussexTrinity
Trinity HallWolfson
500

University of Cambridge | 25
0 100100 50 50
Number of Home offers from UK schools/colleges 2016
Home Maintained Home Independent
Christ’sChurchill
ClareCorpus Christi
DowningEmmanuelFitzwilliam
GirtonGonville and Caius
HomertonHughes Hall
JesusKing’s
Lucy CavendishMagdalene
Murray EdwardsNewnhamPembroke
PeterhouseQueens’
RobinsonSt Catharine’sSt Edmund’s
St John’sSelwyn
Sidney SussexTrinity
Trinity HallWolfson
Open offers

26 | University of Cambridge
Christ’sChurchill
ClareCorpus Christi
DowningEmmanuelFitzwilliam
GirtonGonville and Caius
HomertonHughes Hall
JesusKing’s
Lucy CavendishMagdalene
Murray EdwardsNewnhamPembroke
PeterhouseQueens’
RobinsonSt Catharine’sSt Edmund’s
St John’sSelwyn
Sidney SussexTrinity
Trinity HallWolfson
Number of Home acceptances from UK schools/colleges 2016
100 0 100
Home Maintained Home Independent
50 50
University of Cambridge | 27
6 Applicants, offers and acceptances by age
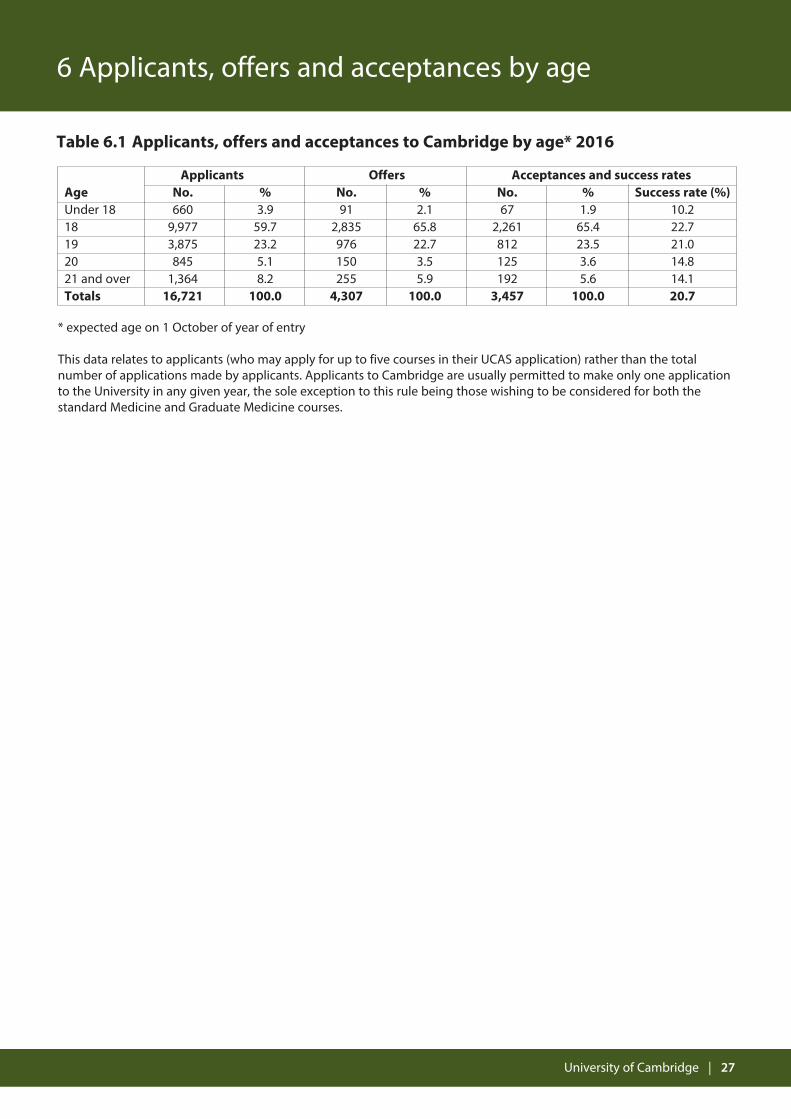
Table 6.1 Applicants, offers and acceptances to Cambridge by age* 2016
* expected age on 1 October of year of entry
This data relates to applicants (who may apply for up to five courses in their UCAS application) rather than the totalnumber of applications made by applicants. Applicants to Cambridge are usually permitted to make only one applicationto the University in any given year, the sole exception to this rule being those wishing to be considered for both thestandard Medicine and Graduate Medicine courses.
Applicants Offers Acceptances and success ratesAge No. % No. % No. % Success rate (%)Under 18 660 3.9 91 2.1 67 1.9 10.218 9,977 59.7 2,835 65.8 2,261 65.4 22.719 3,875 23.2 976 22.7 812 23.5 21.020 845 5.1 150 3.5 125 3.6 14.821 and over 1,364 8.2 255 5.9 192 5.6 14.1Totals 16,721 100.0 4,307 100.0 3,457 100.0 20.7

28 | University of Cambridge
7 Applicants, offers and acceptances by geodemographic classification
Table 7.1 Home applicants, offers and acceptances to Cambridge by POLAR3 quintile 2016
This data relates to applicants (who may apply for up to five courses in their UCAS application) rather than the totalnumber of applications made by applicants. Applicants to Cambridge are usually permitted to make only one applicationto the University in any given year, the sole exception to this rule being those wishing to be considered for both thestandard Medicine and Graduate Medicine courses.
POLAR3 is a classification of UK postcode areas showing the participation of young people in higher education (HE),where 5 signifies the highest-participation neighbourhood quintile and 1 the lowest. More information about POLAR3 isavailable at: www.hefce.ac.uk/analysis/yp/POLAR/.
Applicants Offers Acceptances and success rates POLAR3 quintile No. % No. % No. % Success rate (%)5 4,791 48.2 1,714 53.5 1,467 55.9 30.64 2,270 22.8 690 21.6 562 21.4 24.83 1,424 14.3 396 12.4 301 11.5 21.12 891 9.0 256 8.0 192 7.3 21.51 502 5.0 126 3.9 85 3.2 16.9Unknown 72 0.7 19 0.6 15 0.6 20.8Totals 9,950 100.0 3,201 100.0 2,622 100.0 26.4
Table 7.2 Home applicants, offers and acceptances to Cambridge by OAC flag 2016
This data relates to applicants (who may apply for up to five courses in their UCAS application) rather than the totalnumber of applications made by applicants. Applicants to Cambridge are usually permitted to make only one applicationto the University in any given year, the sole exception to this rule being those wishing to be considered for both thestandard Medicine and Graduate Medicine courses.
OAC (Output Area Classification) data provides information about the dominant socio-demographic characteristics of anapplicant’s residential neighbourhood. Applicants are flagged if they live in a neighbourhood whose characteristics areoften associated with relative disadvantage and low Cambridge application rates. More information about OAC isavailable at: www.ons.gov.uk/methodology/geography/geographicalproducts/areaclassifications.
Applicants Offers Acceptances and success rates OAC flag No. % No. % No. % Success rate (%)Flagged 1,215 12.2 293 9.2 204 7.8 16.8Unflagged 8,661 87.0 2,892 90.3 2,406 91.8 27.8Unknown 74 0.7 16 0.5 12 0.5 16.2Totals 9,950 100.0 3,201 100.0 2,622 100.0 26.4
University of Cambridge | 29
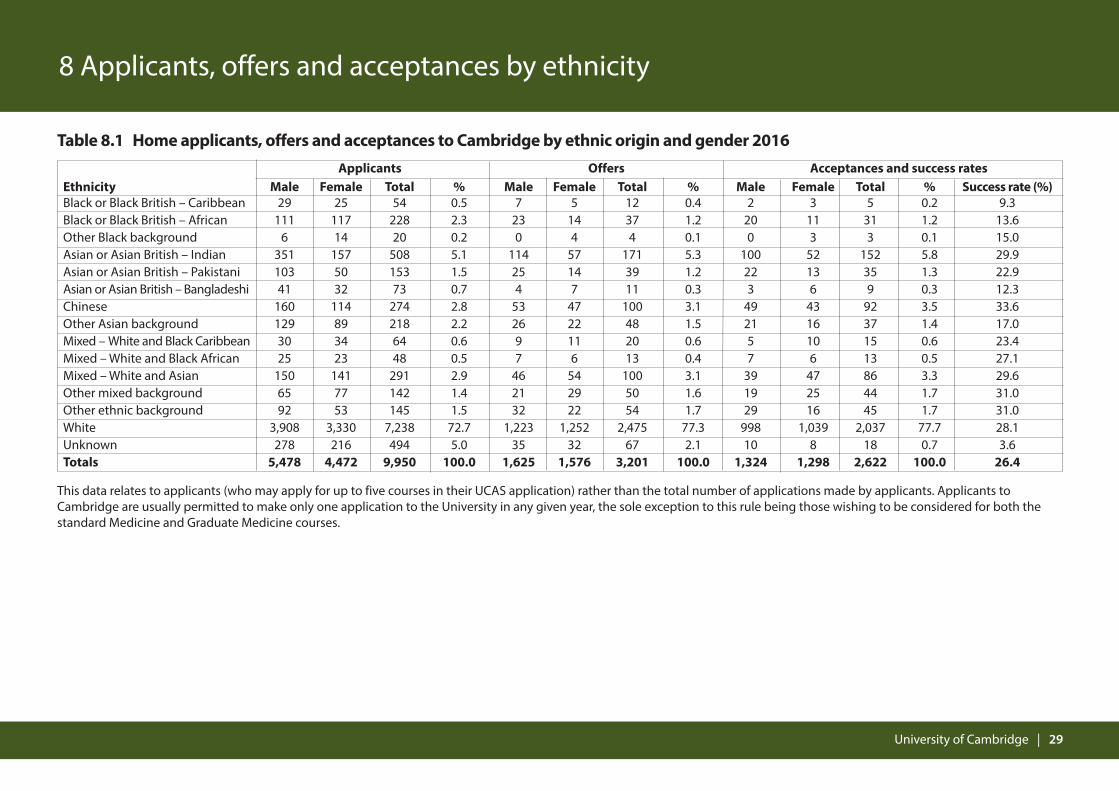
8 Applicants, offers and acceptances by ethnicity
This data relates to applicants (who may apply for up to five courses in their UCAS application) rather than the total number of applications made by applicants. Applicants toCambridge are usually permitted to make only one application to the University in any given year, the sole exception to this rule being those wishing to be considered for both thestandard Medicine and Graduate Medicine courses.
Table 8.1 Home applicants, offers and acceptances to Cambridge by ethnic origin and gender 2016Applicants Offers Acceptances and success rates
Ethnicity Male Female Total % Male Female Total % Male Female Total % Success rate (%)Black or Black British – Caribbean 29 25 54 0.5 7 5 12 0.4 2 3 5 0.2 9.3Black or Black British – African 111 117 228 2.3 23 14 37 1.2 20 11 31 1.2 13.6Other Black background 6 14 20 0.2 0 4 4 0.1 0 3 3 0.1 15.0Asian or Asian British – Indian 351 157 508 5.1 114 57 171 5.3 100 52 152 5.8 29.9Asian or Asian British – Pakistani 103 50 153 1.5 25 14 39 1.2 22 13 35 1.3 22.9Asian or Asian British – Bangladeshi 41 32 73 0.7 4 7 11 0.3 3 6 9 0.3 12.3Chinese 160 114 274 2.8 53 47 100 3.1 49 43 92 3.5 33.6Other Asian background 129 89 218 2.2 26 22 48 1.5 21 16 37 1.4 17.0Mixed – White and Black Caribbean 30 34 64 0.6 9 11 20 0.6 5 10 15 0.6 23.4Mixed – White and Black African 25 23 48 0.5 7 6 13 0.4 7 6 13 0.5 27.1Mixed – White and Asian 150 141 291 2.9 46 54 100 3.1 39 47 86 3.3 29.6Other mixed background 65 77 142 1.4 21 29 50 1.6 19 25 44 1.7 31.0Other ethnic background 92 53 145 1.5 32 22 54 1.7 29 16 45 1.7 31.0White 3,908 3,330 7,238 72.7 1,223 1,252 2,475 77.3 998 1,039 2,037 77.7 28.1Unknown 278 216 494 5.0 35 32 67 2.1 10 8 18 0.7 3.6Totals 5,478 4,472 9,950 100.0 1,625 1,576 3,201 100.0 1,324 1,298 2,622 100.0 26.4

30 | University of Cambridge
This data relates to applicants (who may apply for up to five courses in their UCAS application) rather than the total number of applications made by applicants. Applicants toCambridge are usually permitted to make only one application to the University in any given year, the sole exception to this rule being those wishing to be considered for both thestandard Medicine and Graduate Medicine courses.
9 Applicants, offers and acceptances by disability
Table 9.1 Applicants, offers and acceptances to Cambridge by disability 2016Applicants Offers Acceptances and success rates
Disability No. % No. % No. % Success rate (%)Autistic spectrum disorder or Asperger's Syndrome 98 0.6 39 0.9 31 0.9 31.6Blind or partially sighted 22 0.1 4 0.1 3 0.1 13.6Deaf or serious hearing impairment 17 0.1 4 0.1 4 0.1 23.5Long standing illness (e.g. diabetes, epilepsy, heart condition) 101 0.6 28 0.7 20 0.6 19.8Mental health condition 207 1.2 57 1.3 38 1.1 18.4Specific learning difficulty (e.g. dyslexia, dyspraxia) 359 2.1 81 1.9 68 2.0 18.9Physical impairment or mobility difficulties 27 0.2 10 0.2 9 0.3 33.3Other disability or medical condition 140 0.8 36 0.8 30 0.9 21.4Two or more of the above 67 0.4 16 0.4 13 0.4 19.4No disability declared 15,683 93.8 4,032 93.6 3,241 93.8 20.7Totals 16,721 100.0 4,307 100.0 3,457 100.0 20.7

University of Cambridge | 31
10 The admissions process
Table 10.1 Progress of applicants through the admissions process 2016
Applications Offers AcceptancesWinter via Winter Summer by Offering via Summer
Type of school/college Direct Open Pooled Direct Pool Pooled College PoolApplications for entry in 2016
Home Maintained 5,881 468 1,530 1,526 409 161 1,482 43Home Independent 2,576 67 931 835 175 50 882 11All Others* 5,647 1,369 1,172 914 185 77 801 27Subtotals 14,104 1,904 3,633 3,275 769 288 3,165 81
Applications for deferred entry in 2017Home Maintained 213 11 52 60 27 12 69 1Home Independent 131 4 42 59 18 10 62 1All Others* 349 34 77 60 39 3 77 1Subtotals 693 49 171 179 84 25 208 3Totals 14,797 1,953 3,804 3,454 853 313 3,373 84
* The ‘All Others’ category includes Home applicants not at UK schools and colleges and all other applicants at any type ofinstitution.
Applications:• Applicants to Cambridge can choose to make a direct application to a College of their choice or to make an open
application, where the application is allocated to a College by computer algorithm.• Applicants may be placed in the Winter Pool by the College to which they applied (or were allocated in the case of
open applicants) for a number of reasons, summarised here:www.undergraduate.study.cam.ac.uk/applying/decisions.
Offers:• Direct offers are those made by the College to which applicants applied (or were allocated in the case of open
applicants), regardless of whether the application was placed in the Winter Pool.• Offers made via the Winter Pool are those made to pooled applicants by a College other than that to which they
applied (or were allocated).• Offer-holders may sometimes be placed in the Summer Pool by their offering College if, following the publication of
examination results, they have narrowly missed the conditions of their offer.
Acceptances:• Acceptances may be made by the offering College, regardless of whether the application was placed in the Summer
Pool, or by a College other than that which made the original offer via the Summer Pool.