underemployment in the uk revisited - dartmouth · web viewunderemployment in the uk revisited...
TRANSCRIPT

Underemployment in the UK Revisited
David N.F. BellDivision of Economics
Stirling Management School, University of Stirling, IZA and CPC
and
David G. BlanchflowerBruce V. Rauner Professor of Economics,
Department of Economics, Dartmouth College,Division of Economics, Stirling Management School, University of Stirling,
Peterson Institute for International Economics,IZA and NBER
March 21st 2013
Please do not quote

Summary
This paper addresses the issue of underemployment in the UK labour market – the demand for hours of work is less than workers willingness to supply extra hours. Workers would like to work more hours, but there is insufficient product demand to justify additional hours. This phenomenon has been evident in the UK labour market for some time, but has grown significantly during the Great Recession. In this paper, we develop a new index of underemployment which is intended to combine indicators of excess capacity on the extensive (jobs) and intensive (hours) margins of the labour market. This index continued to increase during 2012, though unemployment was stable. The paper also investigates the microeconomic determinants of underemployment, finding that it is particularly prevalent among the young and unqualified. Finally, the paper makes the first attempt to investigate whether underemployment adversely affects well-being. The results indicate that the underemployed, conditional on their other characteristics, experience lower levels of happiness and satisfaction, are more likely to be anxious, and have negative feelings about whether life is worthwhile. There is an extensive literature showing that unemployment adversely affects well-being. Our results show that the same is true of underemployment.
David Bell and David Blanchflower
JEL Codes: J01, J11, J21, J23, J38, J64
Corresponding author: David Bell, Division of Economics, University of Stirling, Stirling, Scotland, UK, [email protected]
1. IntroductionThe unemployment rate is the most used measure of slack in the labour market, which expresses how many people are actively seeking work and are without a job, generally reported as a proportion of the labour force, which is the employed plus the unemployed. The unemployment rate in the UK rose from a low of 5.2% at the end of 2007 to a high of 8.4% at the end of 2011 before falling back to 7.8% at the start of 2013. But during the Great Recession we have also seen a steady increase in the UK in the number of the employed who want more work than they are currently doing – they are under-employed, likely in part due to falling real wages. For some people, principally home-owners with a variable rate or tracker mortgage, low interest rates have acted as a buffer. There has been such a dramatic increase in underemployment that the unemployment rate is now a poorer indicator of the degree of slack in the labour market than it has been in the recent past.
The underemployed are defined as those currently in work who would prefer to work longer hours. Their ability to supply hours at the current wage is constrained by the level of demand in the economy, because there simply isn’t enough work around. Some of these people are classified in the official statistics as part-timers who would prefer to be full-time, but the phenomenon also applies to full-timers, which is not reported in the published ONS statistics. We have addressed this issue before in an earlier article in this journal (Bell and Blanchflower, 2010). There, we suggested that underemployment might be associated with labour hoarding, the use of part-time and temporary contracts. It was facilitated by the
flexibility of the UK labour market and was a particular problem amongst the young. A recession might also increase the number of discouraged workers who choose to leave the labour market. We showed that the underemployed are more likely to be depressed, suggesting that hours constraints have a negative effect on their well-being.
In this paper, we extend and update our analysis of underemployment. Firstly, we examine the evolution of underemployment since 2010, noting that it has risen over this period, at the same time as real wages have been falling sharply.1 The gap between the unemployment rate and the underemployment rate has widened over time and at the beginning of 2013 is at a historically high level. Secondly, we propose a new measure of excess capacity in the labour market that combines measures of both unemployment and underemployment – the underemployment index. Thirdly, we show that underemployment has a significantly negative effect on well-being, which is of the same magnitude as being unemployed for up to a year.
2. The evolution of underemploymentTable 1 provides some background data on the labour market. It includes numbers on employment, unemployment as well as the residual category of out-of-the-labour force (OLF), which consists of students, home workers, the disabled and the retired. The total 16+ population is also reported. The table also reports on underemployment for 2008, when the recession began; for 2010 when we wrote our previous article; and for 2012, the most recent data point available for November 2012 to January 2013. Table 1 Part A paints the scene and reports the main published labour market data and shows that since the recession began unemployment rose from 1,620,000 (5.2%) in December-February 2008 to 2.5 million (7.9%) when the coalition took office (April-June 2010) to 2,516,000 (7.8%) in the latest data (November-January 2013) at the time of writing.2
Claims that employment is at the highest level ever are correct but this rise is coincident with the 16+ population being higher than it has ever been. The 16+ population has risen by 1.8 million since the start of the recession and by 950,000 since the coalition took office. As can be seen from Figure 1, which plots the employment rate – defined as 16+ employment divided by the 16+ population – it is markedly lower in 2012 than it was for almost the entire ten year period under Labour from 1997-2007. Employment in December 2012 was 233,000 higher than it was in January 2008, although the proportion of the 16+ population that are employed was much lower in 2012 (60.3% and 58.6% respectively), driven by a rise of 1.8 million in the size of the working-age population over that time period. Since 2008, the number of full-time employees has fallen by 386,000, while the number of part-timer employees has increased by almost 300,000. The number of self-employed has increased by almost 60,000 full timers and, notably, by 253,000 part-timers.
1 The latest labour market data published by the ONS showed that average weekly earnings in January 2013 rose by 1.2% whereas the CPI was 2.8%.2 Official ONS labour market data are reported as three month rolling averages which means the UK reports its unemployment rate, for example two months behind every other country. The only other country that does this is Greece (http://epp.eurostat.ec.europa.eu/cache/ITY_PUBLIC/3-01032013-BP/EN/3-01032013-BP-EN.PDF). The ONS does publish single month data which show that unemployment jumped sharply in January 2013 to 2,614,000 8.1% (November=2,430,000 (7.5%); December=2,503,000 (7.8%). The official unemployment rate of 7.8% is for November-January is just the average of these three numbers (2,516,000) and rates. So UK unemployment looks set to rise sharply. We do not have single month data on the underemployment variables.
3

Part B of Table 1 shows that there has been a substantial increase in indicators of underemployment. Between 2008 and 2012 the number of temporary workers increased by nearly 200,000, the number of temporary workers who would like permanent jobs by 300,000; part-time workers who want full-time jobs increased by 674,000, while those out of the labour force (OLF) wishing to find a job increased by 130,000. There has between 2008 and 2012, there has been an increase in the demand for work, both on the extensive and intensive margins of the labour market.
The ONS has also noted that underemployment has risen sharply indeed they calculate that the number of people in work wanting more hours stood at 3.05 million in April to June 2012.3 Part C of Table 1 presents the most recent data showing the level and rate of underemployment from 2000-2012. The ONS defines underemployment levels and rates based on the number of workers.
Data are also available on other dimensions of underemployment in the UK. The Labour Force Survey (LFS) asks all of those who are not looking for a different or additional job whether they would like to work longer hours at current basic rate of pay is given the opportunity. Thus it asks (1) those answering “yes” to this question; (2) those who are seeking an additional job; and (3) those who are looking for a different job because they want to work longer hours, how many additional hours they would like to work.
Table 2 presents some statistics on those who are seeking longer working hours at their present rates of pay. We use the weighted micro data from the LFS for each calendar year from 2008-2012. Among all workers, the proportion looking for a different job has increased from 6.3 per cent in 2008, to 7.6 per cent in 2012. Increases in this proportion occurred for full-time employees, part-time employees and the self- employed. Part-timers were most likely to be looking for a new job. Between 2008 and 2012, this share rose from 7.9 per cent to 10.6 per cent of employees. An increasing proportion of the workforce wished to extend their hours. From 2008 to 2012, this share increased from 7.4 per cent to 9.9 per cent. This increase was largely driven by part-timers. In 2012, almost 20 per cent of this group wished to extend their working time. In contrast, only 6.3 per cent of full-timers wanted longer hours. Part-timers also sought the largest average increase in their working time. In 2012, they wished to extend their hours by an average of 13.8 hours, compared with the average of 9.5 hours sought by full-timers. Those that have relatively short working hours are more likely to desire more hours and more likely to seek a larger increase in their working hours.
Fewer self-employed workers than part-time employees sought longer hours, but conditional on a desire for longer hours, self-employed sought an additional 13.4 hours on average. This was almost as many additional hours as those sought by part-timers. The LFS suggests that the self-employed are more hours constrained than full-time employees. This is surprising given that the self-employed work almost as many hours per week as do full-time employees. The demand for more hours among the self-employed may reflect a desire to self-insure against the effects of fluctuations in product demand, from which they may be less insulated than are employees. Nevertheless, it is surprising that the self-employed, who can control their working time to a greater extent than the employed, are just as hours constrained as part-time employees. The likelihood is that there is simply not enough work around, which raises the possibility that some of the self-employed are closer to being self-unemployed.
3 http://www.ons.gov.uk/ons/rel/lmac/underemployed-workers-in-the-uk/2012/sty-underemployed-workers-in-the-uk.html
4
We now consider some of the trends in underemployment over a longer period. In Figure 2 we plot the proportion of workers who would like to work more hours in their existing job without increasing their pay rate. Unlike unemployment, the rise in underemployment has been almost continuous since the start of the recession, other than during a brief period from 2010q2 to 2011q2. By 2012q3 almost 11 per cent of workers were expressing a desire to work longer hours, compared with an average around 7 per cent in the pre-recession period. The table also shows the proportion of employees responding positively when questioned whether they would be willing to decrease their hours and accept lower pay. This share has been falling since 2003, though it declined more steeply at the beginning of the recession. It then fell again following a partial recovery during 2009 and early 2010. The net effect is that the numbers of employees wishing to increase their hours have exceeded the numbers wishing to decrease their hours since early 2011. This has not occurred since at least early 2001.
Both those wishing to work more hours and those wishing to work fewer hours are asked how many more or how many fewer hours they would like to work. The average change in desired hours for the two groups is shown in Figure 3. Desired increases in hours have grown fairly steadily from 2003, aside from seasonal variation. In contrast, desired reductions in hours were broadly stable until 2010 and have increased moderately since then. Aggregate changes in desired weekly hours are given in Figure 4, which shows the sum of the additional weekly hours desired by those want to work more hours and the equivalent aggregate for those who want to work fewer hours. Until 2007, these aggregates are largely balanced. Desired aggregate increases in hours exceed desired reductions from the beginning of the Great Recession. The gap between these aggregates provides a measure of disequilibrium in the labour market on the intensive margin. This measure continued to rise through 2012, while unemployment, a measure of disequilibrium on the extensive margin of the labour market, rose at the start of the recession, but stabilized between late 2009 and 2012.
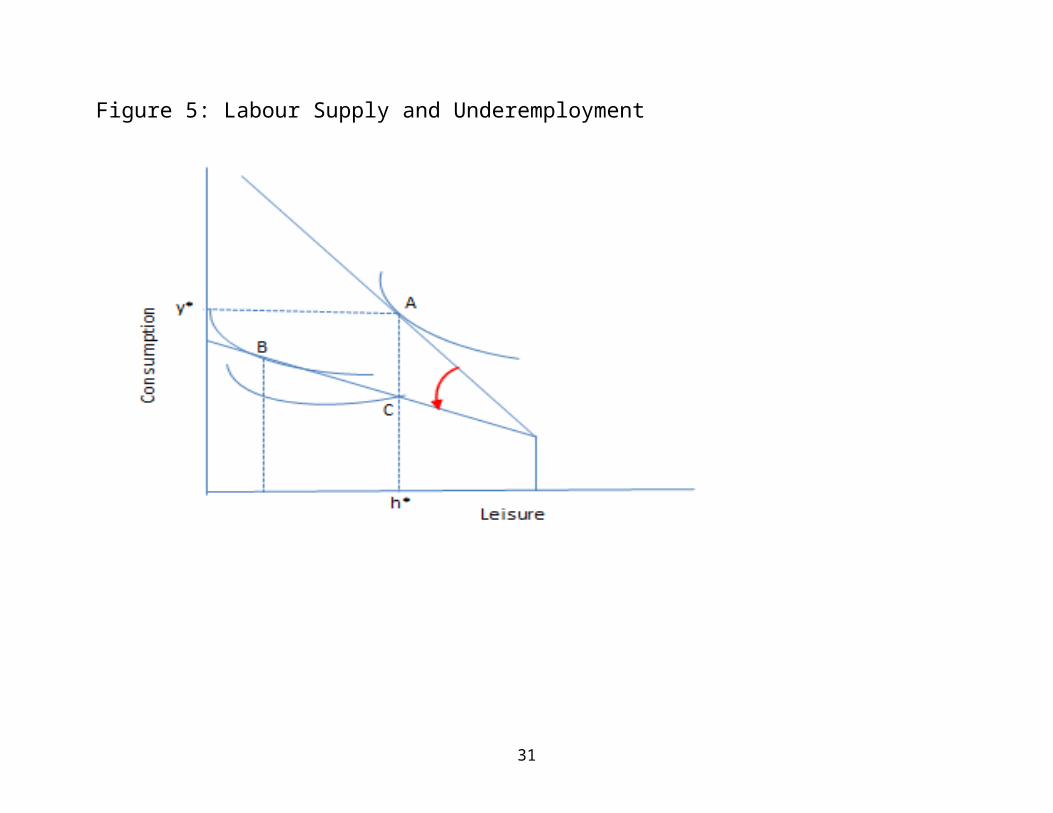
One factor influencing excess supply on the internal margin has been the fall in real wages shows how a fall in real wages in a demand constrained labour market may lead to workers expressing increased demand for hours. Figure 5 illustrates. If the substitution effect is dominant and workers are initially at equilibrium at point A, then a reduction in the real wage along with an hours constraint at h*, leads to workers being constrained at point C. Optimizing leads to higher utility at point B. If workers are not prepared or able to move, then they are likely to express a desire to work an additional hB-h* hours. Such constraints clearly pose difficulties for the estimation of labour supply functions as Ham (1982) notes.
Figure 6 shows there has been a significant decline in UK real wages since the end of 2007. It plots Average Weekly Earnings (AWE), which is the National Statistic on earnings minus the Consumer Price Index (CPI), by month. Since the start of the recession in 2008, the CPI has risen by 17% while average weekly earnings have risen by 7%, suggesting that real earnings have fallen by approximately one tenth during this period. The trend has been almost uniformly negative, except for a brief spike in early 2010 during the Darling boom that saw the economy grow by 2.7% in the five quarters from 2009q3 to 2010q3. Since then, as the economy has flat-lined, growing only 0.4% between 2010q4 and 2012q4, real wages have continued to fall. If substitution effects continue to dominate income effects, falling real wages are likely to lead to a greater increase in the numbers wishing to increase their wages and a decline in the number seeking fewer hours, which is clearly consistent with recent trends in over- and under-employment.
5
It should be noted that in the US each month the BLS publishes six separate estimates of what it calls alternative measures of labor under-utilization.4 The annual rates are reported in Table 3 covering the six measures and how they have changed between 2007 and February 2013. It is notable that between 2007 and February 2013 only the U-1 measure which relates to unemployment duration has more than doubled whereas the unemployment rate U-3, has increased by less. The ratio between the other four underutilization measures and the unemployment rate has risen much less than it has in the UK.
In the next section, we use the information on desired hours of work to construct an index of excess capacity in the UK labour market, which incorporates the unemployment rate, but also takes account of the net balance of over and under-employment.
3. The Underemployment IndexIn this section we construct an underemployment index which combines measures of excess capacity on the intensive (hours) and extensive (jobs) margins of the labour market. Our measure is more general than the unemployment rate because it is affected by the willingness of current workers to supply additional hours – underemployment. It is also different from the underemployment rate calculated by the ONS reported in Table 1C because it counts the number of hours workers say they want to work – whether more or less – at going rates of pay. The ONS simply counts up the numbers who say they want more hours. For any given unemployment rate, a higher underemployment index implies that reductions in unemployment will be more difficult to achieve because existing workers are seeking more hours – there is excess capacity on the internal labour market. If the underemployment index is high relative to the unemployment rate and there is an upturn in demand, cost-minimising producers will offer existing workers longer hours, so avoiding recruitment costs and the costs of uncertainty associated with new hires. The unemployment rate will not fall so rapidly when the underemployment index is relatively high. We define our underemployment index in hours space. Like the unemployment rate, it is expressed as a percentage. It can be thought of as measuring the ratio of net unemployed hours to total available hours assuming that the hours preferences of the employed at current wages are met. It implicitly assumes that the employed who do not express a wish to change their hours are content and that the unemployed would prefer to work on average the same number of hours as the employed5. We begin by transforming the unemployment rate into a measure based on hours. Equation 1 incorporates hours of work into the definition of the unemployment rate. The unemployment rate implicitly allocates equal hours to the employed and the unemployed. We set these hours at , average hours worked by employed workers. The term involving the product of average hours worked and employment is by definition equal to the sum of all hours worked in the economy.
(1)
4 Data on desired hours are not available in the US labour market survey – the Current Population Survey. The source for the under-utilization rate is Table A-15 here. http://www.bls.gov/news.release/pdf/empsit.pdf
5 We also estimated weekly hours regressions among the employed using the LFS. We used these estimates to predict hours for the unemployed. The predicted hours were not significantly different from mean hours among the employed. Hence we opted for the simpler formulation using mean hours among the employed.
6
The next step is to add the intensive margin of the labour market. Preferences over hours are not realized for all workers: some say they want more hours, others would prefer fewer hours. We include these stated preferences in our index, taking them at face value. The sum of
preferred additional hours is given by where the index k is defined over all workers
who wish more hours. Similarly, aggregate preferred reduction in hours is given by where the index j is defined over all workers who wish fewer hours. We assume that transactions costs prevent exchange of working time between these groups. The net effect of these desired changes in hours is then added to the numerator of Equation 1 to complete the underemployment index, u*, which is given in Equation 2.
(2)
If the desired increase in hours equals the desired reduction in hours, then u* simply reproduces the unemployment rate: excess capacity in the labour market is only influenced by the extensive margin. But u* will differ from the unemployment rate if there is excess supply (or excess demand) on the internal labour market. The underemployment index could therefore be greater than, or less than, the unemployment rate. It would be lower than the unemployment rate when aggregate desired hours reductions exceed aggregate desired hours increases. This measure presents a more complete picture of excess demand or excess supply in the labour market as a whole than does the unemployment rate. This suggests that it may also offer advantages over the unemployment rate as a means of calibrating the output gap.
Suppose in aggregate the desired increases and reductions in hours were equal in size. The index is not affected by the levels of the desired increases and reductions so long as they are equal in size. Thus, it does not capture the extent of mismatch in the internal labour market. Mismatch would be high when large numbers of workers wishing to increase their hours co-exist in the labour market with large numbers wishing to reduce their hours. The sum of
desired hours increases and reductions, which is given by is a possible indicator of such mismatch.
Our underemployment index is relatively easy to calculate from successive waves of the LFS microdata. We add together the desired additional hours of those who say they want to work more hours. Similarly, we sum the desired reductions in hours for those who claim they would like to work fewer hours. We also use the LFS to estimate employment, unemployment and average hours of work. All of these statistics are converted to national estimates using weights supplied with the LFS. We include the employed, self-employed, family workers and those on government schemes when calculating total employment and average working hours. Together these calculations provide all five of the components necessary to calculate our underemployment index which is u* in Equation 2.
Following the practice of the ONS, claims of underemployment among those aged between 16 and 18 and working 40 or more hours and those aged over 18 and working 48 hours or
7

more are disregarded.6 Similarly, those aged between 16 and 18 and working 15 or fewer hours and those aged over 18 and working 20 hours or less were disregarded. Our index differs from the ONS underemployment measure which is in people space whereas ours is in hours space and hence is more precisely defined. The evolution of the index between 2001 and 2012 is shown in Figure 7 alongside the published unemployment rate. It is clear that from 2001 until 2008, the two measures were closely matched. Though there were more workers wishing to reduce their hours than increase them over this period, those wishing to increase their hours wanted to add more hours to their workweek than those who wanted fewer hours wished to give up. Net underemployment was therefore close to zero and the underemployment index therefore closely followed the unemployment rate.
Since 2008 there has been a divergence between the unemployment rate and our index. As is clear from Table 1C this is also true of the ONS worker based measure. This is caused by increasing numbers of workers wishing to extend their hours and a fall in the number wanting fewer hours. Interestingly, though the unemployment rate stabilized after 2010, the value of u* continued to increase. This must have been a consequence of increased net underemployment. We would argue that the stabilization of the unemployment rate since 2010 is not sufficient evidence to conclude that the overall health of the UK labour market is improving. The increase in our index since 2010 is indicative of growing excess capacity in the UK labour market. It is clear from Table 3 that in contrast to the UK, in recently the United States there has experienced a narrowing of the various under-utilization measures.
Does the unemployment rate and our index vary across labour market categories? We confirm that this is the case in Table 3, which shows our index and published unemployment rates for 2008, 2010 and 2012 for a number of labour market categories. To clarify how the underemployment index is calculated, the 9.9% for 2012 in the top row of Table 3 is worked out as follows: we assume that the unemployed work the same average hours as the currently employed, which does not seem unreasonable given their characteristics.7 The denominator takes total number of hours worked (918.4 million per week) which is made up of 28.97 million workers who work an average of 31.7 hours per week. Added to that is number of unemployed (2.574 million) multiplied by average hours of 31.7 (81.5 million) =999.9 million hours. The numerator is the number of unemployed hours (81.5 million) plus the total extra hours the employed would like to work =40.6 million minus the number of hours of the people who say they want to work fewer hours (22.8 million). So we get (81.5+40.6-22.6)/999.9 = 99.4/999.9 = 9.9%.8
The first row of the table confirms the finding of Figure 7 that our index has risen by more than the published unemployment rate, particularly since 2010. Between 2010 and 2012, the underemployment index rose from 9.4 to 9.9 per cent, while the unemployment rate hardly
6 ONS (2012) http://www.ons.gov.uk/ons/dcp171776_289024.pdf
7 To check this estimated a series of hours regressions with personal controls including gender, age, race, qualifications and region for each of the 47 waves of the LFS. We used each of these equations to predict the hours of the unemployed which were very close to the average hours worked at each time point so for simplicity we opted to use average hours of the employed. The underemployment index is little changed therefore using either method.
8 The appendix reports the data used to construct the underemployment index.
8

changed. The unemployment rate was 8.0 per cent in 2012, suggesting that excess hours capacity within firms contributed a further 1.9 per cent to the overall underutilization of labour that year.
Table 4 has a number of striking features. First, not only do young people aged 16-24 have the highest unemployment rates of any age group, they also experience the greatest divergence between their unemployment rate and their underemployment index. In 2012, the supply of youth labour exceeded its equilibrium level by 30 per cent. Not only was the unemployment rate 21.6 per cent, but the shortfall in hours actually worked over desired hours increased the underemployment index by a further 8.4 per cent. In contrast, among older workers, the underemployment index is consistently lower than the unemployment rate. This is because older workers typically wish to reduce rather than increase their hours, implying that actual hours exceed desired hours for this group offsetting the hours not worked by unemployed older workers.
Although the unemployment rate for men typically exceeds that for women, the excess capacity indices for both sexes are almost identical. This implies that women are more likely than men to want to work longer hours. This is consistent with the evidence from Table 2 that part-timers express relatively high levels of demand for extra hours and that females are more likely than men to work part-time. Overall, 19.8% of part-timers and 6.3% of full-timers reported they wanted more hours. The proportions have been rising over time as can be seen in Table 5, driven primarily by the steady rise among part-timers, in both the public and private sectors. The jump in the proportion of full-timers occurred principally between 2008 and 2009.
Looking at excess capacity and unemployment rates by ethnic groups, it seems that those with higher unemployment rates also experience higher rates of excess labour capacity. This is particularly true in the “Black or Black British” category, where the unemployment rate in 2012 was 17.1 per cent and the excess capacity rate was 23.1 per cent. Interestingly, though the unemployment rate among the Chinese was somewhat higher than that among whites, the excess capacity index for this group was substantially higher, at 16.7 per cent, in 2012 compared with a rate of 8.9 per cent among whites. Chinese employees appear substantially more likely to express a desire to work longer hours than their white counterparts.
Regional estimates of unemployment and excess capacity indices in Table 4 indicate that the Northern region has the highest scores on both measures. The largest gap between the rates occurs in Wales (2.4 per cent), indicating that it is the region with the largest net balance of desired longer hours.
This underemployment index should be published monthly by the ONS by rolling quarter alongside the unemployment rate.
4. Determinants of UnderemploymentWe now examine determinants of underemployment at the individual level using data on approximately three quarters of a million individuals from the Labour Force Survey from 2008-2012. Table 6 estimates underemployment equations over preferences between part-time and full-time employment and over the number of hours that a worker wishes to work. It is not restricted to employees only but includes the self-employed and those on government training schemes. These groups are also asked whether they wish to work more hours. Thus columns 1 and 2 model the probability of a part-timer reporting they would prefer to have a
9
full-time job using a dprobit model where the coefficients can be interpreted as marginal effects. Column 1 covers all workers while column 2 is restricted to part-timers only. Columns 3 through 5 use Ordinary Least Squares to model the number of hours an individual would like to work; where the dependent variable is set to zero if the respondent is content with their working hours. Column 3 is for all workers while column 4 is for full-timers only and column 5 for part-timers. We exclude 4025 cases from all four equations, where workers say they would like fewer hours but they aren’t asked how many less. The increase in the time coefficients in all four columns is clear – underemployment is rising over time. We turn now to examine the two sets of results in turn.
In column 1 it is apparent that the self-employed, women, the young, Asians, the disabled, in universities, local government and charities and among those without qualifications are especially likely to be in part-time jobs that they would prefer to be full-time. Workers are especially likely to report they are in part-time jobs they would prefer were full-time in distribution and hotels and in Yorkshire and the South West. In column 2 the sample is restricted to part-timers only and the results are rather different, although there is still evidence of under-employment among women, the young and the least educated. Conditional on being in a part-time jobs whites are more likely to say they would like to be full-time than minorities and there are strong regional and industry effects. It is apparent that part-time civil servants, who have likely been impacted by public sector spending cuts, would prefer to be full-time.
Columns 4 through 7 report estimates of the number of extra hours, workers would like to work at current pay rates for all workers and separately for full-timers and part-timers.9 We find evidence that full-timers are looking for less hours than the part-timers (column 3), and men are looking for more hours, especially if they are part-time. The self-employed who are part-time are notable in wanting more hours and these do look like the self-unemployed. Minorities, especially blacks and the disabled want more hours as do the young. There are big industry and region of work effects among full-timers but less so among part-timers.
5. Underemployment and life satisfaction While economists have typically made inferences about utility based on the revealed preference paradigm, a more recent literature attempts to calibrate utility directly using survey responses to questions on subjective well-being or happiness. These typically ask questions such as “Overall, how satisfied are you with your life nowadays? (Life) where nought is 'not at all satisfied' and 10 is 'completely satisfied'”. This question is asked in the ONS Annual Population Survey (APS) which as part of the Prime Minister’s Big Society initiative is developing new measures of well-being has recently started to include questions on well-being.10 Using the same 10-point scale it in addition respondents to the APS are asked 1) ‘whether the things you do in your life are worthwhile?’ (Worthwhile) 2) ‘how happy did you feel yesterday?’ (Happy) and 3) ‘how anxious did you feel yesterday?’ (Anxious).
Though these are subjective measures, there is a range of objective evidence that links them to objective evidence of mental well-being. This includes: assessments of the person’s
9 This variable has a mean of 1.32 and a standard deviation of 4.5 with five percent of the distribution reporting 10 hours or more and 1% report they want 21 extra hours and more.
10 Measuring what matters, ONS, http://www.ons.gov.uk/ons/guide-method/user-guidance/well-being/index.html
10

happiness by friends and family members; assessments of a person’s happiness by his or her spouse; heart rate and blood-pressure measures of response to stress; the risk of coronary heart disease; duration of authentic or so-called “Duchenne” smiles (Ekman, Friesen and O’Sullivan (1988); Ekman, Davidson and Friesen (1990); skin-resistance measures of response to stress; electro-encephalogram measures of prefrontal brain activity.
There is consistent evidence that subjective well-being is related to age, marital status, gender, health and employment status, inter alia. In relation to employment status, the unemployed have lower levels of life satisfaction than the employed, controlling for other characteristics (Blanchflower et al, 2013). Given our previous analysis, we might hypothesise that underemployment and overemployment also have negative effects on life satisfaction. Past literature does suggest a negative relationship – e.g. Dooley, D. et al (2000), Dooley (2003), Friedland and Price (2003). However, these studies do not use large scale datasets that include direct responses to questions about the extent of underemployment or underemployment.
Unfortunately the APS does not jointly capture data on overemployment and subjective well-being. But this is not true of underemployment which it does have some data. Hence it is possible to compare the effects of unemployment and underemployment on well-being.
Average values for the happiness, life satisfaction, “life is worthwhile” and anxiety measures for different types of employment status are shown in Table 7. Data are drawn from the APS in 2011 and 2012 and weighted using the well-being weight constructed by ONS. Respondents are categorised as employees, self-employed, unemployed and out of the labour force (retired and not retired). The employed and self-employed are subdivided by full-time part-time and whether they wish to move from part-time to full-time. Amongst the employed, the highest levels of happiness and life satisfaction are found amongst those working part time who do not want a full-time job. In contrast, part-timers who want a full-time job have lower levels of satisfaction than either part-timers who did not want a full-time job or full-time employees. This group also performed badly on mental health scores including anxiety, and whether the
Next we run two sets regressions where we model responses to APS questions on happiness, life satisfaction, anxiety, and the “life is worthwhile” questions. The equations are estimated using Ordinary Least Squares with the dependent variables in each case drawn from a 10 point scale. The sample for the first set of regressions is drawn from all adults, while the second set is restricted to employees. Results are shown in Table 8 and Table 9. Both sets of equations contain a large number of common controls that are listed at the bottom of the tables. We focus on the coefficients relating to labour market status and to the desired working time of respondents.
One striking feature of Table 8 is that the coefficients on happiness, life satisfaction, anxiety and “life is worthwhile” tend to have the same sign and are either all are significant, or all are not significant, at the 5% level. Two exceptions are the coefficients on self-employment in the life satisfaction and anxiety equations, which are not significant, though those on happiness and the “life is worthwhile” question are significant. A further two exceptions are the coefficient on government training scheme in the happiness equation and the coefficient on the number of hours of unpaid overtime in the life satisfaction equation. These coefficients
11
are not significant at the 5% level, whereas the equivalent coefficients in the other equations are significant.
Table 8 implies that, compared with a part time employee that does not want full-time work, the self-employed score better on the set of life satisfaction measures, while those on government training schemes score worse. Differences between employees and family workers are not significant. But for the unemployed, especially those who have been out of work for more than 12 months there is a very significant drop in life satisfaction. The data in the APS support this widely replicated finding. Full-time workers have lower life satisfaction measures than part-timers who are content with the length of their working time. However, part-timers who want to work full-time have significantly lower levels of life satisfaction than part-timers who are content with their hours. The coefficients on this indicator of underemployment suggest that part-time workers that are hours-constrained have lower levels of well-being than those who are content with their working time. The sizes of the coefficients vary between 33% and 64% of the coefficients on being unemployed for less than 12 months, implying that underemployment is less damaging to life satisfaction measures than unemployment, but nevertheless does significantly reduce life satisfaction.
As well as the “part-time wants full-time” variable, we include a further variable which indicates whether any an employee wants more hours, irrespective of their full-time/part-time status. This has a significant, but much smaller, negative effect on life satisfaction, implying that the “part-time wants full-time” variable captures most of the negative effect of underemployment on life satisfaction.
We do capture one indicator of overemployment - the number of hours of unpaid overtime that an employee believes that he/she is working. This is different from the question asked in the LFS and used in our previous analysis about whether a worker wishes to reduce their working time. The coefficients are all negative, though, as mentioned earlier, the coefficient on life satisfaction is not significant. This is tentative evidence in support of the argument that overemployment also has a negative effect on well-being.
The results in Table 9 focus on employees only. Again there are four equations, seeking to explain the 10-point scale responses to questions on happiness, life satisfaction, anxiety, and “life is worthwhile”. The excluded category is part-time employees who do not wish to work full-time. Full timers score at significantly lower on measures of well-being than do part time workers. But again, those working part time, but who want to work full-time, experience significantly lower levels of well-being than do those that are content with working part time. The restriction of the sample to those that are currently working does not change the direction or significance of the coefficients measuring differences in levels of well-being between different categories of employees. Similarly, conditional on the part-time wants full-time dummy, the dummy on wanting more hours is also negative and significant. As in Table 8, these coefficients are smaller than their equivalents on the part-time wants full-time dummy. Again, these results are supportive of the hypothesis that the well-being of the underemployed is lower than that of workers that are satisfied with the hours. Similarly, the significantly negative coefficients on hours of unpaid overtime is, as in Table 8, suggestive of negative well being effect from overemployment. Because the sample is limited to employees, we are able to also include an earnings variable in this. In all cases the coefficients are positive and significant. So money raises happiness (Blanchflower and Oswald, 2004a, b).
12
6. ConclusionsThis paper has updated some of the statistics that we previously presented on underemployment in the UK labour market. It shows that the magnitude of this phenomenon has continued to grow as the recession has lengthened in the sense that an increasing proportion of the workforce wish to extend their hours. There has been a particularly steep, and perhaps surprising, increase in the numbers of self-employed workers who would like to work more hours. The increasing numbers of self-employed in the labour market has been an important feature of the current recession. Given that a large proportion of this group are seeking additional working time, a share of the transitions into self-employment may also reflect lack of opportunities in the rest of the labour market.
Second, we have presented a new underemployment index – a measure of excess capacity in the labour market that combines information on unemployment and underemployment. If the internal labour market is in equilibrium in the sense that the demands for increased hours are exactly offset by demands for reduced hours, then the underemployment index reproduces the unemployment rate. Our estimates show an increasing divergence between the unemployment rate and the underemployment index since the start of the recession, reflecting the increasing demands among the workforce to increase working time and reductions in demands to reduce hours. Because it reflects both the internal and external labour markets, this index gives perhaps a broader estimate of the extent of underused capacity in the economy – the output gap – than a simple measure based on the unemployment rate.
We have also looked at some of the microeconomic determinants of underemployment. As with unemployment, it is the young and unqualified that are particularly prone to underemployment. This positive correlation is particularly unfortunate, since it suggests that the young unqualified unemployed have a particularly difficult route into employment since employers’ may choose to give their peers more hours, before making new hires. This will extend the unemployment durations of the young, and thus increase the probability that they will experience long-term scarring effects such as future unemployment spells and reduced wages.
Finally, the paper has modeled the well-being of the underemployed using the Annual Population Survey. Conditional on their other characteristics, we find that the underemployed experience lower levels of well-being. Unemployment makes people unhappy and so does underemployment. The negative effect of underemployment on well-being is not as large as that of unemployment, but its effects are nevertheless highly significant.
13
References
Bell, D.N.F and Blanchflower D.G. (2010), 'UK unemployment in the Great Recession', National Institute Economic Review, October, 214, R3-R25.
Bell, D.N.F and Blanchflower D.G. (2011), 'UK underemployment in the Great Recession', National Institute Economic Review, January, 215, R23-33.
Blanchflower D.G., D.N.F Bell, A. Montagnoli and M. Moro (2013), ‘The effects of macroeconomic shocks on well-being’, working paper.
Blanchflower D.G. and A.J. Oswald (2004a) ‘Well-being over time in Britain and the USA," Journal of Public Economics, Volume 88, Issues 7-8, July, pp.1359-1386.
Blanchflower D.G. and A.J. Oswald (2004b), ‘Money, sex and happiness: an empirical study,’ Scandinavian Journal of Economics, 106(3), 2004, pp. 393–415.
Davidson, R. and N.A. Fox (1982), ‘Asymmetrical brain activity discriminates between positive versus negative affective stimuli in human infants,’ Science, 218, pp. 1235-1237.
Dooley, D., Prause, J., & Ham-Rowbottom, K. A. (2000). Underemployment and depression: longitudinal relationships. Journal of Health and Social Behavior, 421-436.
Dooley, D. (2003). Unemployment, underemployment, and mental health: Conceptualizing employment status as a continuum. American Journal of Community Psychology, 32(1), 9-20.
Ekman, P., W. Friesen and M. O’Sullivan (1988), 'Smiles when lying', Journal of Personality and Social Psychology. 54(3), pp. 414–20.
Ekman, P., R. Davidson and W. Friesen (1990) 'The Duchenne smile: emotional expression and brain physiology II', Journal of Personality and Social Psychology , 58(2), pp. 342–53.
Friedland, D. S., & Price, R. H. (2003). Underemployment: consequences for the health and well-being of workers. American Journal of Community Psychology, 32(1), pp. 33-45.
Ham, J. C. (1982), ‘Estimation of a labour supply model with censoring due to unemployment and underemployment,’ Review of Economic Studies, 49(3), pp. 335-354.
14

Jun-92Dec-
92Jun-93
Dec-93Jun-94
Dec-94Jun-95
Dec-95Jun-96
Dec-96Jun-97
Dec-97Jun-98
Dec-98Jun-99
Dec-99Jun-00
Dec-00Jun-01
Dec-01Jun-02
Dec-02Jun-03
Dec-03Jun-04
Dec-04Jun-05
Dec-05Jun-06
Dec-06Jun-07
Dec-07Jun-08
Dec-08Jun-09
Dec-09Jun-10
Dec-10Jun-11
Dec-11Jun-12
Dec-12
56.0
56.5
57.0
57.5
58.0
58.5
59.0
59.5
60.0
60.5
61.0
Figure 1. UK Employment Rate, 1992-2012
15

2001 Q2
2001 Q4
2002 Q2
2002 Q4
2003 Q2
2003 Q4
2004 Q2
2004 Q4
2005 Q2
2005 Q4
2006 Q2
2006 Q4
2007 Q2
2007 Q4
2008 Q2
2008 Q4
2009 Q2
2009 Q4
2010 Q2
2010 Q4
2011 Q2
2011 Q4
2012 Q26%
7%
8%
9%
10%
11%
12%
13%
14% Figure 2: Proportion of Workforce Wishing to Change Working Time 2001-2012
Want fewer hours
Want more hours
Perc
ent o
f Em
ploy
ees
Wish
ing
Source: Labour Force Survey
16
2001 Q2
2001 Q3
2001 Q4
2002 Q1
2002 Q2
2002 Q3
2002 Q4
2003 Q1
2003 Q2
2003 Q3
2003 Q4
2004 Q1
2004 Q2
2004 Q3
2004 Q4
2005 Q1
2005 Q2
2005 Q3
2005 Q4
2006 Q1
2006 Q2
2006 Q3
2006 Q4
2007 Q1
2007 Q2
2007 Q3
2007 Q4
2008 Q1
2008 Q2
2008 Q3
2008 Q4
2009 Q1
2009 Q2
2009 Q3
2009 Q4
2010 Q1
2010 Q2
2010 Q3
2010 Q4
2011 Q1
2011 Q2
2011 Q3
2011 Q4
2012 Q1
2012 Q2
2012 Q310.5
10.7
10.9
11.1
11.3
11.5
11.7
11.9
12.1
12.3 Figure 3: Average Change in Desired Working Time 2001-2012
More Hours
Fewer Hours
Mea
n Ch
ange
in D
esire
d H
ours
17
2001 Q2
2001 Q4
2002 Q2
2002 Q4
2003 Q2
2003 Q4
2004 Q2
2004 Q4
2005 Q2
2005 Q4
2006 Q2
2006 Q4
2007 Q2
2007 Q4
2008 Q2
2008 Q4
2009 Q2
2009 Q4
2010 Q2
2010 Q4
2011 Q2
2011 Q4
2012 Q215
20
25
30
35
40
45Figure 4: Aggregate Change in Desired Working Time 2001-2012
Fewer Hours
More Hours
Milli
ons
of H
ours
(Wee
kly)
18

19
Figure 5: Labour Supply and Underemployment
20
Jan-01
May-01
Sep-01
Jan-02
May-02
Sep-02
Jan-03
May-03
Sep-03
Jan-04
May-04
Sep-04
Jan-05
May-05
Sep-05
Jan-06
May-06
Sep-06
Jan-07
May-07
Sep-07
Jan-08
May-08
Sep-08
Jan-09
May-09
Sep-09
Jan-10
May-10
Sep-10
Jan-11
May-11
Sep-11
Jan-12
May-12
Sep-12
-6
-4
-2
0
2
4
6
8
Figure 6: Change in Real Wages 2001-2012 (AWE)Re
al P
erce
ntag
e Ch
ange
21

2001 Q2
2001 Q4
2002 Q2
2002 Q4
2003 Q2
2003 Q4
2004 Q2
2004 Q4
2005 Q2
2005 Q4
2006 Q2
2006 Q4
2007 Q2
2007 Q4
2008 Q2
2008 Q4
2009 Q2
2009 Q4
2010 Q2
2010 Q4
2011 Q2
2011 Q4
2012 Q24
4.4
4.8
5.2
5.6
6
6.4
6.8
7.2
7.6
8
8.4
8.8
9.2
9.6
10
10.4
10.8 Figure 7: UK Unemployment and Underemployment Index: 2001-2012 (%)
Excess Capacity
Unemployment
Unem
ploy
men
t/Ex
cess
Cap
acity
Rat
e
22
Table 1– Employment, Unemployment, Temporary Workers and Part-time workers & OLF wants a job (Ages 16+)
Table 1A) Basic Labour Market data (‘000s)
OLF Unemployed Employed Population Employees Self-employed FT PT FT
PT2008 (Dec-Feb) 9062 1620 29499 48909 18971 6431 2937 9332010 (Apr-June) 9358 2471 28975 49771 18178 6653 2908 10152012 (Nov-Jan ‘13) 8954 2516 29732 50717 18585 6704 2993 1186
Table 1B) Underemployment (‘000s)
Temporary Temporary Part-time PT Would like OLF OLF (16-64) couldn’t find Full-time (16-64) wants a permanent job 2008 (Dec-Feb) 1443 362 7365 724 9062 21902010 (Apr-June) 1559 565 7667 1072 9358 23422012 (Nov-Jan ‘13) 1638 657 7890 1398 8954 2318
Source: ONS Labour Force Statistics, March 2013 http://www.ons.gov.uk/ons/rel/lms/labour-market-statistics/march-2013/statistical-bulletin.html
23

Table 1C) Underemployed workers in the UK Labour Market, April-June 2000-2012
Thousands Per cent
Underemployed workers
Non- underemployed
workers Unknown Total2Underemployment
rate3
2000 2,084 25,033 282 27,117 7.72001 1,826 25,532 285 27,358 6.72002 1,870 25,686 294 27,556 6.82003 1,837 26,004 285 27,842 6.62004 1,783 26,274 304 28,057 6.42005 1,840 26,489 329 28,329 6.52006 1,867 26,754 302 28,621 6.52007 1,963 26,794 339 28,757 6.82008 2,069 26,990 389 29,059 7.12009 2,697 25,708 404 28,405 9.52010 2,740 25,751 410 28,490 9.62011 2,826 25,939 392 28,765 9.82012 3,049 25,870 496 28,918 10.5
Source: ONS, Labour Force Survey datasets1. Underemployed workers are those who are employed but who either wish to work more hours in their current roleor who are looking for an additional job or for a replacement job which offers more hours. They must also be over 16and be currently working under 40 hours per week if they are between 16 and 18 and under 48 hours if they are over 18.Finally, they must be able to start working extra hours within the next two weeks2. This total excludes those workers who have unknown underemployment status3. This is calculated by dividing the total number of underemployed workers by the total number of people in employmentthat have known underemployment status
24
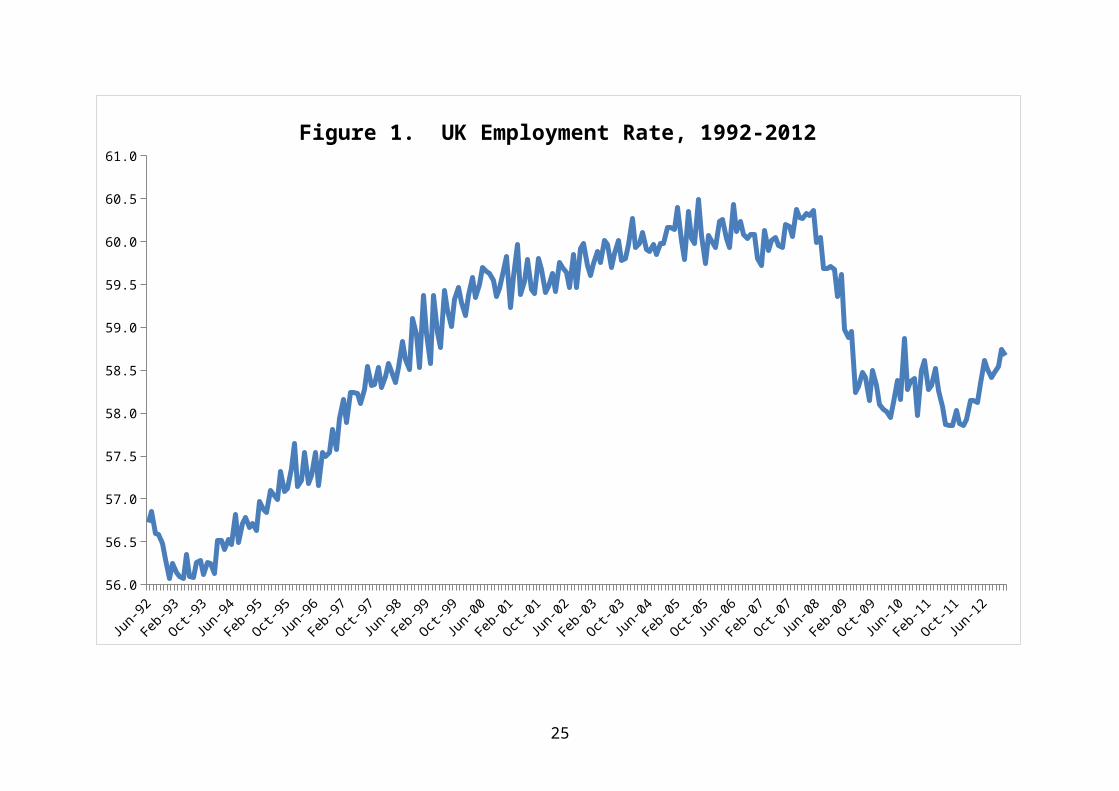
Table 2: Wants longer hours at current basic rate given the opportunity
Looking for More # Extra Actual Hours A different job Hours Hours
(%) (%)All2008 6.3 7.4 11.6 33.02009 4.9 9.1 11.7 32.62010 7.1 9.6 11.8 32.62011 7.2 9.6 12.0 32.52012 7.6 9.9 12.0 32.5
Full-timers2008 5.5 4.9 9.4 38.02009 4.0 6.2 9.5 37.82010 5.7 6.4 9.4 37.92011 5.9 6.1 9.5 37.82012 6.1 6.3 9.5 37.9
Part-timers2008 7.9 15.2 13.3 17.32009 6.9 17.6 13.4 17.12010 9.6 18.2 13.6 17.22011 9.8 19.4 13.8 17.22012 10.6 19.7 13.8 17.2
Self-employed2008 4.1 7.9 13.0 37.42009 3.7 10.4 13.6 36.72010 4.8 10.6 13.1 36.52011 5.0 10.9 13.2 36.02012 5.3 11.3 13.4 35.6
Notes: # extra hours is conditional on the respondent saying they wanted more hours and the number was >0Source: Labour Force Survey micro data (weighted by person weights)
25
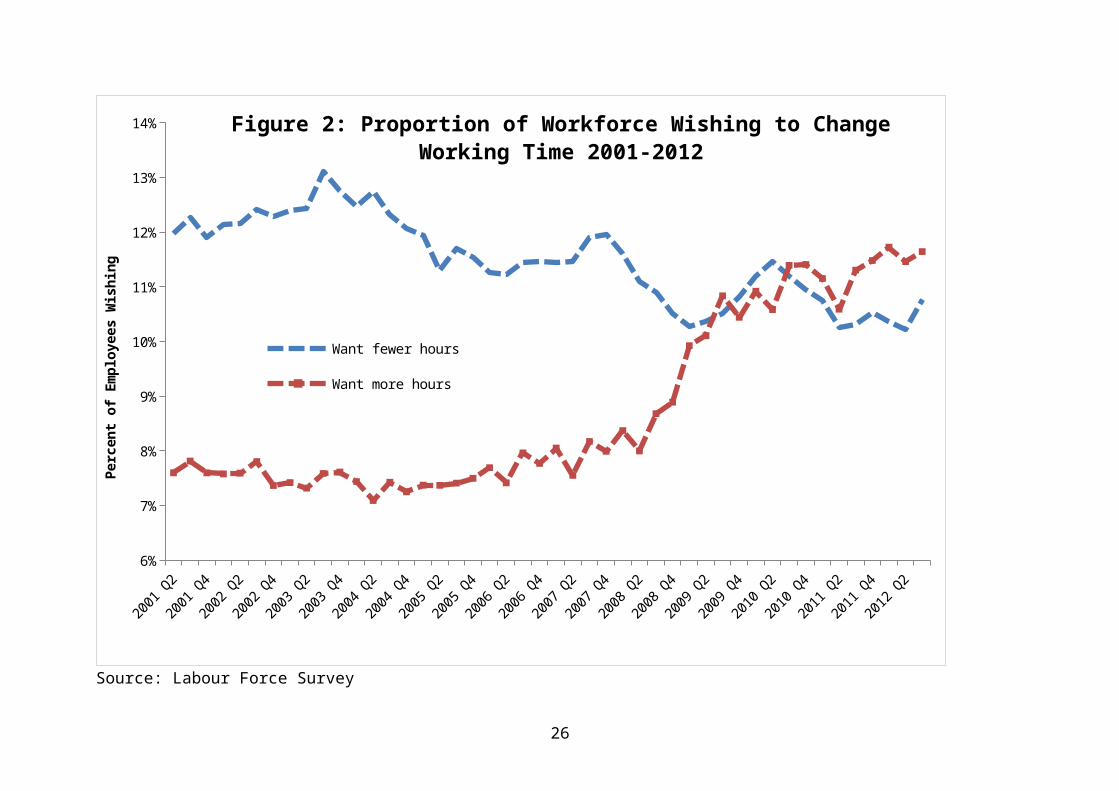
Table 3: Annual alternative measures of labor underutilization in the United States – not seasonally adjusted
2007 2008 2009 2010 2011 2012 2013 (Feb)U-1 Persons unemployed 15 weeks or longer, asa percent of the civilian labor force.............. 1.5 2.1 4.7 5.7 5.3 4.5 4.2U-2 Job losers and persons who completedtemporary jobs, as a percent of the civilianlabor force........................................... 2.3 3.1 5.9 6.0 5.3 4.4 4.2U-3 Total unemployed, as a percent of thecivilian labor force (official unemploymentrate).................................................. 4.6 5.8 9.3 9.6 8.9 8.1 7.7U-4 Total unemployed plus discouraged workers,as a percent of the civilian labor force plusdiscouraged workers............................... 4.9 6.1 9.7 10.3 9.5 8.6 8.3U-5 Total unemployed, plus discouraged workers,plus all other persons marginally attached tothe labor force, as a percent of the civilianlabor force plus all persons marginally attachedto the labor force................................... 5.5 6.8 10.5 11.1 10.4 9.5 9.2U-6 Total unemployed, plus all personsmarginally attached to the labor force, plustotal employed part time for economic reasons,as a percent of the civilian labor force plus allpersons marginally attached to the laborforce.................................................. 8.3 10.5 16.2 16.7 15.9 14.7 14.3NOTE: Persons marginally attached to the labor force are those who currently are neither working nor looking for work but indicate that they want and are available for a job and have looked for work sometime in the past 12 months. Discouraged workers, a subset of the marginally attached, have given a job-market related reason for not currently looking for work. Persons employed part time for economic reasons are those who want and are available for full-time work but have had to settle for a part-time schedule. Updated population controls are introduced annually with the release of January data. February 2013 estimate is seasonally adjusted. Source bls.gov
26

Table 4: Unemployment Rate and Underemployment Index, 2008-2012
Underemployment Index Unemployment rate2008 2010 2012 2008 2010 2012
All 6.2 9.4 9.9 5.8 7.8 8.0Youth (age 16-24) 20.4 27.3 30.0 13.2 17.6 19.5Prime Age (age 25-49) 4.8 7.8 8.1 4.2 6.3 6.2Older (age 50+) 1.0 3.2 3.5 3.2 4.6 4.6Male 6.4 9.9 10.0 5.9 8.9 8.8Female 6.3 9.1 10.2 5.0 6.9 7.7White 5.4 8.5 8.9 5.7 7.9 7.5Mixed 16.3 17.9 19.2 13.2 14.0 15.4Asian or Asian British 13.2 16.5 17.7 9.9 11.6 12.5Black or Black British 17.0 22.6 23.1 13.3 16.4 17.1Chinese 9.7 8.8 16.7 7.4 8.2 10.7Other Ethnic Group 13.9 18.5 18.9 10.5 13.4 13.2Northern 7.5 10.3 12.5 7.8 9.5 10.3Yorks and Humber 6.6 11.1 11.0 6.4 9.3 9.3East Midlands 6.6 9.4 9.9 5.9 7.7 8.0East 5.3 8.2 8.3 5.0 6.6 6.7South East 6.1 9.0 9.4 4.4 6.2 6.4South West 4.7 7.7 7.6 4.3 4.3 6.0West Midlands 7.2 10.4 10.6 6.9 8.9 8.7North West 7.7 9.7 11.3 6.9 8.2 9.0Wales 6.8 10.2 11.3 6.3 8.7 8.6Scotland 4.9 9.9 10.2 4.8 8.3 8.0Northern Ireland 4.2 8.5 8.6 4.4 6.9 7.4
No published unemployment rates for 2012 were available for ethnic group. Our own estimates from the Labour Force Survey have been substituted
27
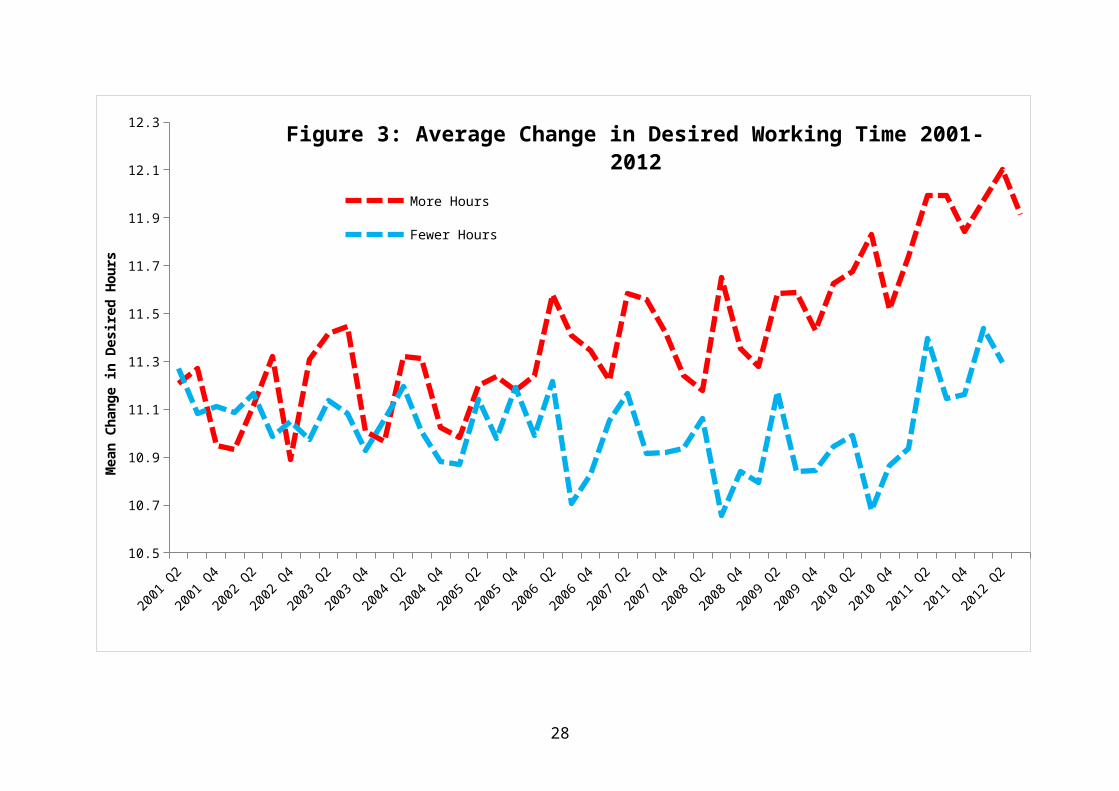
Table 5. Proportion of workers wanting extra hours
Full-timers Part-timers AllTotal economy2008 5.1 16.5 7.92009 6.4 18.9 9.62010 6.8 20.1 10.32011 6.5 21.5 10.42012 6.7 22.1 10.7
Private sector2008 5.3 16.6 7.92009 6.9 19.6 9.92010 7.0 20.2 10.32011 6.7 22.3 10.62012 6.8 22.1 10.8
Public Sector2008 4.5 15.9 7.82009 5.0 17.1 8.42010 5.8 18.1 9.42011 5.6 19.1 9.52012 5.8 19.1 9.7
Source: Labour Force Surveys
28
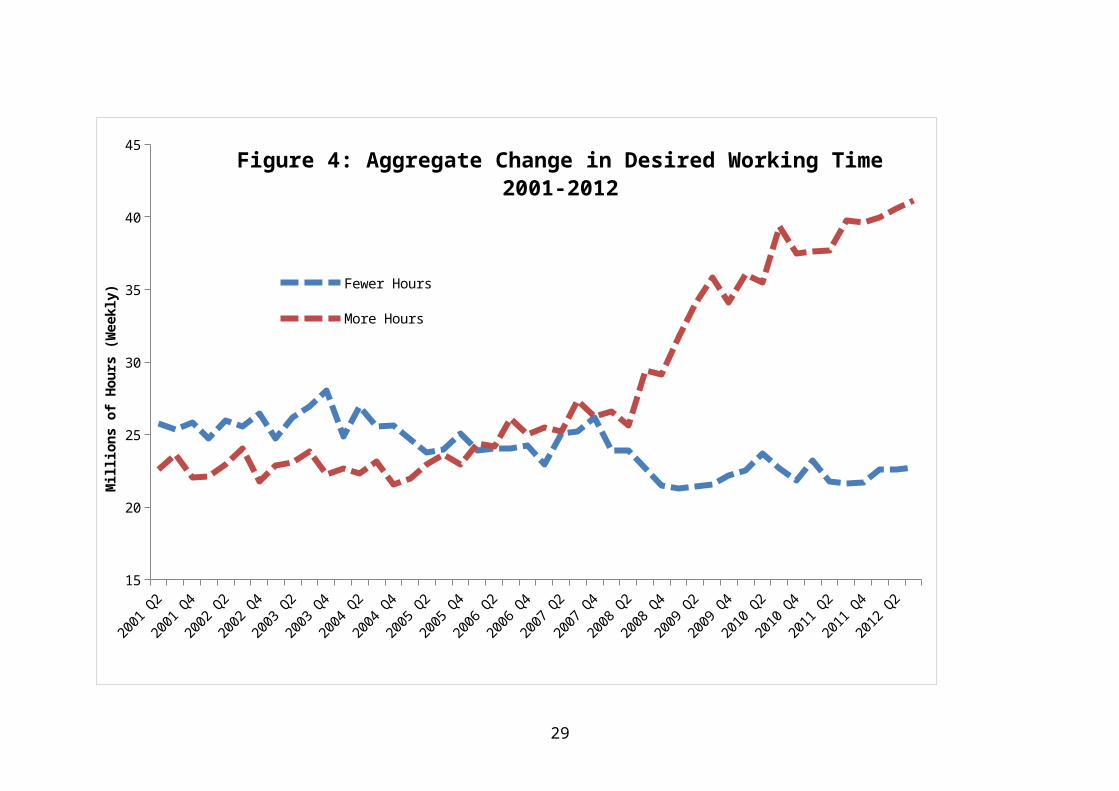
Table 6: Preferences over hours Part-time prefer full-time Number extra hours preferred All workers Part-timers All workers Full-timers Part-timersFull-timers n/a n/a -2.8639 (230.31) n/a n/aSelf-employed .0528 (33.40) .0013 (0.63) .4061 (25.89) .3125 (25.58) .5119 (10.94)Govt. Training scheme .0673 (1.53) .0402 (1.27) 1.4077 (3.03) -.5121 (1.09) 1.0412 (1.08)Male -.2848 (261.23) -.1504 (75.60) .8255 (70.95) .2502 (28.14) 2.7083 (71.68)2009 -.0039 (2.69) -.0301 (12.58) .2199 (13.82) .1295 (10.42) .4129 (8.95)2010 -.0016 (1.18) -.0489 (21.12) .3124 (20.49) .1574 (13.21) .6502 (14.72)2011 -.0076 (5.42) -.0659 (27.83) .3746 (24.41) .1610 (13.42) .8665 (19.46)2012 -.0093 (5.27) -.0914 (29.41) .4540 (23.50) .1767 (11.67) 1.0748 (19.35)16-17 .5345 (94.96) .0817 (25.70) -.0432 (0.95) .1849 (2.80) -.5805 (6.64)18-24 .0193 (9.61) -.0863 (26.81) 1.3702 (63.04) .4539 (26.32) 2.5711 (40.52)25-29 -.0757 (41.20) -.0544 (15.66) .4789 (22.55) .2359 (14.85) 1.1230 (15.59)30-34 -.0247 (13.10) .0029 (0.99) .1079 (5.26) .1125 (7.23) -.0061 (0.09)35-39 .0120 (6.46) .0138 (5.15) -.0127 (0.65) .0576 (3.83) -.2077 (3.49)45-49 -.0257 (14.85) -.0209 (7.49) -.0223 (1.18) -.0383 (2.65) -.0446 (0.76)50-54 -.0247 (13.82) -.0184 (6.48) -.1948 (9.93) -.1358 (9.06) -.5574 (9.20)55-59 .0233 (11.75) .0129 (4.74) -.5266 (25.23) -.2154 (13.31) -1.6299 (26.32)60-64 .2079 (80.61) .0722 (29.85) -1.2350 (52.03) -.3984 (20.40) -2.9799 (47.03)65-69 .4885 (117.34) .1002 (39.18) -2.1545 (59.66) -.5331 (14.02) -3.9311 (50.96)70+ .6349 (103.62) .1022 (33.22) -2.6909 (51.36) -.6391 (9.08) -4.4403 (44.95)Mixed -.0123 (2.23) -.0304 (3.85) .4968 (8.00) .1756 (3.59) .8638 (4.89)Asian .0339 (13.70) -.0326 (9.94) .7643 (30.15) .4674 (23.71) .9210 (12.27)Black -.0108 (3.18) -.0658 (12.73) 1.4139 (37.81) .8540 (29.51) 2.3009 (20.57)Chinese -.0190 (2.69) -.0580 (5.38) .5097 (6.54) .1496 (2.49) 1.2459 (5.34)Other race .0067 (1.51) -.0808 (12.63) .7993 (17.21) .4295 (11.91) 1.2364 (9.02)No race -.0405 (1.91) -.0607 (1.68) 1.6456 (6.92) .8212 (4.48) 4.0378 (5.64)DDA Disabled .0945 (46.22) .0161 (7.05) .2703 (12.59) .1814 (9.88) .2119 (4.06)Work limiting disabled -.0096 (5.22) -.0062 (2.22) .1426 (6.92) .0832 (5.10) .1492 (2.57)Not disabled .0433 (15.47) -.0245 (6.88) .3555 (12.02) .1282 (5.28) .6932 (9.01)No qualifications .0957 (5.61) -.0331 (1.54) .6918 (4.53) .3802 (3.31) 1.9410 (3.88)Agriculture .0026 (0.52) .0262 (3.00) -.2584 (5.41) -.3125 (8.92) -.6202 (3.46)
29

Energy & Water .0207 (3.90) .0333 (3.51) -.1859 (4.56) -.1218 (4.29) -.5510 (2.60)Construction .0268 (8.65) -.0432 (7.25) -.0147 (0.61) .0535 (3.14) .2790 (2.42)Distribution & hotels .2443 (93.37) -.0227 (5.61) .4081 (20.40) .1221 (8.15) .4968 (6.06)Transport & communication .0887 (29.62) -.0192 (3.83) .1007 (4.31) .0116 (0.70) .3693 (3.61)Banking & finance .1324 (50.87) -.0162 (3.77) .0855 (4.13) .0144 (0.95) .1852 (2.15)Public admin, educ & health .1703 (65.19) -.0100 (2.39) .2058 (8.88) .1807 (0.12) .1466 (1.69)Other services .2235 (66.22) -.0194 (4.15) .3363 (12.25) .1464 (6.68) .4591 (4.91)Rest Northern region .0163 (3.83) -.0058 (1.03) .0478 (1.08) .0305 (0.88) .1881 (1.46)South Yorkshire .0317 (6.74) .0183 (3.19) .0492 (1.01) .1305 (3.42) -.0274 (0.20)West Yorkshire .0154 (3.78) .0270 (5.35) -.0133 (0.31) .0542 (1.63) -.1590 (1.26)Rest of Yorks & Humberside .0438 (9.81) .0194 (3.62) -.0498 (1.10) .0732 (2.06) -.1438 (1.12)East Midlands .0233 (6.15) .0138 (2.88) .0860 (2.19) .0814 (2.65) .2262 (1.98)East Anglia .0351 (8.50) .0206 (4.09) .0591 (1.40) .0643 (1.94) .2165 (1.78)Central London -.0699 (18.56) .0236 (3.97) -.2149 (4.96) -.1005 (3.07) -.5505 (3.68)Inner London (not central) -.0230 (5.57) .0081 (1.41) .0510 (1.12) .0422 (1.21) .1096 (0.79)Outer London .0105 (2.65) .0109 (2.14) .1316 (3.15) .0903 (2.77) .3635 (2.98)Rest of South East .0378 (10.61) .0344 (7.93) -.0367 (1.00) .0625 (2.18) -.0808 (0.75)South West .0452 (11.87) .0258 (5.68) .0023 (0.06) .1180 (3.90) -.0749 (0.67)West Midlands Metrop .0000 (0.01) .0073 (1.38) -.0619 (1.45) -.0203 (0.61) -.0736 (0.58)Rest of West Midlands .0293 (7.21) .0130 (2.56) -.0397 (0.95) -.0066 (0.20) .0319 (0.26)Greater Manchester .0026 (0.65) .0136 (2.62) .0139 (0.33) .0456 (1.39) -.0418 (0.33)Merseyside .0165 (3.49) .0139 (2.29) -.0539 (1.08) -.0187 (0.48) -.1232 (0.85)Rest of North West .0164 (4.06) .0124 (2.40) .0022 (0.05) .0364 (1.10) .0260 (0.21)Wales .0119 (3.01) -.0069 (1.29) .0526 (1.26) .0732 (2.24) .0596 (0.49)Strathclyde -.0083 (2.03) -.0139 (2.36) .1660 (3.76) .0662 (1.93) .4471 (3.42)Rest of Scotland .0202 (5.10) .0051 (0.98) .0076 (0.18) .0107 (0.33) .0933 (0.78)Northern Ireland -.0167 (4.21) -.0180 (3.06) -.3256 (7.55) -.2027 (6.08) -.6048 (4.70)Outside UK -.0910 (7.24) .0043 (0.17) -.4667 (4.36) -.2893 (3.89) -1.4671 (2.20)Public company, plc -.0071 (2.14) .0154 3.28 -.1006 (2.95) -.0418 (1.62) -.3884 (3.58)Nationalised industry etc -.0272 (4.07) -.0895 7.43 .1501 (2.38) .0584 (1.28) .6240 (2.56)Central govt., civil service -.0566 (21.04) .0552 11.57 -.3025 (9.57) -.2181 (9.16) -1.0172 (9.50)Local govt. or council .0117 (6.72) -.0148 6.09 .0905 (4.53) -.0295 (1.79) .2989 (5.80)University, etc .0155 (4.41) -.0083 1.61 .0149 (0.38) -.1068 (3.38) .0385 (0.35)
30
Health authority or NHS trust -.0024 (1.15) .0297 9.96 -.3961 (15.72) -.1854 (8.91) -.7800 (12.02)Charity, voluntary org, etc .0328 (11.62) -.0093 2.44 .0881 (2.73) -.0103 (0.37) .2560 (3.23)Armed forces -.1399 (19.89) .0271 1.26 -.7449 (10.93) -.6348 (3.54) .7162 (1.42)Other kind of organisation -.0048 (0.96) -.0259 3.48 .0739 (1.33) -.1142 (2.56) .4763 (3.11)Constant 1.8970 -.1603 .4207
Pseudo/Adjusted R2 .2257 .1283 .1018 .0171 .1016N 797,047 220,110 766,174 551,515 214,659
Notes excludes 4025 cases that said they would prefer less hours (lespay). Equations include 66 highest qualification dummies and 11 month dummies – results not reported. Region is defined as region where the individual works. Sample is of workers only. Column 1=dprobit, column 2=OLS. Additional excluded categories, private sector, manufacturing and higher education. T-statistics in parentheses.
Source: Labour Force Surveys, 2008-2012
31
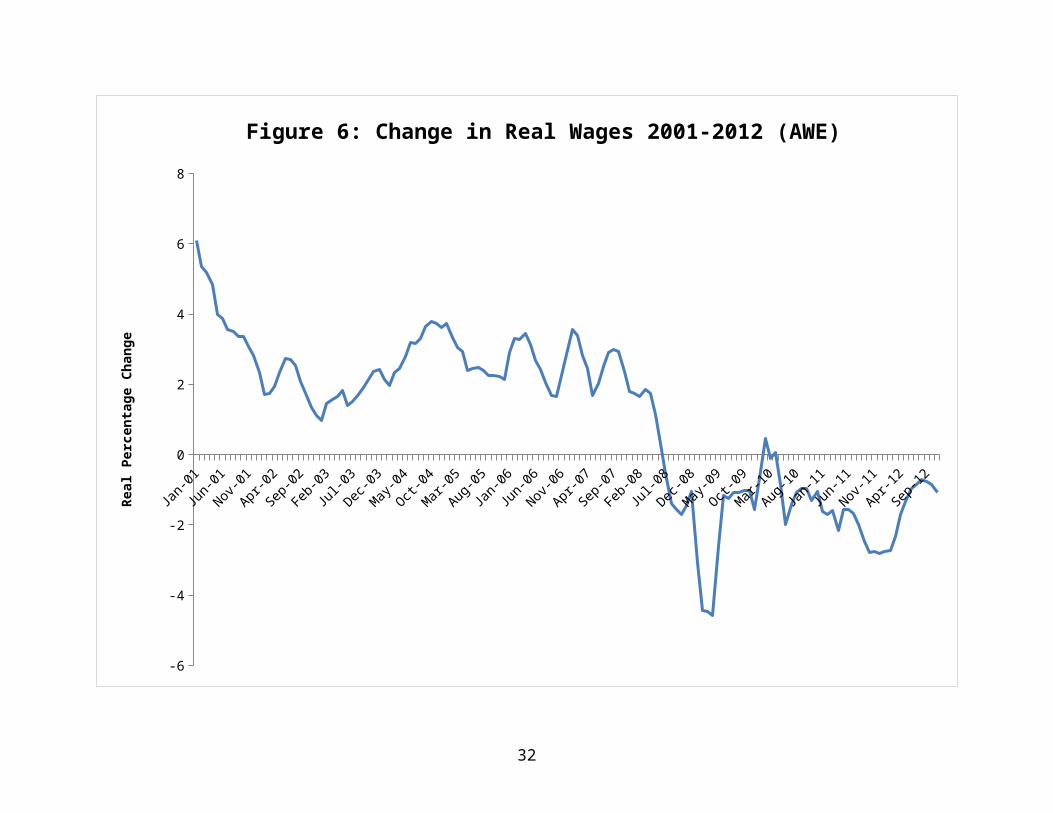
Table 7: Well-being levels
Happiness Life satisfaction Anxious Worthwhile Employee 7.3 7.5 3.1 7.8PT did not want FT 7.5 7.7 3.0 8.0PT wants FT 6.9 6.9 3.2 7.4FT 7.3 7.5 3.1 7.7
Self-employed 7.4 7.5 3.1 7.9PT did not want FT 7.7 7.8 2.9 8.2PT wants FT 6.9 6.9 3.4 7.5FT 7.4 7.5 3.1 7.8
Unemployed 6.7 6.5 3.5 6.9
OLF not Retired 6.7 6.9 3.7 7.3OLF Retired 7.7 7.8 2.8 7.9
Data are weighted by well-being weight (np112r11)Source: Annual Population Survey, April 2011-April 2012
32

Table 8: Well-being Equations, 2011-2012
Happy Life Not anxious Worthwhile Govt. training scheme -.1230 (0.85) -.7986 (6.67) -.5737 (3.02) -.4397 (3.83)Family worker .2059 (1.90) -.0297 (0.33) -.0453 (0.32) .1119 (1.30)Unemployed <12mths -.5577 (15.46) -1.0559 (35.35) -.6042 (12.78) -.7169 (25.04) Unemployed >=12mths -.6940 (14.95) -1.2345 (32.12) -.4915 (8.07) -.9094 (24.66)Full time -.1306 (7.17) -.1110 (7.36) -.1373 (5.75) -.1099 (7.61)PT wants FT -.3587 (9.38) -.5446 (17.20) -.2024 (4.04) -.3473 (11.44)Wants more hours -.0612 (2.37) -.1574 (7.36) -.1723 (5.09) -.0537 (2.62)#Hours unpaid overtime -.0068 (4.36) -.0015 (1.18) -.0189 (9.23) .0032 (2.63)Constant 7.0614 7.2954 -3.3699 7.5253
Adjusted R2 .0700 .1259 .0416 .0920N 165,227 165,278 164,974 164,570
Notes: all equations also include controls for gender, year, age (7), region (10), ethnicity (12), marital status (5), Out of the Labour Force (20) and highest qualifications (78), DDA disabled, DDA disabled and work-limiting disability. Excluded categories are ages 45-54; North East; white; employee, PT does not want FT and not disabled. T-statistics in parenthesisSource: Annual Population Survey, April 2011-April 2012.
33
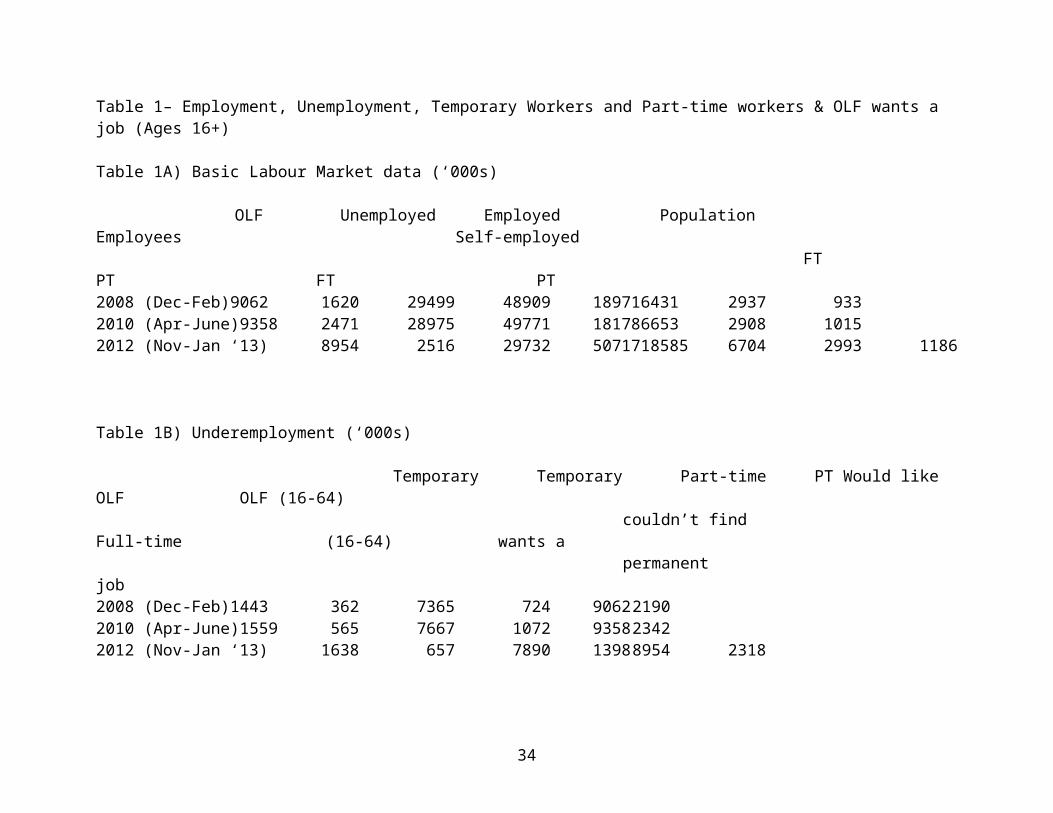
Table 9. Well-being Equations for Employees, 2011-2012
Happy Life Not anxious Worthwhile Full time -.2221 (8.76) -.3179 (15.97) -.1751 (5.10) -.2731 (14.79)PT wants FT -.3827 (9.08) -.5998 (18.13) -.1182 (2.07) -.3975 (12.93)Wants more hours -.0738 (2.66) -.1461 (6.70) -.19145 (5.08) -.0620 (3.06)#Hours unpaid overtime -.0101 (5.78) -.0046 (3.42) -.02128 (8.97) .0003 (0.25)Log weekly earnings .0410 (2.20) .1355 (9.29) .07158 (2.84) .0717 (5.29)Constant 7.6028 7.3744 -3.5209 8.0261
Adjusted R2 .0213 .0510 .0185 .0463N 65,855 65,851 65,809 65,753
Notes: all equations also include controls for gender, year, tenure, age (7), region (10), ethnicity (12), industry (eight), size of farm (six), occupation (eight), DDA disabled, DDA disabled and work-limiting disability. Excluded categories are ages 45-54; North East; white; employee, PT does not want FT and not disabled. T-statistics in parenthesisSource: Annual Population Survey, April 2011-April 2012
34

Appendix: Data used to construct the underemployment index
Millions of Weekly HoursUnderemployment
Index
Published Unemployment
RateDesired
Reductions Increases "Unemployed" Total2001 25.6 22.8 48.6 899.4 4.8% 5.1%2002 25.7 22.7 49.0 887.7 4.9% 5.2%2003 26.5 23.0 47.3 889.6 4.7% 5.1%2004 25.7 22.4 44.9 890.2 4.4% 4.9%2005 24.4 22.9 46.7 908.6 4.7% 4.9%2006 24.0 24.9 53.1 912.7 5.6% 5.5%2007 24.9 26.1 52.4 919.5 5.5% 5.4%2008 23.0 27.7 55.9 915.8 6.2% 5.8%2009 21.6 33.9 74.9 897.1 9.0% 7.8%2010 22.7 37.1 76.9 892.9 9.4% 8.0%2011 22.1 38.7 80.2 905.9 9.8% 8.2%2012 22.7 40.6 81.5 918.4 9.9% 8.1%
35