under-deposit corrosion 15 - ohio university corrosion-trends in...under-deposit corrosion 15 ......
TRANSCRIPT

Under-deposit corrosion 15Bruce Brown 1 and Jeremy Moloney 21Ohio University, Athens, OH, United States; 2Nalco Champion, An Ecolab Company, SugarLand, TX, United States
15.1 Introduction
Produced fluids from many oil and gas wells have been known to carry silt, sand, andsolids from the geologic reservoir, which can be left behind as deposits along the inte-rior of a production or transmission pipeline. These deposits become a diffusion barrierbetween the produced fluids and the interior pipe wall, which results in the waterchemistry near the steel surface to differ from that of the bulk fluids. Observationsfrom laboratory studies and field cases have shown that these deposits influence corro-sion mechanisms and lead to a localized corrosion called under-deposit corrosion(UDC). Often found at low-flow areas inside pipelines, UDC is a very aggressiveform of corrosion that occurs when suspended solids and precipitated phases are giventhe opportunity to settle to the bottom of the pipeline. The three general categories ofdeposits include inorganic deposits, such as sand, clay, and corrosion products;organic deposits, such as asphaltenes and wax; and “schmoo,” which is a mixture oforganic and inorganic deposits [1].
Depending upon the environmental attributes and the type of deposits, differentcorrosion mechanisms can be applied to explain UDC. The main observationfrom laboratory studies [2e7] has been the large increase in electrical potential dif-ference that occurs between a metal electrode under a sand deposit and a bare metalelectrode, both in the same solution, when an inhibitor was added. The bare metalelectrode would increase to a more positive potential because of the reduction inboth anodic and cathodic reactions, whereas the potential of the UDC electrodemight not be affected at all as a result of the sand acting as a diffusion barrier towardthe corrosion inhibitor. When these two metal electrodes were connected together,the UDC electrode experienced a strong anodic polarization and, thus, galvaniccorrosion. Other laboratory studies that focused on a single UDC electrode[8e14] found that the influence of a deposit on corrosion and mitigation mecha-nisms was to create a mass transfer barrier that limited the transfer of species(ions, inhibitors, and biocides) to and from the metal surface. Experiments havealso shown deposits to provide additional surface area, which causes parasiticadsorption of inhibitors and biocides, and in turn their effectiveness is reduced.The review of research observations provided in this chapter on UDC contains infor-mation on the effect of deposits on the surface area for localized corrosion, types ofdeposit materials, experimental methodologies, mitigation methods for UDC, andgaps in the current knowledge that require future research.
Trends in Oil and Gas Corrosion Research and Technologies. http://dx.doi.org/10.1016/B978-0-08-101105-8.00015-2Copyright © 2017 Elsevier Ltd. All rights reserved.

15.2 UDC mechanisms related to the deposit
Solids are often carried by the fluid flow from the reservoir and can accumulate in anoperating pipeline to become a deposit when the energy of the flow is not high enoughto keep them suspended or moving. These deposits are understood to contain a mixtureof water, hydrocarbons, microorganisms, and inorganic compounds along with corro-sion products and scales, which, of course, differ from field to field and almostcertainly differ down the same pipeline as water chemistry conditions change withtemperature and pressure. It is also understood that the corrosion mechanisms are influ-enced by whether the deposit is inert or conductive. In this section, some of the com-ponents that make up the deposits and how each will influence corrosion, along with acalculation of the cathode to anode area ratio that can be developed in relation to thedepth of the deposit, are reviewed.
15.2.1 Inert deposits
Most commercial oil and gas reservoirs occur in sedimentary rock deposits because oftheir characteristic permeability and porosity. Sedimentary rocks form in the Earth’s crustthrough a sequence of physical, chemical, and biological processes. Common sedimen-tary minerals include silicates, carbonates, clay, and iron. Silicates and carbonates makeup most of the rock-forming minerals and are considered insulators with electrical resis-tivity greater than 109 ohm$m. Sand, silt, and clay are classified by grain size and compo-sition. Sand ranges in diameter from 2 to 0.063 mm, whereas silt ranges in diameter from0.063 to 0.002 mm, and clay is defined as less than 0.002 mm in diameter. Both sand andsilt are mainly composed of SiO2-rich particles, whereas clay is composed mainly of alu-minosilicates with a sheet structure [15]. Although some reservoirs have an inherentproblemwith the production of solids, high rates of production from a reservoir or a stim-ulation treatment to increase production from an existing well may also cause the migra-tion of formation sand, silt, and clay through the production string into the pipeline.
The presence of non-conductive or inert deposits, such as sand, silt, and certainscales, on the pipe wall can act as a diffusion barrier to limit the mass transfer of cor-rosive species, inhibitors, biocides, or other oilfield chemicals from the bulk solution tothe metal surface. When this is the only mechanism involved in corrosion, this diffu-sion barrier generally retards the corrosion under the body of the inert bed. To provethis mechanism, Huang et al. [8] tested clean inert solid deposits with different particlesizes (SiO2 powder, glass beads, and sand) to determine the effect of the depositedsolids on the fundamental mechanisms of CO2 corrosion. The specially designed metalspecimen holder used in that study is shown in Fig. 15.1. The three layers of the holderwere used to (1) isolate the electrical connections from the solution, (2) support aremovable metal specimen so only the top of the specimen was exposed to the envi-ronment, and (3) define the thickness of the sand bed. Using this type of specimenholder to generate a reproducible 5-mm depth for each inert solid deposit, a linear rela-tionship between the deposit porosity and the average CO2 corrosion rate of an X65steel in 24-h experiments was obtained (Fig. 15.2).
364 Trends in Oil and Gas Corrosion Research and Technologies

This linear relationship between the deposit porosity and corrosion rate [16] was anindication that both anodic and cathodic reactions were significantly retarded under-neath the deposited inert solids. As ferrous ions are released from the metal surfaceunder a deposit, their concentration is much greater near the metal surface becauseof the slow flux through the low porosity of the sand bed to the bulk solution. The in-crease in ferrous ion concentration increases the pH and saturation value near the metal
Figure 15.1 Specimen holder: (a) base, with three gold contacts to connect the steel specimenand wire for electrochemical measurements; (b) steel specimen holder; (c) sand holder,machined to the desired depth of the sand deposit [16].
0
0.1
0.2
0.3
0.4
0.5
0.6
0.7
0.8
20% 30% 40% 50% 60% 70% 80% 90% 100%
250 µmsand
60 µmglass beads
44 µmSiO2 powder
Baresteel
Cor
rosi
on ra
te (m
m/y
r)
Deposit porosity
Figure 15.2 Deposit porosity and CO2 corrosion rate relationship (pH 5, 25�C (77�F),1 bar (14.5 psi) pCO2, deposit depth 5 mm, 24 h) [8].Reproduced with permission from NACE International, Houston, TX. All rights reserved.
Under-deposit corrosion 365
surface, leading to near surface precipitation. This was proved by Huang et al. [8], whofound that the pH under the deposit was consistently near pH 6 independent of tem-perature (25 and 80�C or 77 and 176�F, respectively), type of deposit (SiO2, sand),and bulk solution pH (pH 4, 5, and 6). When an inert deposit was used to fully coverthe steel specimen, these types of deposits were not found to cause localized corrosionbut to have consistently low CO2 corrosion rates under the deposits for all the condi-tions tested. As the corrosion products within the inert deposit increase with time,corrosion was limited by blocking sites on the surface where metal loss or cathodicreactions might occur. The sand bed literally starved the reaction of the fuel that itneeds to continue.
15.2.2 Conductive deposits
Iron sulfides are probably the most encountered semiconductive deposit types in oiland gas production and transmission pipelines. Numerous iron sulfides can exist,the nature of which is dependent on the environment and operating parameters. Rick-ard and Luther [17] provide a comprehensive review of the chemistry of iron sulfides,including their semiconductive properties. A semiconductor is a crystalline or amor-phous solid with an electrical resistance (ER) much larger than metals, but with lowerresistance than an insulator, that increases in electrical conductivity with an increase intemperature. Electrical resistivity is the inverse of the material’s electrical conductiv-ity. Electrical resistivity has the greatest variation of any materials’ physical propertyfrom metals as low as 10�7 ohm$m to insulators at approximately 1020 ohm$m, wheresemiconductors range from having insulator properties (106 ohm$m) to being conduc-tive (10�5 ohm$m). Iron sulfides, such as pyrrhotite and pyrite, have been measured tohave a resistivity between 10�5 and 1 ohm$m, which is in the higher range of conduc-tive properties for a semiconductor [18,19].
Research on the effect of iron sulfides on corrosion of mild steel has shown theirinfluence on anodic and cathodic reactions [20,21] and their influence on acceleratingcorrosion [11,22]. In a UDC study on X65 steel, Menendez et al. [11] used fivedifferent types of iron sulfide deposits obtained from various sources, which were char-acterized with respect to their particle size, crystalline structure, and surface composi-tion using particle size analysis, X-ray diffraction, and X-ray photoelectronspectroscopy. Corrosion studies were conducted at 65�C with partial pressures of370 bar (5.4 ksi) pH2S and 710 bar (10.3 ksi) pCO2. In 100-h autoclave corrosiontesting, mass loss specimens fully covered with one of the specific iron sulfide depositsshow that the mackinawite-type deposit facilitated the most corrosion. X65 specimenscovered with two synthesized batches of mackinawite had general corrosion rates of upto 4 mm/year, whereas those covered with mackinawite synthesized with excess Na2Sexhibited the highest general corrosion rate of 6 mm/year. However, specimenscovered with two commercially acquired iron sulfide powders only had general corro-sion rates of 0.2 mm/year. When specimens in an autoclave were exposed to similarconditions with 48,500 ppm Fe2þ in solution to induce mackinawite precipitationover 168 h, the general corrosion rate was only 0.6 mm/year, but pitting corrosionranging from 300 to 500 mm in depth (greater than 2500 mm/year) proved that the
366 Trends in Oil and Gas Corrosion Research and Technologies

precipitated mackinawite facilitated localized attack. The localized corrosionmorphology produced in the mackinawite precipitation experiments was consideredto have good agreement with UDC attack observed in the field. Jing et al. [22] alsofound localized corrosion was initiated once a sufficient amount of mackinawite corro-sion product had formed and was transformed into greigite and/or pyrrhotite. The initi-ation of localized corrosion was thought to be due to the galvanic effect exaggerated bythe differences in electrical conductivity of the different iron sulfides.
One specific study on iron sulfide UDC focused on evaluating the galvanic corrosionthrough the use of a specialized probe with an actual field sludge deposit in a CO2/H2Senvironment. Alanazi et al. [9] conducted weight loss and electrochemical corrosion testsusing a coupled multielectrode array system (CMAS) that contained 25 flush-mountedcarbon steel rods (UNS G10180) with an active surface area of 0.45 cm2 and a 1.5-cm-thick sludge deposit. Analysis of the sludge deposit shows that it was made up of85 wt% CaCO3, 8 wt% pyrite, and 3 wt% mackinawite with smaller amounts of otherinert species. The CMAS was coupled to a carbon steel rod (UNS G10180) with anapproximate surface area of 26 cm2, which was in the bulk solution. The gas mixtureused was 0.1 mol% H2S and 0.39 mol% CO2, with the balance of gas being nitrogenat a total pressure of 1 bar (14.5 psi) and temperature of 48�C (118�F). Electrochemicaland galvanic corrosion testing conducted with the CMAS measured average galvaniccorrosion rates of 30 mm/year underneath the sludge deposit when coupled with the elec-trode not under the deposit. Under the same environmental conditions, the 2.54-cm-diameter weight loss specimens without deposit had general corrosion rates less than1 mm/year over a 24-h experiment time. The mackinawite in the field sludge wasbelieved to be the cause of the very high localized corrosion rates observed for the mul-tielectrodes. This was expected because the mackinawite is conductive, but the weightloss specimens were also a reminder that the high localized corrosion required a largecathode external to the deposit to drive the high corrosion rates.
15.2.3 Effect of deposit on surface area in inhibited pipelines
In a pipeline, sand and solids tend to collect along the bottom of the cylindrical surfaceas a result of gravity, leaving a much greater metal surface area within the pipeline thatis not under the sand bed. For example, an inhibited water injection line with a full pipeflow containing a sand bed with a depth that is 1% of the pipe diameter can have almost15 times more cathodic area from the pipe walls than the anodic area under the sandbed. Fig. 15.3 shows the relationship between the depth of an inert sand bed (% depthratio) in a pipeline and the ratio between the surface area of the pipeline above andbelow a deposit (ratio of cathode area to anode area) in an inhibited full-pipe flow.
Many laboratory experiments have been designed to evaluate an inhibitor’s perfor-mance in the presence of an inert sand deposit. These experiments have been designedto study the effectiveness of an inhibitor through a sand bed and have used cathode toanode area ratios of 4:1 or smaller. From Fig. 15.3, it can be seen that a 10% sand beddepth ratio (i.e., 1 cm sand depth in a 10.1-cm-diameter pipeline) is almost equivalentto a 4:1 cathode to anode ratio in an inhibited pipeline.
Under-deposit corrosion 367

15.3 Research methodologies
There are many different methods that have been used to study UDC in controlled lab-oratory conditions. Testing methods used by various researchers have been developedbased on postulates for UDC mechanisms from failure analysis and laboratory studies,so research in this area has varied widely. Studies have focused on the mechanisms ofsolid deposition, the chemical makeup of the solid deposit, mechanisms of diffusionthrough the solid deposit, and the galvanic effect, which can be caused by the presenceof both a solid deposit and the ever necessary corrosion inhibitor. The fact that UDC isa form of localized corrosion is even viewed differently by different researchers. Ifthere is a higher general corrosion rate under the entire deposit as compared withthe remaining pipe walls in an inhibited system, then the localized corrosion area ofmetal loss is under the entire sand bed. But most of the discussion in the literaturehas focused on finding deeper pitting corrosion that occurs within the area underneaththe sand bed. Experiments to uncover corrosion mechanisms related to UDC havelooked at the lack of inhibitor reaching the metal surface under the deposit, the corro-sion experienced by a single metal specimen under the sand deposit, and the effect ofgalvanic corrosion when using multiple metal specimens in the same experiment (onemetal specimen with a deposit coupled to another metal specimen without a deposit inthe same solution).
As with any research topic, UDC has been studied with many different viewpointsbecause of the various possible compositions of the deposit and the method in which itwas deposited. In experiments related to diffusion through solids, many have sug-gested parasitic consumption of inhibitor on the large surface area of the sand particlesas the reason for loss of inhibition and the occurrence of localized corrosion[4,13,14,23]. In experiments using electrochemical measurements of coupled metal
0
5
10
15
20
25
30
35
40
45
50
0.1 1 10 100
Rat
io o
f cat
hode
are
a to
ano
de a
rea
% depth ratio (sand bed depth : pipe diameter)
Figure 15.3 Ratio of cathode to anode based on sand depth.
368 Trends in Oil and Gas Corrosion Research and Technologies
specimen to characterize the UDC phenomena, it was understood that the presence ofcertain inhibitors in association with the characteristics of the deposit would induce agalvanic cell with the anodic part being the small area under the sand bed and thecathodic part being the much larger surface area of the surrounding pipeline[3e7,9,13,16,23]. In experiments using an uncoupled metal specimen to understandthe role of the deposit material in UDC, it was understood that the depth of the depositmainly creates a diffusion barrier that should cause widespread corrosion underneathan inert sand bed, but small areas of localized corrosion were found that required moreexplanation [16,24]. This led to experiments with single sand grains spread out on asingle corrosion specimen in the presence of a corrosion inhibitor, which createda methodology for repeatable pit initiation in the presence of a corrosion inhibitor[24,25]. It also changed the viewpoint that parasitic consumption of the inhibitorwas the main cause of the observed isolated localized corrosion under a deposit.The link between the coupled metal specimen experiments with only one specimen un-der a deposit and the single specimen with a partial sand coverage is the galvanic effectthat occurred in the presence of an inhibitor. This shows the real need to understandhow the mechanisms related to this galvanic effect could be influenced by the inhib-itors used to mitigate UDC.
The examples of test methodologies in the following discussion are representativeof what is found in the literature. Most techniques have been developed by one set ofresearchers and slightly tweaked by others to learn something new or to relate to theirindividual project goal. The one procedure in common with all techniques is that theyall involve time for precorrosion before the inhibitor is added.
15.3.1 Parasitic loss of the inhibitor to the solid deposit
Because most inhibitors are surfactants, the first assumption is that an increased sur-face area caused by the addition of sand will cause a parasitic loss of the inhibitorto the liquid/solid interface. Two types of experiments have been conducted withoutthe sand or deposit material coming into contact with the corroding sample to deter-mine if parasitic loss is a factor for the specific inhibitor being used.
A basic bubble test method [12] has been used to assess if the presence of solidsaffects the efficiency of the tested inhibitor(s). The sand did not come in contactwith the metal being tested but was dropped into the glass cell with the metal to in-crease the surface area for inhibitor adsorption. An experiment with the sand presentin the glass cell would be compared with an experiment with the same exact environ-mental conditions without the sand. If a higher corrosion rate occurred repeatedlywhen sand was present in the glass cell, then parasitic loss of the inhibitor was attrib-uted for the difference.
The second method was to use a two-stage test involving column adsorption andthen a corrosion inhibition test [13,14]. These experiments used a prescreening columnto determine the adsorption and penetration of each corrosion inhibitor on a solid (idealor field specimen), then used the same inhibitor in a separate corrosion experiment.The corrosion experiment was carried out under selected test conditions using an elec-trochemically measured specimen with a deposited solid and an electrochemical probe
Under-deposit corrosion 369

with no deposit for comparison. Good correlation was observed between low adsorp-tion in the column tests and acceptable performance in the corrosion experiments.
15.3.2 Experiments on coupled specimen
The galvanic effect for coupled specimen, observed in UDC experiments for two metalspecimens in the same solution with one under the deposit, has shown this mechanism tobe the dominant driving force for localized UDC. The two methodologies shown in thefollowing sections greatly increase the difficulty level for experimental preparations andprocedures but have been used to monitor localized corrosion during an experimentthrough the use of an external potentiostat or zero resistance ammeter (ZRA).
15.3.2.1 Inert deposit test methods
Many researchers have found that there is a large difference in the electrode potentialbetween a sand-covered mild steel specimen and a noncovered mild steel specimenwhen both are exposed to a corrosion inhibitor. When these two specimens are coupledtogether, using similar anode to cathode surface area ratios that might exist in aninhibited pipeline, the galvanic current between them leads to localized corrosion un-der the deposit.
The sand deposit test method [4] has been used to investigate environments wheresand or mineral scale deposition was possible. These experiments were conducted in a3-L glass cell with a test apparatus designed so that prepared sand could easily beadded during the experiment on top of the API 5L X65 specimens. Three metal spec-imens were molded into a flat epoxy square, such that the two 1 cm2 surface area spec-imens were next to each other and parallel to the one large 4 cm2 surface areaspecimen. The square epoxy mold was mounted in the test apparatus at approximately45 degrees angle so that the bottom two specimens would be covered by about 5 mmsand after a 2-h precorrosion. Only one of the small specimens was galvanicallycoupled to the non-sand-covered specimen creating a 4:1 cathode to anode surfacearea ratio when inhibitor was present. This design provided direct proof of the effectof sand on inhibitor performance and the effect of inhibitor on UDC. The key obser-vation in studies with this apparatus proved the effect of inhibitor addition on thegalvanic couple between a sand-covered specimen and a bare specimen that wouldpolarize the sand-covered specimen anodically, leading to localized attack.
Testing by Pedersen et al. [2] found an increase in the open circuit potential (OCP)of an individual bulk solution specimen without sand as compared with the OCP of anindividual specimen underneath a 5-mm sand deposit. Their experiments used twospecimens fully covered in sand (FS1 and FS2), each of 1 cm2 surface area, alongwith one specimen with no sand (NS) of 4 cm2 in area. When NS and FS1 werecoupled together, the coupled potential would be closer to the OCP for NS becauseof the 4:1 cathode to anode ratio. The change in OCP for FS1 was believed to bethe driving force for galvanic corrosion. This experimental technique provided an
370 Trends in Oil and Gas Corrosion Research and Technologies

evaluation methodology for determining the effectiveness of specific inhibitors towardlocalized corrosion inhibition in UDC and should be considered beneficial for inhibitorcomparison studies. For this methodology, factors identified during inhibitor testing onUDC conditions that increase the susceptibility to localized corrosion would includethe degree of anodic polarization of a single specimen, the effect of underdosage ofthe inhibitor, the effect of degradation of the inhibitor with time at higher temperatures,and the effect of corrosion product layer formation. In these studies [2], testing of twoinhibitors under similar conditions proved that inhibitor chemistry played a role in themitigation efficiency of UDC, with an imidazoline salt showing better efficiency thanan alkyl amino acid.
A series of experiments by Barker et al. [3], utilizing the electrode configuration inFig. 15.4, considered the influence of inhibitor components, which included imidazo-line, phosphate ester, sodium thiosulfate, and 2-mercaptoethanol, with results indi-cating the two sulfur-containing compounds had the highest mitigation efficienciestoward UDC general corrosion. Each inhibitor component chemical was tested at45 ppm, equivalent to a 150-ppm inhibitor package with 30% active chemical. Atest duration of 20 h was used for the comparison but was not considered longenough to develop localized corrosion on the individual 1 cm2 surface area speci-mens underneath the sand bed. The phosphate ester inhibitor had the highest mitiga-tion efficiency on the bulk solution specimen in the presence of sand, whereas it hadthe lowest mitigation efficiency on UDC; this led to the conclusion that consumptionof inhibitor by an excessive sand surface area may not be the initiator for localizedcorrosion and other factors may be responsible. For each inhibitor component, itwas found that the deposition of sand retarded both anodic and cathodic reactionsat the steel surface. With the addition of most of the inhibitors, the galvanic currentbetween the UDC electrode and the sand-free electrode was observed to favor anodicdissolution under the deposit. The sodium thiosulfate and the 2-mercaptoethanolwere found to decrease the general UDC rates to less than 0.1 mm/year at bulk solu-tion concentrations as low as 5 ppm.
Under-depositelectrodes with
connectionsUD1 and UD2
Bulk solutionelectrodes with
connectionsBS1 and BS2
Figure 15.4 Specimen holder having under-deposit working electrodes with a 1 cm2 area andbulk solution working electrodes with a 4 cm2 surface area [3].Reproduced with permission from NACE International, Houston, TX. All rights reserved.
Under-deposit corrosion 371

15.3.2.2 Coupled multielectrode array
A coupled multielectrode array (CMAS) test or wire beam electrode (WBE) method[5e7,10] uses multiple small-diameter wires or pins flush mounted in an inert materialthat are coupled together externally from the test environment so that the electrodearray can be tested as one piece of metal or monitored individually for galvanic corro-sion and/or localized corrosion. The cited work have used either a 24-electrode array[5,6,10] or a 100-electrode array [7].
As shown in Fig. 15.5, the 24-electrode array was designed using a polyethyl ethylketone (PEEK) casing around the electrodes, which was fitted into a polytetrafluoro-ethylene cup that would hold 10 mm of an inert deposit. Analysis of the multielectrodearray was performed by progressive polishing of the PEEK holder containing the elec-trodes to physically determine the depth of corrosion that occurred to the nearest20 mm. Experiments using this device [6] confirmed the addition of an inhibitor polar-ized a non-sand-covered electrode to a more noble potential with respect to a sand-covered electrode, which accelerated the corrosion rate under the sand deposit. Inmost of their experiments with industrial inhibitors relevant to oilfield applications,this galvanic corrosion would continue in excess of 30 days.
Hinds and Turnbull [10] used a 24-pin multielectrode probe under two differentCO2/H2S partial pressure ratios of 5:3 (1.67 bar or 24 psi pCO2 with 1 bar or14.5 psi pH2S) and 100:1 (2 bar or 29 psi pCO2 with 0.02 bar or 0.29 psi pH2S)with a 1-cm sand bed with particles of 0.1e0.3 mm diameter in a 10-L autoclave.The precorrosion step was conducted in a CO2-purged solution by applying an anodiccurrent of 1273 A/m2 to individual 1-mm-diameter electrodes (UNS G10180) for adefined time before the addition of H2S to corrode sets of pins to a specific depth (eightat 1 mm, eight at 0.1 mm, and eight uncorroded). Because of this, there was no unin-hibited baseline corrosion rate for comparison. After precorrosion, all 24 pins weregalvanically coupled to an external carbon steel rod (UNS G10180) with an
PEEK casing
Ni wires encasedin PEEK tubing
Hastelloy† tube base
PTFE sand cup
1 mm Ø carbon steelelectrodes in epoxy
Figure 15.5 Coupled multielectrode array [6]. PEEK, polyethyl ethyl ketone; PTFE,polytetrafluoroethylene; y, trade name.Reproduced with permission from NACE International, Houston, TX. All rights reserved.
372 Trends in Oil and Gas Corrosion Research and Technologies

approximate surface area of 32 cm2, which was in the bulk solution, and inhibitor wasadded. The CO2/H2S gas mix was then added and galvanic corrosion rates were moni-tored until the corrosion rate on most pins was less than 0.1 mm/year. They found thatthe amount of time for the inhibitor to provide protection through the sand bed wasrelated to the amount of precorrosion as the non-precorroded pins were inhibitedwithin 2 days, the 0.1-mm-depth precorroded pins were inhibited within 4 days, andthe 1-mm precorroded pins took 4 days to achieve the desired corrosion rate.
As shown in Fig. 15.6, the 100-electrode WBE array [7] was used to directly mea-sure the galvanic current distribution under the deposit. This typical map was collectedin a CO2-purged solution at 25�C (77�F) after 10 ppm imidazoline inhibitor wasadded. Notice that the anode areas are located within the ring under the sand deposit,whereas the cathode areas are mainly located where no sand was present. Themaximum anodic current measured ranged from 0.022 to 0.034 mA/cm2 in the centralareas of the deposit.
15.3.3 Experiments on an individual specimen
Experiments using a single corroding specimen under a deposit are focused on the de-posit’s direct effect on the basic corrosion mechanisms associated with the deposit and/or the inhibitors’ ability to diffuse through the deposit or under the individual sandgrains to the metal surface. From the literature, as well as the research previouslyreviewed in this chapter, it appears as though there is a general consensus that a stag-nant deposit acts as a diffusion barrier that slows down the transfer of corrosive spe-cies, inhibitors, and/or biocides to the metal surface while also slowing down thetransport of corrosion products away from the metal surface. There is also strong ev-idence that the mechanism of galvanic corrosion occurs between deposit covered and
Major anodiccorrosion areasMajor cathodic
areas
00
2
2
4
4
6
8
6 8 Sand covered area
–0.035
–0.019
–2.326× 10⁻³
0.014
0.031
Galvanic current distribution
Figure 15.6 Galvanic current distribution map measured using a wire beam electrode exposedto CO2 under-deposit corrosion conditions with imidazoline-type inhibitor present [7].
Under-deposit corrosion 373

noncovered areas in the presence of specific inhibitors, even when the metal surfacehas a partial or minimal coverage by an inert deposit.
15.3.3.1 Full coverage deposit
A lot of experimentation has been carried out using a single specimen underneath a de-posit to access the effect of the deposit on corrosion and corrosion mitigation. This typeof testing should be completed as a first step to develop the foundation of informationused to understand more complex corrosion mechanisms or could be used in more com-plex systems to gain insight on specific issues. The first example helps to build the foun-dation of information through repeatable experiments in a cup-style specimen holder toprovide a consistent sand bed depth for electrochemical or weight loss studies in an auto-clave. The second example used specially designed equipment to experimentallycompare the in situ inhibited corrosion rate for a specimen with an iron sulfide corrosionproduct layer with a similar specimen with a deposit of iron sulfide deposited as a pre-cipitate from the bulk solution to understand the effect of each on corrosion mitigation.The third example delivers a broader scope of the more foundational information bychanging the environmental parameters of temperature, sand thickness, and inhibitordosage to understand the effect of each on UDC and the mitigation of UDC. Thedifferent test methods discussed later show an increase in the desire to provide experi-mental methodologies to uncover corrosion mechanisms related to UDC.
The UDC autoclave method [13] is an extension of a regular inhibitor autoclave testwith a special specimen holder that had a 1-cm raised edge to hold nonconductivesolids on top of a concentric ringetype three electrode and a regular three-finger linearpolarization resistance (LPR) probe to measure general corrosion. After the precorro-sion step without the solid deposit, the specimens were removed from the autoclave,rinsed with ethanol, and quickly dried with nitrogen gas. The cup was filled with deox-ygenated prepared sand and the autoclave put back together for the remainder of theexperiment. Reported tests included four inhibitors plus a blank test with no inhibitorand no deposit. Test times ranged from 6 to 30 days, with most at 25 days. It was sug-gested that an inhibitor must provide good mitigation efficiency for a non-deposit-covered specimen before it should be tested with a deposit, but that does not alwaysmean the inhibitor will perform well with a sand deposit present. If H2S and/or ironsulfide deposits are present, then the electrochemical portion cannot be used but canbe exchanged for a weight loss specimen (weight loss and microscopic examinationfor pitting). To overcome this limitation and facilitate electrochemical monitoring un-der FeS, a setup and approach for monitoring the corrosion rate under iron sulfide de-posits has been proposed [26]. In this methodology, the UDC working electrodecontaining the FeS and the reference and counterelectrodes were separated to avoidbridging problems. It was highlighted that close attention needs to be paid to opti-mizing the potential scan rate of the LPR measurement to overcome shortcomingsin overestimating the corrosion rate, which was attributed to the large interfacial capac-itance induced by the presence of the iron sulfide. This optimized approach showedthat the electrochemical corrosion rates measured under FeS deposits correlated quitewell to the volume loss corrosion rates.
374 Trends in Oil and Gas Corrosion Research and Technologies
An iron sulfide test method for inhibited systems [27] was developed to performER, LPR, and weight loss in an H2S/CO2 environment where the FeS deposit couldbe developed by injection of ferrous chloride or by in situ corrosion of the specimen.This experimental setup was designed to assess the effect of the iron sulfide deposit(mackinawite) on H2S/CO2 corrosion and corrosion mitigation on a square ER probein experiments that could include the use of a hydrocarbon phase. Results found that acarbon steel with an in situ precipitated iron sulfide deposit had around four timeshigher corrosion rate than the carbon steel probe suspended in the same inhibitedsolution.
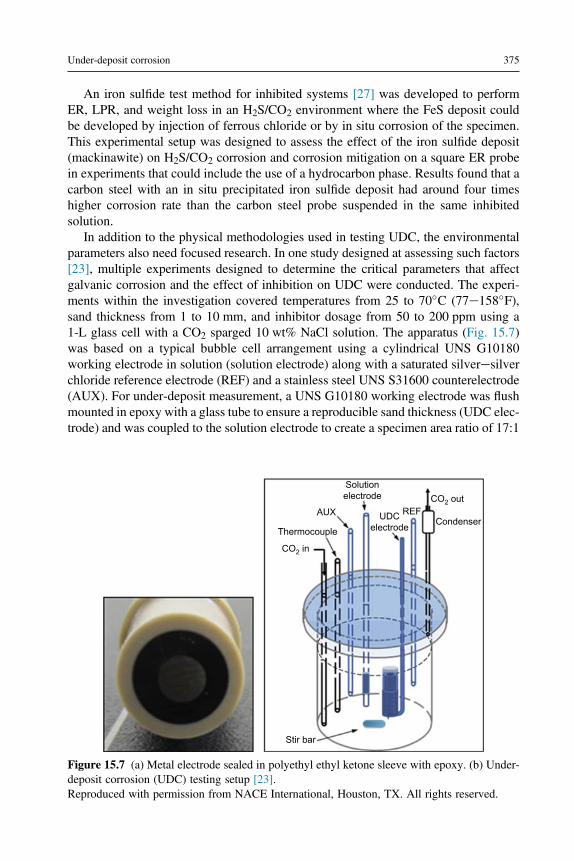
In addition to the physical methodologies used in testing UDC, the environmentalparameters also need focused research. In one study designed at assessing such factors[23], multiple experiments designed to determine the critical parameters that affectgalvanic corrosion and the effect of inhibition on UDC were conducted. The experi-ments within the investigation covered temperatures from 25 to 70�C (77e158�F),sand thickness from 1 to 10 mm, and inhibitor dosage from 50 to 200 ppm using a1-L glass cell with a CO2 sparged 10 wt% NaCl solution. The apparatus (Fig. 15.7)was based on a typical bubble cell arrangement using a cylindrical UNS G10180working electrode in solution (solution electrode) along with a saturated silveresilverchloride reference electrode (REF) and a stainless steel UNS S31600 counterelectrode(AUX). For under-deposit measurement, a UNS G10180 working electrode was flushmounted in epoxy with a glass tube to ensure a reproducible sand thickness (UDC elec-trode) and was coupled to the solution electrode to create a specimen area ratio of 17:1
Stir bar
CondenserREFUDC
electrode
Solutionelectrode
AUX
Thermocouple
CO2 in
CO2 out
Figure 15.7 (a) Metal electrode sealed in polyethyl ethyl ketone sleeve with epoxy. (b) Under-deposit corrosion (UDC) testing setup [23].Reproduced with permission from NACE International, Houston, TX. All rights reserved.
Under-deposit corrosion 375

(solution electrode: UDC electrode). The four-electrode system was coupled via aZRA to observe the galvanic corrosion taking place.
The six major conclusions from this study shown in the following list agree with allexperimental results previously reviewed while giving insights on having a thickersand deposit, an elevated temperature, or a higher concentration of inhibitor.
1. With no inhibitor present, the solution electrode acted as the anode while the sand-coveredelectrode acted as the cathode.
2. Addition of inhibitor quickly reduced the corrosion rate of the solution electrode, whereas theUDC electrode experienced a strong anodic polarization.
3. As a result of this galvanic coupling, the UDC rate dramatically increased and was measuredas high as 17.3 mm/year.
4. A thicker sand deposit was observed to slow the diffusion of inhibitor to the metal surfaceunderneath, which resulted in a higher galvanic current density peak and an ultimately highercorrosion rate under the sand.
5. An increase in the inhibitor concentration also increased the galvanic current over a shortperiod of time, but the higher concentrations did penetrate the sand bed and caused a decayin UDC.
6. Although an increase in temperature caused the solution electrode corrosion rate to increaseby 150%, the UDC corrosion rate increased only by 40%.
15.3.3.2 Partial coverage deposit
In tests with a single specimen under a deposit, Huang et al. [24] reviewed the perfor-mance of an imidazoline-type inhibitor to understand mechanisms related to localizedcorrosion. The specimen holder (Fig. 15.1) was placed in a 2-L glass cell (Fig. 15.8)with deaerated brine for precorrosion, before the inert deposit would be transferredfrom a previously deaerated solution to the area on top of the specimen sand holder.These experiments were conducted over a period of 2e4 days.
They reported that general depletion of the surfactant inhibitor by adsorption on thesilica sand surface and slow diffusion through the porous sand layer were not consid-ered critical factors leading to localized corrosion, but proposed a new mechanism thatthe cause for localized corrosion was related to the inability of the corrosion inhibitorto protect the steel surface in the crevices immediately underneath each sand particle.By testing a single metal specimen with partial sand coverage, it was observed that thelack of inhibition under a single sand particle leads to the formation of a galvanic cellwhere the small area under the sand particle became anodic while the larger inhibitedarea around the particle was the cathode. In comparison with the previous surface arearatios discussed, an individual 250-mm sand particle only required a 1-mm-diameterarea around it to have a 15:1 cathode to anode area ratio.
The partial coverage sand bed methodology developed by Huang et al. [24]was used as a repeatable procedure in the experimental comparison of mono- todi-nonylphenol phosphate ester (PE) ratios by Brown et al. [25]. This series ofexperiments was the first formal attempt to observe the effects of specific chemicalcomponents of an inhibitor package on UDC. In experiments lasting 28 days, non-ylphenol PEs were tested at varying mono- to di-PE ratios of 90:10, 70:30, and
376 Trends in Oil and Gas Corrosion Research and Technologies

50:50. Using an X65 pipeline material partially covered with 250-mm-diameter silicasand particles and exposed to a CO2 sparged brine at 1 bar (14.5 psi) total pressureand 70�C (158�F), multiple measurement techniques employing electrochemistry,weight loss, and profilometry were used for the comparison. It was found that thepresence of 2-mercaptoethanol assisted the nonylphenol PE inhibitors and no local-ized corrosion was observed. Without the mercaptoethanol, the depth of localizedcorrosion observed increased with a decrease in the amount of mono-nonylphenolPE in the inhibitor package. This also provided confirmation for the theory of crevicecorrosion under each sand particle being the main driving force for localizedcorrosion.
Multiple small grains of sand or “partial sand coverage” experiments [16] used afew grains of sand on a single metal specimen, which was monitored electrochemicallyfrom 25 to 40 days and then analyzed by weight loss and profilometry. The test beganwith a 2-h precorrosion of the metal specimen, followed by the addition of a few grainsof 750-mm sand particles, which had been stored in deoxygenated brine to the 7.9 cm2
steel surface area. After 24 h the inhibitor was added and the experiment monitored forthe remainder of the test time. These experiments showed the inability of a genericimidazoline-type inhibitor to protect the surface directly underneath each sand particleas pit penetration rates of 2.2e3.5 mm/year were found for weight loss specimens hav-ing a uniform inhibited corrosion rate of less than 0.1 mm/year. In this type of exper-iment, the inhibitor can be added before the sand or the sand particles can be movedduring the experiment to observe how the inhibitor works with partially stable or mov-ing deposits.
2
9
8
3
4
57
6
1
1. Reference electrode.2. Luggin capillary.3. Platinum counter electrode.4. CO2 gas inlet.5. Condenser.6. Thermal probe.7. pH probe.8. Specimen holder9. Heater
Figure 15.8 Three-electrode glass cell set up for single under-deposit corrosion specimen [16].
Under-deposit corrosion 377

15.4 Mitigation of UDC
The goal of the experimental methods used by various researchers has been to inves-tigate the mechanisms of UDC, which, in some instances, was used to assist in thedetermination of the most effectual approach for minimizing the threat of pipeline fail-ures. Many strategies have been reviewed with the goal to eliminate UDC by the mostcost-effective means available. Most discussions on the topic of UDC mitigation tendto focus on the chemicals used in controlling corrosion as it is understood that the addi-tion of some types of inhibitors creates galvanic corrosion for the area under the depo-sit. It should also be recognized that these solids can accumulate in pipelines and inturn can cause increased pressure drops as well as enhanced localized corrosion.Removal of the deposits or defining parameters of pipeline operations to limit their for-mation along with the addition of chemical inhibition by a predefined inhibitor seemsto be the most used option to mitigate the attack from UDC. However, the true goal ofdiminishing or mitigating the probability for UDC may be achieved by other means inthe design phase before installation and beginning operations of the pipeline. As withany process or procedure, the easiest and most efficient method should be exploredfirst. The following list provides some approaches for achieving a cost-effective meansfor minimizing UDC in both the design phase and the operating phase of a pipelineoperation.
Mitigation methods for minimizing UDC [12]:
1. In the Design Phasea. Design for high flow rates by selecting optimum equipment size.b. Minimize stagnant locations.c. Install pigging facilities where stagnant locations cannot be avoided.d. Use of corrosion-resistant alloys (CRAs) (selection of a proper CRA depends upon many
factors and can increase cost).e. Use of internal coatings (currently not considered a technique by itself for long-term
corrosion protection because of the probability of holidays, delamination, or deterioration;there are also application difficulties for coating existing pipelines with many currentcoating technologies, although advances are being made in this area).
2. During the Operating Phasea. Mechanical removal of debris by pigging (brush pigging with a batch inhibitor
treatment).b. Chemical treatment with appropriate corrosion inhibitor chemistry and dosage deter-
mined through laboratory testing and field trials. Corrosion inhibitors may be addedas slugs of concentrated chemicals or through continuous application while other“cleaning” chemicals and surfactants may be used to suspend particles in the liquidphase along with increasing the velocity of produced fluids to aid in transporting theloose solid debris.
In most instances, because the larger capital expenditures for the use of CRAs andcoatings may make them less likely to be used, engineers must rely on the two mainmitigation strategies during operations: mechanical removal and/or chemical treat-ments. The following sections provide more information on these topics.
378 Trends in Oil and Gas Corrosion Research and Technologies
15.4.1 Mechanical removal of deposits (minimum velocities,pigging)
Mechanical removal of deposits starts with designing for higher flow rates in the oper-ating pipeline. A correlation proposed by Salama to predict sand settling conditionscan also be used as a valid approximation for velocities to define sand removal [28].
Vm ¼�Vsl
Vm
�0:53
d0:17n0:09�Dr
rf
�0:55
D0:47 (15.1)
Vm, minimum mixture flow velocity to avoid sand settling, m/s; Vsl/Vm, the ratio be-tween the liquid superficial liquid velocity and the mixture velocity at the sand settlingconditions (for single phase, this ratio ¼ 1); d, particle diameter, m; D, pipe diameter,m; Dr, density difference between particles and the fluid mixture density, kg/m3; rf,fluid mixture density, kg/m3; n, fluid mixture kinematic viscosity, m2/s.
As the mixture velocity is increased, the critical velocity to begin moving the sandfrom the sand bed to create a scouring flow or moving dunes is a more complicatedprocess than the reverse process to create the sand bed [28].
For small amounts of sand accumulated in the pipeline, removal can be done byincreasing the flow rate or by pigging. Computational fluid dynamics have beenused to model the effect of near-wall velocity at the pipe floor on solids depositionto understand the influence of flow and pipeline geometry to aid in this decision[29,30]. For larger amounts of accumulated sand in an operating pipeline, removalby pigging can create hazards by having an excessive buildup of sand ahead of thepig, which could possibly plug the pipeline or damage the process facility by the sud-den arrival of a large quantity of sand [28].
15.4.2 Chemical treatment for deposits
The presence of a good performing corrosion inhibitor in a water wet pipeline typicallyreduces the general corrosion rate by a large amount by adsorption processes at themetal surface. This low corrosion rate is related to a reduction in the anodic and/orcathodic reactions by an effect from the corrosion inhibitor active species on thecorroding metal surface. As shown by Dominguez et al. [31], a positive shift inOCP is observed because the corrosion process is under mixed (charge transfer/mass transfer) control and an inhibitor affects only the charge transfer reactions(anodic and cathodic) but not the mass transfer of species to the metal surface. Thispositive shift in the OCP of a working electrode in a three-electrode system relatedto the addition of an inhibitor in solution has been observed by others under differentenvironments with different inhibitors [25,32].
When a stagnant deposit is present in an inhibited pipeline, it can be the cause forgalvanic corrosion. The deposit acts as a diffusion barrier with a low porosity andhigh tortuosity for the path from the bulk solution to the pipe wall under the stagnant de-posit. This stagnant deposit does not reduce the anodic and cathodic reactions as much as
Under-deposit corrosion 379

a good performing inhibitor, but may impede some corrosion inhibitors from reachingthe pipe wall. Therefore the smaller area under the deposit does not experience thesame effect caused by the reduction in anodic and cathodic reactions as on the largerpipe wall. In laboratory experiments where these areas can be separated, a large potentialdifference has been observed between the inhibited metal surface in the bulk solution(more positive, cathode) and the noninhibited metal surface under a deposit (more nega-tive, anode). Because a pipeline is one continuous piece of highly conductive metal, therecan only be one potential within the general vicinity that is controlled by the larger cath-ode surface area. The overall potential of the metal adjusts to a mixed potential betweenthe anodic and cathodic reaction-driven potentials, which would be more similar to thecathode potential because of its much larger surface area. The smaller area underneath thedeposit compensates for this difference by the transfer of electrons to the cathode. Thisgalvanic corrosion increases dissolution of ferrous ions from the metal surface under-neath the deposit to cause high rates of localized corrosion and pitting underneath thedeposit as described by the mechanisms discussed and reviewed earlier.
To achieve maximum coverage to the internal pipe wall, added chemicals must beable to diffuse through the deposit to the metal substrate or the deposit must be removedto expose the bare metal surface. Testing has found that 2-mercaptoethanol can assist inmitigating some UDC as it is believed the small size of the molecule (in comparison withother actives such as imidazolines and quaternary ammonium compounds) assists it topenetrate and diffuse more easily through thicker layers and smaller crevices betweenthe sand and the metal of the pipe wall. Some inhibitor package formulations havebeen developed to aid in the removal of oily sludge-type deposits but rely on flow tomaintain a moving slurry of deposit materials in the liquid rather than accumulatingalong the bottom of the pipe. The aim of these approaches is to keep the pipe wall asclean as possible, which, in turn, allows the maximum amount of inhibitor to adsorbonto the metal surface to not only reduce the overall general corrosion rate but, perhapsmore importantly, to minimize the probability of localized corrosion.
When solids, such as sand, clays, corrosion products, and biomass, collect at the bot-tom of a pipeline, they can become bound together with oil and are known as “schmoo”[33]. This type of deposit is known to create a physical barrier and becomes an ideal envi-ronment to grow bacteria leading to microbiologically induced corrosion (MIC). Schmoowas shown to retard the mass transfer of species and corrosion inhibitors to the pipe wall,which aids in the initiation of localized corrosion. Horsup et al. [34] reviewed multipletypes of base inhibitor chemicals and tested multiple inhibitor packages on the problemof schmoo removal. They were able to determine two primary mechanisms of emulsifi-cation and roll up for the removal of schmoo from laboratory test pipelines and field eval-uations, developing a chemical package that was shown to increase flow in a waterinjection line within 6 weeks after initial dosage. This is a good example of using labo-ratory testing to better understand the mechanisms of the problem situation and then inturn to utilize this understanding to develop field mitigation solutions. Although it isacknowledged that biofilms (dead or living) can also result in UDC attack, microbiolog-ical activity involving this form of UDC has been omitted from consideration in thischapter (see Chapter 8 for MIC).
380 Trends in Oil and Gas Corrosion Research and Technologies

15.5 Gaps in current research and areas for future study
The use of all components present in UDC field conditions (e.g., sand, iron sulfide,clays, microorganisms, asphaltenes, waxes, hydrocarbon sludges) for a single testingprogram presents too many variables to be effective and their presence should belimited, or added progressively, in experimental studies to minimize errors in interpre-tation of results. The focus should be on determining which mechanisms to study un-der well-controlled conditions that relate to the complex conditions found in the field.Crolet [35] summed up the behavior of corrosion deposits by stating that the conditionsof formation, protective properties, and sensitivities to external parameters areextremely different for each case, so that the possible configurations and various work-ing hypotheses to model UDC are too numerous. This infers that studies will still needto be conducted on a case-by-case basis, taking into account the physical characteris-tics of the deposit (formation, composition, depth, age, etc.), corrosion-related mech-anisms (diffusion, precipitation, MIC, etc.), and the associated solution chemistry(water, oil, pH, salt content, etc.) in each case. Much research has been done on thesethree topics, with numerous companies developing methodologies on how to providemitigation to their specific problems encountered in the field.
Although various models are available for estimating general corrosion as well asvarious forms of localized corrosion such as top-of-the-line corrosion, there appears tobe limited activity in modeling UDC, which should be a focus for future research. Theaccumulation of the UDC knowledge base, shared throughout the corrosion commu-nity, may be developed not only into a mechanistic model to help predict the extent ofUDC, but also as a means to derive mitigation solutions to a much larger base of op-erators. Furthermore, the knowledge base developed may also aid in the developmentof future inhibitor formulations and packages that might address the issues foundrelated to the physical characteristics of specific deposits, the corrosion mechanisms,and the solution chemistry in each field.
Continued research needs to be conducted with different surfactant molecules todetermine which attributes are valuable to address UDC. Larger inhibitor moleculesmight be expected to show characteristics of steric hindrance around the small crevicesunder a sand particle. In the same way that synergistic effects have been seen betweenmolecules in controlling general corrosion, the identification of synergistic combina-tions of inhibitors for UDC and localized corrosion alleviation would also be advan-tageous. Such research focus may include studies on the molecular level (atomicforce microscopy, molecular modeling, etc.) to better determine and identify typesand mixtures of inhibitor molecules tailored for UDC mitigation.
References
[1] J. Vera, D. Daniels, M. Achour, Under deposit corrosion (UDC) in the oil and gas industry:a review of mechanisms, testing and mitigation, Paper no. 1379, in: CORROSION/2012,NACE, Houston, TX, 2012.
Under-deposit corrosion 381

[2] A. Pedersen, K. Bilkova, E. Gulbrandsen, R. Nyborg, Testing of CO2 corrosion inhibitorperformance under sand deposits, in: Eurocorr 2007, European Federation of Corrosion,London, U.K., 2007.
[3] R. Barker, B. Pickles, A. Neville, General corrosion of X65 steel under silica sand depositsin CO2-saturated environments in the presence of corrosion inhibitor components, Paperno. 4215, in: CORROSION/2014, NACE, Houston, TX, 2014.
[4] A. Pedersen, K. Bilkova, E. Gulbrandsen, J. Kvarekvål, CO2 corrosion inhibitor perfor-mance in the presence of solids: test method development, Paper no. 08632, in:CORROSION/2008, NACE, Houston, TX, 2008.
[5] G. Hinds, P. Cooling, S. Zhou, A. Turnbull, Under deposit test method for assessingperformance of corrosion inhibitors, in: EUROCORR 2008, 2008. Paper 1254.
[6] G. Hinds, A. Turnbull, Novel multi-electrode test method for evaluating inhibition of underdeposit corrosion e Part 1: sweet conditions, Corrosion Journal 66 (4) (April 2010)046001-1e046001-10.
[7] Y.-J. Tan, Y. Fwu, K. Bhardwaj, Mapping electrochemical evaluation of under-depositcorrosion and its inhibition using the wire beam electrode method, Corrosion Science 53(2011) 1254e1261.
[8] J. Huang, B. Brown, X. Jiang, B. Kinsella, S. Nesic, Internal CO2 corrosion of mild steelpipelines under inert solid deposits, Paper no. 379, in: CORROSION/2010, NACE,Houston, TX, 2010.
[9] N.M. Alanazi, A.M. El-Sherik, A.H. Rasheed, S.H. Amar, M.R. Dossary, M.N. Alneemai,Corrosion of pipeline steel X-60 under field-collected sludge deposit in a simulated sourenvironment, Corrosion Journal 71 (3) (March 2015) 301e315.
[10] G. Hinds, A. Turnbull, Novel multi-electrode test method for evaluating inhibition of underdeposit corrosiondPart 2: sour conditions, Corrosion Journal 66 (5) (May 2010) 056002-1e056002-6.
[11] C.M. Menendez, V. Jovancicevic, S. Ramachandran, M. Morton, D. Stegmann, Assess-ment of corrosion under iron sulfide deposits and CO2/H2S conditions, Corrosion Journal.ISSN: 0010-9312 69 (2) (February 2013) 145e156.
[12] NACE Publication 61114, Underdeposit Corrosion (UDC) Testing and MitigationMethods in the Oil and Gas Industry, February 2014. NACE Item no. 24253.
[13] J.A.M. de Reus, E.L.J.A. Hendriksen, M.E. Wilms, Y.N. Al-Habsi, W.H. Durnie,M.A. Gough, Test methodologies and field verification of corrosion inhibitors to addressunder deposit corrosion in oil and gas production systems, Paper no. 05288, in:CORROSION/2005, NACE, Houston, TX, 2005.
[14] W.H. Durnie, M.A. Gough, J.A.M. de Reus, Development of corrosion inhibitors toaddress under deposit corrosion in oil and gas production systems, Paper no. 05290, in:CORROSION/2005, NACE, Houston, TX, 2005.
[15] J.H. Schӧn, Physical Properties of Rocks, Handbook of Petroleum Exploration and Pro-duction, Elsevier, 2011, ISBN 978-0-444-53796-6.
[16] J. Huang, Mechanistic Study of Under Deposit Corrosion of Mild Steel in Aqueous CarbonDioxide Solution, Ohio University, 2013. Electronic Dissertation Retrieved from: https://etd.ohiolink.edu/.
[17] D. Rickard, G.W. Luther III, Chemistry of iron sulfides, Chemical Reviews 107 (2007)514e562.
[18] C.I. Pearce, A.D. Pattrick, D.J. Vaughan, Electrical and magnetic properties of sulfides,Reviews in Mineralogy and Chemistry 61 (2006) 127e180.
[19] W.M. Telford, L.P. Geldart, R.E. Sheriff, Applied Geophysics, second ed., 1998, pp.283e292.
382 Trends in Oil and Gas Corrosion Research and Technologies
[20] Y. Zheng, J. Ning, B. Brown, S. Ne�si�c, Investigation of cathodic reaction mechanisms ofH2S corrosion using a passive SS304 rotating cylinder electrode, Corrosion Journal 72 (12)(2016) 1519e1525.
[21] P. Bai, Y. Liang, S. Zheng, C. Chen, Effect of amorphous FeS semiconductor on thecorrosion behavior of pipe steel in H2S-containing environments, I and EC Research:Industrial and Engineering Chemistry Research 55 (41) (2016) 10932e10940, http://dx.doi.org/10.1021/acs.iecr.6b03000.
[22] J. Ning, Y. Zheng, B. Brown, D. Young, S. Nesic, The role of iron sulfide polymorphism inlocalized H2S corrosion of mild steel, Corrosion 73 (2) (2017) 155e168.
[23] Y. Zhang, J. Moloney, S. Mancuso, Understanding factors affecting corrosion inhibitorperformance in under-deposit testing with sand, Paper no. 2575, in: CORROSION/2013,NACE, Houston, TX, 2013.
[24] J. Huang, B. Brown, S. Nesic, Localized corrosion of mild steel under silica deposits ininhibited CO2 solutions, Paper no. 2144, in: CORROSION/2013, NACE, Houston, TX,2013.
[25] B. Brown, A. Saleh, J. Moloney, Comparison of mono- to diphosphate ester ratio in in-hibitor formulations for mitigation of under deposit corrosion, Corrosion Journal 71 (12)(December 2015) 1500e1510.
[26] Y. Zhang, J. Moloney, Electrochemical corrosion rate measurement under iron sulfidedeposit, Corrosion Journal 72 (2016) 704.
[27] M. Achour, J. Kolts, P. Humble, R. Hudgins, Experimental evaluation of corrosion in-hibitor performance in presence of iron sulfide in CO2/H2S environment, Paper no. 344, in:CORROSION/2008, NACE, Houston, TX, 2008.
[28] M.M. Salama, Influence of sand production on design and operations of piping systems,Paper no. 80, in: CORROSION/2000, NACE, Houston, TX, 2000.
[29] X. Landry, A. Runstedtler, S. Papvinasam, T. Place, Computational fluid dynamics studyof solids deposition in heavy oil transmission pipeline, Corrosion Journal 68 (10) (October2012) 904e913.
[30] A. Runstedtler, P. Boisvert, T. Place, Parametric modeling studies for sediment depositionas sites for under-deposit corrosion in oil transmission pipelines, Corrosion Journal 71 (6)(June 2015) 726e734.
[31] J.M. Dominguez Olivo, B. Brown, S. Nesic, Modeling corrosion mechanisms in thepresence of quaternary ammonium chloride and imidazoline corrosion inhibitors, Paper no.C2016e7406, in: CORROSION/2016, NACE, Houston, TX, 2016.
[32] J. Moloney, W. Mok, C. Menendez, In situ assessment of pitting corrosion and its inhi-bition using a localized corrosion monitoring technique, Corrosion Journal 66 (2010)065003-1e065003-18.
[33] W.M. Bohon, D.J. Blumer, A.F. Chan, K.T. Ly. NACE 1998, Paper 00073.[34] D.I. Horsup, T.S. Dunstan, J.H. Clint, A break-through corrosion inhibitor technology for
heavily fouled systems, Paper no. 07690, in:CORROSION/2007,NACE,Houston,TX, 2007.[35] J.L. Crolet, Mechanisms of uniform corrosion under corrosion deposits, Journal of
Material Science 28 (1993) 2589e2606.
Under-deposit corrosion 383