unconventional monetary policy measures - a comparison of the ecb, fed
DESCRIPTION
monetary policy measure comparisonTRANSCRIPT

DIRECTORATE GENERAL FOR INTERNAL POLICIES
POLICY DEPARTMENT A: ECONOMIC AND SCIENTIFIC POLICIES
Unconventional Monetary Policy Measures:
A Comparison of the ECB, FED and BoE
NOTE
Abstract
When interest rates are close to the lower bound of zero, unconventional measures are needed to preserve the monetary policy transmission mechanism. In addition, the Global Financial Crisis has caused important disturbances in interbank markets, which had required the ample provision of liquidity. This was true in the Euro Area, the UK and the USA, but the European debt crisis has further complicated matters. Our empirical estimates show that the unconventional measures have generally helped to deal with the liquidity crisis, but not with the confidence crisis in the Euro Area’s sovereign debt market.
IP/A/ECON/NT/2012-04 JUNE 2012
PE 475.116 EN
This document was requested by the European Parliament's Committee on Economic and Monetary Affairs.

4 PE 475.116
AUTHORS
Stefan COLLIGNON, Scuola Superiore Sant'Anna, Pisa and Centro Europa Ricerche (CER), Rome, together with Piero Esposito and Yuming Cui
RESPONSIBLE ADMINISTRATOR
Rudolf MAIERPolicy Department Economic and Scientific PoliciesEuropean ParliamentB-1047 BrusselsE-mail: [email protected]
LINGUISTIC VERSIONS
Original: EN
ABOUT THE EDITOR
To contact the Policy Department or to subscribe to its newsletter please write to:[email protected]
Manuscript completed in June 2012.Brussels, © European Union, 2012.
This document is available on the Internet at:http://www.europarl.europa.eu/studies
DISCLAIMER
The opinions expressed in this document are the sole responsibility of the author and do not necessarily represent the official position of the European Parliament.
Reproduction and translation for non-commercial purposes are authorized, provided the source is acknowledged and the publisher is given prior notice and sent a copy.

Unconventional monetary policy Measures________________________________________________________________________________________________
PE 475.116 3
CONTENTS
EXECUTIVE SUMMARY 4
1. BANKING CRISES AND LIQUIDITY 5
2. CONVENTIONAL MONETARY POLICY INSTRUMENTS 9
3. NON-STANDARD MEASURES OF MONETARY POLICY 13
4. EFFECTS OF UNCONVENTIONAL MONETARY POLICY MEASURES 25
ANNEX: ECONOMETRIC ANALYSIS OF THE EFFECT OF QUANTITATIVE EASING MEASURES IN EURO AREA, USA AND UK 29

Policy Department A: Economic and Scientific Policy_______________________________________________________________________________________________
4 PE 475.116
EXECUTIVE SUMMARY
While price stability is the main focus of monetary policy, the severe recession following the Lehmann bankruptcy in 2008, and the persistent Euro-crisis since 2009 have shifted the at-tention towards maintaining financial stability in order to preserve and ensure the proper functioning of the monetary policy transmission channel. In response to the Global Financial Crisis, most governments in the G20 stimulated the economy in 2009 by large deficit-financed fiscal programmes, which were successful in preventing the world economy from falling into a prolonged depression.
Because demand by banks for liquid and safe assets has increased rapidly, while private in-vestors have been less willing to part with them, major central banks have closed the demand gap for riskless and safe assets, entailing a significant increase in their balance sheets. The Eurosystem’s total assets rose by 160% between January 2007 and the end of March 2012. This is less than the Bank of England’s increase of 300%, and the Federal Reserve System’s of 235%, but more than the 20% increase in the balance sheet of the Bank of Japan.
Quantitative easing has become an indispensable monetary policy instrument in the financial crisis. The literature has identifies a number of channels through which quantitative easing may affect the economy, of which the portfolio balance channel is the most important. We list the unconventional measure taken by the Federal Reserve, the Bank of England and the ECBand evaluate their impact on long term government bonds and risk spreads.
Open Market Operations reduce the 3-months spread, lowering the problems in the banking sector, for all countries except Germany and Spain. We find a slightly negative effect of the Covered Bond Purchasing Programme (CBPP) on Germany and more significant effects on Spanish, Portuguese and Irish yields. Hence, in these countries the bailout of private markets has been successful with respect to long run debt, but surprisingly there is no significant im-pact on the 3-months risk spread for any country. This outcome is probably the product of the increase trust by the markets in the European Central Bank, which is fulfilling its role as the lender of last resort and can take its decisions independently from Mem-ber State governments.
The Securities Markets Programme (SMP) has a significant impact only on the Irish long term interest rate. The reason is presumably that the ECB interventions are too timid to fully re-assure markets when there is persistent fire from influential hecklers in Germany and elsewhere.
In the UK the unconventional policy measures do not have much effect on short and long term interest rates. In the US, the evidence is mixed.
Even if quantitative easing has been successful in managing interest rates, there is a particu-lar vulnerability in the Euro Area that results from the asymmetric expansion of collateral for fragile debtors. Swapping debt against central bank money has weakened the Eurosystem’s balance sheet in the sense that the portion of riskier assets has increased. It is therefore desirable to create Union Bonds as an integrated instrument for monetary policy and collat-eral. Recent measures, whereby national central banks can refuse sovereign debt by other Member States as collateral is a step towards financial and monetary disintegration and should be avoided by all means.

Unconventional Monetary Policy Measures_______________________________________________________________________________________________
PE 475.116 5
1. BANKING CRISES AND LIQUIDITY
We live in unusual times. The global economy is going through its worst crisis since the great depression, and the euro is at the brink of extinction. Not surprisingly, unconventional policy methods are tried, especially by central banks, and often against dogmatic opposition. The purpose of this paper is to evaluate to what degree non-standard monetary policies have been successful.
While price stability is the main objective of monetary policy, the severe recession following the Lehmann bankruptcy in 2008, and the persistent Euro-crisis since 2009 have shifted the attention towards maintaining financial stability in order to preserve and ensure the proper functioning of the monetary policy transmission channel. However, one should distinguish the two phases: (i) The Global Financial Crisis started in 2007 in the USA and spread to the rest of the world after the Lehman bankruptcy; (ii) the Euro debt crisis started in Greece in 2009 as a Euro-specific problem, which has been magnified by the absence of centralised crisis man-agement and now threatens to spill over into the world economy, too.
In response to the Global Financial Crisis, most governments in the G20 stimulated the econ-omy in 2009 by large deficit-financed fiscal programmes, which have successfully prevented the world economy from falling into a prolonged depression. Countries like the USA, China and Germany, where the stimulus was largest in terms of GDP, did better than southern European Member States, which held back and practiced “fiscal discipline”. But under the shock of Greece’s sovereign debt problems, European authorities have exited the stimulus programs prematurely, draining the economy of effective demand. Economic growth started to slow down again and in the early 2012 a significant number of Euro Area Member States were back in recession. The lack of demand has been particularly bad in Europe, although it has also hampered the recovery in the United States. The crisis now risks spilling back from the Euro Area into the global economy, as adverse feedback loops between sovereign- and bank-funding stresses have exacerbated vulnerabilities in the EU financial sector. The Euro inter-bank market, which had already dried up after the Lehman crash, is still dysfunctional in im-portant segments. Asset prices have collapsed and debtors were downgraded. While counter-party risks have remained high, banks need to strengthen solvency ratios and their balance sheets. In this context, the rigorous attachment to austerity and fiscal consolidation is acer-bating the crisis and this puts more pressure on the ECB to compensate for the failure of European governments to support economic growth.
Some lessons could be learned from Japan, which had already experienced similar problems in the 1990s after the huge financial and property bubble had collapsed and the Bank of Japan was the first modern western central bank that found conventional monetary policy instru-ments were no longer functioning correctly at near zero interest rates. The Bank of Japan then experimented with non-standard monetary policy called “quantitative easing” (QE). Since 2009, all major central banks have resorted to similar measures together with more conventional operations. In essence these non-standard measures consist of asset purchases financed by central bank money with the purpose of preventing a shortage of liquidity in the banking system from turning into a cascade of insolvencies.1 These measures are particularly important in a financial crisis.
1 In the case of Greece, this attempt has failed because Member State governments resisted an early bailout, which
could have stopped the liquidity crisis from turning into a default crisis.

Policy Department A: Economic and Scientific Policy_______________________________________________________________________________________________
6 PE 475.116
Financial crises are as old as the capitalist system. They occur usually after seemingly sus-tained increases in asset prices are suddenly corrected downwards, so that values decline below their purchase prices and buyers’ balance sheets deteriorate to a point where they “are under water”, i.e. their net worth becomes negative. Investors then soon turn into “distressed sellers” as they rush to sell their assets before prices decline further. The demand for liquidity shoots up. At that point a crisis becomes a self-fulfilling panic unless some additional liquidity is pumped into markets and there is a growing risk of collapse of the entire financial system as opposed to risk associated with any one individual entity, group or component of a system.
Banks are most vulnerable to such systemic risk. They typically borrow short in the form of savings and demand deposits and lend at longer maturities. A large part of their asset portfo-lio consists of financial claims that are valued by markets, so that a sudden shock in market valuations can drastically undermine their capital. In a recession, a significant portion of loans may have to be written off. Depositors may then lose confidence in the bank and withdraw money en masse and this forces banks to liquidate assets under duress. The fire sales are likely to spread into other market segments and affect the economy as a whole. Without fur-ther liquidity, bankruptcies surge, economic activity slows down and unemployment increases. The ensuing banking crises almost invariably lead to sharp declines in tax revenue as well as significant increases in government spending (Kindleberger and Aliber, 2005; Reinhart and Rogoff, 2009). All of these phenomena are present in the Euro crisis.
This raises the issue whether governments or central banks should seek to moderate the collapse of asset prices in order to reduce the severity of the crisis. An argument in favour of intervention is that stability is a public good which needs to be provided by governments;2
against intervention speak those who fear that it generates moral hazard because investors count on being bailed out. However, intervention is not an all-or-nothing issue. It is an art, which needs to find the right balance for when and how much to intervene.
It is nowadays generally accepted that bailouts are justified in a systemic crisis. In order to ensure sufficient liquidity in financial markets, central banks have become, over a long proc-ess in history, the “lender of last resort” to banks (Freixas, et al. 2000; Rochet and Vives, 2004; Goodhart, 1999). In fact, the development of the lender of last resort evolved from the practice of markets, and it is indissociable from central banks’ function of being the bank of banks and the monopoly supplier of money as legal tender, i.e. of domestic bank reserves and bank notes. By contrast, it is much less consensual whether central banks should also bail out governments.3 While history teaches that a lender of last resort for banks is necessary for maintaining the stability of the monetary economy, government bailouts by central banks have often ended in high inflation. Thus, one has to be cautious with central bank intervention in the sovereign debt crisis and it was reasonable from a systemic point of view to create the EFSF and the EMS as vehicles for government intervention, provided Member States under-stand the importance of this tool for the survival of the euro – and act accordingly.
All major central banks have fulfilled their function as lender of last resort to the banking system during the Global Financial Crisis. Because demand by banks for liquid and safe assets increased rapidly, while private investors have been less willing to part with them, major central banks have closed the demand gap for riskless and safe assets, entailing a significant
2 The failure by Euro Area Member States of providing this public good is a typical manifestation of a “collective
action problem”, which can only be solved by a central government. This would require a re-interpretation of the notion of sovereignty. See Collignon, 2004.
3 In Europe, there has been a heated debate whether the ECB should buy up distresses government debt (“big bazooka”), because national governments have failed to show the necessary solidarity that could have avoided the deterioration of the sovereign debt crisis.

Unconventional Monetary Policy Measures_______________________________________________________________________________________________
PE 475.116 7
increase in their balance sheets. The Eurosystem’s total assets rose by 160% between Janu-ary 2007 and the end of March 2012. This is less than the Bank of England’s increase of 300%, and the Federal Reserve System’s of 235%, but more than the 20% increase in the balance sheet of the Bank of Japan (European Commission, 2012: 22). Figure 1 shows the evolution of central banks’ balance sheets during the crisis. Total assets of the ECB have in-creased in shock-like pushes after the Lehman bankruptcy, and after the Greek crisis which caused the creation of the EFSF, and again in autumn 2011 when financial markets stated to worry about Spain and Italy. The two major non-conventional policy programmes, namely the Covered Bond Purchasing Programme (CBPP) and the Securities Markets Programme (SMP) have made only small contributions to the increase of the Eurosystem’s balance sheet. In the UK, the Asset Purchase Facility (APF) for government bonds (gilts) has been a major factor in the increase of total assets (Joyce et al. 2011). By contrast, the Fed first used repos for an immediate increase of liquidity after the Lehman collapse, and then gradually shifted to buying asset backed securities and finally, when markets had somewhat calmed down, to Treasuries.
Under conventional circumstances, central banks enlarge or reduce their assets and the supply of base money through exchanging their own liabilities against high-quality securities with longer maturity and less liquidity. Thus, they conduct maturity and liquidity transformation with safe assets. During the crisis, when private banks’ and corporations’ liquidity preference was increasing massively, central banks acted as a “backstop”4 by temporarily exchanging riskier assets with safer central bank money (IMF, 2012:110). The methods, by which this was achieved, vary significantly between different economies, even if the overall intent is similar. The next section summarizes the traditional monetary policy instruments used by the Federal Reserve System, the Bank of England and the European Central Bank. We will then compare the different methods of quantitative easing (QE). Finally, we will look at some empirical evi-dence for the success of these non-standard monetary policies.
4 The definition of ‘backstop’ is: “The act of providing last-resort support or security in a securities offering for the
unsubscribed portion of shares. A company will try and raise capital through an issuance and to guarantee the amount received through the issue, the company will get a back stop from an underwriter or major shareholder to buy any of the unsubscribed shares.” See:http://www.investopedia.com/terms/b/backstop.asp#ixzz1xKmD3J7U.

Policy Department A: Economic and Scientific Policy_______________________________________________________________________________________________
8 PE 475.116
Figure 1.
0
400,000
800,000
1,200,000
1,600,000
2,000,000
2,400,000
2,800,000
3,200,000
I II III IV I II III IV I II III IV I II III IV I II III IV I II2007 2008 2009 2010 2011 2012
Total AssetsSecurity Market ProgramCovered Bond Purchase ProgramLending to EA credit institutions related to MPOsClaims on EA residents in foreign currency
Lehm
an
EF
SF
-I
Italia
nbo
ndpu
rcha
se
ECB
0
500,000
1,000,000
1,500,000
2,000,000
2,500,000
3,000,000
I II III IV I II III IV I II III IV I II III IV I II III IV I II2007 2008 2009 2010 2011 2012
Total assetsUSD Treasury securitiesMortage-backed securitiesLending facility+Repos
Qua
ntita
tive
easi
ng(Q
E2)
Lehm
an
Fed
0
40,000
80,000
120,000
160,000
200,000
240,000
280,000
320,000
360,000
I II III IV I II III IV I II III IV I II III IV I II III IV I II2007 2008 2009 2010 2011 2012
Total Assets AssetPurchasefacilityLong term repos Short termoperations
Bank of England
Lehm
an
Incr
ease
inA
PF
Balance sheets of central banks
Unconventional Monetary Policy Measures_______________________________________________________________________________________________
PE 475.116 9
2. CONVENTIONAL MONETARY POLICY INSTRUMENTSThe task of modern central banking is to preserve price and output stability. For some central banks, like the American Federal Reserve System (Fed), these two objectives have equal importance,5 for others, like the ECB and the Bank of England, they stand in a hierarchical asymmetry, where price stability is the “primary objective” and subject to this condition, monetary policy must support balanced growth and full employment.6
Figure 2 shows in the left graph the evolution of consumer prices in the four major economiesand on the right side inflation in some Member States of the Euro Area. After the Lehmann crisis, inflation fell below zero nearly everywhere. Only in the year 2010 did inflation return to the policy target zones of the respective countries. Traditionally, the inflation target in the US is slightly above the Euro Area. Japanese authorities have repeatedly stressed the importance of avoiding deflation. Within the Euro Area a massive deflation happened in Ireland after the Lehman crash, but also in Portugal and Spain. Interestingly, in Greece and the UK inflation never fell below zero. In fact, the data seem to indicate that the Greek economy responded to the massive collapse of output by increasing prices in order to stabilize nominal income. In the United States, quantitative easing may have contributed to a moderate increase in prices, but similar measures in Europe seem to have had no such impact. Nevertheless, inflation is much higher in the UK than in the other countries, and that should be a constraint for the BoE’s monetary policy. (Goodhart and Ashworth, 2011).Figure 3 shows the equivalent charts for the development of output. The dramatic output losses after the Lehmann crisis are evident in all countries. Amongst the major economies, the US has pulled out fastest from the recession and it has reached 2007-output levels by mid-2010. By contrast, Japan is still below those levels. Interestingly, for the Euro Area one observes a clear distinction between the initial 12 core Euro Area Member States and the 17 members today, which comprise fast growing transformation economies in Eastern Europe. The initial Euro Area of 12 has still not increased its output levels beyond the 2007 level. The devastating consequence from the financial crisis are particular clear in Ireland and Greece, where GDP has fallen by more than 10% and only Germany has pulled away. Italy has also experienced severe output losses and does not find any renewed vigour, while the situations are deteriorating in Portugal and more recently also in Spain. Given these develop-ments it seems clear that unconventional monetary policies must beaming at stimulating growth without jeopardising price stability.7 The Bank of England (2011: Foreword) has formu-lated this explicitly: “Between March 2009 and January 2010, the Bank of England purchased £200 billion of assets with the aim of injecting money into the economy to boost nominal spending and inflation in order to meet the inflation target in the medium term”.
5 The Fed’s mandate is “maximum employment, stable prices, and moderate long term interest rates”. See Federal
Reserve Board, 2008.6 The ECB is bound by the TEU, Art.3(3):“The Union shall establish an internal market. It shall work for the sustain-
able development of Europe based on balanced economic growth and price stability, a highly competitive social market economy, aiming at full employment and social progress, and a high level of protection and improvement of the quality of the environment.” Art. 119(2) TFEU defines the tasks for Economic and Monetary Union: “...these activities shall include a single currency, the euro, and the definition and conduct of a single monetary policy and exchange-rate policy the primary objective of both of which shall be to maintain price stability and, without preju-dice to this objective, to support the general economic policies in the Union, in accordance with the principle of an open market economy with free competition.” Similarly, the Bank of England’s brief is “The Bank’s monetary pol-icy objective is to deliver price stability – low inflation – and, subject to that, to support the Government’s eco-nomic objectives including those for growth and employment.” (http://www.bankofengland.co.uk/monetarypolicy/Pages/framework/framework.aspx). The difference between the ECB and the BoE is that the ECB has goal independence, meaning it decides itself what is price stability, while in the UK this is done by the government.
7 In fact, the Bank of Japan is the only central bank that introduced quantitative easing with the objective of stop-ping a fall in the price level. See Reith, 2009.

Policy Department A: Economic and Scientific Policy_______________________________________________________________________________________________
10 PE 475.116
Figure 2.
-3
-2
-1
0
1
2
3
4
5
6
I II III IV I II III IV I II III IV I II III IV I II III IV I II2007 2008 2009 2010 2011 2012
Euro area JAPANUnited States United Kingdom
Lehman EFSF
LTROsECB
QE1US
QE2US
CPI Inflation: major economies
-8
-6
-4
-2
0
2
4
6
I II III IV I II III IV I II III IV I II III IV I II III IV I II2007 2008 2009 2010 2011 2012
Euro area GERMANY FRANCEITALY SPAIN PORTUGALGREECE IRELAND
Lehman EFSF LTROs
CPI Inflation: Euro Area
Prices
Figure 3.
The conventional monetary policy instrument to achieve these goals is the level of short-term interest rates (ECB, 2011). The rather lengthy transmission process of monetary policy is controlled by the operational framework and a monetary policy strategy from which the inter-mediary operational targets are derived. In principle, monetary authorities can target money market interest rates or banks’ reserves with the central bank and the two are technically equivalent (Poole, 1970). However, when the short-term policy rate is at or near zero, the conventional means of effecting monetary ease (lowering the target for the policy rate) is no longer feasible. As Bernanke and Reinhart (2004) showed, there are three strategies for stimulating the economy at an unchanged level of the policy rate: These involve (i) providing assurance to investors that short rates will be kept lower in the future than they
0.90
0.92
0.94
0.96
0.98
1.00
1.02
1.04
I II III IV I II III IV I II III IV I II III IV I II III IV I2007 2008 2009 2010 2011
GDP_EA GDP_JP GDP_USGDP_UK GDP_EA12
Real GDP levels: major economies2007Q1 = 1
Lehman
0.88
0.90
0.92
0.94
0.96
0.98
1.00
1.02
1.04
I II III IV I II III IV I II III IV I II III IV I II III IV I2007 2008 2009 2010 2011
GDP_EA12 GDP_DE GDP_FRGDP_IT GDP_ES GDP_PTGDP_GR GDP_IE
Real GDP levels: Euro Area2007Q1 = 1
Lehman EFSF
Italia
nbo
ndpu
rcha
se
Output

Unconventional Monetary Policy Measures_______________________________________________________________________________________________
PE 475.116 11
currently expect; (ii) changing the relative supplies of securities in the market-place by alter-ing the composition of the central bank's balance sheet, and (iii) increasing the size of the central bank's balance sheet beyond the level needed to set the short-term policy rate at zero ("quantitative easing").
In order to be able to transmit its policies, the central bank must ensure an orderly function-ing of the money market. For analytic purposes we may distinguish between the interbank money market, where banks shift horizontally temporary surpluses or deficits of central bank reserves among each other and the vertical dimension of the money market whereby the banking system as a whole is supplied with base money (Bofinger, 2001:324). Monetary base (MB or M0), also called central bank money, is provided by the central bank, which provides liquidity in the form of currency (bank notes and coins) and reserves held by counterparties (banks) and the recourse by banks to central bank deposit facilities. Reserves may be broken down into required (“minimum”) reserves and excess reserves, which commercial banks hold voluntarily due to high liquidity preference.
If the money market functions correctly, the central bank steers short-term interest rates in the economy by signalling its monetary policy stance through its decisions on key interest rates and by managing the liquidity situation in the money market (ECB, 2011: 93). The main key policy rates to do so are the overnight money market rates: in the Euro Area this is the EONIA (Euro Over-Night Index Average), which is a weighted average of interest rates on unsecured overnight lending transactions as reported by a panel of contributing banks. The EONIA reflects the rate at which commercial banks can (vertically) borrow unsecured from the ECB. In the UK, the equivalent is SONIA (Sterling Over-Night Inter-bank Average). In the United States the unsecured overnight rate is the Fed Fund Rate, which is set by the FOMC as the intermediary target for implementing U.S. monetary policies. Closely related to these policy rates are the EURIBOR or LIBOR; they are the rates at which prime banks are willing to (horizontally) lend unsecured to other prime banks in the interbank markets in the Euro Area, the UK and the USA. The spread between unsecured and secured rates is a widely used meas-ure of the malfunctioning of the interbank market.
In a normal environment with a functioning interbank market, a monetary policy signal of increasing or reducing short term interest rates leads to changes in expectation and portfolio shifting effects, which will affect interest rates for longer maturities and therefore lending and borrowing in the rest of the economy. This is called the signalling and the portfolio balance channels of monetary policy transmission. In normal times, the inability of a bank to borrow funds through the market indicates that it is failing or insolvent, but that remains an isolated case. However, in a crisis situation with great uncertainty, banks lose mutual trust and the interbank market dries out. Even solvent institutions may be unable to borrow. The signalling and portfolio channels may then break down and non-conventional measures need to be taken. The literature identifies three sources causing such problems in the interbank market, all arising from asymmetric information (Freixas, et al. 2000). First, because the interbank market has access only to incomplete information, doubts may arise about the solvency of a bank that in fact is sound (Berger, Davies, and Flannery, 1998). Second, the interbank market may become more cautious in times of crisis (Flannery, 1996). Third, liquidity may dry up in the interbank market because each bank refuses to lend if it cannot be confident that it will be able to borrow from other banks to address its own possible liquidity shortage. These expecta-tions become self-fulfilling if markets are left to themselves. (Freixas, Parigi, and Rochet, 2000).

Policy Department A: Economic and Scientific Policy_______________________________________________________________________________________________
12 PE 475.116
A lender of last resort can overcome the information asymmetry, if it is known to be an insti-tution with an impeccable reputation. Furthermore, if the central bank as lender of last resort also issues the legal tender that extinguishes all debt, borrowing from the central bank guar-antees solvent banks to remain liquid. For these reasons, quantitative easing can become an indispensable monetary policy instrument in a financial crisis. The literature has identified a number of channels through which quantitative easing may affect the economy (Joyce et al. 2011):
The policy signalling effect helps to ensure that inflation expectations remains well anchored to the central bank’s target.
The portfolio balance effect pushes up the prices of assets bought by the central bank and also prices of other assets. Higher asset prices mean lower yields and low borrowing costs for firms and households, which may stimulate spending by increas-ing the net wealth of asset holders.
Liquidity premia effects occur when central bank asset purchases encourage trading and lower the premia for illiquidity.
Confidence effects follow from higher asset prices and reassurance of liquidity in the banking system. They could encourage banks to extend more loans. This channel has been particularly important in the Euro Area, where governments have continu-ously undermined the confidence in their commitment to preserve the euro.
Bank lending effects result from the provision of new reserves to banks when the central bank purchases assets from them. The high level of liquid assets could then encourage banks to increase their lending.
Of these different transmission channels, the portfolio balance channel is probably the most important. Before assessing the evidence for the impact of quantitative easing through this channel, we will now review the context and measures of unconventional monetary policies.

Unconventional Monetary Policy Measures_______________________________________________________________________________________________
PE 475.116 13
3. NON-STANDARD MEASURES OF MONETARY POLICY
The Global Financial Crisis had its origin in the US subprime market, and then spilled over into the money market, from where it spread around the globe. It started with financial tensions in the interbank market in August 2007 after the bursting of asset price bubbles in the housing market in the US and Europe. These tensions intensified with the failure of Northern Rock in the United Kingdom in the autumn of 2007 and the collapse of Bear Sterns in the USAin March 2008. These insolvency risks lead to the drying up of money markets and the global economic downturn, which took dramatic proportions after the Lehman crash. Thus, dysfunctions in the interbank market were a clear indicator for the intensity of the crisis and one can time the start of the crisis in the sudden increases of the spread between short term monetary policy rates and unsecured short term interbank rates, such as the EURIBOR-EONIA spread, which jumped to historically high levels after August 2007 and in September 2008 (Lehman). At this point, banks’ demand for liquidity became highly vola-tile; their preference for long term liquidity increased, and severe impairments in the redistri-bution of funds in the interbank market occurred (Cecioni et al. 2011). Anti-crisis policies quickly provided central bank liquidity in order to restore the smooth functioning of the inter-bank market and all major central banks followed this policy by applying “unconven-tional” measures.
The precise ways of implementing quantitative easing differed from country to country due to the specific interactions between the banking system and the monetary authority, but in all cases quantitative easing increased the Central Bank’s balance sheet and base money signifi-cantly. Nevertheless, quantitative easing may differ with respect to main policy targets. For example, the Bank of Japan switched from short term interest rates to targeting total reserves of commercial banks held with the Bank, while the Fed is targeting short term interest rates and provides the necessary liquidity. In Japan and the UK, quantitative easing consists mainly in outright purchases of government securities, while the Fed and the ECB follow a broader approach.
In the early phase of the banking crisis, the impact of policy interventions on monetary base was sterilized in order to keep overnight rates in line with policy targets. But after the Lehman bankruptcy, central bank balance sheets were increased and excess liquidity flooded into the market with interest rates falling close to zero. In the second half of 2009, tensions had not fully disappeared, but short term spreads clearly came under control and stabilized – more so in the USA than in Europe. See Figure 4. In the late 2009, the UK interbank market functioned with spreads fairly similar to its American counterpart, while in the Euro Area it still carried risk premia of 20-25 base points. Although Euro interbank risk was much more volatile than in the UK and US markets, the Euro-US gap narrowed for a while after the creation of the EFSF in May 2010. However, the European banking crisis fully escalated again in the sec-ond half of 2011, when the sovereign debt crisis spilled over into Spain and Italy, and seems to have structurally increased the risk in the UK interbank market too. These tensions only subsided when the ECB conducted two large long term refinance operations (LTROs) in De-cember 2011 and February 2012 amounting to a trillion euros with a maturity of 36 months.

Policy Department A: Economic and Scientific Policy_______________________________________________________________________________________________
14 PE 475.116
Figure 4
-1
0
1
2
3
4
I II III IV I II III IV I II III IV I II III IV I II III IV I II
2007 2008 2009 2010 2011 2012
SPREAD 3M EUROSPREA 3M UKSPREAD 3M FED
Spread between unsecured interbank rates and overnight indexed swaps
Lehman
EFSF
Italia
nbo
ndpu
rcha
ses
The Interbank Crisis
LTR
Os
Papandreou Prime minister
The apparent stability in the interbank market in 2010 that could be assumed from Figure 4stands, however, in a dramatic contrast with the crisis in the sovereign debt markets of the Euro Area, especially in the south. When the newly elected Papandreou government in Greece revealed that its predecessor had falsified records and borrowed more than it was allowed under the rules of the Stability and Growth Pact, this triggered an idiosyncratic shock that undermined confidence in the institutional framework of the Euro Area as a whole and under-mined trust in the sustainability of public debt in Greece, Ireland, Portugal and latently also in Spain and Italy. This second phase of the crisis set Europe apart from the rest of the world.
Coupled with the severe recession and the collapse of property bubbles in Ireland and Spain, the perception of rising default risks for a number of Southern Euro Area Member States started to push up sovereign bond yields for these countries. See Figure 5. The situation was further aggravated by the unwillingness of the German government to contribute to the stabi-lization of southern bond and asset prices and irresponsible communication strategies (see Collignon, Esposito and Lierse, 2011). Interestingly, UK bond yields were not affected by these developments. In an influential article, De Grauwe (2011) has argued that the different per-formance of some (though not all) sovereign bond yields is due to the fact, that Member States of the Euro Area effectively issue debt in a foreign currency because they cease to have control over the currency in which their debt is issued and can no longer force the central bank to buy their debt. However, in this case, the issue is not whether the euro is domestic or

Unconventional Monetary Policy Measures_______________________________________________________________________________________________
PE 475.116 15
foreign currency, but simply that the central bank is independent and money supply therefore exogenous for policy makers. In other words, De Grauwe challenges the idea that the ECB determines the hard domestic budget constraint in the Euro Area. However, the correct inter-pretation of the observed facts is that the lack of political commitment by Member States to ensure financial stability has pushed up the liquidity premium and default risk in the south. The dogmatic attachment to the “no-bail-out” clause when sovereign debt is clearly “too big to fail” has undermined confidence in the euro to a degree where the conventional monetary transmission channels no longer work efficiently.
Because sovereign debt papers are an important part of commercial banks’ asset portfolios, the rapid deterioration of southern government bond prices has undermined the net worth of banks and generated a renewed crisis in the interbank market from the early autumn 2011 on. As Figure 4 shows, this crisis of confidence was strongest in the Euro Area, but it spilled over into the UK and even the USA. In this second phase, non-standard policy measures were implemented by the ECB to ensure liquidity in dysfunctional market segments and to restore the proper functioning of the monetary policy transmission mechanism.
Figure 5.
-4
0
4
8
12
16
20
24
28
32
36
I II III IV I II III IV I II III IV I II III IV I II III IV I II III
2007 2008 2009 2010 2011 2012
Spain France GreeceIreland Italy PortugalUK
Lehman
10-year government bond spreads against German Bund
Papandreou Prime minister
EFSF
Italia
nbo
ndpu
rcha
ses LT
RO
s
Having insufficient information for assessing their competitors’ liquidity needs and being con-cerned of counterparty credit risks, banks in Europe and in the United States started to hoard large amounts of liquidity and refrained from lending in the interbank market. Uncertain of their own liquidity needs, banks feared that liquidity problems could turn into default, if not be solved rapidly. The portfolio channel was blocked and the nature of stochastic shocks required that monetary policy would focus on reserve holdings rather than interest rates. By the early 2012, the risk of disorderly deleveraging leading to a credit crunch in the banking sector and

Policy Department A: Economic and Scientific Policy_______________________________________________________________________________________________
16 PE 475.116
in Euro Area had become substantial (European Commission, 2012). In the United States and the UK, where capital markets play an important role as a source of funding, the credit crunch is more concentrated on small and medium sized enterprises (IMF 2012; Huang and Stephens, 2011). In the first phase after the Lehman bankruptcy, monetary policy was slashing interest rates world-wide. However, with nominal interest rates close to zero, this policy instrument became inefficient. In America and Europe, the non-conventional measures were seeking to avoid a credit crunch and restore the monetary transmission channels, while quantitative easing in Japan was explicitly aiming at overcoming deflation. The Bank of England (2011) has estimated that its asset purchase program may have had roughly an equivalent impact on inflation as a cut in Bank Rate of between 150 to 300 basis points and suggests a peak effect on the level of real GDP of between 1½% and 2% and a peak effect on annual CPI inflation of between ¾ and 1½ percentage points.
We will now look at the unconventional measure taken by the Federal Reserve, the Bank of England and the ECB.8
USA
The pre-Lehman phase of the crisis featured significantly higher volatility of banks’ liquidity demand, heightened preference for long-term liquidity and severe impairments in the redistri-bution of funds in the interbank market. The unconventional measures adopted by the Fed and the ECB aimed at preventing disorders in money markets that were hampering the mone-tary transmission mechanism, but both central banks sterilized the impact of their actions on the monetary base in order to keep overnight interest rates in line with their targets. After September 2008 the financial crisis became more severe and spread to the shadow banking system. In the US it quickly became clear that the provision of funds and high-quality securi-ties to depository institutions and primary dealers would not be sufficient to avert a collapse of the financial system. The liquidity in critical nonbank markets evaporated and financial spreads reached unprecedented levels. To address these issues the Fed enhanced the non-standard measures adopted before the Lehman bankruptcy and implemented a series of new unconventional tools.
To understand the crucial role of this new set of measures it is useful to start with a stylized description of the functioning of the US financial system on the eve of the financial crisis. Under a standard banking system, banks generate loans using deposits or longer-term liabili-ties and hold them to maturity in their balance sheets. Given their crucial role in the economy, these institutions have direct access to central bank liquidity, enjoy government guarantees, but are also subject to strict regulation that limits their balance-sheet exposure to credit and liquidity risks. In the years before the outbreak of the financial crisis, the credit provision function was progressively moved into an unregulated shadow banking system where financial institutions made large profits by increasing the leverage of their business well above the limits permitted in the traditional system. This alternative banking system is populated by a very heterogeneous group of financial institutions that are strictly interconnected and that conduct maturity, credit and liquidity transformation through a wide range of secured funding techniques such as asset-backed commercial papers (ABCP), asset-backed securities (ABS), collateralized debt obligations (CDO) and repos.
8 For the United States and the Euro Area, this section draws largely on Cecioni et al. 2011, for the UK on Joyce et
al. 2011. We thank Banca d’Italia for valuable advice in updating the following tables, which was done by Yuming Cui, Scuola Superiore Sant’Anna, Pisa and Centro Europa Ricerche, Roma.

Unconventional Monetary Policy Measures_______________________________________________________________________________________________
PE 475.116 17
The fundamental weakness of this system, was that, contrary to Europe, it had neither deposit guarantees nor direct access to central bank liquidity. Its exposure to the same type of bank runs that had devastated the traditional banking system during the Great Depression, became apparent when in September 2008 the net asset value of some important money market funds fell below the target value of one dollar per share and these funds received massive requests for redemptions. The strict interconnections among the different segments of the shadow banking system accelerated the transmission of the crisis and quickly affected the prices and the liquidity of other important instruments of this market (ABCP, ABS, CDO, etc). The existence of liquidity provision agreements between the institutions of the traditional and the shadow banking system suddenly also exposed the former to a strong liquidity shortage. The entire financial system of the US came very close to collapse. With the unconventional measures adopted since mid-September 2008 the Fed has greatly extended the provision of temporary liquidity to the most important part of the shadow banking system. This was done (mainly) through three programmes: the ABCP Money Market Fund Liquidity Facility (AMLF), the Commercial Paper Funding Facility (CPFF) and the Term Asset-Backed Securities Loan Facility (TALF) (see Table 1).
Moreover, to improve conditions in private credit markets, the Fed also announced the inten-tion to purchase up to USD 300 billion of long-term Treasury securities (the so-called QE1).Faced with the slow recovery of output and employment, on November 2010 the Fed an-nounced a further expansion of its balance sheet by purchasing a further USD 600 billion of long-term Treasury securities (the QE2). In September 2011, the Fed also announced that it would sell USD 400 billion of shorter-term Treasury securities to buy longer-term Treasury securities (Operation TWIST).
Most of these large-scale asset purchase programs were adopted after the Fed had lowered its official rate to a range between 0 and 0.25 per cent in 2008. Since then, the Fed has been providing forward guidance about the likely path of the Federal funds rate.

Policy Department A: Economic and Scientific Policy___________________________________________________________________________________________________________________________________________________
PE 475.116 18
Table 1: Unconventional measures adopted by the Federal Reserve (August 2007- May 2012)1 2 3 4 5 6 7 8 9 10 11 12 13 14 15 16 17 18
Term Discount Window Program (TDWP)
Term AuctionFacility (TAF)
Recipro-cal
Currency Agree-ments (RCA)
Term Securi-
ties Lending Facility (TSLF)
Single-Tranche
OMO pro-
gramme
Primary Dealers Credit Facility (PDCF)
ABCP Money Market Fund
Liquidity Facility (AMLF)
Commer-cial
Paper Funding Facility (CPFF)
Term Asset-Backed Securi-
ties Loan Facility (TALF)
Purchase of
Agency Debt and Agency
MBS
Term Asset-Backed
Securities Loan
Facility (TALF)
Purchase of long-
term Treasur-
ies
Term Asset-Backed
Securities Loan
Facility (TALF)
Currency swap
arrange-ments
Tempo-rary US dollar
liquidity swap
facilities
Tempo-rary US dollar
liquidity swap
arrange-ment with
BOJ
Purchaseof longer-
term Treasury securities
Maturity extension program
(operation twist)
Announcement date
Aug. 17, 2007
Dec. 12 2007
Dec. 12, 2007
Mar 11, 2008
Mar 11, 2008
Mar 16, 2008
Sep. 19, 2008
Oct. 7, 2008
Nov. 25, 2008
Nov. 25, 2008
Mar. 3, 2009
Mar. 18, 2009
Mar. 19, 2009
Apr. 6, 2009
May. 9, 2010
May. 10, 2010
Nov. 3, 2010
Sep. 21, 2011
Start date Aug. 17, 2007
Dec. 17, 2007
- Mar 17, 2008
Mar 27, 2008
Mar 17, 2008
Sep. 22, 2008
Oct. 27, 2008
Mar. 17, 2009
Jan. 5, 2009
Mar. 17,
2009
Mar. 25, 2009
Apr., 2009 Oct. 30, 2009
Jan., 2011 Jan., 2011 - -
End date
Mar 18,2010(2)
Mar 8, 2010
- Feb 1, 2010
Dec 30, 2008
Feb 1, 2010
Feb 1, 2010
Feb 1, 2010
Jun. 30, 2010(4)
Jun. 30, 2010
Dec., 2009 or longer
Jun. 30, 2011(5)
- - - Jun. 30, 2011
Jun., 2012
Participants Depository institu-tions
Depository institu-tions
Foreign central banks
Primary dealers
Primary dealers
Primary Dealers
Depository institu-tions, bank
holding companies (domestic
and interna-tional)
Eligible CP issures
All US persons
that owns eligible
collateral
- - All US persons
that owns eligible
collateral
Fed, BOE, ECB, BOJ and SNB
BOC, BOE, ECB, Fed and SNB
Fed and BOJ
- -
What are they
borrowing?
Funds Funds US dollars US Treasuries
Funds Funds Funds Funds Funds - Funds - Funds - - - Funds Funds
Colla-teral Full range of Discount Window Collateral
Full range of
Discount Window
Collateral
Central banks pledge foreign
currency and lend against
collateral in their jurisdic-
tions
US Treasuries agencies, agencies MBS and
all invest-ment
grade debt securities
US Treasuries, agencies, agencies MBS, but typically agencies
MBS
Full range of tri-
party repo system
collateral
First-tier ABCP
Newly-issued 3-month
unsecured and asset-backed CP
from eligible US
issuers,
Recently originated US dollar-denomi-nated
AAA, ABS, AMBS and
legacy CMBS
- - Collateral Expended to include
four additional categories
of ABS (expanded again on May 1, 2009
- - - - -
Terms of the loan
up to 90 days
28 or 84 days
up to 3-month
28 days 28 days Overnight ABCP maturity
date (max 270-day)
3 months 3 or 5 years
Outright purchases
- Outright purchases
- - - - Outright purchases
Sell $400 bn of shorter-
term Treasury securities to buy longer-
term Treasury securities.
Frequency Standing facility
Every other
week, or as
necessary (auction)
- Every four weeks
(auction)
Every week
(auction)
Standing Facility
Standing facility
Standing facility
Twice a month,
alternating ABS and CMBS
- - - - Extended on Dec. 21, 2010
- - - Extended on Nov. 2, 2011;
Dec. 13, 2011; Jan. 25, 2012; Mar., 13,
2012; Apr., 25, 2012
Average impact on
Fed balance sheet(1)
$29 bn(3) $206 bn $90 bn $80 bn approx $80 bn
$19 bn $21 bn $147 bn $36 bn $107 bn (Agency
debt), $575 bn (Agency
MBS)
$471 bn(6) - - $767 bn -
Max impact on Fed balance sheet(1)
$112 bn(3) $493 bn $583 bn $234 bn $80 bn $148 bn $146 bn $350 bn $48 bn $169 bn (Agency debt),
$1074 bn (Agency MBS)
$1182 bn(6) £30 bn, €80 bn, ¥10 tn and CHF 40
bn
- - $400 bn
Objective Provide liquidity to depository
institu-tions
Provide liquidity to depository
institu-tions
Provide liquidity in US dollars to foreign
banks
Provide Treasuries to primary
dealers
Provide liquidity to primary dealers
Provide liquidity to primary dealers
Restore liquidity in the ABCP market
Enhance the
liquidity of the
commer-cial paper market
Supportlending to
small businesses
and consumers
Reduce costs and increase
availability of credit
for housing
Support lending to
small businesses
and consumers
Reduce term
premia in the long-
term interest rates
Support lending to
small businesses
and consumers
Provision of foreign
currency liquidity by the Federal Reserve to
U.S. financial institutions
Improve liquidity
conditions in U.S. dollar
funding markets
Improve liquidity
conditions in U.S. dollar
funding markets
Promote a stronger pace of
economic recovery and help ensure that
inflation
Put downward pressure on longer-term
interest rates, provide
additional stimulus to support the economic recovery

Unconventional Monetary Policy Measures___________________________________________________________________________________________________________________________________________________
PE 475.116 19
Sources: Forms of Federal Reserve Lending, Federal Reserve New York; Credit and Liquidity Programs and the Balance Sheet, Board of Governors; Federal Reserve statistical re-lease, H.4.1, Factors affecting reserve balances,
Tables 1-8, Board of Governors. Notes: (1) Descriptive statistics computed on weekly averages over the life of the programme. (2) On February 18, 2010, the Federal Reserve an-nounced that the typical maximum maturity on primary credit would be shortened to overnight, effective March 18, 2010. (3) Statistics computed on total primary credit. (4) On that date the facility was closed for new loan extensions against newly issued commercial mortgage-backed securities with maturities of 3 years or less. (6) Purchases of US Treas-ury securities since March 25, 2009. Starting from August 11, 2010 it includes Treasuries purchases from the reinvestment of principal payments on Agency debt and Agency MBS. On September, 21th, 2011 the FOMC has announced the intention to reinvest principal payments from its holdings of agency debt and agency mortgage-backed securities in agency mortgage-backed securities.

Policy Department A: Economic and Scientific Policy________________________________________________________________________________________________
PE 475.116 20
Bank of England9
Because the Bank of England’s asset purchase programme has attached particular importance to the portfolio balance channel, purchases have been targeted towards long-term assets held by non-bank financial institutions, like insurers and pension funds. The Bank of England Asset Purchase Facility (APF) was announced on 19 January 2009. Initially the APF bought private sector assets funded by the issuance of Treasury bills and the cash management operations of the Debt Management Office. The APF became a vehicle for monetary policy when, in March 2009, the Monetary Policy Committee decided to purchase assets financed by the creation of central bank money.
Before asset purchases began, the main holders of gilts were UK non-bank financial institu-tions and overseas investors. Gilts only represented a modest part of UK non-bank financial institutions’ overall portfolios, suggesting they might be prepared to reinvest some of the money from gilt sales in other assets. At the end of 2008, UK banks held only about 4% of the total stock of gilts. During the period that the Bank was conducting asset purchases, the bank-ing sector increased its holdings of gilts, suggesting that the main impact was to reduce the gilt holdings of the non-bank private sector relative to what would otherwise have happened.
While the portfolio rebalancing effect was the privileged transmission channel in the UK, the MPC did deliberately abstain from signalling future intentions about the likely path of future policy rates and the liquidity channel also was not expected to be important.10
Table 2: Unconventional measures adopted by the Bank of England (January 2009 - June 2012)Date Policies announced by BOE
30/01/09
Bank of England (BOE) w as authorised by the governemnt to ceate a new fund, the Asset Purchase Facility (APF) on 19 Jan., 2009. The APF, £50 billion, would be financed by the issue of Treasury bills and the DMO's cash management operations. The objestive to APF w as to increasing the availiability of corporate credit in order to support the BOE's responsiblities for financial stability and Monetary stability in the UK. The follow ing sterling assets will be eligible for purchase by the APF: paper issued under the Credit Guanrantee Scheme (CGS), corporate bonds, commercial paper, syndicated loans and asset backed securities created in viable securitisation structures.
06/02/09BOE w as authorised to purchase up to £50 billion of high-quality private sector assets under the Facility. The following sterling assets are initially eligible for purchase: commercial paper, corporate bonds, paper issued under the Credit Guarantee Scheme (CGS), syndicated loans and asset-backed securities created in viable securitisation structures. The broad aim is to help improve financing conditions for companies.
05/03/09The range of assets eligible for purchase was expanded. Monetary Policy Committee (MPC) w as authorised to use trhe APF to purchased UK government debt on the secondary marjket as well as the full range of private sector assets. The scale of purchased to be increased to up to £150 billion. Among that, up to £50 billion should be used to purchase privatre sector asset because of the importance of supporting the flow of corporate credit.
11/03/09 First purchases of gilts begin.
25/03/09 First purchases of corporate bond begin.
03/08/09 Secured commercial paper facility launched.
06/08/09Ceiling of APF w as lifted from £150 billion to £175 billion and the buying range will be extended to gilts with a residual maturity greater than three years. MPC w ould determine the scale of its purchases each month. In addition the BOE announced a gilt lending programme, which allow s counterparties to borrow gilts from the APF’s portfolio via the DMO in return for a fee and alternative gilts as collateral.
05/11/09 Ceiling of APF w as lifted from £175 billion to £200 billion. MPC w ould determine the scale of its purchases each month.
08/01/10 First sales of corporate bonds
04/02/10The MPC announces that QE asset purchases will be maintained at £200 billion. The Chancellor authorises the Bank to continue to transact in private sector assets, with further purchases financed by issuance of Treasury bills.
06/10/11 Ceiling of APF w as lifted from £200 billion to £275 billion. Given evidence of continued impariment in the flow of credit to some part of the real economy, notably small and medium-sized businesses, the Treasury was explring further policy options which should be complement the MPC's asset purchases.
09/02/12Ceiling of APF financed by the issuance of central bank reserves was lifted from £275 billion to £325 billion. Eligible assets for purchase continue to include gilts and eligible private sector asset, as set ou in precious policy anouncement.
Source: Bank of England
Bank of England
9 This section draws on Joyce et al. 2011.10 This is also evidence that de Grauwe’s above mentioned argument about “money one cannot produce at home” is
not salient.

Unconventional Monetary Policy Measures________________________________________________________________________________________________
PE 475.116 21
ECB
The ECB has also implemented exceptional measures to fight against the crisis. However, in the early phase, it was able, unlike the Fed, to counteract shocks to the distribution of re-serves in the banking system within its standard operational framework, because its opera-tional procedures maintain a large permanent structural liquidity deficit for the banking system and, most importantly, because all depository institutions of the Euro Area have direct access to central bank’s liquidity.
The ECB has accommodated banks’ heightened preference for long-term funding by increasing the frequency and the liquidity allotted in its long-term refinancing operations. To counteract the excessive volatility of the overnight rate (EONIA), it front-loaded banks’ preference for early fulfilment of the reserve requirements by providing funds to banks in the earlier part of the maintenance period. Also, the larger demand for US dollars was sterilized by greater re-course to fine-tuning operations (Table 3, column 1) and through auctions of US dollar liquid-ity, available from the Fed Reciprocal Currency Agreements (Table 3, column 2). After the Lehman collapse in October 2008, the ECB decided to conduct all its refinancing operations with fixed rate tenders and full allotment (FRFA) (see Table 3, column 5). Those procedures made the provision of liquidity to the banks unlimited so that the availability of collateral be-came the only constraint. To guarantee full access to the refinancing operations and to prevent fire sales of assets of lower quality, which would have accelerated the process of further delev-eraging in the banks’ balance sheets, the ECB also decided to enlarge the set of assets ac-cepted as eligible collateral in its refinancing operations. (See Table 4).
The length of the refinancing operations was further increased in May 2009, when the ECB announced three 1-year FRFA refinancing operations (Table 3; column 6). It also started to carry out a Covered Bonds Purchase Programme (CBPP; Table 3, column 7), implying outright purchases, conducted in both the primary and the secondary market, of €60 billion of covered bonds issued by banks in the Euro Area, to be completed by June 2010. The aim of the CBPP was to revive this market segment, which had been particularly hard hit by the financial turbu-lence and had been one of the major sources of funds for banks before the crisis.
When the sovereign debt crisis started to seriously impair some sections of the Euro bond market and parallel to the new EFSM set up by governments, the ECB decided to implement a program of purchasing Euro Area private and public securities (Securities Markets Programme, SMP; Table 3, column 8). The objective was to support an appropriate functioning of the monetary transmission mechanism. Relative to total central bank assets, the volumes of the CBPP and SMP have remained very limited, as Figure 1 shows. Since August 2011 more sub-stantial interventions were performed (Table 3, column 14), although they did not affect the monetary stance, since the ECB has been sterilizing its impact on the amount of outstanding liquidity through weekly fixed-term deposit operations.

Policy Department A: Economic and Scientific Policy_____________________________________________________________________________________________________________________________________________
PE 475.116 22
Table 3: Unconventional measures adopted by the ECB (August 2007-June 2012)1 2 3 4 5 6 7 8 9
Fine-tuning operations Reciprocal currency agreements
Long-term 6-month operations
Special term refinancing operations
Fixed-rate and full allotment on refinancing operations
Long-term 12- month operations
Covered Bond Pruchase
Programme (CBPP)
Securities Markests
Programme (SMP)
Main refinancing operations
(MROs)
Announcement date Quick tender Dec. 12, 2007 Mar 27, 2008 Sep. 29, 2008 Oct. 9-15, 2008 May 7, 2009 May 7, 2009 May 9, 2010 Mar. 3, 2011
Start date Facility already existing the ECB operational framwork Dec. 17, 2007 Mar 28, 2008 Sep. 30, 2008 Oct. 15, 2008 Jun. 24, 2009 Jun. 4, 2009 May 14, 2010 Api. 13, 2011
End date - Ongoing May 12, 2010(3) (4) Ongoing Ongoing Dec. 16, 2009(3) Jun. 30, 2010 Ongoing as long as
necessary
ParticipantsAll banks that have access
to Eurosystem credit operations
All banks that have access to Eurosystem credit
operationsAll banks that have access to Eurosystem credit operations
All banks that have access to Eurosystem credit operations
All banks that have access to Eurosystem credit operations
All banks that have access
to Eurosystem credit
operations
All banks that have access to
Eurosystem credit operations and
euro-area based counterparties used by the
Eurosystem of its euro-denominated
portfolios
All banks that have access to
Eurosystem credit operations and
euro-area based counterparties used by the Eurosystem
of its euro-denominated
portfolios
-
What are they borrowing? Funds Funds in US dollars, Swiss frances and pound sterlings Funds Funds Funds Funds - - Funds
CollateralCollateral eligible for Eurosystem credit
operations
Collateral eligible for Eurosystem credit
operations
Collateral eligible forEurosystem credit operations
Collateral eligible for Eurosystem credit operations
Collateral eligible for Eurosystem credit operations (expanded as of decision of
Oct. 15, 2008
Collateral eligible for
Eurosystem credit
operation (expanded as of decision of Oct. 15, 2008
- -
Collateral eligible for
Eurosystem credit
operations
Terms of the loan From onvernight to 5 days 7, 28, 35 and 84 days 6 monthsSame as the length of the
maintenance period for the banks' reserve requirement
1 week, 1, 3, 6 and 12 months 1 yearOutright purchases in the primary and secondary market
Outright purchases in the primary and secondary market
-
Frequency of the programme As necessary (auction) In connection with the US $ TAF at the Federal Reserve As necessary (auction) Once at the beginning of each
maintenance period -
3 auctions in 2009 (June, September, December)
- -
Average impact on the Eurosystem's consolidated
balance sheet(1)- euro 62 bn(2) euro 66 bn(4) euro 58 bn - euro 417 bn euro 31 bn euro 71 bn
Max impact on the Eurosystem's consolidated balance sheet(1) - euro 249 bn(2) euro 155 bn(4) euro 135 bn - euro 614 bn euro 61 bn euro 157 bn
Objective Assure orderly conditions in the euro money market
Assure liquidity in foreign currencies to euro-area
banks
Support the normalisation of the euro money market
Improve the overall liquidity position of the euro-area banking system
Assure the provision of liquidity to all euro-area banks
Encourage the provision of
credit by nanks to the private sector
Restore the covered bonds
market segment
Address the malfunctioning of securities markets
and restore the monetary
transmission mechanism
Improve the overall liquidity
position of the euro-area banking system
PE 475.116 23
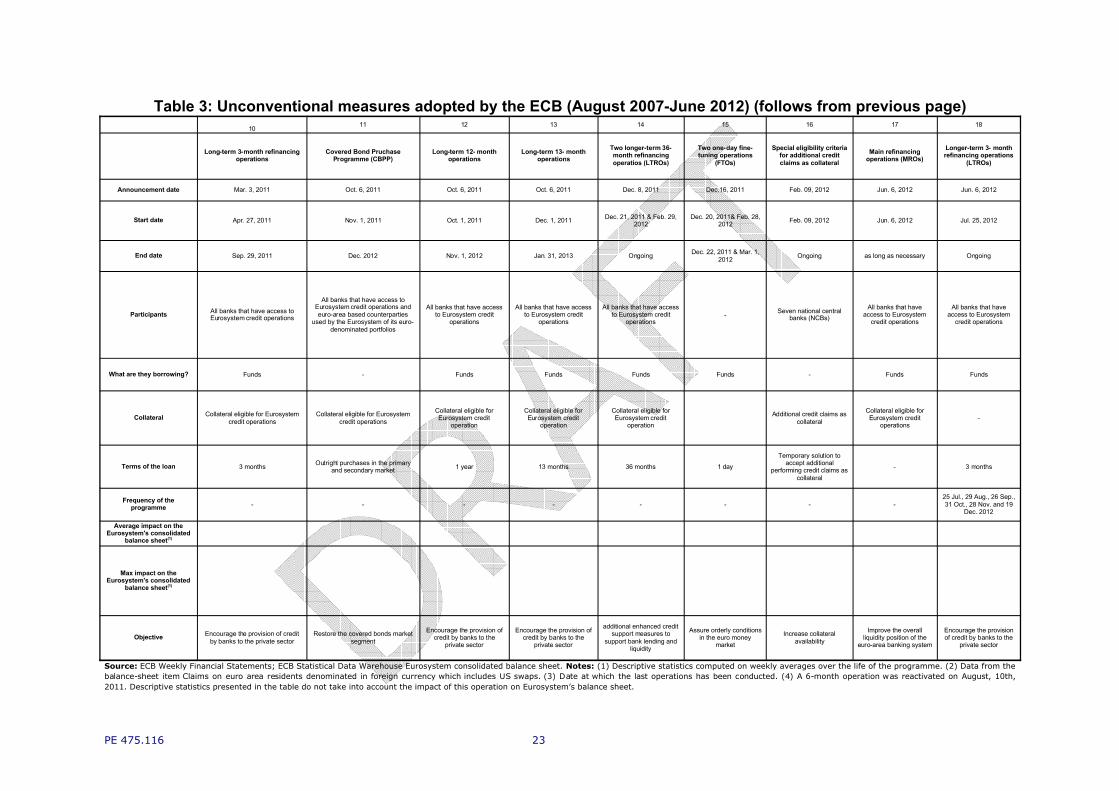
Table 3: Unconventional measures adopted by the ECB (August 2007-June 2012) (follows from previous page)10 11 12 13 14 15 16 17 18
Long-term 3-month refinancing operations
Covered Bond Pruchase Programme (CBPP)
Long-term 12- month operations
Long-term 13- month operations
Two longer-term 36-month refinancing operatios (LTROs)
Two one-day fine-tuning operations
(FTOs)
Special eligibility criteria for additional credit claims as collateral
Main refinancing operations (MROs)
Longer-term 3- month refinancing operations
(LTROs)
Announcement date Mar. 3, 2011 Oct. 6, 2011 Oct. 6, 2011 Oct. 6, 2011 Dec. 8, 2011 Dec.16, 2011 Feb. 09, 2012 Jun. 6, 2012 Jun. 6, 2012
Start date Apr. 27, 2011 Nov. 1, 2011 Oct. 1, 2011 Dec. 1, 2011 Dec. 21, 2011 & Feb. 29, 2012
Dec. 20, 2011& Feb. 28, 2012 Feb. 09, 2012 Jun. 6, 2012 Jul. 25, 2012
End date Sep. 29, 2011 Dec. 2012 Nov. 1, 2012 Jan. 31, 2013 Ongoing Dec. 22, 2011 & Mar. 1, 2012 Ongoing as long as necessary Ongoing
Participants All banks that have access to Eurosystem credit operations
All banks that have access to Eurosystem credit operations and euro-area based counterparties
used by the Eurosystem of its euro-denominated portfolios
All banks that have access to Eurosystem credit
operations
All banks that have access to Eurosystem credit
operations
All banks that have access to Eurosystem credit
operations- Seven national central
banks (NCBs)All banks that have
access to Eurosystem credit operations
All banks that have access to Eurosystem
credit operations
What are they borrowing? Funds - Funds Funds Funds Funds - Funds Funds
Collateral Collateral eligible for Eurosystem credit operations
Collateral eligible for Eurosystem credit operations
Collateral eligible for Eurosystem credit
operation
Collateral eligible for Eurosystem credit
operation
Collateral eligible forEurosystem credit
operation
Additional credit claims as collateral
Collateral eligible for Eurosystem credit
operations-
Terms of the loan 3 months Outright purchases in the primary and secondary market 1 year 13 months 36 months 1 day
Temporary solution to accept additional
performing credit claims as collateral
- 3 months
Frequency of the programme - - - - - - - -
25 Jul., 29 Aug., 26 Sep., 31 Oct., 28 Nov. and 19
Dec. 2012
Average impact on the Eurosystem's consolidated
balance sheet(1)
Max impact on the Eurosystem's consolidated
balance sheet(1)
Objective Encourage the provision of credit by banks to the private sector
Restore the covered bonds market segment
Encourage the provision of credit by banks to the
private sector
Encourage the provision of credit by banks to the
private sector
additional enhanced credit support measures to
support bank lending and liquidity
Assure orderly conditions in the euro money
market
Increase collateral availability
Improve the overall liquidity position of the
euro-area banking system
Encourage the provision of credit by banks to the
private sector
Source: ECB Weekly Financial Statements; ECB Statistical Data Warehouse Eurosystem consolidated balance sheet. Notes: (1) Descriptive statistics computed on weekly averages over the life of the programme. (2) Data from the balance-sheet item Claims on euro area residents denominated in foreign currency which includes US swaps. (3) Date at which the last operations has been conducted. (4) A 6-month operation was reactivated on August, 10th, 2011. Descriptive statistics presented in the table do not take into account the impact of this operation on Eurosystem’s balance sheet.

Policy Department A: Economic and Scientific Policy_______________________________________________________________________________________________
PE 475.116 24
Date Table 4. Policy on expanding the collateral framework and enhancing the provision of liquidity by ECB
15/10/08The Governing Council of the European Central Bank (ECB) decided on the following measures: The list of assets eligible as collateral in Eurosystem credit operations will be expanded, with this expansion remaining into force until the end of 2009; 2.As from the operation settling on 30 October 2008 and until the end of the first quarter in 2009, the provision of longer-term refinancing by the Eurosystem will be enhanced; 3.The Eurosystem will start offering US dollar liquidity also through foreign exchange swaps.
20/11/09ECB decided to amend the rating requirements for asset-backed securities (ABSs) to be eligible for use in Eurosystem credit operations. The Eurosystem would require at least two ratings from an accepted external credit assessment institution for all ABSs issued as of 1 March 2010. In determining the eligibility of these ABSs, the Eurosystem would apply the “second-best” rule, meaning that not only the best, but also the second-best available rating must comply with the minimum threshold applicable to ABSs.
03/05/10ECB decided to suspend the application of the minimum credit rate threshold in the collateral eligibility requirements for the purposes of the Eurosystem's credit operations in the case of marketabel debt instruments issued or guaranteed by the Greek government. The suspension applies to all outstanding and new marketable debt instruments issued or guaranteed by the Greek government.
28/07/10
ECB reviewed the risk control measures in the framework for assets eligible for use as collateral in Eurosystem market operations. The new schedule duly graduates haircuts according to differences in maturities, liquidity categories and the credit quality of the assets concerned, based on an updated assessment of risk characteristics of eligible assets and the actual use of eligible assets by counterparties. The new haircuts will not imply an undue decrease in the collateral available to counterparties. Moreover, the definition of liquidity categories for marketable assets and the application of additional valuation mark-downs for theoretically valued assets have been fine-tuned following the review.
31/03/11 ECB decided to suspend the application of the minimum credit rating threshold in the collateral eligibility requirements for the purposes of the Eurosystem’s credit operations in the case of marketable debt instruments issued or guaranteed by the Irish government.
07/07/11 ECB decided to suspend the application of the minimum credit rating threshold in the collateral eligibility requirements for the purposes of the Eurosystem’s credit operations in the case of marketable debt instruments issued or guaranteed by the Portuguese government.
08/12/11ECB decided to increase collateral availability by (i) reducing the rating threshold for certain asset-backed securities (ABS) and (ii) allowing national central banks (NCBs), as a temporary solution, to accept as collateral additional performing credit claims (i.e. bank loans) that satisfy specific eligibility criteria. These two measures will take effect as soon as the relevant legal acts have been published.
09/02/12ECB approved, for the seven national central banks (NCBs) that have put forward relevant proposals, specific national eligibility criteria and risk control measures for the temporary acceptance of additional credit claims as collateral in Eurosystem credit operations. Details of these specific national measures will be made available on the websites of the respective NCBs: Central Bank of Ireland, Banco de España, Banque de France, Banca d’Italia, Central Bank of Cyprus, Oesterreichische Nationalbank and Banco de Portugal.
28/02/12ECB decided to temporarily suspend the eligibility of marketable debt instruments issued or fully guaranteed by the Hellenic Republic for use as collateral in Eurosystem monetary policy operations. This decision takes into account the rating of the Hellenic Republic as a result of the launch of the private sector involvement offer.
Source: ECB

Unconventional Monetary Policy Measures________________________________________________________________________________________________
PE 475.116 25
4. EFFECTS OF UNCONVENTIONAL MONETARY POLICY MEASURES
Having outlined the broad framework for non-standard monetary policy measures, we will now look at their effects. There is a growing literature about empirical estimates evaluating the impact of quantitative easing. Cecioni et al (2011) present a nice overview, but see also Joyce (2011) and Goodhart and Ashworth (2011). They all provide evidence that the unconventional measures have prevented output and employment from contracting more and inflation being slightly higher than would have been the case without such measures.
Given that these policies were particularly aiming at maintaining the functionality and stability of the financial system, it may be of interest to evaluate how they have affected interest rates. In particular, we seek to know the effects on long term bond yields, as this can be interpreted as a proxy for the portfolio balance channel on which much of the efficiency of monetary policy is based, and the short term spread.
For this purpose we have estimated a VAR-GARCH model for 10-year bond yield, the 3-month spread (as a proxy for interbank trouble), quantitative easing in terms of balance sheet exten-sions under the different programmes, the overnight rate and the US yield (not in USA) as an exogenous variable for global financial developments.
The results are shown in the Annex, Tables A.1 to A.8. Starting with the Euro Area we find that in Germany (Table A.1) the long term interest rate is positively affected by movements in the US Treasury rate. This is a sign of the high financial integration of the world economy.
Among QE measures we find, as expected, a moderately negative effect of the Covered Bond Purchasing Programme on Germany (Table A.1) and a stronger and statistically more signifi-cant effect on the Spanish, Portuguese and Irish yields (Tables A.2, A.4 and A.5). Hence, in these countries the bailout of private markets through the CBPP has been successful with respect to long run debt. Surprisingly, however, there is no significant impact on the 3-months risk spread in any country.
The Securities Markets Programme (SMP) has had a significant impact only on the Irish long term interest rate, while Open Market Operations have reduced the 3-months spread and lowered the problems in the banking sector for all countries except Germany and Spain. The EONIA rate is negatively linked to the three months spread in all countries but Spain. Thisresult is somehow opposite to what expected if it would successfully reduce the risk in the banking system. This is probably due to the mechanical effect the EONIA rate has on the OIS rate.
Turning to UK, as shown in Table A.7 the unconventional policy measure do not have much effect on short and long term interest rates. The is only a barely significant effect of short term operations (open market and repos) on the three months spread, while the Sonia rate has a clear positive impact on both short and long term interest rates. Contrary to the ECB equiva-lent this traditional instrument is much more effective in affecting the yield curve.
Finally, for the US (Table A.8) the evidence is mixed. While Mortgage Backed Security pur-chases have a strong and negative impact on the 10 years rate, they have caused an increase in three months spread. The purchase of Treasury Bills does not have a significant impact on the two risk measures, while special lending and repurchase agreements help to reduce ten-sions in the banking system by reducing the three months spread, although the significance of its impact is low.

Policy Department A: Economic and Scientific Policy_______________________________________________________________________________________________
26 PE 475.116
Summing up, the evidence on the effect of unconventional policies by the three Central Banks is mixed: in the Euro Area only Ireland has strongly benefited from these policies, while for the other countries the effect is lower. In particular, the SMP, which has been created to mitigate the sovereign debt crisis does not impact on long term interest rates of the most troubles countries, namely Greece, Spain and Italy. The reason is presumably that the ECB interven-tions are too timid to fully re-assure markets when there is persistent fire from influential hecklers in Germany and elsewhere. By contrast, there is a positive effect from the CBPP, which reduces long term interest rates. This is probably the product of the increased trust by the markets in the European Central Bank, which is fulfilling its role as the lender of last resort and can take its decisions independently from member state governments. In UK the most powerful instrument is the conventional policy rate while unconventional policies have only a weak impact on the banking crisis when they do short term open market operations. Finally, for the US there is a mixed evidence of the impact of the various quantitative easing meas-ures.
Our econometric evidence tends to confirm that unconventional policy measures are the cor-rect answer to the problems of the present crisis. However, it has also increased risks. A larger balance sheet means that private sector default risks have been transferred to the ECB. The lowering of collateral quality thresholds makes the Eurosystem more fragile. The ECB has reacted by requesting higher “haircuts”.11 However, this risk-reducing measure does not apply to the outright purchase of government bonds under the SMP (Nagel, 2012).
Empirical studies do not evaluate the role of changes in collateral. However, there is a particu-lar vulnerability in the Euro Area that results from the asymmetric expansion of collateral for fragile debtors. They carry high “tail risk”, which means that although the likelihood of default may not be high, if it actually occurred, the damage could be massive. Swapping such debt against central bank money has weakened the Eurosystem’s balance sheet in the sense that the portion of riskier assets has increased. Empirical evidence is not available, for the data on the distribution of assets and collateral are confidential. However, even if a central bank can-not go “bankrupt” in the usual sense, a large loss of net worth would undermine the ECB’s reputation and possibly its independence. Changes in the ECB’s capital funds must be seen as a “policy signal”.
There is an elegant way how to mitigate this collateral risk, which I have pointed out to the European Parliament’s Committee on Economic and Monetary Affairs before.12 The ESM should issue Union Bonds as an asset backed security of approximately EUR 5000 billion, against which it holds sovereign bonds in proportion of national shareholdings in the ECB. These Union Bonds would therefore represent the asset value of public debt for the Euro Area as a whole. The ECB should then privilege these Union Bonds as collateral.
This innovation would create a deep and liquid European bond market and simultaneously reduce the risk exposure for the Euro Area. By contrast, the recent measures, whereby na-tional central banks can refuse sovereign debt by other Member States as collateral is a step towards disintegration and should be avoided by all means.
11 A haircut is a percentage that is subtracted from the market value of an asset that is being used as collateral.12 See: S. Collignon, 2011.The ECB, the ESM and Stability Bonds: a way out of the cri-
sis.http://www.stefancollignon.de/PDF/EP_Dec2011.pdf; and: How to bring Germany on Board and save the Euro; http://www.social-europe.eu/2011/12/how-to-bring-germany-on-board-and-save-the-euro/.

Unconventional Monetary Policy Measures________________________________________________________________________________________________
PE 475.116 27
REFERENCES
Bank of England, 2011. Quarterly Bulletin, 2011 Q3 | Volume 51 No. 3.
Berger A., S. Davies, and M. Flannery. 1998. Comparing Market and Regulatory As-sessments of Bank Performance: Who Knows What When? Federal Reserve Board work-ing paper1998-32 (August).
Bernanke, B. S. and V. R. Reinhart, 2004. Conducting Monetary Policy at Very Low Short-Term Interest Rates; The American Economic Review, Vol. 94, No. 2.
Bofinger, P. 2001. Monetary Policy. Goals, Institutions, Strategies, and Instruments. Oxford University Press.
Cecioni, M., G. Ferrero and A. Secchi, 2011. Unconventional monetary in theory and practice; Bancad’Italia Occasional Paper No. 112.
Collignon, S. 2004. Is Europe going far enough? Reflections on the EU's Economic Gov-ernance. In: Journal of European Public Policy, Vol. 11.5: 909-925.
Collignon,S. 2011.The ECB, the ESM and Stability Bonds: a way out of the crisis.http://www.stefancollignon.de/PDF/EP_Dec2011.pdf.
Collignon, S., P. Esposito and H. Lierse (2011) European Sovereign Bailouts, Political Risk and the Economic Consequences of Mrs Merkel. ARENA working paper. Download from: www.stefancollignon.eu.
Collignon, S.2011a. How to bring Germany on Board and save the Euro; http://www.social-europe.eu/2011/12/how-to-bring-germany-on-board-and-save-the-euro/.
ECB, 2011. The Monetary Policy of theECB. Frankfurt a. M.
Engle, R.F. and R. Susmel (1993), “Common volatility in international equity markets”, Journal of Business and Economic Statistics, 11, 2, 167-176.
Engle, R.F., and K.F. Kroner (1995), “Multivariate simultaneous generalized ARCH”, Econometric Theory, 11, 122-150.
European Commission, (2012a). European Economic Spring Forecast; Euro-pean Economy 1|2012.
Federal Reserve Board, 2008. The Federal Reserve Act, Section 2a, Fed’s website (www.federalreserve.gov), http://www.federalreserve.gov/aboutthefed/fract.htm.
Flannery, M. 1996. Financial Crises, Payment System Problems, and Discount Window Lending. Journal of Money;Credit and Banking 28: 804-824.
Freixas, X., B. Parigi and J.-C. Rochet,2000, .Systemic Risk, Interbank Relations and Li-quidity Provision by the Central Bank., Journal of Money, Credit, and Banking, 32(3/2), 611-640.
Freixas, X., C. Giannini, G. Hoggarth, F. Soussa. 2000. Lender of Last Resort: What Have We Learned Since Bagehot?; Journal of Financial Services Research 18.1: 63-84.
Goodhart, C. A. E., 1999. Myths about the Lender of Last Resort; International Finance 2.3: 339–360.

Policy Department A: Economic and Scientific Policy_______________________________________________________________________________________________
28 PE 475.116
Goodhart, Ch. And J. Ashworth. 2011. The Bank of England’s second round of quantita-tive easing may do little to improve economic confidence or to encourage bank lending, and may even lead to more upward pressures on inflation. See://blogs.lse.ac.uk/politicsandpolicy/2011/10/14/quantitative-easing-inflation.
Huang Haifang and Eric Stephens, 2011. From Housing Bust to Credit Crunch: Evidence from Small Business Loans; University of Alberta, Economics Department, Working Pa-per No. 2011-15(http://www.economics.ualberta.ca/~/media/economics/FacultyAndStaff/WPs/WP2011-15-Huang-Stephens.pdf).
IMF International Monetary Fund, 2012, Global financial stability report – Washing-ton, DC.
Joyce, M., M. Tong and R. Woods, 2011. The United Kingdom’s quantitative easing pol-icy: design, operation and impact; BoE Quarterly Bulletin, 2011Q3 Volume 51 No. 3.
Kindleberger, Ch. And R. Aliber, 2005. Manias, Panics and Crashes. A History of Finan-cial Crises. 5th edition, John Wiley & Sons, New Jersey.
Nagel, J. 2012. Geldpolitische Sondermaßnahmen und Risiken – Auswirkungen der Fi-nanzkrise auf die Zentralbankbilanz. Rede anlässlich des ACI Jahreskongress; Deutsche Bundesbank, 28.04.2012: http://www.bundesbank.de/Redaktion/DE/Reden/2012/2012_04_28_nagel_geldpolitische_sonderma%C3%9Fnahmen.html.
Poole, W. 1970. Optimal Choice of Monetary Policy Instruments in a Simple Stochastic Macro Model; Quarterly Journal of Economics, 84.1: 197-216.
Reinhart, C. and K. Rogoff. 2009. This Time is Different. Eight Centuries of financial Folly. Princeton and Oxford.
Reith, M. 2009. Unconventional Monetary Policy in Practice: A Comparison of ‘Quantita-tive Easing’ in Japan and the USA; Universität Wien.
Rochet, J.-Ch. and X. Vives, 2004. Coordination Failures and the Lender of Last Resort: Was Bagehot Right After All? Journal of the European Economic Association Decem-ber 2.6:1116–1147.

Unconventional Monetary Policy Measures________________________________________________________________________________________________
PE 475.116 29
ANNEX: ECONOMETRIC ANALYSIS OF THE EFFECT OF QUANTITATIVE EASING MEASURES IN EURO AREA, USA AND UK13
The aim of this section is to provide empirical evidence for the effect of the quantitative easing(QE) measures in the three regions under analysis. As we have shown throughout the paper, since the begin of the Global Financial Crisis the three areas have been invested by two differ-ent crisis: a banking crisis due to the lack of liquidity and a sovereign debt crisis, the latter in particular in the Southern Member states of the Euro Area. The effect of these two crises is clearly shown in the interest rates data, and in particularly, the spread between the three months rate and the overnight interbank three months rate (OIS) indicates the growing risk in the banking sector while the sovereign bond crisis is showed more clearly by the interest rate on 10 years government bonds. The crises are also interrelated so that their effect and the impact of the QE measures cannot be separately estimated. In addition, there are sources of endogeneity in all variables for several reasons. First, the debt crisis and the banking crisis interact with each other, leading to a potential vicious circle. Second, as the worsening of the crisis causes the reaction of the central banks, the QE measures suffer from reverse causality; on the same token the standard monetary policy instrument, i.e. the overnight interest rate may suffer from endogeneity too. In this context the natural estimation framework is the Vector Autoegressive (VAR) approach, where a system of equations with each endogenous variable as dependent is estimated. In addition, as interest rates and QE measures are set daily, we have to model the conditional variance covariance matrix taking into account the non constancy over time of the residuals. This is done by estimating a VAR-GARCH model following the works of Engle and Susmel (1993) and Engle and Kroner (1995). This framework allows modelling a system of equations with time varying conditional variances and covariances. The estimates are carried out through maximum likelihood and by using the BEKK (see Engle and Kroner 1995) parameterisation, which makes the VCV matrix positively definite.
The countries under analysis are UK, USA and the Southern European Member States Greece, Ireland, Italy, Portugal and Spain, with the addition of Germany. The estimated system is the following:
it
it
it
it
it
it USAyieldQEmspreaddailyIntyieldyield )(103__1010 5141312111 (1)
it
it
it
it
it
it USAyieldQEyielddailyIntmspreadmspread )(1010_3_3_ 5141312112 (2)
it
it
it
it
it
it USAyieldQEmspreadyielddailyIntdailyInt )(103_10__ 5141312113 (3)
it
it
it
it
it
it USAyieldyieldmspreaddailyIntQEQE )(10103__ 541312114 (4)
Where yield10 is the yield on 10 years Government Bonds for country i in time t; yield10(USA)is the corresponding rate for US bonds, which is introduced as exogenous variable for all coun-tries except United Stated; Int_daily is the overnight policy rate set by the central bank, which is represented by the EONIA in the Euro Area, the SONIA in UK and the Fed Fund rate in US. Finally, QE is the quantitative easing measure under analysis. For the Euro Area we choose the Covered Bond Purchasing Programme (CBPP), the Securities Markets Programme (SMP) and Open Market Operations (OPM). The latter is basically the counterpart of the special lending operation set by the ECB so that the introduction of one or the other should be irrelevant. 13 The econometric testing was done by Piero Esposito, scuola Superiore Sant’Anna, Pisa and Centro Europa Ricer-
che, Roma.

Policy Department A: Economic and Scientific Policy_______________________________________________________________________________________________
30 PE 475.116
In the latter case, the amount of OPM is influenced by the requirement of a maintenance pe-riod in deposits with the ECB, which takes place approximatively every 4 weeks and causes a sudden reduction in the amount of assets the day before the beginning of this period. In order to control for this event, we introduce a dummy for these days. For the United Kingdom, the measures investigated are the Asset Purchase Facility (APF), long term repos (LT_REPOS) and short term open market operations (STOP). Finally, for the US the two main policy measures have been the buying of Mortage-Backed Securities (MBS) and Treasury Bills (TREAS), to-gether with special lending and repos activities (SPEC).
The residuals of equations (1)-(4) are jointly modelled as a multivariate GARCH process where the number of ARCH and GARCH terms is decided for each country by using the Bayesian Information Criteria. As already mentioned, the covariance is estimated by using the BEKKrepresentation, while a further restriction of diagonal covariance matrix is imposed.
The results are shown in tables A.1 to A.8, where the coefficients of the mean equations are shown in the upper part of each table, while in the bottom part the R2, the value of the BIC and number of ARCH and GARCH terms. Starting with the Euro Area countries we find a vari-ety of results among the member states analysed. In Germany (Table A.1) the long term interest rate is positively affected by movements in the US Treasury rate while among QE measures we find a slightly negative effect of the CBPP on Germany (Table A.1) while the same measure has a stronger and more significant effect on the Spanish yields (Table A.2) as well as on Portuguese and Irish ones (Tables A.4 and A.5). Surprisingly enough there is no significant impact on the 3-months spread for any country.

Unconventional Monetary Policy Measures________________________________________________________________________________________________
PE 475.116 31
Table A.1 Estimation results of equation (1)-(4) for GermanyCovered Bond Purchasing Program
Δyield_10y(t) Δspread(t) Δeonia(t) ΔCBPP(t)
Δyield_10y(t-1) 0.056*** 0.025*** -0.078** -30.364
Δspread(t-1) -0.048 0.043* -0.174*** -70.3
Δeonia(t-1) 0.010 -0.002 -0.186*** -5.159
ΔCBPP(t-1) -0.014* -0.004 0.014 0.866
Δyield_usa(t) 0.404*** -0.037*** -0.050* 31.762
Rsq 0.299 0.010 0.032 0.172
BIC 1.477
Security Market Program
Δyield_10y(t) Δspread(t) Δeonia(t) ΔSMP(t)
Δyield_10y(t-1) 0.047** 0.023*** -0.083** -142.990
Δspread(t-1) -0.045 0.024 -0.166*** 1036.95***
Δeonia(t-1) 0.009 -0.002 -0.186*** 12.310
ΔSMP(t-1) 0.32 -0.37 8.460*** -0.01
Δyield_usa(t) 0.405*** -0.038*** -0.041 -788.86***
Rsq 0.298 0.009 0.045 -0.011
BIC 6.595
Open Market Operations
Δyield_10y(t) Δspread(t) Δeonia(t) Δopen_mkt(t)
Δyield_10y(t-1) 0.046** 0.023* -0.018 9796.15
Δspread(t-1) -0.048 0.003 -0.316*** 134838.1***
Δeonia(t-1) 0.010 -0.007* -0.164*** 39500.22***
Δopen_mkt(t-1) 0.008 -0.014 0.229*** -0.345***
Δyield_usa(t) 0.397*** -0.036* -0.015 -5818.23
Rsq 0.299 0.008 0.145 0.407
BIC 13.450

Policy Department A: Economic and Scientific Policy_______________________________________________________________________________________________
32 PE 475.116
Table A.2 Estimation results of equation (1)-(4) for SpainCovered Bond Purchasing Program
Δyield_10y(t) Δspread(t) Δeonia(t) ΔCBPP(t)
Δyield_10y(t-1) 0.113*** 0.012** -0.016 37.001
Δspread(t-1) 0.080* 0.029 -0.129** -14.878
Δeonia(t-1) 0.005 -0.003 -0.188*** -4.161
ΔCBPP(t-1) -0.020*** -0.003 0.02 0.873***
Δyield_usa(t) 0.284*** -0.037*** -0.05 34.677
Rsq 0.021 0.014 0.034 0.171
BIC 2.09
Security Market Program
Δyield_10y(t) Δspread(t) Δeonia(t) ΔSMP(t)
Δyield_10y(t-1) 0.099*** 0.013** 0.001 -500.518
Δspread(t-1) 0.076 0.0021 -0.254*** 1041.93
Δeonia(t-1) 0.005 -0.004 -0.207*** 20.846
ΔSMP(t-1) 0.00 0.00 0.008*** -36.865
Δyield_usa(t) 0.281*** -0.028*** -0.039 -767.03**
Rsq 0.022 0.010 0.049 0.045
BSIC 7.274
Open Market Operations
Δyield_10y(t) Δspread(t) Δeonia(t) Δopen_mkt(t)
Δyield_10y(t-1) 0.110*** 0.012** 0.016 13861.36*
Δspread(t-1) 0.038 -0.013 -0.228*** 103267.3***
Δeonia(t-1) 0.005 -0.007 -0.143*** 21233.91***
Δopen_mkt(t-1) 0.000 0.000 0.25 -0.36051
Δyield_usa(t) 0.272*** -0.037*** -0.006 -12022.7
Rsq 0.021 0.008 0.145 0.402
BIC 14.078

Unconventional Monetary Policy Measures________________________________________________________________________________________________
PE 475.116 33
Table A.3 Estimation results of equation (1)-(4) for Italy
Covered Bond Purchasing Program
Δyield_10y(t) Δspread(t) Δeonia(t) ΔCBPP(t)
Δyield_10y(t-1) 0.093*** 0.019*** 0.013 4.97
Δspread(t-1) 0.049 0.025*** -0.147** -49.82
Δeonia(t-1) 0.01 -0.002 -0.189*** -1.64
ΔCBPP(t-1) -0.013 -0.003 0.018 0.792***
Δyield_usa(t) 0.198*** -0.038*** -0.05 33.45
Rsq 0.005654 0.009 0.031694 0.212957
SIC 2.025659
Security Market Program
Δyield_10y(t) Δspread(t) Δeonia(t) ΔSMP(t)
Δyield_10y(t-1) 0.087*** 0.017*** 0.024 -458.91
Δspread(t-1) 0.047 0.008 -0.160** 1072.99
Δeonia(t-1) 0.011 -0.003 -0.205*** 19.497
ΔSMP(t-1) 0.72 -0.27 8.350*** -0.038
Δyield_usa(t) 0.199*** -0.039*** -0.045 -764.330
Rsq 0.006 0.008 0.045 -0.001
SIC 6.911
Open Market Operations
Δyield_10y(t) Δspread(t) Δeonia(t) Δopen_mkt(t)
Δyield_10y(t-1) 0.103*** 0.020*** 0.013 19973.36**
Δspread(t-1) 4.20E-02 -0.012 -0.258*** 132376.7***
Δeonia(t-1) 0.017* -0.010*** -0.195*** 39591.32***
Δopen_mkt(t-1) 0.030 -0.016* 0.224*** -0.349***
Δyield_usa(t) 0.192*** -0.039*** 0.00 -6084.26
Rsq 0.005 0.006 0.143 0.409
SIC 13.96

Policy Department A: Economic and Scientific Policy_______________________________________________________________________________________________
34 PE 475.116
Table A.4 Estimation results of equation (1)-(4) for Portugal
Covered Bond Purchasing Program
Δyield_10y(t) Δspread(t) Δeonia(t) ΔCBPP(t)
Δyield_10y(t-1) 0.156*** 0.004* -0.023* 14.13*
Δspread(t-1) 0.054 0.052** -0.114** 3.786
Δeonia(t-1) 0.009 -0.001 -0.168*** 0.143
ΔCBPP(t-1) -0.024** -0.002 0.016 0.920***
Δyield_usa(t) 0.299*** -0.037*** -0.047 11.430
Rsq 0.020974 0.011974 0.033086 0.132426
SIC 2.632809
Security Market Program
Δyield_10y(t) Δspread(t) Δeonia(t) ΔSMP(t)
Δyield_10y(t-1) 0.131*** 0.007*** -0.023 686.06***
Δspread(t-1) 0.043 0.029 -0.064 4431.06***
Δeonia(t-1) 0.008 -0.001 -0.205*** -27.69
ΔSMP(t-1) 0.006* -0.001 0.009*** 0.762***
Δyield_usa(t) 0.303*** -0.042*** -0.034 184.29
Rsq 0.016 0.012 0.044 -0.628
SIC 8.003
Open Market Operations
Δyield_10y(t) Δspread(t) Δeonia(t) Δopen_mkt(t)
Δyield_10y(t-1) 0.126*** 0.004 -0.017 18538.21***
Δspread(t-1) 0.049 -0.003 -0.304*** 131074.9***
Δeonia(t-1) 0.007 -0.008** -0.183 40005.12***
Δopen_mkt(t-1) -0.005 -0.015* 0.224*** -0.356***
Δyield_usa(t) 0.285*** -0.038*** -0.018 -6521.18
Rsq 0.020 0.011 0.145 0.411
SIC 14.81
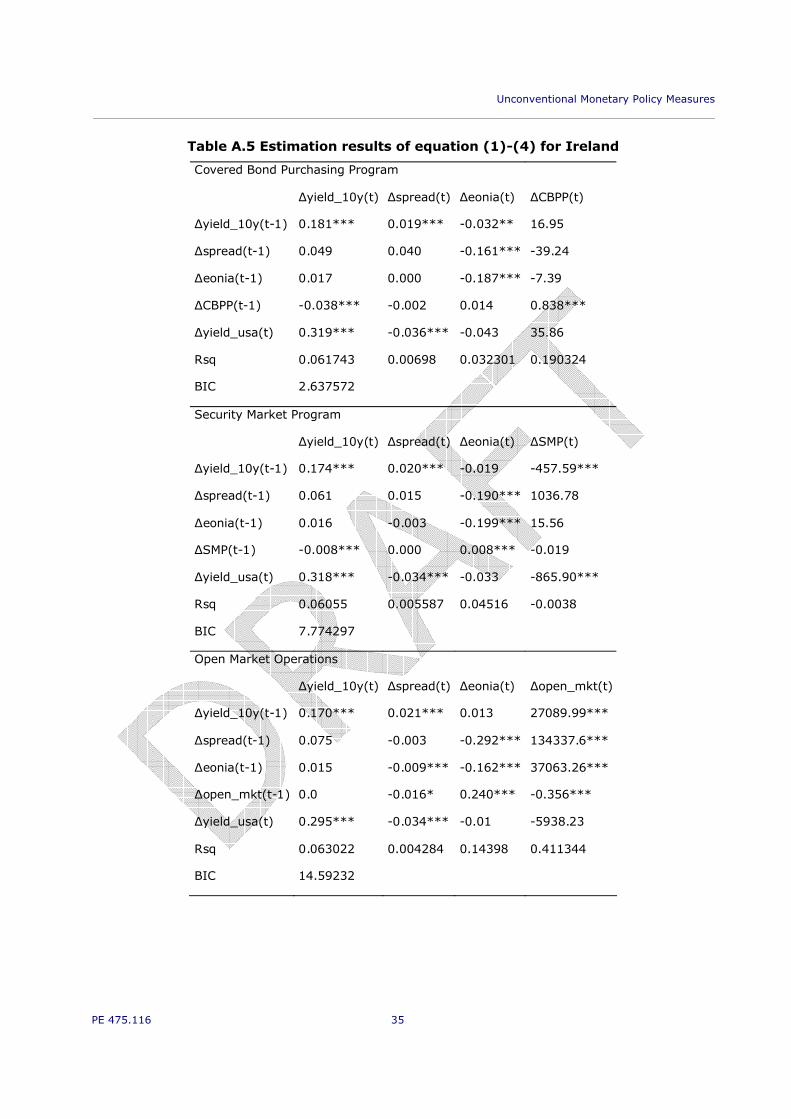
Unconventional Monetary Policy Measures________________________________________________________________________________________________
PE 475.116 35
Table A.5 Estimation results of equation (1)-(4) for Ireland
Covered Bond Purchasing Program
Δyield_10y(t) Δspread(t) Δeonia(t) ΔCBPP(t)
Δyield_10y(t-1) 0.181*** 0.019*** -0.032** 16.95
Δspread(t-1) 0.049 0.040 -0.161*** -39.24
Δeonia(t-1) 0.017 0.000 -0.187*** -7.39
ΔCBPP(t-1) -0.038*** -0.002 0.014 0.838***
Δyield_usa(t) 0.319*** -0.036*** -0.043 35.86
Rsq 0.061743 0.00698 0.032301 0.190324
BIC 2.637572
Security Market Program
Δyield_10y(t) Δspread(t) Δeonia(t) ΔSMP(t)
Δyield_10y(t-1) 0.174*** 0.020*** -0.019 -457.59***
Δspread(t-1) 0.061 0.015 -0.190*** 1036.78
Δeonia(t-1) 0.016 -0.003 -0.199*** 15.56
ΔSMP(t-1) -0.008*** 0.000 0.008*** -0.019
Δyield_usa(t) 0.318*** -0.034*** -0.033 -865.90***
Rsq 0.06055 0.005587 0.04516 -0.0038
BIC 7.774297
Open Market Operations
Δyield_10y(t) Δspread(t) Δeonia(t) Δopen_mkt(t)
Δyield_10y(t-1) 0.170*** 0.021*** 0.013 27089.99***
Δspread(t-1) 0.075 -0.003 -0.292*** 134337.6***
Δeonia(t-1) 0.015 -0.009*** -0.162*** 37063.26***
Δopen_mkt(t-1) 0.0 -0.016* 0.240*** -0.356***
Δyield_usa(t) 0.295*** -0.034*** -0.01 -5938.23
Rsq 0.063022 0.004284 0.14398 0.411344
BIC 14.59232

Policy Department A: Economic and Scientific Policy_______________________________________________________________________________________________
36 PE 475.116
Table A.6 Estimation results of equation (1)-(4) for Greece
Covered Bond Purchasing Program
Δyield_10y(t) Δspread(t) Δeonia(t) ΔCBPP(t)
Δyield_10y(t-1) 0.145*** 0.001 -0.0003 -5.400**
Δspread(t-1) -0.037 0.029 -0.197*** -53.39
Δeonia(t-1) 0.013 -0.002 -0.206*** -47.98
ΔCBPP(t-1) -0.008 -0.004 0.015 0.866***
Δyield_usa(t) 0.277*** -0.037*** -0.050 52.28
Rsq -0.023 0.013 0.032 0.177
BIC 4.074
Security Market Program
Δyield_10y(t) Δspread(t) Δeonia(t) ΔSMP(t)
Δyield_10y(t-1) 0.140*** 0.001 0 38.98
Δspread(t-1) -0.045 0.006 -0.223*** 1061.45
Δeonia(t-1) 0.012 -0.003 -0.211*** 18.84
ΔSMP(t-1) 1.50E-06 -3.08E-07 0.008*** -0.03949
Δyield_usa(t) 0.280*** -0.038*** -0.041 -761.36**
Rsq -0.022 0.012 0.045 -0.001
BIC 9.198
Open Market Operations
Δyield_10y(t) Δspread(t) Δeonia(t) Δopen_mkt(t)
Δyield_10y(t-1) 0.158*** 0.001 0.007 -702.16
Δspread(t-1) -0.003 -0.014 -0.265*** 132013.4***
Δeonia(t-1) 0.011 -0.010*** -0.184*** 39782.58***
Δopen_mkt(t-1) -0.02 -0.017* 0.217*** -0.344***
Δyield_usa(t) 0.263*** -0.038*** -0.009 -5971.78
Rsq
BIC

Unconventional Monetary Policy Measures________________________________________________________________________________________________
PE 475.116 37
Table A.7 Estimation results of equation (1)-(4) for UK
Assets Purchase Facility
Δyield_10y(t) Δspread(t) Δeonia(t) ΔAPF(t)
Δyield_10y(t-1) 0.024 -0.006 -0.030*** 536.41
Δspread(t-1) -0.049 -0.005 -0.115*** -484.98
Δsonia(t-1) 0.045*** 0.032*** -0.533*** -57.87
ΔAPF(t-1) -0.340 -0.236 -0.464*** -0.040
Δyield_usa(t) 0.400*** -0.023*** 0.025*** -509.31
Rsq 0.240 0.037 -0.245 0.001
BIC 4.301
Long Term Repos
Δyield_10y(t) Δspread(t) Δeonia(t) ΔLT_REPOS(t)
Δyield_10y(t-1) 0.029 -0.005 -0.029*** -4695.23***
Δspread(t-1) -0.044 0.000 -0.155*** -1445.22***
Δsonia(t-1) 0.043*** 0.033*** -0.475*** 90.24
ΔLT_REPOS(t-1) 0.006 0.570 0.634*** 0.012
Δyield_usa(t) 0.392*** -0.023 0.024*** -1969.4*
Rsq 0.240 0.043 -0.193 0.009
BIC 6.221
Short Term Operation
Δyield_10y(t) Δspread(t) Δeonia(t) ΔSTOP(t)
Δyield_10y(t-1) 0.025 -0.005 -0.028*** -146.39
Δspread(t-1) -0.051 -0.005 -0.111*** -1400.13
Δsonia(t-1) 0.044*** 0.032*** -0.525*** -335.21
ΔSTOP(t-1) 0.66 -0.491* -0.258*** 0.005
Δyield_usa(t) 0.397*** -0.023*** 0.024*** 17.05
Rsq 0.239 0.037 -0.236 -0.003
BIC 5.628

Policy Department A: Economic and Scientific Policy_______________________________________________________________________________________________
38 PE 475.116
Table A.8 Estimation results of equation (1)-(4) for USA
Mortage Backed Securities
Δyield_10y(t) Δspread(t) Δfed_fund(t) ΔMBS(t)
Δyield_10y(t-1) -0.042 0.005 -0.033 2828.493
Δspread(t-1) 0.005 -0.091*** -0.623*** -74.53
Δfed_fund(t-1) -0.005 0.006*** -0.319*** -40.59
ΔMBS(t-1) -0.971*** 0.084*** -0.26 -0.051
Rsq -0.006 -0.040 0.086 -0.004
BIC 10.768
Treasuries
Δyield_10y(t) Δspread(t) Δfed_fund(t) ΔTREAS(t)
Δyield_10y(t-1) -0.050* 0.008*** 0.005 495.5
Δspread(t-1) -0.01 -0.097*** -0.890*** -2880.56
Δfed_fund(t-1) -0.005 0.007 -0.357*** 875.79
ΔTREAS(t-1) -0.09 -0.07 0.373*** -0.043
Rsq 0.001 -0.042 0.083 0.001
BIC 9.742
Special Lending and Repos
Δyield_10y(t) Δspread(t) Δfed_fund(t) ΔSPEC(t)
Δyield_10y(t-1) -0.041 0.014*** -0.014 134.700
Δspread(t-1) 0.016 -0.036 -0.858*** 12874.9
Δfed_fund(t-1) -0.003*** 0.008 -0.291*** 734.660
ΔSPEC(t-1) 0.28 -0.066* -0.43 -0.094
Rsq 0.001 -0.009 0.090 -0.009
BIC 11.629