unclassified s•
TRANSCRIPT

UNCLASSIFIED Copy 10 of 42 copies
AD-A2 5 2 199 DTICi3I~UlUlllBIII\\Ii S• ELECTE 1JUNi 2199211
IDA PAPER P-2598 c
HIGH FREQUENCY COMMUNICATIONSUNDER ADVERSE CONDITIONS
II
H. M. Federhen, Project Leader
V
December 1991
Prepared forThe Joint Staff
~Pubi~c releeaSImniUted dishiabutje, miew ofthis auterial do" mci Imply Department Of ____ (
S1 INSTITUTE FOR DEFENSE ANALYSESS 1801 N. Beauregard Street. Alexandria. Virgini. 22311-1772
92 6 11 0 70 UNCLASSIFIED IDA Log No. O 91-38244

IA pulishe ft e1iMla is$ Iutto few I"rt th fl a at Iow"e.
R~beml b te mea aewbthehls mil meaoswtuy sesIeredf preieto IDA publshe.Tne aoemufy M " -I mufss Imarpew se I W"ia 18 bas a direst boorlso ofdecilumsion la maN o MW MNM, 16) address Issues of olgulltsast searso to theEsecultie koath, tlia C6@mpu sand/ the publIc, at (c) addre sshum that hav
1.lsa esuml i. .pilutls.. IDA Repula we IssevWu by PsiOW peafte of apsisIs saw s theirbo qualIty aid ulva to the problem stdie. @W Othe awe relesedby the uis of IDA.
Brerp Repost6"u Repeto mow the fladiap lad rslofa IDA em"atastoed "Mebla Ipap mailpn*soub sl ofee at easer Adide ad*="tu mWi bass whickels 05mm .651 hfth satel of N IDA Repe. IDA OWrasp f weeu -8 as-le I BY fth voate ledk~nsaemouselhile Ow the projetad otheMs as oiss by WDA to *mus fthe high quality sadlalommss Is go upoblems *dAe. and waruead by Noe Presiduso of VA.
PapossFaplen, als -1 11 &W - I sad m ebl setlduwd predu of IDA, addrsme Oind fthawe suevmue Is map Gma hma covervi In 111perl. IDA Papmr awe i~mbed to assorethat the moot the hig stoalsb espema of ralareed papes Is prolaoaslal jeusols ov
DocumatsID Seamanef are mad ho e th a inslem d1 the spessm or them isy to ) to codsabolosave work doss is qalk mactim studoies, (h1 Is ecor the precooduap ofpelres s ad mefagSU , ( s) to mome mailable prelimimia sam teatalve moasel ofsmelwsso, fd) to emasid do deselepe In the Nueof as sel gal e r()t sw
,drug tha to ea dssalal .somisyMs sad me aod. The revow at IDA DeaumsomIs sala to thei aomsa and Miss"e me.
[The waft -epea No this dasmea wee cuedua Wair ooarac RDA OU N C UM for1Ithe Departmat of Dofous. The pahliufllm of this IDA ducebat dm oss t ladicaftI etodoasme by the Depotmeal 6of Defema, mar shasi the ceateat be 96"oatsd as
re t hel ufSo W poeellos od Ols AVee".j

P~REPOR DOCUMENATION PAGE)ADADAS(I)5 PRORMSNo. 070AN IIO
W ef Is-me AGNC NAES " M AOPAESI4(E)m ~ddb P 10.0 SPCSOI 2,UO =.IN1. GECY 4 A .bw L M, EPO TK AD AGENC -MPOMTNME
41. SUPPLEMEND AR U NOTLES IDorbrII rFnlSFNM UB
PHbigh FreqeuencyiCmmtednistibtion: RnerAvirew Cofntismtriadoes not038C00
L5 AUsIRAT TASKu, T41-
17. saaW r TRMSQ S.UAT NUR)AD DRSE .PRO MIEG ORG PAGESIO
ontiut fnor oefrm Anayse REPOR NUMBERR~ISMN.LASeSIIegD S NtS.I NLSIFE AE SRPR
AlexerdrbV 2231-IM P259

UNCLASSIFIED
IDA PAPER P-2598
HIGH FREQUENCY COMMUNICATIONSUNDER ADVERSE CONDITIONS
H. M. Federhen. Project Leader
December 1991 0s
n Iuwigmu. ofg3 eWWI 004WaI.
Acee.sion olr
Ir,4,; ?&i; [
IDAINSTITUTE FOR DEFENSE ANALYSES ily
, D.stribut I w/Contract MDA 903 89 C 0003 Avaiability Coe
Task T-I 1-357 -- ... C.1Ava8l aad/or
Dtct I Special
UNCLASSIFIED \
UNCLASSIFIED
PREFACE
This study was conducted by the System Evaluation Division of the Institute for
Defense Analyses in response to a request from the Joint Staff (J-6).1
The paper examines various techniques which can be used to improve the
performance of HF communications systems when operating in the presence of noise or
jamming. Most of the discussion is devoted to directional antennas and spread-spectrum
techniques.
The reviewers for the study were Dr. David L. Randall, Director System Evaluation
Division (Chairman), Dr. C.L. Golliday, Mr. Harold Cheilek, and Dr. Herman Blasbaig.
The author gratefully acknowledges the guidance and support of the IDA Technical Review
Committee.
1 Interoperability of U.S. and NATO Anti-Jam Communications Systems, Contract MDA 903 84-C-0031, Task T-I1-357, August 1985 and Amendments 1.4, UNCLASSIFIED.
iii
UNCLASSIFIED

UNCLASSIFIED
CONTENTS
Part 1Introduction and Summary
Introduction .............................................................................................................. ISumnutary .................................................................................................................. 2
Part 2Analysis
A. Introduction ............................................................. ................... ............... 5B. Ground W ave Propagation ............................................................................. 3C. Sky W ave Propagation ................................................................................ 15
0 D. Signal Propagation and Interference ........................................................... 22E. Transmitter Power ................................ .... 23F. Excess Loss Term ........................................................................................ 24G. Distance Terms ............................................................................................. 25I- A tenna Gain ................................................................................................. 52I. Tactical HF Antennas .................................................................................... 48J. Spread-Spectrum M odulation ...................................................................... 49
Appeudixes
A. Task Background, Objective, and Statement of WorkB. Approved Distribution List for IDA Paper P-2598
v
UNCLASSIFIED

UNCLASSIFIED
LIST OF FIGURES
1. Ground-Wave Propagation Curves; Dry Ground .......................................... 8
2. Ground-Wave Propagation Curves; Land ...................................................... 9
3. Ground-Wave Propagation Curves; Sea Water, Average Salinity ................. 10
4. Field Strength at D-10 km .......................................................................... 12
5. Field S wsfeth at D= 100 m ........................................................................... 13
6a. Profiles Showing Variation of Ionization with Height ................................. 16
6b. Schematic Representation of Ionized Layers ............................................... 16
7a. Refraction of Radio Wave in the Ionosphere ............................................... 18
7b. Comparison of Actual Curved Path, with Single-Point Reflection at VirtualH eight h ......................................................................................................... 18
8. Typical MUF and LUF Curves ..................................................................... 19
9. Effect of Sunspot Activity on MUF .............................................................. 20
10. Sky Wave Transmission Paths .................................................................... 21
11. Vertical-Radiation Angles for One-Hop Circuits. ......................................... 26
12. Vertical Pattern of Whip Antenna ................................................................ 27
13. Basic Dipole Antenna ................................................................................... 27
14. Directivity Pattens for Dipole Antenna One-Half Wavelength Above PerfectGround Plane. ............................................................................................... 28
15. Field Pattems for Pairs of Isotropic Radiators, Spaced by a Distance dand With a Phase Difteronce # ...................................................................... 29
16. Field Patterns for Multi-Element Arrays of Isouropic Radiators .................... 310 17. Linear Aray of N elements. ........................................................................ 32
18. Normal and Adopted Antenna Patterns for a 24-Element Arraywith IC2 Spacing .......................................................................................... 35
19. Field Pattern of Resonant Wire Antenna in Free Space ................................ 36
20. Field Pattern of Nonresonant Wire Antenna in Free Space ........................... 37
21. Field Pattern of (a) Resonant Two-Wavelength V Antenna; (b) TerminatedTwo-Wavelength V Antenna ........................................................................ 38
22a. Angle of First Lobe of Long-Wire Antenna ................................................. 39
22b. Directive Gain of V-Beam Antenna ............................................................ 39
23. Terminated Rhombic Antenu (a) with Azimuthal Pattern (b) and Vertical PlanePattern (c) for a Rhombic 6 Wavelengths Long on Each Leg, # = 70%, and at aHeight of 1.1 Wavelengths Above a Perfectly Conducting Ground ............. 40
"vii
UNCLASSIFIED

UNCLASSFIED
24. Power Gain of Free-Space Rhombic Antenna of Optimum Design for MaximumField Intensity at Vertical Angles se of 10, 15, and 200 ................................ 41
25. Three Element Yagi Antemna. ....................................................................... 43
26. A Log-Periodic Dipole Array ...................................................................... 44
27. IHF Log Periodic Antennas ............................................................................ 45
28. Helical Antenna ........................................................................................... 4629. Parameters of Helical Antenna. .................................................................... 4630. Power Gain of Helical Beam Antenna with Respect to Isotropic Circularly
Polarized Source. ........................................................................................... 4731. Helical Antenna Arrangements to Produce Linear Polarization .................... 4832. Single Channel Fast Frequency Hopped Signal ............................................ 52
33. FSK Fast Frequency Hopped Signal ............................................................ 5234. Spectrum of PSK Spread-Spectrum Signal .................................................. 5435. Direct-Sequence Spread Spectrum. ............................. 5536. Signal and Interference Before Despreading ............................................... 5637. Signal and Interference After Despreading .................................................. 57
LIST OF TABLES
1. Degree of Control by User ............................................................................. 32. Excess Over Free-Space Loss at 1 km .......................................................... 143. Gain of Short Antennas ................................................................................. 274. Gains of Yagi Antennas ................................................................................ 435. Gains of Tactical HF Antennas .................................................................... 496. AJ Processing Gain (dB) .............................................................................. 50
viii
UNCLASSIFIED

UNCLASSIFIED
PART 1INTRODUCTION AND SUMMARY
INTRODUCTION
Communication in the high-frequency (HF) band suffers from two significantproblems: due to the variability of the medium (especially the ionosphere) circuits are hardto establish and maintain and, due to the relatively high noise levels, circuit quality is not asgood as that provided by satellites, land lines, or microwave relays. Despite thesedrawbacks, there has been a resurgence of interest among the U.S. military Services in HFcommunications because it offers the following advantages:
* HF channels we immediately avaflable. They can be established while on themove, or set up as soon as a unit stops in its base location.
• The HP band is the only one which will support direct over-the-horizon linkswithout relays of any kind. HF links can range from a few kilometers toseveral thousand kilometers.-HF links can be esiablished directly by the users, without waiting for channel
assignments, as is required for satellites or other long-haul system.* BW equipment is commercially available and is less expensive than other long-
haul systems.
There are several programs now underway to improve the performance of HFsystems. Automatic Link Establishment (ALE) equipment will, without operatorintervention, establish and maintain contact among two or more radio stations; new voiceand data modems will improve performance by automatically adapting to the noisy andvariable medium; and new ECCM features will make H1 communications more resistant tonatural and man-made noise and to deliberate enemy jamming.
The System Evaluation Division of IDA has been taskedl to study the developmentof ECCM techniques for HP communications. The study will consist of three sub-tasks:
Interoperability of U.S. and Allied High FrequencyfAndjam (HFIA)) Systenu. Contract No. MDA
903-84-C-0031, Task Order T-11-357, August 19"5, and Amndentsu I hrough 4. Unclassified.
UNCLASSIFIED

UNCLASSIFIED
* Development of a preliminary HF architecture, to include identification of
current and planned HF radio nets, and a description of the features required
for each net.
• An analysis of alternative HF ECCM techniques.
* An analysis and comparison of HF ECCM waveforms now under development
or being considered, and recommendations for a minimum set of common
waveforms to satisfy DoD requirements.
The HF architecture is being addressed in a separate IDA Paper. This paper
discusses the alternative ECCM techniques, and the subject of ECCM waveforns will be
addressed later in a separate study.
SUMMARY
This paper first discusses both ground-wave and sky-wave HF propagation, and
then derives the equation describing the performance of a radio link when interference is
presenL The interference can be either natural or man-made noise, or deliberate jamming.
Under these circumstances, the signal-w-interference ratio at the receiver is given by:
s P G , TGgCrr L 2
.T B (1) B
Where: PTr = Transmitter Power
Pý = Intefeer (jaammer) power
Gxx = Antenna Gains. For example, GTR is the gain of the transmitter
antenna in tho. direction of the receiver, GRI is the gain of the
receiver antenna in the direction of the interferer, and the other
terms have similar meanings.
Laxx = Excess loss over the basic free-space loss.
Dxx = Distances.
B = Bandwidth Filter Factor (= BIIBR). The ratio of the interferer
bandwidth to the information bandwidth of the desired signal.
2
UNCLASSIFIED

UNCLASSIFIED
This is largely influenced by using spread-spectrum modulation
which forces the interferer (jammer) to increase its bandwidth.
Each of the terms in the equation is discussed to show how it affects system
performances and, in particular, the degree to which the user or designer of an HF radio
link has control over the term. This is summarized in Table 1:
Table 1. Degree of Control by User
Non* Moderate CompletePTm
P1 4_
GIR
LIR __
DIR4__ _ _ __ _ _
A few observations should be made:LIR and DIR, the excess loss, and the distance from the interferer to the
receiver are beyond the control of the user except to the extent that siting thereceiver beyond a terrain obstacle could increase Lig, and the use of artillery orother weapons could cause a jammer to move, thus increasing DIR.
0 DTrj, the distance from the transmitter to the receiver is generally determinedonly by tactical requirements. However, the use of one or more relays canbreak a long link into two or more shorter links, each of which will have asignificantly improved S/l.
The bandwidth filter factor, B, offers a simple and direct approach toimproving HF radio link performance. Either frequency-hopping or direct-sequence pseudonoise modulation can be used to force an enemy jammer toincrease its bandwidth. Each of these modulation techniques is described, andthe advantages and disadvantages of each are discussed in the paper.
3
UNCLASSIFIED

UNCLASSIFIED
It is concluded that three promising approaches to improving the performance of
HF radio links should be considered:
Increasing the transmitter power, PT, to the extent permitted by constraints onsize and weight.
Using directional antennas which will provide beams in the direction of thetransmitter or receiver, and nulls in the direction of the interferers (jammers).Such antennas are discussed in detail in the paper.
* Using spread-spectrum modulation.
4
UNCLASSIFIED

UNCLASSIFIED
PART 2
ANALYSIS
A. INTRODUCTION
This paper examines the techniques which may be used to maintain satisfactor)communications on HF radio links, even in the face of natural or man-made interferen, ordeliberate jamming. Both the ground-wave and sky-wave modes of HF operation arediscussed in some detail, to establish both their strengths and their limitations.
While a number of. techniques can be employed to improve 19F communicationsunder adverse con4itionL, the discussion in this paper focuses oa the selection of antennasto provide beams rnd nulls in selected direct'ons and on the use of spread-spectrummodulation to gain a bandwidth advAntage (and therefore a processing gain advantage) overinterfering signals. These techniques appear to be the most promising for providing asubstantially improved ECCM capability for HF communications.
B. GROUND WAVE PROPAGATION
A transmitter driving an isotropic antenna in firee space will generate an electric fieldgiven by:
D (1)
where: E = rms electric field strength (Violts/meter)
PT = Radiated power of transmitter (Watts)
D = Distance (meters)
The power density of the radiated signal is:
120mi (2)
where: S = Power density (Watts/meter2)
120n = Resistance of free space (. 377Q•)
UNCLASSIFIED

UNCLASSIFIED 0
For a receiving antenna whose effective aperture is A, the received power will be:
PP = SAR A(3)
If the receiving antenna is isotropic, the effective aperture is %2/4n, and the received
power is:
PR= S%.2 0R 4n (4)
where: X = Wavelength (meters)
Thus, for the case of two isotropic antennas and a lossless medium, we have, upon
substituting Equations (1) and (2) into Eq. (4): -
=PT T2 P 4. 2
PR 162d (5) -
From which we get the Free-Space Transtmission Loss equation:
F T _ (4 )2 4"tD-f)2
R (6)
where: f = Frequency (Hertz)
c = Speed of light = 3 x 10 meters/second
If the frequency is measured in MHz and the distance in km, the free-space
transmission loss (in decibels) is given by: 0
LFS(dB) = 32.44 + 20 log fMHz + 20 log DIan (7)
Equations (1) - (7) are for the special case of a lossless transmission medium which
can be closely approximated under some conditions (e.g., between two aircraft). For thecase of ground-wave propagation, however, there are several sources of loss which serve
to attenuate the signal:
The earth is not flat. Beyond a certain distance 2 from the transmitter, the
receiver will see only the small fraction of the signal that is diffracted around 0
2Te suandard rule of thumb is that the earth may be treated as flat out to a distae d - 80/fIl/3 where dis in km and f in MHz. For the HF bad, this "flat earth region" extends to 55 km at 3 MHz. and to26 km at 30 MHz.
6
UNCLASSIFIED
. . . .. . .

UNCLASSIFIED
the curvature of the spherical earth. This fraction will decrease with increasingdistance.
& The atmosphere absorbs part of tae signal, to a degree determined by thetemperature, pressure, and (particularly) humidity. This loss is not significantat BF, but becomes extremely important at VHF and above.
* The HF ground wave clings to the surface of the earth, and the earth absorbsenergy from the wave. The amount of loss depends in a complicated mamnron the terrain and on the physical properties of the surface.3 The loss isgreatest for dry ground, and lowest for sea water.
When these loses are included, Equatioras (1) and (5) become
(8)
PR PT -4xD) L (9)
where L is the loss factor which accounts for the excess loss over free-space propagation.
Curves showing the field strength as a function of distance and frequency for avariety of surface conditions have been published by the CCIR (Ref. 2). Three of these,for dry ground, normal ground, and sea water, are shown in Figs. 1-3. Note that:
3 For a detailed discussion of fit loss, complete with graphs, tables, aid computational aids, see may of
the three books by Tegmm (Refencs 10-12).
7
UNCLASSIFIED

UNCLASSIFIED
t~It
tgm/Afflipm 2gumpt
8
UNCLASSIFIED

UNCLASSIFIED
(u/All) R*-I§ PPtd
ItI
v tIItI
...... ......... . . . . . . . . . . .
4ý I11ý
*~- I(,~)p I~u I0
9o
UNCLASSIFIED-
AS

UNCLASSIFIED
(u/Al)I qmPPsJ
0
100
UNCLASSIFIED
UNCLASSIFIED
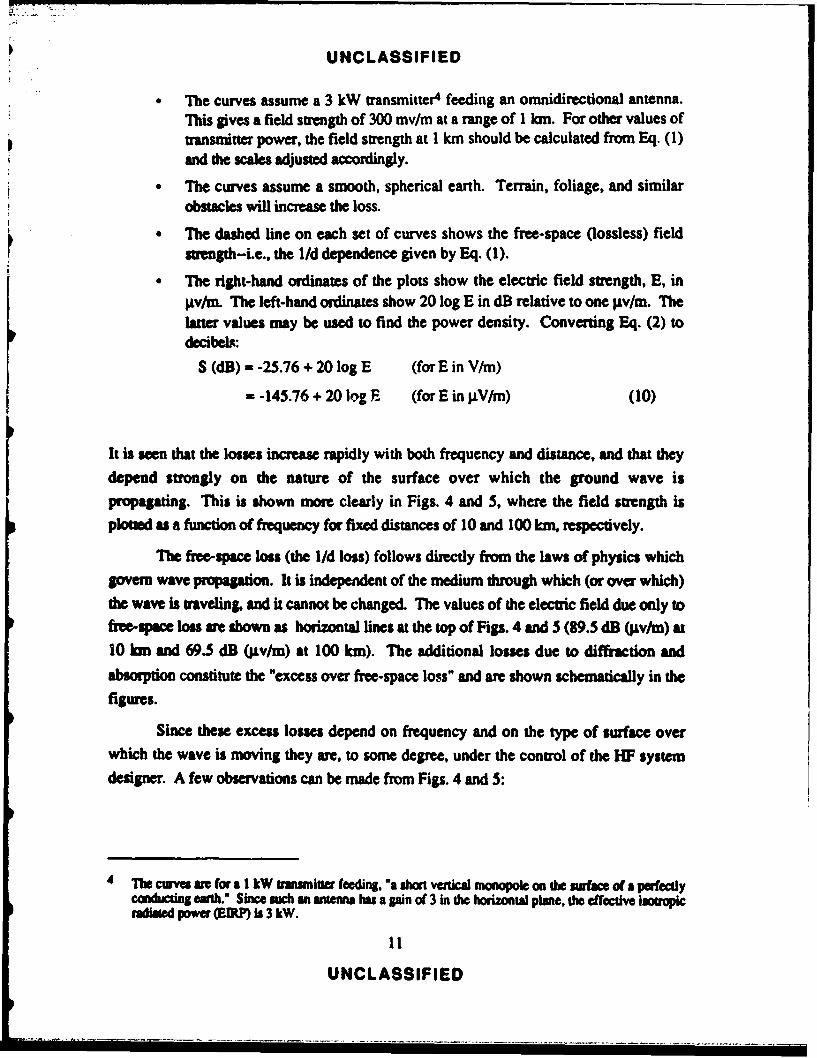
The curves assume a 3 kW transmitter4 feeding an omnidirectional antenna.This gives a field strength of 300 mv/m at a range of I Ian. For other values ofransmiuer power, the field strength at I kfn should be calculated from Eq. (1)
and the scales adjusted accordingly.
The curves assume a smooth, spherical earth. Terrain, foliage, and similarobstacles will increase the loss.
" The dashed line on each set of curves shows the free-space (lossless) fieldsu gth-Le., the l/d dependence given by Eq. (1).
" The right-hand ordinates of the plots show the electric field strength, E, inpv/n. The left-hand ordinates show 20 log E in dB relative to one jiv/m. Thelatter values may be used to find the power density. Converting Eq. (2) todecibel:
S (dB) - -25.76 + 20 log E (for E in V/m)
- -145.76 + 20 log E (for E in nV/m) (10)
It is een that the losses increase rapidly with both frequency and distance, and that they
depend strongly on the nature of the surface over which the ground wave ispropagating. This is shown morm clearly in Figs. 4 and 5, where the field strength is
ploted as a function of frequency for fixed distances of 10 and 100 kn, respectively.
The free-space loss (the I/d loss) follows directly from the laws of physics whichgovern wave propagation. I is independent of the medium through which (or over which)the wave is traveling, and it cannot be changed. The values of the electric field due only tofree-space loss are shown as horizontal lines at the top of Figs. 4 and 5 (89.5 dB (iv/m) at10 km and 69.5 dB (0xv/m) at 100 kin). The additional losses due to diffraction and
absorption constitute the "excess over free-space loss" and are shown schematically in thefigures.
Since these excess losses depend on frequency and on the type of surface overwhich the wave is moving they are, to some degree, under the control of the BF systemdesigner. A few observations can be made from Figs. 4 and 5:
SThe cuives arm for a 1 kW trinsiner feeding, a short vertical monopole on the surface of a perfecalyconducting emh." Since such an antema hs a gain of 3 in the horizonta plane, the effective botpcradiaoed power (ERIP) Is 3 kW.
UNCLASSIFIED

UNCLASSIFIED
90 S-•go '4W ATER
FREE SPACE80 E=82.5 dfl(g~v/m) I-
EXCESS OVER
70 ____ FREE-SPACE LOSS
50
60
_____ .___ ____ NORMAL GROUND
DRY GROUN
300
20 _____ - ____ ____ -
20
10 -
0 10 20 30 5
FREQUENCY, MHZ
Figure 4. Field Strength at DN10 km
12
UNCLASSIFIED

UNCLASSIFIED
FREE SPAtCEso E*69.5 dB (iLv/m)
* FREESS OVER~20 _FREE-SPACE LOSS
* a~1 0 _ _
* .300 10 20 30
FREQUENCY, MHZ
Flgure 5. MMel Strength at WuOO kmn
13
UNCLASSIFIED

UNCLASSIFIED 0
"Sea water behaves like an almost perfect conductor, and has the lowest loss ofall real-world surfaces. At 10 kin, there is no excess loss over that offree-space for frequencies up to about 15 MHz, and less than 5 dB excess lossat 30 MHz. Beyond this distance, the excess loss does increase, but it isalmost entirely caused by diffraction around the curvature of the earth ratherthan by absorption.
"Surfaces other than sea water have significantly higher values of excess loss,as shown in Table 2, for a distance of 10 kIn.
Table z. Excess Over Free-Space Los at 1 km
Frequency (MHz)
Surfase 3 10 s0
Sea wofr 0 0 4 dB
FreshwaWr 17.5 dB 28 dB 37.5 dB
Normal Wound 6 €dB 29 dB 45 dB
Dry growund 40 dB 51 dB 60.5 dB
9 Figs. 4 and 5. as well as Table 2, show that minimum loss and, therefore,maximum ground wave range are achieved by operating at the lowest possiblefrequency.'
One other example may serve to emphasize the severe restrictions of ground waveprpmgalion: Reliable radio reception in a quiet rural area requires a signal field strength of1 mv/m (103 &tv/m). Fig. 3 shows that the 3 kW (EIRP) transmitter postulated by the
CCIR. operating over sea water at a frequency of 10 MHz, will provide satisfactory seviceout to a range of 115 Im The same transnmtter operating over normal ground will have arange of only 10 kin, and over dry ground the ground wave range will be less than 3 km.In order to realize the same range over normal ground as over sea water (115 kin), thetrasmtter power would have to be increased by 50 dB-frorn 3 kW to 300 MW!
S
This is eoe of the rem t tatte cmu~ial AM d = c bud is in the frequncy tw from 0.
1.6 MHz.
14
UNCLASSIFIED

UNCLASSIFIED
C. SKY WAVE PROPAGATION
The long-haul capabilities of the HF band result from the fact that, under certaincircumstances, frequencies from 3 to 25 MHz may be reflected from the ionosphere, an
ionized area in the earth's upper atmosphere. The ionization is largely the result ofultraviolet radiation from the sun, varies over wide limits, and is extremely hard to predictsince there are not only diurnal and annual variations, but also variations with the I 1-yearsunspot cycle, meteor showers, and various ionospheric disturbances that occur near thepoles. The ionosphere consists of several layers with differing degrees of ionization(electron density), as shown in Fig. 6.
The diurnal variation of the ionosphere is clearly seen in these diagrams. The layersand their characteristics are:6
D ei At heights from 50 to 90 kin, this layer exists only during daylight hours,and the ionization density varies directly with the elevation angle of the sun. TheD layer reflects VLP and LF waves, absorbs MF waves, and partially absorbs HF
0 waves. 7
La=xr. At a height of about 110 km. the ionization of this layer correspondsclosely with the elevation angle of the sun. It reflects both Mf and HF waves, andis "mlrta•t for IHF daytime propagation at distances less than 1,500 km and forMF night time propagation at distances in excess of 150 km.
Snoradic E Layer (not shown . Unpredictable irregular cloud-like areas ofunusually high ionization which may occur more than 30 percent of the time undercertain circumstances. May absorb frequencies that would normally reach higherlayers, and may also cause long-distance propagation at BF and VHF.3
* .L.,xaz. At heights of about 175 to 250 km, this layer exists only duringdayli•ht. It will occasionally reflect HF waves, but usually serves only to provideadditional absorption (attenuation) to waves that are subsequently reflected by the12 layer.
2 Uver. At heights from about 250 to 400 krm, this layer is the principalreflecting region for long-distance HF communication. The height and ionizationvery diunally, maually, and with the sunspot cycle, but are more constant than forthe othr layers. At night, the Fl and 2 layers merge at a height of about 300 kmn
6 AdWW et , RdeJac 6.7 TMw hquency bonds am defined as folows: VLF - 3-30 kHz; L. - 30-300 kHz; MF - 0.3-3 MHz;
H1. - 3.30 MHz; VHF - JO-300 MHM.I In 1969 dl. anthor, opeang ma AN/VRC46 VHF radio from his jeep in Korea, found himself in
comnac widi a Med Evac radio not in Vienam, at a unise of more tham 3,500 kn. This was clery tmuat o/' o r moma reflhctiom from very strong sporadic E layers.
15
UNCLASSIFIED

UNCLASSIFIED 4
H-- toyer E-aco)usu~i Oo0y (b) Usual Might (c) ~Occ-2ionaI
- V C*Enolticlis COnoahonaM NicntCmnaitions
Somre: Reference 10.
Figure Go. Profiles Showing Variation of Ionization with Height
To Sun
3 06k?N
two
NI~h.
Source: Reference 3.
Figure Sb. Schemnatic Representation of Ionized Layers
16
UNCLASSIFIED

UNCLASSIFIED
A radio wave incident on the ionosphere will be bent (refracted) and, if the
ionization density is high enough and the frequency low enough, will be turned around and
will return to earth. This is shown schematically in Fig. 7.
The radio wave actually follows a curved path in the ionosphere but, for most
purposes, it may be considered as a single reflection from a surface at the virtual height h,
as shown above. The degree of refraction (bending) is determined by the refractive index p
which is given by:
P where: - Refractive index
N = Electron density (electrons/cm 3)
f = Frequency (kHz)
As shown by Eq. (11), the refractive index increases with increasing ionization
(N), and decreases with increasing frequency.
If a radio wave is launched vertically, as shown in Fig. 7 (b), there is a highestfrequency at which the wave will asill be reflected back to earth. This is called the critical
frequency, fc. Frequencies higher than fc pass through the layer. For oblique incidence,
the wave spends a longer time in the ionosphere, and higher frequencies will be reflected.
The highest frequency which will be reflected is called the Maximum Usable Frequency
(MUF) and is given by:
MUF = fc sec O (12)
where: fc = critical frequency
-o - angle of incidence (see Fig. 7)
This establishes the maximum frequency at which communication can be
established for a given range. It varies widely since both fc and the height of the layer (and
hencr #o) vary with the time of day, season, latitude, and sunspot cyc!t, in addition to
frequent abnormal variations.
As the frequency is decreased, the ambient radio noise level and the ionospheric
absorption both increase until a point is reached at which the transmitter power required for
17
UNCLASSIFIED

UNCLASSIFIED
.......sph....e
'-Lower edge of"icrz sph ere
Source: Reqererce 10.Flgurm 7a. Refraction of RadIO Wave In the Ionosphere
A
Soure: efeened10.
Vigerhc:/t Reflecio at hiaiHaght h
incidnce18
pGA'7- ASIFIE

UNCLASSIFIED
satisfactory communication becomes ur.economically high. This point is not as precisely
determined as the MUF, but establishes a practical lower limit called the Lowest Useful
Frequency (LUF).
Curves showing predicted values of the MUF and LUF are published regularly bythe CCIR and the National Bureau of Standards (now the National Institute of Standardsand Technology) among others. A typical set is shown in Fig. 8.
MUF30 u
25
20
10
0 8",,I 12 Is 20 24
LOCAL TIME (HOURS)
Figure 8. Typical MUF and LUF Curves
Several conclusions can be drawn fion these curves:The range of usable sky-wave frequencies is not great during the day, and ismuch narrower at night.
19
UNCLASSIFIED

UNCLASSIFIED 0
At least two frequency changes per day will be required: from daytime tonighttime frequency and back again. If the band is crowded, as it usually is,additional changes may be required.
If the daytime frequency is chosen as high as possible in order to takeadvantage of the lower noise levels at higher frequencies, even more frequencychanges will be required.
It should also be noted that the MUF is strongly dependent on the 11 -year sunspot 0
cycle. During a sunspot maximum, when the ionospheric ionization levels are at their
highest, the daytime MUF values will increase due to increased refraction, and the
nighttime MUF values will decrease due to increased absorption. This is shown in Fig. 9.
3i 1 .1 X
Ii I i \ -I- -
III -maximu I
.L~~au do - r.I _ __ I * **I ** I I I_ _
w S. C I E', I I I,.II iU ,,i I. •SUNSPOT_
Zc I I I' ! SNB'UM
I,. A I. TI .
Fiur I i. Efet ulpt AIlvt oMU0 a 1* *2 a s 4 1* to 20 33 34
LOCAL rIME.
Source: Reference 9.
Figure 9. Effect of Sunspot Activity an MUF
At certain times, the nighttime MUF may be equal to or lower than the LUF, 0making HF communications difficult if not impossible.
Typical paths for sky-wave signals are shown in Fig. 10.
20
UNCLASSIFIED

UNCLASSIFIED
CHWASHI ONG1F2. . . .. ..•.- -....... ... \I
SWAAHINGTON
SAN F'At4C!CO
Source: Reference 6.
Figure 10. Sky Wave Transmisnion Pathst
The upper curve shows a path from Denver to Chicago using a single reflectionfrom the E layer, and a path from Denver to Washington using a single reflection from the1F2 layer. A wave launched at a higher angle or a higher frequency (path 3) will penetratethe ionosphere and be lost. Multiple reflections are possible, and the lower diagram showsat two-hop path from San Francisco to Washington using the 1F2 layer. In all these cases,there will also be a pround wave which will extend out from the transmitt~er to a range of50-100 ki.. The region between the end of the ground wave and the point ax which the skywave returns to earth is called the "skip distance" and no signal will be received there. Ifcommunication in this region is required, it may be possible by changing the take-off angle
or the frequency of the trasmiter.
The actual transmission paths are considerably more complicated than the onesshown in Fig. 10. In the first place, the height and degree of ionization of the layers willvary not only diurnally and annually, but also with latitude and longitude along thetranmission path. In addition, other transmission paths are possible: three- and four-hoppaths ar possble although not common, and waves can become trapped between the E and
21
UNCLASSIFIED
SAIFA4CC

UNCLASSIFIED
F layers and travel for considerable distances before returning to earth. These paths are
essentially unpredictable and, despite all the work that has been done, HF communication
remains as much an an as a science.
D. SIGNAL PROPAGATION AND INTERFERENCE
Eq. 9 of Section B shows the received signal power for the special case of isotropic
antennas at both the transmitter and receiver. When directional antennas are used, this
become:
R PT GTR GRT ( 2
S 2L 41t 4DTRTR (13)
where: RS = Received signal power (Watts)
PT = Transmitter Power (Watts)
GTR - Gain of the transnitter antenna in the direction of the receiver
GRT = Gain of the receiver antenna in the direction of the transmitter
DTrR - Distance from transmitter to receiver (meters)
LTrR - Excess loss over ideal free-space propagation, for the path from the
transmitter to the receiver.
Interference to radio reception ma:, come from many sources: natural noise, man-
made roise, or deliberate jamming.9 Regardless of the nature of the interference, the result
will be a reduction in the signal-to-noise (or signal-to-interference) ratio at the receiver, and
the introduction of errors into the received message.
The interference power which enters the receiver and affects system performance is,
by analogy to Eq. (13):
R P R G RI G R
'D tLmB (14)
where: R, = Received interference power (Watts)
9 For a discussion of noise sources, see IDA Paper P-2170, Radio Communication in the High
Freqswey Band
22
UNCLASSIFIED

UNCLASSIFIED
P1 - Power of interferer (Watts)
GIR = Gain of interferer antenna in the directions of the receiver
GRI = Gain of receiver antenna in the direction of the interferer
%tR = Distance from interferer to receiver
LIR "= Excess loss over ideal free-space propagation, for the path from the
interfere to the receiver
B = Bandwidth filter factor
The bandwidth filter factor B is a measure of the effectiveness of the bandpass
filters in the receiver, and is a function of both the bandwidth of the bandpass filter, BR,
and the bandwidth of the interfering signal, BI. If the entire interfering signal is included in
the receiver passband, then B = 1. If the bandwidth of the interfering signal is wider than
the receiver passband, then, to a first approximation, B = BI/BR.10 This term will be
particularly important when spread-spectrum ECM techniques are considered.
The signal-to-interference ratio at the receiver is then given by1I
S RSD (15)
PT GTR GRT LIR I DIR )2
IG GRITR k5(16)
The balance of this paper will be devoted to discussing how the terms in this
equation can be manipulated so as to increase the S/I ratio and thus improve the
performance of the radio link.
E. TRANSMI1TER POWER
It is clear that increasing the transmitter power (PT) will improve the S/I ratio, and
there is essentially no limit to the maximum power which can be obtained. Commercial HF
10 This is valid if both the signal and interference have flat (Gaussian) spectra, and will apply to thevuoum mpread-spectnum wavefonns to be considered later.
t It has been tacitly aaumed dtat the interference is significantly stronger than natural noise sources such
M benal (KTB) or comic noise, since the purpose of this paper is to discuss countermeasws againstintrference or jamming. If dhe natural noise sources are included, Eq. 15 becomes S/I - Rs/(N + RI).
23
UNCLASSIFIED

UNCLASSIFIED
transmitters are available with output powers up to 100 kW, and OTH radar systems uselarge arrays of antennas and transmitters with output powers measured in megawatts.
There are, however, several practical limits:
Size and weight constrain the maximum power which can be used for certainmilitary applications to the following limits:
Portable : <50W
Mobile : < 5 kW
Fixed : No ILinit
The maximum efficiency of a transmitter, using the most efficient modulation(FM or single-sideband AM) is about 60%. Increasing the output powerrequires a corresponding increase in the size of the power source (batteries orgenerators), which further limits mobility.
increasing the transmitter power also increases the vulnerability to interceptionof the signal by the enemy and to possible exploitation or countermeasures.Although control of transmitter power is a standard ECCM technique, there isno point to providing power that will never be used.
F. EXCESS LOSS TERMS
The loss terms (Liit and LTR) are not generally under the control of the system
engineer, since radio sites are chosen to meet tactical or strategic objectives rather than toprovide low-loss transmission paths. However, the effects of diffraction and absorption
should be kept in mind:
"* Whenever possible, transmission paths should be chosen over water or overmoist ground.
" Naval ship-to-ship or ship-to-shore HF radio links will have minimum lossand should operate reliably. Ground-to-ground links over dry sand (such as inSaudi Arabia), on the other hand, will experience high losses. This should be Srecognized in advance so that corrective measures, such as higher transmitterpower or higher antenna gain, can be used.
A ground-to-ground link being jammed by an airborne jammer represents theworst possible case since LTR will be high and Lgt will be equal to I (i.e., no 9excess over free-space loss).12
12 Zero dB loss, in the form in which the equation is normally used.
24
UNCLASSIFIED

UNCLASSIFIED
G. DISTANCE TERMS
The two distances, DIt and DI", are also terms over which the system designer
generally has no control, although they are very important because they appear as squared
terms in Eq. (16). Thus, a 2:1 change in either of the distances yields a 4:1 change in the
S/M ratio. A few general considerations might apply:
" Keep all receiver sites as far as possible from sources of man-madeinterference (power lines, industrial machinery, etc.).
"* Take whatever steps are necessary to keep enemy jammers at the greatestpossible distance.
• For marginal radio links, consider the use of a relay, thus breaking D>m downinto two showrte legs.
H. ANTENNA GAIN
Of the four antenna gain terms, three can be controlled by the system designer or
operator. The goal would be for GTR to have a beam (lobe) in the direction of the receiver,
for ORT to have a beam in the direction of the tasmitter, and for Clu to have a null in thedirecdon of the interferer. 13
The rest of this section will discuss the characteristics of several types of Hp
antennas, some simple enough to be used in tactical applications and others which have
better performance parameters but which would be suitable only for transportable or fixed
insallations. First, however, there are some considerations which apply to all antennas:
* Six. -F antennas tend to be large. The gain and size of an antenna are related
G =4CA (17)
where: G - Gain
X = Wavelength (meters)
Ae - Effective area of the antenna (typically 50 to 80% of it.. actual physical
ros-secional on)14
13 ORT and ORI we both provided by die receiving antenna. If the angular seWparon between thebuntonita mid the inierferer is lap enough (10" or more), both conditions can be me.
14 For thin antennas such as whips or dipoles the effective area is approximately X./2, where ), is thewavelength and L the lenth o( the antenna.
25
UNCLASSIFIED

UNCLASSIFIED
"Tus, to achieve again of 10at afrequency of 10M& X 30 m), Acmust be about
715mn2. The physical area must be about 1200m2, and the typical linear dimensions will be33Sm.
FPolarizatlon. Should be vertical for ground-wave propagation, since anyhorizontal component of the wave will be quickly absorbed by the surface overwhich it passes. For sky-wave links, either polarization may be used. Thewave reflected from the ionosphere will be elliptically polarized, regardless oftie polarizition of the incident wave.
Iakkeo[.A~nga The angle between the main beamn of the antenna and theground should be as small as possible for ground-wave propagation. Forsky-wave operation the optimum angle depends on the length of the path andthe height of the reflecting layer, as shown in Figure 11.
90 - - --
4 I s o-4 i U 36w
Figure 11. VesuicalRadlation Amglea for One-Hop Circuits
Horizontally polarized antennas are generally used for sky-wave applicatiossiethey can be made to raiame effectvely at high angles.
(1) VVMR Anfmnaa. The short whip is the leant efficient of all the antennas tobe discussed, but it is often used with portabl andl mobile radios since it requires no setup,and can be opwraed while moving. The pattern of an isolated whip is a toru centered onthe whip, with a null in the axial directiolL When wmoutdin & vehicl, the vehicle act asit conducting ground plane and distorts the pattern. Thus, for example, a whip mounted atthe left rear comne of a vehicle will have a small pattern maximum in the direction of theright frnmt corner of the vehicle.
26
UNCLASSIFIED

* UNCLASSIFIED
For the ideal case of an antenna on a perfectly conducting ground plane, the whiphas an omnidiracdonal pattern in the horizontal plane, and a vertical pattern as shown in
* Ftgure 12.
* Source: Terman, Reference 10
Figure 12. Vertical Pattern 01 Whip Antenna
The coirs•ponding gpins are sh, own in Table 3:
Table 3. Gain of Short Antennas(relative to Isotropic antenna)
Antenna Gain Gain (dB)
* Iotro n free sace 1 0
Shortw *p 3 4.0
OLaatrwave whip 3.3 6.2
Si
(2) inal..Ant=.na The basic dipole is a thin linear antenna fed at its centerpoint by a balanced anuission line, as shown in Figure 13.
Figure 13, Basei Dipole Antenna
27
UNCLASSIFIED
0

UNCLASSIFIED
The antenna pattern is a strong function of the length L and of the LUD ratio.IS For
the present discussion we will consider only the half-wave thin-wire case
(L = )=2, LiD - 00). For such a dipole in free space, the pattern is a torus centered on the
antenna, with a null at each end in the axial direction. The gain is 1.65 (2.15 dB). The
dipole may be oriented either horizontally or vertically.
If the dipole is located close to the ground, the direct radiation from the antenna and
the teflected radatioe from the ground interact in a fairly complicated way to create lobes
and nulls in the vertical pattern.1" For the case of a half-wave horizontal dipole located a
half wavelengh above the ground, the resultant pattern is shown in Fig. 14. The gain is
now about 8 dB relative to iotropic.
5AVWfI iWAI OF
Horizontal Pattern Vertical Pattern•
Sourme: Reference .
Figure 14. DlrectPvlty Patterns for Dipole Antenna
One-Half Wavelength Above Perfect Ground Plane
Note that there is now a null in the vertical direction, and that the pattern consists of two
fairly broad beams at right angles to the axis of the antenna, each tilted upward at an angleof about 30*. This take-off angle is suitable for many sky-wave applications (see
Fig. 11).
$ See, fix example, J3ik pssnagneinf 1.adtk, Pp. 3-8.3-9.
16 See Inik Ansm Ingi• p•Il. 21.4ff or Ternna Radio Eni~ner Handbook, p%. 788ff.•
28
UNCLASSIFIED

UNCLASSIFIED
(3) Arrays nf S.imnl@ Antennas. The monopole (whip) and dipole antennashave omnidirectional radiation patterns in the plane normal to their axes, and provide nosignificant gain or directionality. However, arrays of these simple antennas, properlyspaced and properly phased, can provide somn remarkably sharp beam patterns.
For the simplest case of only two antennas, the radiation paterns17 for severalvalues of separation (d) and phase shift between the antennas (*) are shown in Fig. 15.
IOr
II
(a) du)J.. * aO (b) d u /.*u =lWo
Io
11) d 2,0, 1(d) a1/4. , 90"
Source: Referene 7.
Figure 15. Field Patterns for Palm of isotropic Radiators,Spaced by a Distance d and With a Phase Differn *e #
17 These ar actwally the "any patterns of seu of infinitesimally mull isotropic raiator. The patemof a real aray is found by mulw/plying the array pattern by the radiation pttern of the actual antennaelement. For simple antema elements with omnidirectional patem (monoples or dipoles), the actualhorizon rdiamion pmn will be the mine as the amray poem.
29
UNCLASSIFIED

UNCLASSIFIED -
The array at (a) is called a "broadside array" because its main lobes are normal to thedirection of the array, (b) is callAd an "end-fire" array, and (d) is producing a cardioid
pattern.
These simple arrays are easy to construct: two vertical guyed masts, each a quarter-wave tall, insulated from the ground, and fed at the bottom end. The patterns are such that,under mpny circumsances, they can be used to provide modest gain in the desired directionand/or a fairly sharp and deep null in the direction of an interferer. •
The beam sharpness is improved by ir.creasing the number of elements in the army.Fig. 16 (a) and (b) show the patterns for 4-element broadside and end-fire arrays, and (c)shows the patters for broadside arrays of up to 16 elements. The array gain (i.e., the gain ,compared to that of a single array element) is shown in Fig. 16 (d).
Arrays of simple anteinas such as these can provide very useful directivities but, asnoted earlier, they tend :o be large. To achieve 10 dB of gain, an array must be about fivewavelengths loag. Such a broadside array at 10 MHz (X = 30 m) would consist of eleven •towers, each 7.5 m tall, and extending over a length of 150 m.
The Over-the-Horizon (OTfl) radars now being built by both the United States andthe USSR use arra); of simple antennas like those described here, but carried to trulyimpressive extremes. As an example, consider the transmit antenna of the radar site atMoscow Air Fome Station in Maine. The entire antenna is 1106 m long, and varies inheight fiom 10 to 41 m. It is divided into six sub-arrays, each tuned to a separate portionof the 5-28 MHz band. Each sub-array consists of 12 dipoles, spaced at half-waveintervals, and driven in-phase to provide a broadside radiation pattern with a beamwidth of 07.50. A buried metallic ground screen extends for 230 m in front of the array to providethe equivalent of a "perfectly conducting earth," and a reflecting screen is placed behind thedipole array to convert the basic bidirectional pattern of the array into a single main beam.Since the phase of each antenna element can be separately controlled, the beam can be •scanned over a 600 sector.18 The receive antenna, located at Columbia Air Force Station inMaine, is even larger. The backscreen is 1517 m long by 20 m high, and there are246 vertical monopole antenna elements, divided into three sub-arrays to cover the5-28 MHz band. The receive beamwidth is 2.50 and, as with the transmit array, the beam 0can be scanned over a 600 sector.
18 Th7s is a "phased arry antenna," which will be discussed in detal in the next section of this paper. 0
30
UNCLASSIFIED
0'

UNCLASSIFIED
\
1 o I IiIiI *I't-]I Iil I I I I
S(a) d- * n 4 (b) dm ,18O*m n 4
S• --" II II "- - -40 I~~
30 .,"
35 1S E~e speIn . -
10 v-0
10 v
4 6 $ 10 12 14 16Army Lw• in Wave L~engths
n-4 8 12 16(c) d m W,,/ * = 00 (d) Amry Gain
Sources: Reference 7Reference S
Figure 1I. Field Patterns for Multi.Element Arrays of Isotropic Radiators
31
UNCLASSIFIED

UNCLASSIFIED
(4) AdaflAve AMrS It was shown in the last section that an array of antenna
elements spaced at half-wavelength intervals and driven in-phase produces a broadside
pattem, and that the same array with the elements driven 900 out of phase produces an end-
fire pattern. It would seem logical that arrays with other element spacings and/or other
phase shifts would prudce beams at internediate angles, and this is in fact the case.
Consider the general case of an array of N elements equally spaced a distance d
apart. Each element has its own associated phase shifter, as shown in Fig. 17: 0
Figure 17. Linear Array of N Elements
32
UNCLASSIFIErn

UNCLASSIFIED
If this is a receiving array, and if the t.ansmitter is very far away, 19 the incoming
signal will appear to be a plane wave as shown in the figure. The signal arriving at the nth
clement will be delayed with respect to t*,-. 0th element by a distance:
Sn = nd sinO (18)
or, in other words, it will be delayed in time by an amount:
= (19)
and will experience a phase delay Ziven ly:
X ,(20)
To combine the signals from all the antenna elements in phase in order to produce a
maximum response, the phase shifters shown in Fig. 17 should be set to:
S2nd sin On X (21)
This combination of phse shifts produces a .•aximum antenna response (i.e., a receive
beam) at an angle 0.
Such antennas are called phased array and are widely used because the beam
pointing angle can be changed instantaneously by cianging the settings of the phase
shifters. No mechanical movement of the antenna is required.
Other modes of operation are possible:
If every other phase shifter is shifted by 1800 (?t/2), then the signals from eachadjacent pair will cancel each otier out, and the net output of the array will bezero. A null will have been formed in the 0 direction.
19 The disance must be grealtr than 2L2/A., where L (=Nd) is the apertr of the antenna ary.
33
UNCLASSIFIED

UNCLASSIFIED
Other combinations of phase shifter settings will form multiple simultaneousbeams and/or nulls from the same array. In fact, with an N- element array, !t ispossible to form N-I independent beams or nulls.
The simple approach described above will, in fact, form beams and nulls asdescribed, but will also generate large and undesirable sidelobes. In actual arrays, both thephase and the amplitude of each element are controlled according to complex algorithms2in order to produce the desired antenna pattern with minimum sidelobes.
It should also be noted that all of the components of the array in Fig. 17 are linearand reciprocal (i.e., reversible), so that the array can be used equally well for transmittingor nceiving. If, for example, the array of Fig. 17 were used as a transmitting antenna withthe phase shifters set according to Eq. 21, then the signals radiated from all of the elementswill add in phase to produce a transmit beam in the direction 0.
One final capability can be added to army antennas if it is possible for the receiverto distinguish the desired signal(s) from all the other signals, interferers, and jammers thatit may see.21 In this case it is possible, under computer control, to set the amplitudes andphases of the antenna elements so as to maximize the received S/I ratio. The net result willbe to automatically form beams in the directions of the desired signids and nulls in thedirections of the wajor sources of interference. This is called an adaptive array. Theperformance of such an array is shown in Fig. 18.22
0
20 7U ixcM is called tpering.21 This can be accomplished by adding a pilot tone or a special code to te desired signalor. in the cuse of
Direct.Sequence Special Spectrum Signals (see page 54ff) by using the spreading code itself.22 Taken from Hans Steyskal "Army Error Effects in Adaptive Beam Forming," Microwave Journal.
September 1991.
34
UNCLASSIFIED
0

UNCLASSIFIED
Signal Interforer
- - -WITH INTERFERENCE
-10 , d 9P40 =40 o :II
I-5
J40
II
J0 -do -1 0 1720 I
BEAM ANGLE (0)
Figure 18. Normal and Adapted Antenna Patternsfor a 24-Element Array with )/2 Spacing
In this case, the desired signal is located on the axis of the antenna at 00 and the
interfering signal, which is 30 dB stronger, is at an angle of + 170. In the normal
(unadapted) mode, the interferer is at the peak of one of the sidelobes of the antenna. After
adaptation, a null of more than 60 dB has been formed to cancel out the inte:fering signal.
In practice, this process would take place instantaneously and continually, to handle
multiple interfer's and to adapt to motion of both the desired and interfering signals.
Bodt phased arrays and adaptve arrays are widely used in radar antennas since they
can form multiple beams, allow instantaneous beam shifting, and can have special features
such as track-while-scan. The search and track antennas on military aircraft are almost
invariably phased arrays, as are the Pave Paws early-warning radars.23 They may also be
used for special HF systems such as OTH radars, but their use for more general
applications at HF is problematical because of the size and complexity of both the phase
shifters and the arrays themselves.
23 And drk jpps Knrjuogygk rudar.
35
UNCLASSIFIED

UNCLASSIFIED 0
(S) Long Wire Antennas. A resonant wire antenna is one that is an integral
number of half wavelengths long, and is open (i.e., not grounded) at both ends. When
such an antenna is fed from one end, standing waves will be generated along the line.24
The radiation patterns, for lengths of ,2 to 8X, arm shown in Fig. 19.
Lengtha½. Length z Length alI
-- 4-
Lmnkh 4 2) Lengh a 5 Leneth a $A
Figure 19. FIeld Pa•tem of Resonant Wire Antenna In Free Spce
The actual radiation pattern is, of course, the figure of revolution of the cross
section shown above about the axis of the antenna, and appears in general as a series of
nested coaxial cones. The total number of conical lobet in each pattern is equal to the
length of the line in half-wavelengths (i.e., 1, 2, 3, 4, 10, and 16 for the examples in Fig. 0
19).
If the line is terminated at one end in its characteristic resistance, waves traveling
down the line will be absorbed rather than reflected, and there will be no standing waves.
The line is then said to be "nonresonant" and the radiation patterns for two such lines are
shown in Fig. 20.
24 hmf remt from & he addition of the sipga fed from one end and the wave efilectd from th oteend .
36
UNCLASSIFIED

UNCLASSIFIED
.Am'lenna wireAre a
wire
•L=4 .
L=ZX
Figure 20. Field Pattern of Nonresonant Wire Antenna In Free Space
Again, the three-dimensional patterns look like nested cones, and the number of lobes in
each pattern is equal to the length of the line in half-wavelengths. There are, however,
several significant new features for the nonresonant long-wire antenna.
"• Half of the power fed to the antenna will be dissipated in beat in the tem~inatingresistor.
" Whereas the pattern of the resonant antenna was bidirectional, the nonresonantantenna concentrates its energy in one direction (to the right in Fig. 20).
Since the antenna is nonresonant, the length is less critical. Although Fig. 18shows the patterns for lengths of 2X and 4%, the patterns for intermediatelengths will not differ significantly from the ones shown. Conversely, for anantenna of fixed length, the pattern will change only slowly with frequency,and the antenna can be used over a much broader bandwidth.
Long-wire antennas are not widely used both because the conical (or biconical)
patterns do not lend themselves well to either area broadcast or point-to-point applications,
and because the antenna pattern is dependent on the frequency and/or wire length.
37
UNCLASSIFIED

UNCLASSIFIED
However, they also form the basis for two of the most important types of HF antennas: the
V and the rhombic.
(6)Ln If two long wire antennas are arranged to form a V with the
apex angle equal to twice the angle that the first lobe in the pattern of the long wire antenna
makes with the wine, then the radiation lobes on the line bisecting the V will reinforce each
other, and the lobes in other directions will tend to cancel. For a two-wavelength long
wire, the angle of the first lobe is 360 (see Fig. 19), and the resultant patterns for a V
antenna with an apex angle of 72? is shown in Fig. 21.
Note that the resonant V antenna has a bidirectional pattem, while the terminated V
has only a single main lobe. The latter pattern is preferable for most applications but, as 0before, half of the transmitter power is dissipated as heat in the terminating resistors.25
fbi
Soume: Ference 5.
Figure 21. Field PattoMr Of (a) Resonant Two-WavelengthV Antenna; (b) Terminated Two.Wavelength V Antenna
25 The uniditrcional pattM may alo be obtinmd by sng a secWOd V Mim located u4 behidthefirst antenna, and feeding the two antennm 90" out of plme. This ea.flre V array is morecwmplcawd, but saves die pow whkh would oth•wise be wastd In doe tminag fesai .
38
UNCLASSIFIED

UNCLASSIFIED
As the legs of the V arn made longer, the lobes of the two long-wire antennas move
closer to their axes and becom narrower and stronger, and the gain of the V antenna will
increase. This is shown in Fig. 22 where it is seen that a five-wavelength antenna (150 m
legs at a frequency of 10 MHz) has a gain of almost 9 dB over that of a half-wave dipole,
orabou II dB over an isotrpc antenna.
Ii
.:Length ,fWfr-e 6n 8Wo LengAt8
Source: Refeence 10.
3 Figure 22a. Angie Of Fhst Lobe Of Long-Wire Antenna
:1 1: I ,
E40
i I., N• OFMX L" I WA ENG•
Source: Reference 10.
S ~Figure 22b. Directive Gain of V-Seim Antenna
39
UNCLASSIFIED

UNCLASSIFIED 0
(7) RRMbhLAjd, m Rhombics are widely used for long-haul point-to-point
HF chiuts between fixed stations because they are relatively simple to install and maintain,
provide high gain at moderate cost, and can operate over a relatively wide frequency band.
The rhombic antenna consists of two V antennas (or four long-wir antennas) connected as
shown in Fig. 23.
9
(V) ( el
(b)MS
Scums: Ruetmna. 7.
Figure 23. Termnnated Rhomblc Antenna (a) With Azimuthal Pattern(b) and Vertical Plane Pattern (c) for a Rhomblc 6 Wavelengths Long
em Each Leg, # a 700, and at a Height of 1.1 WavelengthsAbove a Perfectly Conducting Ground (After A. E. Harper)
A single terminating resistor, located as shown, makes the antenna nonresonant. If theprmeters L and # am chosen properly, the radiation lobes of the four long-wire antennaswill add in phase to produce a single main beam along the axis of the antenna.
As with the V antenna, the main beam gets narrower and the gain of the antenna
eses as the leg length, L, is increased. This is shown in Fig. 24.
0
40
UNCLASSIFIED

oUNCLASSIFIED
49
14
1 2 3 4 5 6SIOE LENWTH (Z) -WAVE L&NGAS
(0)
* S ROUN: "Renms 6.Figure 24. Power' Gain of re-Space Rhombic Antenna of Optmum
Design for Maimum Field Intensity at Vertical Angles o of 10, 16, and 20The vertical take-off angle (C in 1ig. 24) should be chosen to be optimm for the
radio link, based on both the path length and the height of the ionosphere. This is done by€connon duens ! pmmem oa the rhombic antenna:26
I. As the length (L) of the legs is increased, the lobes of the individual long-wireantennas will move closer to the axes of the wires (see Section (4) andFig. 22).
2. If the drombus is made narower (Le., if the angles # in Fil. 23 a incemased),the conical panems of the individual long-wim antennas will overlap. TCheninstead of a dngle horizontal beam along the axis of the antenna, there will betwo axial beams, one above and the other below th. plane of the antenna. For
26 For a detal diculon of rhombic mienna design se Js*k MdleinEng ring BimmLChsy. 4
S ud21; or Knmahamm, W. 4Mf.
41
UNCLASSIFIED

UNCLASSIFIED
proper choices of L and #, the beams will make the desired vertical angle (a)
with the horizontal.
3. Now if the antenna is placed at the proper height (H) above a conducting
ground, the lower beam will reflect off the ground in such a way as to add in
phase with the upper beam, and all the emergy will be cmcentrated into a single
beam, pointn alom the axis of the rhombic and with a vertical take-oif anglea.
The antenna designer munt choose L, #, and H to give the desired value of (L The
foamulas for doing this are given in Kraus Ammm. pp. 410 and 411.
As the frequency is changed, the leg length L and the height H, memmmd in
wavelengths, will also change. The angles that the lobes make with the individual wires
will therefce change, but the changes In the four wires tend to cael each other OL The
net result is that the beam is broadened somewhat for frequencie other than t optimum
design frequency. As a rile, a rhombic antenna will operate satisfactorly over a frequency
range of 2.5 to 1.
(a) X Al.uimnuk& In all of the anteumm discussed so far, all of the elments
have been driven--Le., connected directly to the transmitter. It is also possibW to use
pmsitic (non-driven) elements which affect the antenna by virtue of the cum= which weinduced in them. This is the basis for the Yagi antenna. The antenna and its radiationpmeens am shown in Fig. 25.
If a parasitic element is longer than the driven element, it will reflect energ, back
toward the driven elemem and is called a reflector. U it is shorter, it sends enet y away
frm die driven clemet and is called a dbecto. The three-element army shown here has a
gain of about 5dB over that of a single dipole.2
It has been found expeimentally2 that little is gained by adding more reflectors to
the Yagi anmna, but that the pin may be increased by adding a larg numbe" of directom.
An exarple, for an element spacing of 0.34X, is shown in Table 4.
27 A•omay e Y8It-Udm mur. ,mind aft de Wo Jqms Weimd wbo hwaed IL28 I dw dOM sqwing we inuamd frm 0.12 to 0A52 (die OptiumI vyale for this anmm), the
pin wodd be dAom 7 or 8dB.29 ,1gdk, pta ,• q .~~•p 5.-24ff.
42
UNCLASSIFIED

UNCLASSIFIED
(sal
aft
evemfl fkw d ww mtj I
Table~ 4. .an of -- Atna
(b)
amvierwwdther 4in over
SOUrce: Rdenfern 7.
Figure 25. Three Element Yagi Antenna
Table 4. Gains of Yagi Antennas
Number *eemwldth Power gain overof Directors (degrees) Dipole (dS)
30 22 14
20 26 13
13 31 12
9 37 11
4 46 9
43
UNCLASSIFIED

UNCLASSIFIED 0
The longer antennas are often used in the UHF and VHF bands, but are not suitableat HF because of their size. An array with a half-wavelength driven element and 20di~xtors at a frequency of 10 MHz, with an element spacing of 0.34X, would be 15 m •wide and 215 m long. For this reason, HF Yagi antennas are generally limited to at mosttwo directors.
Yagis are often used because they are simple and easy to install. They are usuallymounted on a tower and can be rotated to point the main beam in the desired direction. Themajor limitation of the Yagi is its narrow bandwidth. Since the lengths of the reflector anddirector(s) (in wavelengths) is critical to their proper operation, changing frequency willdetune them and spoil the main beam. Bandwidths of two percent are typical.
(9) Lo& Periodic Antennas. In this class of antenna, which is used when abroad tuning bandwidth is required, 30 the design of the structure is such that the electricalproperties of the antenna repeat periodically with the logarithm of the frequency. A typicallog periodic dipole array is shown in Fig. 26.
RelA.., 2
T.- TSource: Reference 5.
Figure 26. A Log-Periodic Dipole Array
The logarithmic requirement is satisfied by the fact that the ratios of element lengthsand positions form a geometric sequence with the same ratio (- in Fig. 26).
Mast-mounted and fixed log periodic antennas for HF applications are shown inFig. 27.
30 For example, most home television atennas ame of the log periodic type.
44
UNCLASSIFIED

UNCLASSIFIED
0M
SoUMc: Refrene 6
Figure 27. HF Log Periodic Antennas
The gain of a log periodic antenna like those in Fig. 27 wi beaibout 10 dB overthat of an isotropic antenna. The tuning range extends from the Oqve.icy at whic% b•elongest element is a half-wavelength long to the frequency at which the shortest elem•nt ithalf-wavelength long, and can easily be nmade 10:1 or greatc-,
(10) Hellol zAntennas This class of antenna han sevenal unusual Vropcrdes:It operates in an end-fire mode, produces waves that are circularly gpol~ized, and niaazinsits performance characteristics over a frequency range of about 1.7 to 1.
A photograph and a schematic drawing of a typical helical antenna are shown inFig. 28, and the pertinent parameters art shown in Fig. 29.
45
UNCLASSIFIED

UNCLASSIFIED
o-Ground Pftne
Sfce of nory
helix cylinder
Source: Rference 7.
Figure 20. Helical Antenna
fSufoce of hmgWiy
:rT -T
Source: Reference 7. 6
Figure 29. Parameters of Helical Antenna
Typically, the circumference of the helix is made equal to one wavelength (C4X),
and the pitch angle c is 12.5. The gain of such an antennas a funcion of its total length •
is shown in Fig. 30.
46
UNCLASSIFIED

U14CLASSIFIED
A.lRn.RYS OF HELICAL ANTENNAS
2C
c l 1 1 1 1i 1 1]•1as.0J , . 1..5 2A U • 4X 5)4 6 " 8 1016
AXIAL L•N•T (nS) IN FREE SPACE WVEL'NG1THSi i i i i I i i 6 is * |ir
NUMBER OF TURNS (A) WOR CoLOX AM a a12.50
Source: Reor*nco 5.
Figure 30. Power Gain of Helical Beam Antenna withRespect to leotroplc Circularly Polarized Source
An antenna with a circumference of one wavelength and a length of twowavelengths would have nine turns and a gain of 15 dB. At a frequency of 10 MHz (k -
30m), this antenna would have a diameter of 9.55m anc a length of 60m.
The circularly-polarized wave from a helical antenna would be perfectly suitable forskywave path since, as noted earlier, polarization is unimportant in this case. Over a
ground-wave path, nalf of the radiated power (the horizotatal component of the circularlypolarized wave) would be absorbed by the ground.3 1 For d,'i. case, linear polarization can
be achieved, at the expense of increased size and complexity, by using two helicalantennas. They may be mounted either coaxially or side by side as shown in Fig. 31.
31 This is a los of 3 dB, which loves a net antenna gain or 12 dB, which is WiI equal to or greater tathe gains of other compurable HF antenna:. See the earlier discussion of rhombic, yagi, and logperiodic anwtem.
47
UNCLASSIF-IED

UNCLASSIFIED
Axis Axis AxisI I
Right-hoanedhelix
Left Riqhthanded haeredhelix helix Left-honed•
helix
(a) (b)
Source: Reference 7.
Figure 31. Helical Antenna Arrangements
to Produce Unear Polarization
L TACTICAL HF ANTENNAS
Some of the awtennas described above ae best suited for fmaed or semni-permanent
sites because they am large, awkward to erect, and do not disassemble into pieces small n
enough for easy transportation. This would include the helical, the log periodic and,
probably, the Yagi.
A "Tactical HF Antenna" could be defined as one which can be easily assembled inthe field by a few men, using simple components which can be carried in standard militaryvehicles: metal antenna masts, wire. insulators, etc. Antennas which satisfy this definition
wre:
"* Single verical quarer-wave monopoles
"* Dipoles, both horizontal and vetical
"* Arrays of vertical monopoles, phased for either broadside or end-fireoperation. A screen of grounded vertical elements can be placed behind thebroadside array to improve its performance.
* V antennas
* Rhombics
48
UNCLASSIFIED

UNCLASSIFIED
The gains of these antennas (with respect to an isotropic antenna) are shown in
Table 5. For consistency, the length of the array, and the leg lengths of the V and rhombic,were all chosen to be two wavelengths.
Table 5. Gains of Tactical HF Antennas
Type Gain Over Isotropic
Vefrtcal Ouarer-Wave Monopole 5.2 d1
Ha.l-Wave Dock: Free Space 2.2 dBoNew Ground 5.2 dB
Army ot Monopoles (2).) 11 dB
- With Back Screen 14 dB
V Argonna (21) 11 dB
Rhomb (2)1) 13 dB
Using one of these antennas,32 it should be possible to satisfy simultaneously the
goals of placing a beam in the desired direction, placing a null in the direction of any sorce
of imerference, and establishing the proper vertical take-off angle for sky-wave circuits.
J. SPREAD-SPECTRUM MODULATION
The last term to be discussed from Eq. 16 is B, the bandwidth filter factor. For
signals with flat frequency spectra, such as the spread-spectrum signals to be discussedhere, B was defined as:
*B = BI/BR (22)
where: BI = Bandwidth of interfering signal
BR - Bandwidth of bandpass filter in receiver
The SI ratio and, therefore, the performance of the radio link will be maximized by
making B as large as possible. This can be accomplished in several ways:
32 Some suggetlons for simplified versions of these antennas may be found in FM 24.18 Tactical
*insl~hnnl Ra.iL Cammunicadon Tachnigues,
49
UNCLASSIFIED

UNCLASSIFIED
'MThe bandwidth of the receiver bandpass filter. BR, should be made as narrowas possible while still passing all of the energy in the desired signal. This byitself will be efhctive against natural neise and certain sources of man-madenoise (e.g. electrical machinery, corona discharges, etc.) which ame inherentlywide band sources.
In the case of delibermt janmming, the goal is to force the jammer to increase thebandwidth of his signal while, at the same time, keeping the receiverbandwidth constant This is the purpose of spread-spectrum modulation.
A typical HF signal using conventional modulation techniques (AM, SSB, FSK, ornarrow-band FM) is limited to a channel bandwidth of 3 kHz, both by the propagationcharacteristcs of the HF band and by the extreme crowding of the band. An enemy whowants to jam the signal can concentrate all of his jammer transmitter power into the narrowbandwidth of the desired Apnal.
Antijam modulation techniques operate by spreading the desired signal over a widerbandwidth, using some prearranged coding system so that it can be collapsed back to itsorigirid bandwidih at the receiver. The two most common techniques, frequency hoppingand direct-sequence spread spectrum, will be discussed later.
When this is done, the jammer is forced to spread his power over the widerbandwidth. At the receiver, the desired signal will be collapsed back to its originalbandwidth, but the jamming signal will remain spread because it is not modulated with theproper coded waveform. The antdjam processing gain resulting from this process is givenby the ratio of the spread aindwidth (RF bandwidth) to the signal bandwidth--that is, bythe bandwidth filter factor. Some typical values are shown in Table 6.
Tabie 6. AJ Processing Gain (dB)
RF Bandwidth
Signal Bondwldth SO0 kHz 5 MHz 1s MHz
3 kHz 22 32 376ikHz 19 29 34
12 kHz 16 26 31
The effectiveness of the jamming signal will be reduced by an amount equal to theProcessing Gain (PG). The improvement in the signal-to-interference ratio caused byspread spectum processing is given by:
50
UNCLASSIFIED

UNCLASSIFIED
(S/I)o - S/I + PG (dB) (23)
where: S/I - on-the-air S/I, prior to processing
(S/I)o = signal-to-interference ratio after processing
It is clear from the preceding discussion that antijam effectiveness is maximized byspreading the signal over as wide a bandwidth as possible. In the BF band, however, this
*. will be limited both by the availability of frequency assignments and by the propagationcharcterstics of the band itself. 33 Most current HF antijam systems spread over abandwidth of only fc ! 2.5 percent or less (a bandwidth of 500 kHz at a carrier frequency,fe, of 10 MHz), and all BF systems which use sky wave propagation are constrained tooperate between the MUF and the LUF. Fig. 8 shows that the difference between thesetwo frequencies may be 2 MHz or less at night, and not more than 15 MHz during the day.
a. Frequency Hopping. Frequency hopping consists of a periodic changingof the transmitter frequency in a pattern determined by a pseudorandom sequence.34
It is classified as:
Fast Frequency Hopping if there is at least one new frequency for eachtransmitted symbol (bit).
0 Slow Frequency Hopping if two or more symbols are transmitted during eachhop.
The simplest case, in which a single carrier frequency and data channel are used foreach hop, is called single-channel modulation, and is shown schematically in Fig. 32,35where B is the channel bandwidth, W is the total RF bandwidth used by the frequency-hopping system, and Th is the hop period.
33 For a discussion of HF propagation, see IDA Paper P-2170, Radio Communication in the HiihFrequency Band, UNCLASSIFED.
34 A pseudorandom sequence is a precisely defined, deterministic sequence of bits, usually generated by adigital shift register with a set of feedback loops which determine the sequence of bits. The sequence iseaily matched nd synchronized (decoded) by a receiver that knows the. coding algorithm (the pattern ofthe feedback iops), but appears as random noise to a receiver that does nOL The pseudorandom bitsteam many also be encrypted if it is necessary to provide security as well as Al and LPI.
35 Since there is one hop for each symbol, this is fast frequency hopping.
51
UNCLASSIFIED

UNCLASSIFIED
Baume: RWtmmas 13.
Figure 32. Single Channel FMt Frequency HOpped Signal
When binary FSK modulation is used, separate frequencies are assigned to
represent the binary "I" (mark) and "0" (space). The pair of possible frequencies changes
with each hop, and the one that is actually sent is called the transmission channel, while the
one that would have been used if the other symbol were transmitted is called the
complementary channel. This is easily extended to m-ary modulation, in which m
fbuluencies are available on each hop to represent the m possible dam symbols.
The hopping pattern for binary FSK is shown schematically in Fig. 33.
COMPLMENTARY CHANWL
L -0 TIME
Source: Refemmo 13.
Figure 33. FSK Fast Frequency Hopped Signal
52
UNCLASSIFIED

UNCLASSIFIED
At the receiver, a code generator identical to that at the transmitter36 is used to drive
a local oscillator (frequency synthesizer) in such a way that the frequency hopped signals
are converted to a common and constant intermediate frequency. The process is called
"dehoppingu and is possible only for a receiver with the proper pseudonoise (or crypto)
code.
At any given instant of dime all of the power of a frequency-hopping transmitter will
be concenuated on a single RF channel. A conventional communications or intercept
Trceiver will detect the signal as an occasional burst of noise whenever the frequency-
hopping pattern happens to land on the frequency to which it is tuned. However, a
wideband (e.g., microscan) receiver scanning over the HF band will be able to detect t-.
signal easily and unambiguously.
Frequency hopping reduces the effectiveness of a conventional wideband noise
janmer by forcing it to spread its power over the whole hopping bandwidth (W in Figs. 32
and 33). If the actual channel bandwidth is B, the jammer power is thus diluted by a factor
B/W with respect to the transmited signal. This value, which is the AJ Processing gain, is
shown in Table 6.
Another possible countermeasure against frequency hopping is to use a repeater
jammer (or frequency-following jammer). A wideband receiver monitors the hopping
spectun and, each time a new hopping frequency is detected, a highly agile ransmitter is
tuned to that frequency and a jamming signal is transmitted. Although technically feasible
and theoretically auractive, the technique has several practical limitadons. If the RIF band is
crowded (as the HF band usually is), and especially if several frequency-hopping
transmitters are operating simultaneously, the jammer will have difficulty deciding which
signal belongs to the system it is trying to jam. It will have to do some rapid, and perhaps
inaccurate signal sorting, and/or dilute its power in order to jam the several most likely
candidates. In addition, them is a geometrical limitation that results from the fact that the
repeatewraer must intercept the hopped signal, process it, tune its transmitter, and send
the jamming signal, all while the victim receiver is still tuned to the same frequency.3
36 7M pmas of obtainins mad maintaining time synchronization between the two code generammrs is
cracial, but will no be discussed in this paper. Suffice it to say that it can be done.
37 See Tarrie" (Ref. 13, pg. 159) where It is shown that the jammer must be located inside an ellipsedot ba dw fhiendly euansmine and receiver as foci. For the low hop rates now uaed in the HP bend,Mie ellipse is OD Warg 1Wa " is not a serious limitation.
53
UNCLASSIFIED

UNCLASSIFIED
b. Direct.Sequence Spread Spectrum. If an RF cari"er with frequency fc is
phas-sheft modulated by a binary random or pseudorandom sequence (i.e., if die phase of
the carrier is shifted by 10W every time the sequence shifts from I to 0 or vice versa),3 the
resulting signal will be essentially identical to band-limited white Gaussian noise, and will
have the frequency spectrum shown in Fig. 34.
The null-to-null bandwidth of the central peak of the spectrum will be twice the
frquency at which the phase alterations am made, or 2/T where T is the period of the
modulating binary sequence. Thus, for example, modulation by a I Mbpseudorndom
sequence will spread the RF energy over a bandwidth of 2 MHz.
fc" 1/ fc 1c" vn
Figure 34. Spectrum of PSK Spread-Specarum Signral
In direct-sequence spread spectrum, the binary data signal is added39 to a
peendonolse binary sequence to form the spread-spectrum sequence which is used to PSK
modulate the RF carrier. At the receiver, a replica of th pseudorandom binary sequetnc is
subm ted from the received spre&d spectrum signal to yield the original binary data signal.
This is shown in Fig. 35. 0
0
31 Odw moduWlWoa techaiqus•. some of which ac quite ingenious, have been used. but phme-shiftmodulalln (or pa-hift keying) is dhe simplest and most common.
39 Th is Modulo2 blmy addition which has the following rules: 0+0=0, 0+1-1; +,0two.
54
UNCLASSIFIED

UNCLASSIFIED
I."U '• l lt•,IC IVI
fo SlmSprea S rm Suence
(.43 -,.- -- II Ceemlaled wlldh ReplIlca ofi Pmude-IRandom UlnavySmuuwice
81111117Ollll ,Used by Temltim1luerl6. 6dI
!--•IPm r"*l"•tW'm "i, rl*'-l"li'
Yields OTnllnel Slimy OllI~' I ' L
Source: ,4ilaen Wea & S Td•nnmn, Januay 3. 1983.
Figure 35. Dlrect-Soquence Spread Spectrum
If the frequency of the pseudonoise sequence (called the chip rate) is considerablyhigher than the data rae (called the bit rate), as is invariably the case, the net result is toconvert the data signal into a wideband noise-like signal. The processing gain (P0) orsRading ratio for this case is given by:
sP , Bandwidth Clip RateData Bandwidth Bit Rate (24)
Since the transmitter power is spread over the entire RF bandwidth, the direct-sequencespread spctrum signal will, in many cases, have a lower amplitude than the backgroundnoise, interference, or broadband jamming. Fig. 34 shows such a signal in the presence ofboth broadband and narrowband jamming.
55
UNCLASSIFIED

UNCLASSIFIED
Narrowbanel JamrW
B~cRar~NNoise and Jammi~ng
Spread Spectrum Signal
fc" vr fc fc + VT
Figure 36. Signal and Interference Before Despreadlng
The despreading (decorrelation) process at the receiver will affect each of thesesignals diffaendy:
M The original dam signal will be despread and recovered. Its bandwidth will be 0reduced to its original value, and its amplitude will be increased from its spreadvalue by an amount equal to the processing gain.
The narrow band jamming signal will be spread, by exactly the same processthat caused the spreading of the original data signal at the transmitter. Its 0amplitude will be reduced by an amount equal to the processing gain and itsspecrum wil become that of band-limited white noise.
• The broadband noise and jamming will remain essentially the same.40 Theactual signal waveform will, of course, change but the spectrun will remainwhite Gaussian noise.
The net result of the despreading process will be to recover the desired signal fromthe broadband noise and jamming, and to suppress the narrowband jamming, as shown in
Fig. 37.
40 This is becam, mahdmaicaly, the correlation of a Gaussian signal (dhe noise and jamming) with
mMdaWr Orealm au (the ueudoaole equence) yields yet anotedr Gamuw signal.
56
UNCLASSIFIED

UNCLASSIFIED
Despread Signal
\2,band Noise and Jamming
fc" Vr ft icf + vr
Figure 37. Signal and Interference After Despreading
Since the energy of a direct-sequence spread spectrum signal is distributedcontinuously across the entire spread bandwidth, it is very difficult to detect. It will appearonly as a slight (usually insignificant) increase in the background noise level
Narrowband and broadband jamming will be equally effective against direct-sequence spread spectrum since, as shown in the previous paragraph, both of thesejamming signals will be convened to white noise by the despreading process at thereceiver. For successful jamming, the jammer power must be sufficient to overcome theprocessing gain of the spread-spectrum system (see Eq. 24), and this usually requires aninconveritly large jammer tranmmitter.
c. Comparison of Spread-Spectrum Systems. The following pointscompare the features of frequency-hopping (FH) and direct-sequence (DS) spreadspectrum. The list is not complete, and the technical arguments are not rigorous, but itshould be clear that the present trend toward using FH should be carefully considered andpossibly reversed.
Low Prbability of In=te Low ProbabŽil -ofDetection (LPI/LPD). It wasnoted earlier that, at any given instance of time, an FH transmitter has all of itspower concentrated on a single narrow RF channel. A DS signal, on the otherhand, spreads its power over a wide RF bandwidth. It will look like noise andmay actually be buried in the ambient background noise. Thus, the FH signalcan be detected by any HF receiver, and almost instantaneously by a rapid-scan(micruscan) receiver, while the DS signal will be detected only if it is strongenough to raise the background noise level appreciably.
57
UNCLASSIFIED

UNCLASSIFIED
*-Co-site Interference. Mutual interference occurs when energy from onetransmitter (including sidebands and harnonics) falls into the passband of areceiver operating in another net. The problem is particularly critical when thetransmitter and receiver are at the same site (co-site interference), and isexacerbated when one or more of the nets at the site uses FH. Although it ispossible to select and use non-interfering (orthogonal) hop sets, this places anadditional burden on the frequency management system and, in any case, it isunlikely that enough channels will be available in the crowded HF band forsuch hop sets to be used. In the same situation, a DS signal will appear onlyas an increase in the background noise. In the worst case, a very strong VSumansmitter may serve to reduce the sensitivity of receivers located close to it.
Feuency Assii nrent. This may be a problem for either type of spreadspectrum, but should be more manageable for DS. Frequency managementagencies are reluctant to assign frequencies for FH systems, both because theyare known to interfere with other radio equipment and because they require alarge number of channels for effective ECCM operation. A few DS systemsoperating in the HF band should be acceptable, because they appear noise-likeand will cause much less interference to other users. However, no precedenthas been set for such frequency assignments, and the first few cases willprobably be difficult.
Cost and Complexity. A few years ago, when development of most of thecurrent systems was started, FH was the preferred choice because thefrequency synthesizers required for FH were readily available while the high-speed correlators required for DS were not. This is no longer the case and, forexample, the Global Positioning System (GPS) will be using both I MHz and10 MHz DS codes, and will be producing correlators inexpensive enough to besold on the commercial market.
Acquisition and Synchronization. Since the FH signal is strong and unique,while the DS signal is weak and noise-like, acquisition and synchronization areeasier for FH systems.
58
UNCLASSIFIED

UNCLASSIFIED
REFERENCES
1. CCIR, Vol. MI, Fixed Services at Frequencies Below About 30 MHz,S. In uiernalo Telecomm tnication Union, Geneva, 1986.
2. Vol V, Propagation in Non-Ionized Media
3. VoL VI, Propagation in Ionized Media
4. Cooper., George R- and McGillen, Clave D. Modern Communicauions and Spread
Spectrum, McGraw-Hill, 1986.
5. Jasik, Henry (Ed.), Antenna Engineering Handbook, McGraw-Hill, 1961.
6. Jordan, Edward C. (Ed.), Reference Data for Engineers, Howard W. Sams,Seventh Edition6 , 1985.
7. Kraus, John D., Antennas, McGraw-Hill, 1950.
8. National Bureau of Standards, lonosphrc Radio Propagation, NBS Monograph80, 1965.
9. Orr, William I (Ed.), Radio Handbook, Howard W. Sams, Twenty-ThirdEdition, 1987.
10. Terman, Frederk& F , Radio Engineering Handbook, McGraw-Hill, 1943.
11. Terman, Frederick E., Radio Engineering, McGraw-Hill, 1947.
12. Tennazi, Frederick E., Electronic and Radio Engineering, McGraw-Hill, 1955.
13. Torieri, Don J., Principles of Secure Communication Systems, Artech House,1985.
14. Class Notes for Course EE 531, Radiation, Propagation, and Antennas,
University of Michigan, 1964.
59
UNCLASSIFIED

* UNCLASSIFIED
Appendix A
TASK BACKGROUND, OBJECTIVE, ANDSTATEMENT OF WORK
U S
I UNCLASSIFIED

UNCLASSIFIED
APPENDIX A
TASK ORDER BACKGROUND, OBJECTIVE, A1ND
STATEMENT OF WORK
This IDA Paper was written in response to Task Order T-l1 -3 57 and Amendments1 through 4. Those portions of the task order that pertain to the background, objectives,and statement of work ae reprinted here.2. BAC'KGROUND:
The United States and the other NATO countries all have well-fnded programs todevelop anti-jam commurdications systems capable of overcoming the electroniccountermeasures (ECM) thrrt• ,)osed by the Soviet Union and other potential enemies. Inthe United States, these programs include a new combat net radio (SINCGARS); datasystems--the Joint Tactical Information Distribution System (JTIDS) and the EnhancedPosition Locating and Repwring System (FJPLRS); and High-Frequency Anti-Jam (HF/AS)systems. Unfortunately, each NATO naiimi, and often each military Service of the nation,has its own program. These have been r.managed separately and apparently in isolation,with the result that the systems are not interoperable. For example, the U.S. SINCGARSis not interoperable with the German combat net radio (FUGER-A), and at one time, theU.S. alone had seven sepan. H -F/AJ programs, no two of which could talk to each other.
Since interoperability is a prime requirement in combat operations, these programsmust be studied to determine the means of achieving systems' interoperability within thesame frequency band.
3. Q:The purpose of this task is to provide technical and analytical assistance and
0 products to the Joint Staff in its task of ensuring that common interoperable electronic'.eunter-countermeasures (ECCM) waveforms are developed for the communicationssystems of the U.S. military Services and our NATO allies.4. STATE-MENT O WORK:
Specific Tasks and Deliverables. This is a multi-year effort. While all open issuesW will be addressed, the effort will be focused on issues dealing with HF whemre the prospect
for substantive results suitable as a basis for further Joint Staff t,'tion is greatest. Thefollowing tasks shall be addressed in FY 19 1:
a. Continue preparation of a preliminary architecture study on HF to includeidentification of current and planned HF nets--the units/echelons/ missions whichparticipate in each net, identification of which nets need to interoperate, the type of trafficpassefin each net, minimum essential nodes and rates required by C2 systems ardsupporting HF system nets, identification of the features needed for each network and thestandards which apply (to include the need for ECM protection), Lie degree of FederalAgency, Joint Service, or Allied participation, and an analysis of how these featuresenhance/degrade the users ability to circumvent frequency spectrum overcrowding, media,or threat conditions with. which the user is confronted. Identify any radio nets, including
A-1
UNCLASSIFiZD

UNCLASSIFIED
strategic, tactical, and special operations, with special requirements which might mandatedifferent ECCM standards. Special emphasis should be placed on HF ECCMrequirements.
b. Analyze alternative HF ECCM techniques, compare capabilities, andrecommend the minimum set of common AJ waveforms to satisfy the RequirementSubmission for Advanced ECCM 1-IF Radio Communications (RS JS 6-88).
c. Develop technical analyses of draft HF military and federal standards.
d. Provide technical analyses and descriptions of BF ECCM waveforms, andother inputs as required, to the developers of the TA/CE (Technical Analysis/Cost Estimate) 0in suppor; of RS IS 6-88.
e. Analyze and compare the technical proposals and designs for ECCM systemsprovided by the U.S. military Services as well as those from domestic and foreigncontractors, and make recommendations regarding feasibility, effectiveness, andinteroperability. Competing factors such as available RF bandwidth, required AJ margin,data rate, and the operational environment will be considered in the analysis.
0,
A-2
UNCLASSIFIED

UNCLASSIFIED
APPENDIX B
APPROVED DISTRIBUTION LIST FOR IDAPAPER P-2598
UNCLASSIFIED

UNCLASSIFIED
APPENDIX BAPPROVED DISTRIBUTION LIST FOR IDA PAPER P-2598
Number of Copies
Joint Staff 20The PentagonWashington, D.C. 20301-5000
Attn: J61
Institute for Defense Analyses 201801 N. Beawregamd Swtet
0 Alexandria, VA 22311-1772
Defense Technical Information Center 2Camaon StationAlexandria, VA 22304-6145
B-I
UNCLASSIFIED