uncertainty in nutrient loads resulting from ... - smed.se kerhet... · pdf...
TRANSCRIPT

Agreement: 3102-15
Commissioned by the Swedish Agency for Marine and Water
Management
SMED Report No 178 2016
Uncertainty in nutrient loads resulting from discharge data
uncertainty
Ida Westerberg, IVL Swedish Environmental Research Institute
Hanna Gustavsson, SMHI
Lars Sonesten, SLU

2
Published at: www.smed.se
Publisher: Swedish Meteorological and Hydrological Institute
Address: SE-601 76 Norrköping, Sweden
Start year: 2006
ISSN: 1653-8102
SMED is short for Swedish Environmental Emissions Data, which is a collaboration
between IVL Swedish Environmental Research Institute, SCB Statistics Sweden, SLU
Swedish University of Agricultural Sciences, and SMHI Swedish Meteorological and
Hydrological Institute. The work co-operation within SMED commenced during 2001 with
the long-term aim of acquiring and developing expertise within emission statistics. Through
a long-term contract for the Swedish Environmental Protection Agency extending until
2014, SMED is heavily involved in all work related to Sweden's international reporting
obligations on emissions to air and water, waste and hazardous substances. A central
objective of the SMED collaboration is to develop and operate national emission databases
and offer related services to clients such as national, regional and local governmental
authorities, air and water quality management districts, as well as industry. For more
information visit SMED's website www.smed.se.

3
Contents
SUMMARY 4
SAMMANFATTNING 7
INTRODUCTION 10
Aim of this study 11
DATA 12
METHODS 16
Estimation of discharge data uncertainty 16
Estimation of rating curve uncertainty 16
Estimation of discharge uncertainty 17
Estimation of nutrient load uncertainty 18
RESULTS 19
Estimated rating curve uncertainty 19
Estimated discharge data uncertainty 21
Estimated nutrient load uncertainty 25
DISCUSSION AND CONCLUSIONS 30
Uncertainty in discharge data 30
Impact of discharge uncertainty on load uncertainty 31
Method limitations and future developments 31
Uncertainty estimation for PLC-Annual 32
Conclusions 33
REFERENCES 35

4
Summary Reliable estimates of nutrient loads discharged to the sea are important for
managing marine and upstream water resources. Most major river mouths in
Sweden are monitored for discharge and nutrient concentrations. These data
are used together with direct point source loads as the basis for annual load
estimates. The estimates are used as a basis for national environmental
policy and they are reported to international bodies such as the EEA (SoE
TCM report), OSPAR (OSPAR RID report) and HELCOM (PLC-Annual
report). The Pollution Load Compilation-Annual (PLC-Annual) report to
HELCOM is used as evidence for managing eutrophication in the Baltic
Sea.
The reliability of load estimates based on monitoring data in gauged
catchments is affected by uncertainty in the discharge and nutrient
concentration data. Knowledge about the uncertainty associated with the
load estimate values is of fundamental importance when using these data as
a basis for management decisions, e.g. for assessing fulfillment of national
environmental objectives, or analysing trends in the loads over time (i.e. is it
a real change that is observed or is it a result of data uncertainty?). In the
PLC-Annual reports for 2015 and onwards both the loads and the estimated
uncertainty in the loads should be reported. The aim of this study was to
quantify uncertainty in discharge data resulting from rating curve
uncertainty and its impact on uncertainty in the nitrogen and phosphorous
PLC-Annual load estimates at selected river mouths.
In total there are 34 river mouth stations for which the PLC-Annual load
calculations are based entirely on measured discharge (i.e. no modelled data
are used). We used data from the 12 river mouth stations that are run by the
Swedish Meteorological and Hydrological Institute, SMHI, for which data
were available to estimate discharge uncertainty. These stations are
representative of all the 34 stations in terms of catchment characteristics
except for a lower degree of river regulation. Discharge was calculated
indirectly from water level (stage) at all these stations using a rating curve,
which is fitted to stage–discharge gaugings. For each discharge station we
used 15-minute water-level data for 2005–2014 and the stage–discharge
gaugings that had been used to fit the current rating curve equation.
Rating curve uncertainty was estimated with the Voting Point likelihood
method in a Monte Carlo analysis, essentially estimating multiple feasible
rating-curve parameter sets that are compatible with the uncertain gauging
data. We estimated 40,000 rating curves and the method succeeded in

5
capturing the uncertainty in the gauging data at all stations. Only a few of
the stations had extrapolated rating curves during the time period and most
of the stations had a well constrained rating curve uncertainty for the mid
and high flow range.
For each rating curve a time series of discharge was calculated from the
stage time series and aggregated to daily values. The 90% uncertainty
interval for the relative uncertainty in the daily flow percentiles was around
±15–50% for low flows (Q95, i.e. the flow exceeded 95% of the time),
±10% for mean flow, and around ±10–25% for high flows (Q0.1 and
Q0.01). These estimates include both model and data error, which means
that they are likely conservative estimates. Rating curves are normally
updated continuously as new data become available. Effects of historic
rating curve updates were visible in the official discharge time series for
some of the stations (as differences in comparison to the PLC-Annual
discharge data). These differences were of a similar magnitude as the 90%
uncertainty interval from the rating-curve uncertainty estimated here. The
uncertainties we estimated from the gauging data were therefore
representative of those stemming from real rating-curve changes in the last
10 years.
The nutrient load uncertainty was estimated by repeating the PLC-Annual
load calculation method (interpolation of monthly nutrient concentrations to
daily values that are then multiplied by discharge) for each estimated
discharge time series. As a result of the rating curve uncertainty, the
estimated relative uncertainty in the PLC-Annual nitrogen and phosphorous
loads was ±7–14% (the half-widths of the 90% interval). However, there
were biased uncertainty distributions up to ±30–40% for individual years as
a result of errors in the water-level time series (that had been updated after
the data was delivered for the load calculations). We therefore recommend
that the historic load estimates are updated regularly in the future to take
advantage of successive data quality improvements.
The potential impact of load uncertainty should be considered when load
estimates are used for other analyses or as a basis for policy decisions. We
expect a greater impact on load comparisons between catchments compared
to between sea basins, and for individual years compared to long-term
averages. Trend analyses are expected to be obscured where the magnitude
of the uncertainty is large in relation to the strength of the measured trend.
This study has quantified the uncertainty arising from discharge data and
has established an uncertainty estimation method that can be extended to
include other components of the total load uncertainty. We recommend that
future studies build on the current method to include uncertainty

6
components from the nutrient concentration data and temporal sampling.
Furthermore, investigations of discharge uncertainty in other HELCOM
countries are recommended as uncertainties may differ greatly depending on
hydrometric pre-conditions and available data.

7
Sammanfattning Data över belastning av kväve och fosfor på havet från flodmynningar är ett
viktigt beslutsunderlag för vattenförvaltningen – speciellt för arbetet med att
begränsa övergödning i Östersjön. Vid de flesta större flodmynningar i
Sverige mäts vattenföring kontinuerligt samt kväve- och fosforhalter varje
månad. Från dessa data beräknas kväve- och fosforbelastningen på årsbasis
och dessa data används som underlag för svensk vattenförvaltning samt
rapporteras till internationella organ såsom EEA (SoE TCM-
rapporteringen), OSPAR (OSPAR RID-rapporteringen) och HELCOM
(PLC-Annual-rapporteringen). Vid kommande PLC-Annual-rapporteringar
från och med för år 2015 ska även osäkerheten i de beräknade
belastningsvärdena rapporteras.
Belastningsberäkningen påverkas av osäkerheter i de vattenföringsdata och
närsaltskoncentrationsdata som används för beräkningen. Flera
internationella studier har visat att vattenföringsdata kan ha en betydande
osäkerhet. Detta är en konsekvens av att vattenföring vid de flesta
mätstationer beräknas indirekt från vattennivådata med hjälp av en
avbördningskurva som anpassas till samtidiga mätningar av vattennivå och
vattenföring. Denna studies mål var att undersöka osäkerhet i
belastningsdata som en konsekvens av osäkerhet i vattenföringsdata vid ett
tiotal av de flodmynningsstationer som används för de svenska
belastningsberäkningarna. Kunskap om osäkerheten i den beräknade
belastningen är av grundläggande betydelse när data används för olika typer
av analyser (ex. identifiering av trender och jämförelser mellan områden)
samt som beslutsunderlag. Dessutom utgör studien underlag för
osäkerhetsskattningarna i kommande PLC-Annual-rapporteringar.
Vid PLC-Annual-beräkningarna används enbart uppmätt vattenföringsdata
(d.v.s. ingen modellerad data) för 34 stationer. Av dessa 34 stationer
användes de 12 som drivs av SMHI, eftersom det enbart var för dessa som
avbördningssambanden var tillgängliga. Stationerna är spridda över hela
landet förutom mellersta ostkusten. De är representativa för övriga stationer
vad gäller de flesta metadata (storlek, sjöprocent, medelårsbelastning av
kväve och fosfor), dock med en generellt lägre regleringsgrad.
Osäkerhetsanalysen gjordes för 2005–2014 och de data som användes var
avbördningskurvor med tillhörande mätningar, 15-minuters
vattenståndstidsserier, månatliga kväve- och fosforkoncentrationer, PLC-
Annual belastningsdata samt stationsmetadata.

8
Osäkerheten i vattenförings- och belastningsdata beräknades på följande
sätt. Totalt beräknades 40 000 möjliga avbördningskurvor i en Monte Carlo-
osäkerhetsanalys med Voting Point likelihood-metoden. Metoden tar hänsyn
till osäkerheter i mätningarna som ligger till grund för avbördningskurvan
samt till osäkerheter kopplade till ofullständig kunskap om relationen
mellan vattenstånd och vattenföring (t.ex. på grund av extrapolation till
omätta flödesintervall). För varje beräknad avbördningskurva beräknades
sedan en tidsserie med vattenföring på 15-minutersnivå utifrån
vattenståndsdata och därefter dygnsmedelvattenföringen. Den
multiplicerades sedan med koncentrationsdata för kväve och fosfor som
interpolerats till dygnsvärden utifrån månadsvisa mätningar för att få
belastningen. Slutligen beräknades årsbelastningen och på så sätt erhölls en
hel fördelning med 40 000 belastningsvärden per år som beskriver
osäkerheten i belastningsdata som en konsekvens av osäkerhet i
vattenföringsdata.
Resultaten visar att 90 % intervallet för osäkerheten i dygnsvattenföringen
för lågflöden var runt ±15–50% (för Q95, d.v.s. det dygnsflöde som
överskrids 95% av tiden), för medelflöden ±10%, och för högflöden ±10–
25% (Q0.1 och Q0.01). Dessa osäkerhetsskattningar inkluderar både data-
och modellosäkerhet vilket betyder att de bör vara konservativt skattade.
Vattenföringsdata uppdateras normalt kontinuerligt allt eftersom
avbördningskurvan förbättras. Effekten av att avbördningskurvan hade
uppdaterats (och att vattenföringstidsserien därmed hade korrigerats
retrospektivt) syntes vid flera stationer vid en jämförelse med de
vattenföringsdata som använts för PLC-Annual beräkningarna (och som
levereras varje år). De skillnader som dessa uppdateringar gav upphov till
var av liknande storleksordning som den osäkerhet vi beräknade här. Vår
osäkerhetsskattning var därmed representativ för förändringar i
avbördningskurvorna som skett de senaste 10 åren vid vissa av stationerna.
Osäkerheten i PLC-Annual belastningsdata uppskattades som en
konsekvens av osäkerheten i avbördningskurvorna till ±7–14% (halva
bredden av 90% intervallet). Enskilda år var det dock större osäkerheter med
systematiskt förskjutna osäkerhetsfördelningar på upp till ±30–40%. Detta
berodde på fel i vattenståndstidsserierna som hade justerats efter att data
levererats för PLC-Annual beräkningarna. Vi rekommenderar därför att de
historiska belastningsberäkningarna uppdateras med aktuell vattenföring
årligen för att dra nytta av successiva kvalitetsförbättringar.
Den potentiella påverkan av osäkerheter i belastningsdata bör tas i beaktan
när data används för andra analyser samt för förvaltningsbeslut. Hur stor
påverkan av osäkerheterna blir beror på vilka analyser och jämförelser som

9
görs samt vilken rumslig och tidsmässig skala som används. Vi förväntar
oss en större påverkan på jämförelser mellan enskilda avrinningsområden
jämfört med mellan havsbassänger, samt för individuella år jämfört med
flerårsmedelvärden. Trendanalyser försvåras där osäkerheten är stor i
förhållande till styrkan av den uppmätta trenden.
Monte Carlo-osäkerhetsmetoden som användes här är generellt tillämplig
för att beräkna osäkerheten i vattenföring vid alla stationer där avbördnings-
kurvor används. Det rekommenderas att avbördningskurvedata och vatten-
föringsosäkerheter undersöks även i andra HELCOM länder, eftersom
osäkerheterna kan skilja sig stort åt beroende på de hydrometriska
förutsättningarna och tillgängliga data. Den här studien har kvantifierat
osäkerheten i belastningsdata på grund av osäkerhet i vattenföringsdata och
etablerat en metod som kan utvecklas till att inkludera andra komponenter
av den totala belastningsosäkerheten. Vi rekommenderar att framtida studier
bygger vidare på denna metod och kvantifierar osäkerheter i
koncentrationsdata av kväve och fosfor samt osäkerheter på grund av
begränsad tidsmässig provtagning.

10
Introduction Reliable estimates of nutrient loads discharged to the sea are an important
part of the evidence base required for management of marine water
resources and for assessing measures to reduce eutrophication. In Sweden,
most major river mouths are monitored for discharge and nutrient
concentrations. These data are used together with point source loads as the
basis for annual load estimates. The estimates are used as a basis for
national environmental policy and they are reported to international bodies
such as the EEA (SoE TCM report), OSPAR (OSPAR RID report) and
HELCOM (PLC-Annual report). The Pollution Load Compilation-Annual
(PLC-Annual) report to HELCOM is used as evidence for managing
eutrophication in the Baltic Sea.
The reliability of load estimates based on monitoring data in gauged
catchments is affected by uncertainty in the discharge and nutrient
concentration data from which they are calculated. Knowledge about the
uncertainty associated with the load estimate values is of fundamental
importance when using these data as a basis for management decisions, e.g.
for assessing fulfillment of national environmental objectives, or trends in
the loads over time (i.e. is it a real change that is observed or is it a result of
data uncertainty?). In the PLC-Annual reports for 2015 and onwards both
the loads and the estimated uncertainty in the loads should be reported.
There is therefore a need to investigate the impact of uncertainties in the
discharge and nutrient concentration data on the yearly load estimates. In
this study we assessed the impact of discharge data uncertainty on the
nutrient load uncertainty.
Discharge data is calculated from water level (stage) time series using a
rating curve at most gauging stations worldwide. The rating curve is fitted to
simultaneous gaugings of water level and discharge at different flow
conditions. Uncertainty in the rating curve depends on uncertainty in the
stage–discharge data used to fit the rating curve and on uncertainty related
to the model approximation of the true stage–discharge relation. The latter is
particularly important at ungauged flow levels where the curve needs to be
extrapolated, and where there is temporal variability in the stage–discharge
relation. Uncertainty in the highest flows can be large; they occur seldom,
are often difficult to gauge reliably, and the rating curve may need to be
extrapolated (Westerberg and McMillan, 2015). Uncertainty in the stage
time series data include digitisation errors and errors during periods with ice
or stilling-well drawdown effects. Stage measurement uncertainty is often
assumed to be small compared to discharge measurement uncertainty

11
(McMillan et al., 2012). Many international studies have found that
uncertainty in discharge data: 1) can be substantial (values around ±20–80%
for low flows, ±10–15% for average flows, and ±15–40% for high flows
have typically been found, but with large variability in-between sites), 2) is
dependent on place-specific factors, and 3) that the uncertainty is often large
at high flows, when nutrient load transport is large (Coxon et. al, 2015;
Juston et al., 2012; McMillan et al., 2012; Petersen-Overleir et al., 2009;
Westerberg et al., 2016).
Aim of this study
Given 1) the need to understand uncertainty in load estimates in general, 2)
the requirement to report uncertainty in the PLC-Annual load estimates, and
3) the uncertainty in discharge data found internationally, there is a need to
investigate the uncertainty in discharge data for Swedish river mouths, and
its impact on nutrient load estimates. The aim of this study was therefore to
quantify uncertainty in discharge data and its impact on uncertainty in
nitrogen and phosphorous annual load estimates at around 10 selected river
mouths.

12
Data The PLC-Annual load calculations are made for all river mouths and the
small coastal land areas in-between them. Here we analysed metadata for
the 34 river mouths where the load calculations are based only on observed
discharge from nearby stations (i.e. no modelled discharge has been used).
The aim was to select a representative sample of around 10 of these stations
for the uncertainty analysis. However, rating curve data were only available
for the 12 stations that are managed by the SMHI (Figure 1 and Table 1).
The other stations are mostly run by hydropower companies for which
SMHI is not allowed to disclose information about rating curves and for
some of these stations other discharge measurement methods are used. We
used all the 12 SMHI stations for the uncertainty analyses in this study.
The selected stations are located in the southern and northern, as well as the
eastern and south-western parts of the country, but there were no stations in
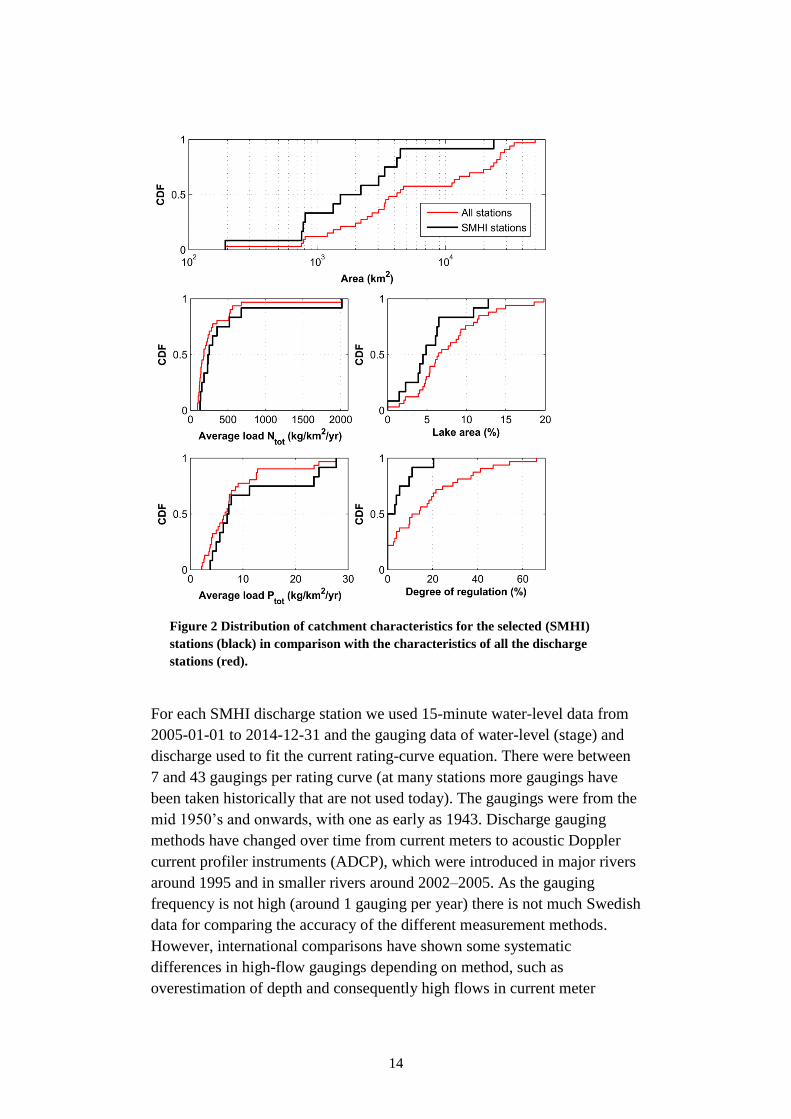
the middle of the east coast (Figure 1). An analysis of the metadata for the
selected stations in relation to all 34 discharge stations shows that they are
representative in terms of most catchment characteristics (Figure 2). The
SMHI stations include one very large catchment (Kalix älv in the north,
23,800 km2) and the smallest catchment of all the river mouth stations (Råån
in the south, 193 km2). The most noticeable difference between the metadata
for the SMHI stations and all the discharge stations is that the SMHI stations
have a lower degree of river regulation. This is because the catchments that
have a high degree of regulation have discharge stations operated by the
hydropower companies that regulate them.

13
Figure 1 The locations of the river-mouth discharge stations (only the stations
where the PLC-Annual estimates are based exclusively on measured discharge),
the selected stations (i.e. those operated by SMHI), and their catchments.
14
Figure 2 Distribution of catchment characteristics for the selected (SMHI)
stations (black) in comparison with the characteristics of all the discharge
stations (red).
For each SMHI discharge station we used 15-minute water-level data from
2005-01-01 to 2014-12-31 and the gauging data of water-level (stage) and
discharge used to fit the current rating-curve equation. There were between
7 and 43 gaugings per rating curve (at many stations more gaugings have
been taken historically that are not used today). The gaugings were from the
mid 1950’s and onwards, with one as early as 1943. Discharge gauging
methods have changed over time from current meters to acoustic Doppler
current profiler instruments (ADCP), which were introduced in major rivers
around 1995 and in smaller rivers around 2002–2005. As the gauging
frequency is not high (around 1 gauging per year) there is not much Swedish
data for comparing the accuracy of the different measurement methods.
However, international comparisons have shown some systematic
differences in high-flow gaugings depending on method, such as
overestimation of depth and consequently high flows in current meter

15
gaugings, if not corrected for (M. Lennermark, SMHI, personal
communication). Water level has been measured and recorded automatically
at seven of the stations and using paper diagrams that are later digitised at
five of the stations (with generally lower accuracy).
Table 1. Characteristics of the selected river mouth catchments
Station
number River
Discharge
station
Total
catchment
area [km2]
Area
discharge
station
[km2]
Degree
of
regula-
tion [%]
Lake
area
[%]
N load
[ton-
nes]
P load
[ton-
nes]
Moni-
tored
area N
& P [%]
17 Kalixälven Räktfors 23846 17387 0 5 3270 186 100
20 Råneälven Niemisel 4207 3779 0 4 547 24 90
2506 Öreälven Torrböle 2 3029 2860 0 2 470 34 94
1621/
200021 Emån Emsfors 4471 4441 11 7 1024 22 99
855 Alsterån Getebro 1525 1333 4 6 279 6 87
1962 Ljungbyån Källstorp 2 758 342 0 2 225 3 97
2400 Lyckebyån Mariefors 810 801 0 5 204 5 100
186 Mörrumsån Mörrum 3369 3361 20 13 799 24 100
2127 Råån
Brödde-
backen 193 156 0 0 390 5 86
2201 Viskan Åsbro 3 2202 2160 10 6 1497 54 98
257 Örekilsälven Munkedal 1340 1335 3 4 697 32 100
751
Enningdals-
älven
Vass-
botten 782 624 5 11 277 6 81
1 The discharge station in Emån is number 1621, Emsfors. This station was used to estimate the rating curve
uncertainty. However, the river mouth station discharge includes a small contribution from a dam for low flows
and the summed discharge is reported with station number 20002. We added this contribution in the same way
as in the official discharge data.
The water quality stations were located close to the discharge stations in
most catchments. We used monthly measurements of total nitrogen and total
phosphorous, which are the same data that are used to calculate the PLC-
Annual loads. Where the discharge station was located upstream of the
water quality station, specific discharge and catchment area was used to
calculate the discharge at the water quality station (following Sonesten,
2011).

16
Methods After analysing the available data, we estimated the load uncertainty
through three main steps (Figure 3): 1) estimation of rating curve parameter
uncertainty, 2) propagation of rating curve uncertainty to discharge data
uncertainty, and 3) propagation of discharge data uncertainty to nutrient
load uncertainty.
Figure 3. Schematic illustration of the method used to estimate nutrient load
uncertainty in the study. The green boxes illustrate the input data required for
each step.
Estimation of discharge data uncertainty
Estimation of rating curve uncertainty
Uncertainty in the rating curve model of the stage–discharge relation at the
gauging station arises as a result of two sources: 1) incomplete knowledge
about the stage–discharge relation (e.g. where the curve is extrapolated at
very high flows or where the relation changes over time), and 2) uncertainty
in the gaugings (i.e. the measurements) of discharge and water level used to
fit the rating curve. Both of these uncertainty sources were accounted for in
this study, using the Voting Point likelihood method (McMillan and
Westerberg, 2015).
The method essentially consists of estimating multiple feasible rating curves
consistent with the uncertain gauging data (using Monte Carlo Markov
Chain sampling). From each estimated rating curve a discharge time series
can then be calculated from water level to obtain the uncertainty in the

17
discharge data. The rating curve forms were constrained to the functional
form of the official rating curves, which were multi-section power law
curves with two or three sections. The prior parameter bounds were chosen
as standardised ranges defined relative to the official parameter values, and
were adjusted for some stations to better capture the uncertainty in the
gauging data. A full description of the method is given by McMillan and
Westerberg (2015).
The gauging data uncertainty depends on the gauging conditions and
methods. Discharge measurement methods have changed over time from
current meters to ADCPs. The relative uncertainties at low flows are
normally higher because of greater inaccuracies of hydro-acoustic and
current meter measurements in shallow and low-velocity flow situations
(Petersen-Øverleir et al., 2009; McMillan et al., 2012; Le Coz et al., 2014).
We used an estimate of discharge uncertainty as logistic distribution
functions based on gauging data for 1962–2012 from 26 stations with stable
stage–discharge relations in England and Wales (Coxon et al., 2015). The
estimate thus includes data from a similar time period as for the Swedish
rating curves, during which there has been a switch from current meters to
ADCPs in both countries (occurring a few years earlier in Sweden).
Furthermore, the UK estimate accounts for greater low-flow measurement
uncertainty that may occur for both current meters and hydro-acoustic
measurements (see above). The 95% relative error bounds of the logistic
distribution ranged from ±13% for medium to high flows to ±25% for low
flows. Note that the logistic probability distribution has heavy tails – i.e.
representing that few gaugings have high uncertainties and the majority
have lower values. Consequently, the 80% bounds were much narrower,
±8% for medium to high flows and ±15% for low flows. The discharge
uncertainty figures are in line with those given by Pelletier (1988) for
current meters. An analysis of the rating-curve residuals for the 12 stations
in the study showed deviations mostly within these magnitudes and a similar
increase for low flows. A uniformly sampled stage uncertainty of ±5mm in
each gauging was used based on previous studies (McMillan et al., 2012).
Estimation of discharge uncertainty
The discharge data uncertainty was then estimated by calculating a
discharge time series for each of the 40,000 sets of estimated rating curve
parameters, resulting in 40,000 time series of discharge. Uncertainties in the
time series of water level were not included (this requires detailed
knowledge about measurement conditions and time series data quality at
each station). Finally the 15-minute discharge time series were aggregated
to daily time series for use in the nutrient load uncertainty estimation.

18
Estimation of nutrient load uncertainty
The loads of nitrogen and phosphorous were calculated using the same
method as for the PLC-Annual calculations (see e.g. Sonesten, 2011). First
the monthly nitrogen and phosphorous concentrations were interpolated
linearly to daily values and then they were multiplied by the 40,000 daily
discharge time series to obtain 40,000 realisations of the daily loads. If the
catchment area of the discharge stations differed from the upstream area of
the water quality sampling station, the specific discharge (i.e. discharge
divided by catchment area) was used to calculate the discharge at the water
quality station. Finally the daily loads were aggregated to yearly load values
to obtain a distribution of 40,000 nutrient load values for each year in the
period 2005–2014 that quantify the nutrient load uncertainty as a result of
discharge data uncertainty.

19
Results
Estimated rating curve uncertainty
The estimated rating curve uncertainty captured the uncertainty in the
gauging data at all the stations, disregarding outlier points. Four of the
rating curves are shown in Figure 4, where the blue colours represent
percentiles of the distribution of discharge calculated from all the rating
curves for a certain stage value. Narrower coloured intervals mean that there
are more rating-curve samples and therefore higher probability density for
the flow. The uncertainty distributions were mostly well constrained by the
gauging data with the highest relative uncertainties at low flows and
somewhat higher values at high flows compared to the mid flow range.
There were comparably small degrees of extrapolation and none of the
stations had out-of-bank sections (documented or visible as a sharp change
in the high-flow rating) – both of which can cause considerable uncertainty
in high flow data. The gauging data covered the complete stage range in the
period 2005–2014 for five of the stations. Four of the stations were
extrapolated between 6 and 30 cm for low flows and six were extrapolated
between 2 and 35 cm for high flows. The Bröddebacken station (no. 2127)
with the smallest catchment area had the largest rating curve extrapolation.
This in combination with scatter in the high-flow gaugings contributed to
substantial uncertainty in the high-flow data. Most of the stations had rating
curves that had been updated in the last 10–15 years. For three of the
stations where an earlier rating curve was available it could be seen that the
rating-curve changes were up to the same order of magnitude as the
uncertainties estimated here.

20
Figure 4. Rating curves with estimated uncertainty for four of the twelve
gauging stations, in linear scale to the left and in log scale for the lower half of
the flow range to the right. The black dots show the gauging data, the black
lines the 95% bounds of the discharge measurement uncertainty, the red line
the official rating curve, and the red stars the breakpoints in-between the
different sections in the multi-section rating curves. The blue bands show the
percentiles of the uncertainty distribution of discharge from all of the estimated
rating curves (narrower blue bands means higher probability density for the
discharge).

21
Estimated discharge data uncertainty
The uncertainty in the daily discharge data was quantified by its impact on
several flow indices; the mean flow and flow percentiles for low, medium
and high flows. Figure 5 shows the uncertainty in the rating curve, the daily
discharge time series and the uncertainty in the flow indices for the
Källstorp 2 station (no. 1962). This station had some extrapolation of the
highest flows (around 20 cm) and the largest relative low-flow uncertainty
of all the stations as a result of the scatter in the low-flow gauging data in
combination with low absolute discharge values (i.e. the absolute discharge
uncertainty was low). For the highest flows there is little scatter in the
gaugings and the high-flow uncertainty is dominated by the measurement
uncertainty component. This means that the total uncertainty estimated with
our method is a conservative estimate (given that there is no substantial
systematic measurement uncertainty component). Note that there are only
two flow events above 3 mm/d (Figure 5c), which means that the majority
of the flow time series is affected by the uncertainty in the lower half of the
rating curve.
The uncertainty in the flow percentiles (Figure 5b) results from the
combination of the rating curve uncertainty (Figure 5a) and the time series
variability (Figure 5c). The relative uncertainties are calculated relative to
the flow percentiles from the official rating curve. The histograms (Figure
5d) illustrate how the uncertainty distribution varies in shape across the flow
range.

22
Figure 5. Effect of rating curve uncertainty (a, see detailed explanation to
Figure 4, low flows in inset graph in log scale) on flow percentiles and mean
flow (b and d). The uncertainty in the flow percentiles result from the combined
effect of the rating curve uncertainty and the flow time series variability (c).
The boxplot whiskers for the flow percentiles extend to the 5 and 95 percentiles
of the uncertainty distributions, the box covers the interquartile range and the
dot represents the median value.

23
The uncertainty in mean flow calculated from the daily discharge time series
was approximately ±10% at most stations (the half-widths of the 5–95
percentile intervals varied between 8 and 12%, Figure 6).
Figure 6. Absolute uncertainty (top) and relative uncertainty (bottom) of mean
flow at all the discharge stations. The stations are sorted by catchment area in
km2 (with the range in parenthesis), increasing from left to right. The boxplot
whiskers extend to the 5 and 95 percentiles of the uncertainty distributions, the
box covers the interquartile range and the dot represents the median value.
The relative uncertainty in the daily discharge time series varied across the
flow range in a site-specific way depending on the rating-curve uncertainty
(Figure 7). The relative uncertainty was highest for low flows
(approximately ±15–50% for Q95, and ±10–30% for Q85), it decreased for
medium-range flows (approximately ±10–25% for Q50, and ±10–15% for
Q5), and increased again for most of the stations to approximately ±10–25%
for high flows (Q0.1 and Q0.01).

24
Figure 7. Relative uncertainty in percentiles of daily discharge for all the
stations. The stations are sorted by catchment area in km2 (with the range in
parenthesis), increasing from left to right. The boxplot ranges are explained in
the text to Figure 6.

25
Estimated nutrient load uncertainty
The uncertainties in the yearly nitrogen (N) and phosphorous (P) loads for
the station Åsbro 3 (no. 2201) are shown in Figure 8. In absolute numbers
the 90% uncertainty interval range varied between 3 and 8 kg·km-2
·yr-1
for P
and between 100 and 230 kg·km-2
·yr-1
for N. In relative numbers (here
calculated in relation to the PLC-Annual values) the uncertainty in terms of
the half-width of the 5–95 percentile interval was ±11–14% for N and P.
Figure 8. Estimated uncertainty distribution for phosphorous and nitrogen
yearly loads at the station Åsbro 3 (no. 2201), the PLC-Annual values and the
load values calculated with the official rating curve (top). The uncertainty
distribution in blue is explained in detail in the caption to Figure 4. In the
bottom row the distributions for 2007 and 2009 are shown as histograms.

26
Rating curves and water level time series are normally quality-controlled
and updated continuously. At some of the stations there were differences
because the water-level time series and/or the rating curve had been updated
after they were delivered for the PLC-Annual calculations (the data are
delivered yearly). Both of these issues occurred at the station Bröddebacken
(no. 2127) where there had been updates to the water-level time series in
2010 and where the rating curve was updated in 2012 (Figure 9).
Figure 9. Estimated uncertainty distributions for phosphorous and nitrogen
loads at the station Bröddebacken (no. 2127, see explanation to Figure 4), PLC-
Annual values and load values calculated with the official rating curve (top).
Comparison of daily discharge corresponding to the current rating curve and
water-level time series with those used for the PLC-Annual estimates (bottom).

27
The differences in the discharge data in late autumn 2010 appears to result
from downstream backwater influences on the measurements, these have
been corrected in the water level time series after the discharge had been
delivered for the PLC-Annual calculations. Uncertainties in the water level
time series resulting from such temporally poorer measurement conditions
can have an important impact on the load uncertainty (Figure 9). However,
they are not possible to include in the uncertainty estimation without
detailed local information about the measurement conditions (therefore we
only studied them implicitly here).
The relative uncertainties in the PLC-Annual load estimates in Figure 10
and 11 show the combined effect of the estimated rating curve uncertainty
and any changes made to the official discharge data (i.e. the rating curve and
water level time series) since they were delivered for the PLC-Annual
calculations. The half-widths of the 5–95 percentile intervals (stemming
from the rating curve uncertainty) were between 7 and 14% of the PLC-
Annual values for nitrogen and phosphorous loads. The combined effect
with the updated water-level time series can lead to biased uncertainties up
to ±30–40% for individual years. The largest uncertainties occurred for
station no 2127 in 2010 (see Figure 9), and for station 20 as a result of a
change in the rating curve and the water-level time series during the spring
flood (Figure 10 and 11). In 2012, the bias for station 20 appears to only
result from an updated rating curve, which shows that the magnitude of the
estimated rating curve uncertainty impact is representative of real rating-
curve changes that have occurred in the studied time period.
The differences are smaller for 2014 where the current rating curve and
water-level data had been used for the PLC-Annual calculations at most
stations. The relative uncertainties for 2014 thus illustrate the effect of the
estimated uncertainty in the rating curve only (although with small time
series differences at a few stations, e.g. no. 855).

28
Figure 10. Boxplots of relative uncertainty in PLC-Annual phosphorous loads
for all stations for 2005, 2010, 2012, and 2014. The stations are sorted by
catchment area in km2 (with the range in parenthesis), increasing from left to
right.

29
Figure 11. Boxplots of relative uncertainty in PLC-Annual nitrogen loads for
all stations for 2005, 2010, 2012, and 2014. The stations are sorted by catchment
area in km2 (with the range in parenthesis), increasing from left to right. Note
the difference in y-axis scale to Figure 10.

30
Discussion and Conclusions
Uncertainty in discharge data
The estimated uncertainty in the discharge data varied in-between the
stations in a site-specific way as a result of the rating-curve uncertainty. We
found 90% uncertainty intervals of around ±15–50% for low flows (Q95),
±10% for mean flow, and around ±10–25% for high flows (Q0.1 and
Q0.01). These values are in line with typical figures reported in the literature
– with high-flow uncertainties in the low range (see Introduction). However,
note that uncertainty magnitudes are often not directly comparable between
studies as they are reported at different time scales (typically instantaneous,
hourly, or daily flow).
Apart from rivers that go out-of-bank, large rating curve uncertainties are
typically found at stations with large extrapolations or highly variable stage-
discharge relations (e.g. McMillan and Westerberg, 2015). In our study the
rating curve uncertainty was well constrained by the gauging data for most
of the stations with the largest extrapolation in the studied period equalling
35 cm. This can be compared to extrapolations of up to two meters and
resulting larger high-flow uncertainties in a UK discharge uncertainty study
(Westerberg et al., 2016). Such differences in rating curve uncertainty relate
to factors such as size of the catchments, gauging frequency in relation to
flow time series variability, the duration of high flow events, and type of
gauging station (e.g. mobile vs. stable cross section, designed for full range
vs. low flows, etc.). For practical reasons reliable high flow gauging is more
difficult in small catchments with large high flows of short duration. The
catchments used in this study were comparably large, with lower
precipitation amounts than in the UK and with high flow events that
typically lasted a few days (compared to a few hours in the UK). The
stations we used had comparably stable sections with curves that were
typically valid for many years or the whole time series, and where most of
the rating curves had been last updated within the last 10–15 years. In
contrast, in locations with mobile cross sections rating curves may be
changed several times per year.

31
Impact of discharge uncertainty on load
uncertainty
We found uncertainties in the yearly PLC-Annual values of ±7–14% (the
half widths of the 90% uncertainty interval) as a result of the rating curve
uncertainty. When the combined effect of the rating curve and updated
water-level time series was taken into account, there were biases for some
years with uncertainties up to 30–40%. There was no clear link between the
magnitude of the high flow uncertainty at a certain station and the estimated
load uncertainties. This could be because the monthly water quality
sampling have problems to fully capture nutrient concentration peaks (in
particular for phosphorous) for specific rivers in association with spring
floods (Rönnback et al., 2009). Daily water quality sampling was performed
during the spring flood in 2008 and 2009 in the Kalixälven catchment
(station no. 17) that was used in this study. These data could therefore be
used in the future to investigate the importance of high-flow data
uncertainty on the load estimates.
Method limitations and future
developments
The reliability of the uncertainty estimates depends on the information
available about the uncertainty sources. We used an estimated discharge
measurement uncertainty for UK conditions that accounted for greater low-
flow measurement uncertainty. However, we did not account for temporal
changes in gauging methods even though they are likely to vary over time as
measurement methods have changed (e.g. Le Coz, et al., 2014). In future
applications gauging-method specific uncertainties could be included (this
was not possible within the time frame of this project). This could lead to
reduction of uncertainty at high flows at several stations, particularly in
large rivers where uncertainties in recent ADCP gaugings are likely lower
than those used here.
To assess the impact of the estimated discharge measurement uncertainty on
the results we ran the uncertainty estimation with a normally distributed
error of ±7% (the 95% interval). This resulted in about 1–3% lower
uncertainties in the PLC-Annual loads and around 2–4% in discharge
percentiles, and thus did not have a major effect on the results. Furthermore,
several of the observed effects of historic rating curve changes (e.g.
Niemisel, no 20, see above) were then outside our estimated uncertainty
intervals. Our estimates therefore appear representative of the impact of

32
rating curve changes that have occurred in the last 10 years at some of the
stations.
In general the uncertainties estimated here as a result of rating-curve
uncertainty are likely conservative estimates since they account for the total
rating curve uncertainty (i.e. including both the model approximation and
the gauging measurement uncertainty). It is important to note that the
discharge uncertainties are place-specific, that they vary with time and over
the flow range, and are therefore not necessarily valid for other time periods.
Furthermore, it is useful to consider the information given by the whole
uncertainty distribution and not just the 5–95 percentile intervals (e.g.
considering that discharge uncertainties may often be highly skewed
[Westerberg and McMillan, 2015]).
Uncertainty can change over time both as a result of actual physical changes
to the conditions at the gauging station and because of changes to the data
available. Where current data are no longer representative of past conditions
(for many stations there were historical gaugings that are no longer used), it
can be expected that there are often higher uncertainties in historical data as
a result of historically poorer gauging information. However, new data may
occasionally lead to larger uncertainties if periodically poorer measurement
conditions are detected (e.g. hysteresis effects at high flows).
Uncertainty estimation for PLC-Annual
The discharge uncertainty estimation methods that were used in this study
can be used in any other station in the HELCOM area where discharge is
calculated from water level using a rating curve. Most of the remaining
Swedish river mouth stations are, however, operated by hydropower
companies and do not use rating curves for calculating discharge (the
calculation is typically based on data from the hydropower plant). The
SMHI has initiated work with quality control measurements at these sites in
the coming years, but presently does not have concrete information about
the discharge uncertainty for these stations. As discharge uncertainties are
place-specific and the hydrometric conditions in other HELCOM countries
may be different to Sweden, we recommend that rating curve data and
uncertainties are assessed when estimating the PLC-Annual load
uncertainties.
Apart from uncertainties in the discharge data, uncertainties in the nutrient
concentration data need to be investigated to get total uncertainty estimates
for the PLC-Annual loads. Uncertainties in the nutrient concentration values
as a result of laboratory analytical uncertainty (e.g. Gustavsson et al., 2012)

33
can be studied through Monte Carlo sampling in a straightforward way and
combined with the discharge uncertainty estimates made here. Uncertainty
resulting from the sparse (monthly) temporal sampling is more difficult to
represent because of lack of information for ungauged time periods
(Kulasova et al., 2012). However, such uncertainties can be estimated and
combined with the analytical uncertainty using random Monte Carlo
sampling of the high-resolution data around the spring flood in Kalixälven
and Umeälven from 2008 and 2009. Such an analysis would result in total
uncertainty estimates that could be representative of many large rivers in
Northern Sweden with comparable degrees of river regulation (Kalixälven is
unregulated and Umeälven is regulated).
Conclusions
The estimated impact of rating curve uncertainty on daily discharge data
uncertainty quantified as 90% total uncertainty bounds was around ±15–
50% for low flows, ±10% for mean flow, and around ±10–25% for high
flows in these river-mouth catchments. The discharge uncertainties are
place-specific and depend on the data available at each site. The impact of
rating curve uncertainty on load uncertainty was ±7–14%. However, the
combined effect of the rating curve uncertainty and updated water-level time
series resulted in large biases for individual years (±30–40%). We found no
clear link between the magnitude of the high flow uncertainty at a certain
station and the estimated load uncertainties.
The potential impact of load uncertainty should be considered when the load
estimates are used for other analyses or as a basis for policy decisions. We
expect a greater impact on load comparisons between catchments compared
to between sea basins, and for individual years compared to long-term
averages. Trend analyses are expected to be obscured where the magnitude
of the uncertainty is large in relation to the strength of the measured trend.
The discharge data are updated continuously as rating curves and water
level time series are improved and we found that this could have a large
effect on the load estimates during some years. We therefore recommend
that the historic load estimates are updated regularly in the future to take
advantage of the discharge-data quality improvements.
Uncertainties in the nutrient concentration data and sampling likely
contribute substantially to the total uncertainty in the load estimate values
(Gustavsson et al., 2012; Rönnback et al., 2009). We recommend that future
studies build on the current uncertainty estimation method to include
uncertainty components from the nutrient concentration data and temporal

34
sampling (the latter where such data are available). Furthermore,
investigations of rating curve and discharge uncertainty in other HELCOM
countries are recommended as uncertainties may differ greatly depending on
hydrometric pre-conditions and available data.

35
References Coxon, G., Freer, J., Westerberg, I. K., Wagener, T., Woods, R., Smith P. J.
2015. A novel framework for discharge uncertainty quantification
applied to 500 UK gauging stations. Water Resources Research, 51,
5531–5546.
Gustavsson, H., Westerberg, I., Widén-Nilsson, E. 2012. Uncertainty
analysis of nitrogen retention in the HBV-NP model. (In Swedish:
Osäkerhetsanalys av kväveretention i HBV-NP-modellen). SMED Report
No. 101.
Juston J., Jansson P.-E., Gustafsson D. 2014. Rating curve uncertainty and
change detection in discharge time series: case study with 44-year
historic data from the Nyangores River, Kenya. Hydrological Processes,
28(4), 2509–2523.
Kulasova, A., Smith, P.J., Beven, K.J., Blazkova, S.D., Hlavacek, J. 2012. A
method of computing uncertain nitrogen and phosphorus loads in a small
stream from an agricultural catchment using continuous monitoring data,
Journal of Hydrology, 458–459, 1-8.
Le Coz J., Renard B., Bonnifait L., Branger F., Le Boursicaud R. 2014.
Combining hydraulic knowledge and uncertain gaugings in the
estimation of hydrometric rating curves: a Bayesian approach. Journal of
Hydrology, 509, 573–587.
McMillan, H. K., and I. K. Westerberg. 2015. Rating curve estimation under
epistemic uncertainty, Hydrological Processes, 29(7), 1873-1882, doi:
10.1002/hyp.10419.
McMillan, H. K., T. Krueger, and J. Freer. 2012. Benchmarking
observational uncertainties for hydrology: rainfall, river discharge and
water quality, Hydrological Processes, 26(26), 4078-4111.
Lennermark, M. SMHI, personal communication, 2015-12-04.
Pelletier, P. 1988. Uncertainties in the single determination of river
discharge: a literature review, Canadian Journal of Civil Engineering,
15(5), 834-850.
Petersen-Overleir, A., A. Soot, and T. Reitan. 2009. Bayesian Rating Curve
Inference as a Streamflow Data Quality Assessment Tool, Water
Resources Management, 23(9), 1835-1842, doi: 10.1007/s11269-008-
9354-5.

36
Rönnback, P., L. Sonesten, and M. Wallin. 2009. (In Swedish).
Ämnestransporter under vårflöden i Ume älv och Kalix älv – Effekter på
transportberäkningarna av en utökad provtagningsfrekvens. SLU,
Institutionen för vatten och miljö, Rapport 2009:20.
Sonesten, L. 2011. Calculation of the load on the sea from land areas (In
Swedish: Beräkningar av belastningen på havet från landområden),
SMED Report No. 53.
Westerberg, I. K., and H. K. McMillan. 2015. Uncertainty in hydrological
signatures, Hydrology and earth system sciences, 19, 3951-3968.
Westerberg, I. K., McMillan, H. K., Coxon, G., Wagener, T., Castellarin,
A., Montanari, A., Freer, J. 2016. Uncertainty in hydrological signatures
for gauged and ungauged catchments. Water Resources Research, 52,
1847–1865, doi: 10.1002/2015WR017635.