uncertainties related to freight transport costs and modelling · logistics project to obtain...
TRANSCRIPT

1
Uncertainties related to freight transport costs and modelling
(A literature review)
1. Introduction
Vehicle operating costs can be divided into two main categories: standing
costs and running costs.
Standing costs are defined as “the costs of having a vehicle standing and
available for work”, “are not subject to frequent change and are not generally
affected by the amount that the vehicle is used” (RTITB, 1989, p.6). This is
therefore closest to the definition of fixed costs. Examples of standing costs
include vehicle excise duty, vehicle insurance, operator’s licence fee, drivers’
guaranteed wages, depreciation and overheads.
Running costs are variable costs as their level depends on the actual use of
the vehicle. The costs of fuel, lubricants, tyres and repairs and maintenance
are examples of running or variable vehicle operating costs.
There are also external costs associated with vehicle operations. These are
the costs which are not directly borne by those who cause them and include
environmental, congestion and accident costs.
The aim of this paper is not to measure or identify trends in vehicle operating
costs. Rather, it will identify various aspects of uncertainty which have impact
on vehicle operating costs.
2. Uncertainties related to the level of vehicle operating costs
2.1 Fuel uncertainties
2.1.1 Uncertainties linked to mileage-related costs and benefits of
transport energy conservation strategies

2
Litman (2005) has evaluated four transport energy conservation strategies
(fuel efficiency standards and feebates (a rebate on the purchase of fuel-
efficient vehicles), alternative fuels, fuel tax increase, mobility management)
and their mileage-related costs and benefits. The main conclusion from his
research is that energy conservation strategies which increase vehicle
mileage (such as fuel efficiency measures) have smaller total benefits, while
strategies that reduce mileage (such as fuel tax increases) provide larger total
benefits to society. In this paper Liman evaluated four strategies which all provided the same
energy savings, but their other impacts varied significantly. Fuel economy
standards and some alternative fuels reduce the cost of driving, which
increases annual vehicle travel and associated costs. Fuel tax increases and
mobility management strategies, on the other hand, reduce vehicle travel,
providing additional benefits to society (through reduction in other impacts and
transport costs such as congestion, road and parking facility costs and
accidents). His main recommendation is therefore that a comprehensive framework for
transportation planning and policy analysis should be used, rather than using
separate measures in isolation.
2.1.2 Uncertainties related to future prices of fuel, including alternative
fuels, the cost of technologies to produce alternative fuels, suitability
and costs of alternative fuels and emission savings
Stern (2006) and Anderson (2006) elaborate on these issues. The main focus
of these works, however, is on the energy sector as a whole and findings do
not specifically relate to the freight sector.
The Stern Report provides estimates of emissions from transport between
2005 and 2050 as well as estimates of the emission saving potential and cost
of using biofuels. These estimates are provided on a ‘well-to-wheel’ basis,
which takes into account the emissions resulting from the whole lifecycle of a

3
fuel. The ‘well-to-wheel’ concept entails all stages and costs of the fuel
lifecycle, from obtaining the material form its raw state (drilling for oil and
gasses and growing and cultivating the raw material for biofuels), the
transportation of the fuels in their raw state, the production and distribution of
fuels, to its final stage of consumer use. The Climate Analysis Indicators Tool
(CAIT), quoted in the Stern report, is an information and analysis tool on
global climate change developed by the World Resources Institute. This tool
may have potential for use in subsequent work modules of the Green
Logistics project to obtain greenhouse emissions data.
2.2. Labour uncertainties
In recent times, there has been considerable uncertainty over:
• The impact of the working time directive, though this has largely worked
through the system by now;
• Future labour shortages, including provision of training and skill shortages;
• Uncertainties about the labour cost impacts of increasing levels of
congestion (see next section on congestion uncertainties).
Skills for Logistics (2005a), the official UK Sector-specific Skills Council for the
freight transport industry, recognises the shortage of large goods vehicle
(LGV) drivers as a problem which is having wider cost implications for the
logistics industry. Lack of time and facilities, the substantial costs involved in
sending a trainee to a driving school, recruitment costs in excess of £1,000
and difficulties in retaining staff are quoted as factors causing this shortage
(op. cit., 2005a, p.19).
On the other hand, the situation with the van drivers seems to be much better
compared to that of LGV drivers, the following reasons for this being:
• There is no requirement for any specialist qualification to drive a goods
vehicle up to a 3.5 tonnes mean gross weight vehicle (a category B licence
is sufficient);
• Low barriers to entry into this sub-sector of the logistics business;

4
• Many of the fixed costs (including responsibility for training) that are
associated with larger operations are either avoided or off-loaded on to
drivers (op. cit., 2005a, p.21).
However, basic driving skills are perceived as rather insufficient on their own
for successful employment in the modern freight industry. Additional skills
such as customer-facing skills, navigational skills and other ancillary skills
(e.g. installation and use of equipment) are considered highly desirable in the
case of van drivers (op. cit., 2005a, p.22).
Future scenarios addressing the uncertainties in the provision of
training and skills development in the logistics sector
Skills for Logistics (2005b) identified the main drivers of change in the logistics
industry and their implications for future skills needs. In two areas –
government policy and environmental agenda – the conclusion was that “the
industry is characterised by a very reactive approach, with (in many cases)
little ability to anticipate change or plan effectively for it” (op. cit., 2005b, p.54).
Therefore, a “need for greater current awareness of the implications of policy”
was identified.
When considering the ways in which the logistics sector should address its
future needs and seek improvements, “one of the key challenges for the
logistics sector will be to define the most cost-effective approach to the
improvement of skills and performance in the industry” (Skills for Logistics,
2005b, p.58).
Whether the sector will be successful or not in meeting its future training and
skills needs will depend largely on its integrity and rapport with government.
Four future scenarios addressing the uncertainties in the provision of training
and skills development in the logistics sector have been considered:
‘constructive engagement’, ‘managed decline’, ‘toe the nail’ and ‘every man
for himself’ (op. cit., 2005b, 73). The impacts of each of these scenarios on

5
skill levels, productivity, wages, profits and the public perception of the
industry are summarised in table 2.1.

6
Table 2.1: Future scenarios addressing the uncertainties in the provision of training and skills in the logistics sector
‘Constructive engagement’ ‘Managed decline’ ‘Toe the line’ ‘Every man to himself’
Relations within the logistics sector and with government
The logistics sector sees the value of working together and government recognises and supports the sector as a key part of the economy
The logistics sector is aware of the benefits of working together but government takes a less supportive role overall
Government takes an interested and active approach to development of logistics. Logistics firms, however, act in an individualistic way.
The players in the transport and logistics sector all act independently; no interest and support from government
Availability of support and funding
Funding is available even down to the smallest companies
Lack of funding
Large companies develop their own training schemes; training providers are given support and funding on an individual basis
Funding support for training from government both nationally and regionally declines substantially; companies are expected to find the funds themselves
Impact on skill levels Skills levels rise across the sector
Small companies are worst affected; course take-up remains low
Fragmentation of provision and variation of quality of training, leading to a lack of take-up; slow decline in skill levels across the sector
Decline in skills levels. National standards are not maintained; they lose their relevance and become ignored by employers and employees.
Impact on productivity, wages, profits, etc
Increased productivity, higher profits for companies and better remuneration for employees
Not discussed Falls in productivity
Falls in productivity across the whole sector; lack of skills has negative impact on wages and profits.
Public perception of the industry
Logistics is a dynamic and forward-looking sector that is a good career choice
The lack of support from government leads to its being seen as environmentally unfriendly, congestion causing and generally not attractive as a career choice
Decline in the public perception of the sector as a good career choice
The sector is no longer recognised as a world leader. Severe shortfall in LGV drivers forcing companies to recruit from overseas; major firms relocate overseas
Source: Adapted from Skills for Logistics, 2005b, pp.73-77

7
2.3. Uncertainties resulting from congestion and journey time variability
Congestion is identified as a source of uncertainty as it results in delays,
unreliable travel times and a less reliable service.
Van Schijndel and Dinwoodie (2000) have investigated the impact of
congestion in the Netherlands through a questionnaire survey sent to 91
transport companies. The delays associated with congestion resulted in a less
reliable service and higher costs. Trucks spent on average between 7.5% and
14.5% of their working time in congested conditions. Larger companies were
found to be less affected as they used better planning, more night driving and
IT to plan and communicate with drivers. This study also found that the
greatest impact of congestion on vehicle operating costs resulted from a
decrease in the annual kilometres travelled and an increase in drivers’ wages.
Overall, congestion reduced the annual distance travelled per vehicle
resulting in higher costs per km.
The paper did not provide a definitive answer as to the point at which
companies will start to switch from road to multimodal transport, but it
suggested that although congestion had become serious, the problem was
not yet so severe as to have reduced the break-even distance for rail
sufficiently so far. Another reason for the lack of modal switching was the lack
of sufficient economies of scale to justify companies’ capital costs in rail
equipment.
Congestion uncertainties were also identified in a study by Golob and Regan
(2001) who conducted a survey of 1200 managers of all types of trucking
companies operating in California. In this study, a structural equations model
(SEM) was used to estimate how five aspects of congestion (slow average
speeds; unreliable travel times; driver frustration and morale; higher fuel and
maintenance costs; higher costs of accidents and insurance) differ across
sectors of the trucking industry (e.g. intermodal operations, refrigerated
transport).This paper also identified how these five aspects combine to predict
the perceived overall magnitude of the congestion problem. The following

8
three aspects of congestion (1) unreliable travel times (2) driver frustration
and morale and (3) slow average speeds were identified as most problematic.
A UK study by Fowkes et al (2004) identified various sources of delays to
freight transport, other than congestion, which cause variability in journey
times. Forty interviewees (either shippers, hauliers or third party logistics
operators) were questioned. Three kinds of delay to freight transport (causing
variability in journey times) were identified: (1) Delay resulting from an
increased journey time, with fixed departure time; (2) An increase in the
spread (or range) of arrival times for a fixed departure time; (3) Schedule
delay, where the departure time is effectively put back.
Adaptive stated preference methodology was employed to provide valuations
of each kind of delay.
The authors argued that a high level of certainty and reliability of journey
times is an essential requirement for an effective operation. Reasons for such
a requirement are: (1) demand considerations (just-in-time and Quick
Response strategies; port deadlines; ‘hub and spoke’ operations) and (2)
supply-side issues (two-way loading; consolidation of deliveries; driving hours
implications; scope for round-the-clock operation; order management and
warehousing regimes).
Journey time reliability was also deemed important in the context of rising
operating costs, narrow profit margins and attempts to improve the efficiency
of transport operations.
This survey, however, was not able to provide robust estimates of values of
travel time delays or to compare the valuations of the three different types of
delay under consideration. Hence, this leaves scope for future research.
2.4 Uncertainties in measuring and evaluating supply chain performance

9
Lai et al (2004) and Danielis et al (2005) point out the need to integrate quality
and cost-related performance criteria for evaluating supply chain
performance.
Lai et al (2004) conducted a cross-sectional survey of firms in three sectors
(air and sea transport, freight forwarding and third-party logistics service
providers) to measure supply chain performance. A general conclusion of
their paper was that “…cost-related performance criteria are “non-integrated”
and fail to consider chain-wide opportunities to improve performance”.
Adopting criteria for evaluating supply chain performance should be
considered from a systems perspective (Holmberg, 2000 quoted in Lai et al,
2004) and supply chain performance should rather be composed of multiple
dimensions such as time, speed, agility, flexibility, quality and productivity.
Danielis et al (2005) in a study in an Italian context, employing Stated
Preference and adaptive conjoint analysis methodology, attempted to
estimate logistics managers’ preference for freight transport service attributes
such as freight cost, travel time, risk of delay, risk of loss and damage. A
strong preference for quality attributes over cost was reported, especially for
reliability and safety. These preferences, however, will not be easily met due
to increasing congestion on the roads and the inefficient intermodal transport
system in Italy. Therefore, the paper concluded that “…successful modal shift
policies should focus mainly on the quality aspects of the mode to be
promoted” (Danielis et al, 2005, p. 214). Hence, there is a pressing need to
improve the quality of freight and intermodal transport.
3. Cost impacts of uncertainties at a policy level
3.1 Uncertainties related to the regulation of freight transport and
redistribution of freight transport demand

10
Responses of policy makers to the problems caused by road transport may
include manipulation of transport costs (through taxation) to influence freight
transport demand (Runhaar and van der Heijden, 2005).
European policy has shifted from expanding infrastructure in response to
increasing traffic volumes to an approach based on a mix of traffic and
demand management measures. Influencing the use of freight transport
through taxation employs new taxes on road freight transport and offers the
possibility of full internalisation of all external costs produced by transport.
Runhaar and van der Heijden (2005) reported a move in the Netherlands to
restructure general tax regimes by replacing fixed annual taxes by taxes more
directly related to the actual transport volume (fuel duties and per-kilometre
taxes). Amongst their findings, conclusions and recommendations they
included:
• manipulation of transport costs does not seem to be a very effective
instrument in reducing the negative effects of freight transport;
• expansion of infrastructure should be combined with pricing strategies, in
order to provide sufficient incentives for raising transport efficiency;
• suggested measures to reduce the transport-intensity of production and
distribution, possibly involving the clustering of companies in order to
reduce transport distances and increase goods flows (this would favour
multimodal transport) and raising awareness in consumers of the
environmental impact of the products they purchase.
A study conducted in an Italian context about the redistribution of freight
transport demand calls for a more effective redistribution of trade flows among
existing links on the freight network as an important scenario to protect the
environment (Campisi and Gastaldi, 1996). This research, based on
evaluating substitution elasticities before and after the introduction of a
pollution tax and numerical simulations regarding the reduction of pollution
emissions and transportation costs, argued in favour of pollution tax as a less

11
bureaucratic and punitive policy measure for reducing the environmental
impact of economic activities.
3.2 Uncertainties related to the external costs of transport, their
valuation and internalisation
3.2.1 The social costs of intermodal freight transport
Ricci and Black (2005) provide an understanding of the damage cost
approach (based on the Impact Pathway methodology) for estimating the
environmental externalities of intermodal transport. This bottom-up approach,
adopted by the RECORDIT and several other projects, involves the following
steps:
• “Starts from the technical characteristics of the activity (technology and
type of vehicle, load factor, corridor length)
• Then calculates the so-called “burdens” associated with the activity (i.e.
emissions of pollutants, emissions of noise, frequency of accidents)
• Then models the physical impact of these burdens on human health,
crops, materials, etc
• Finally estimates the monetary value of these damages (through market
values when available, as with crops and materials, or through
Willingness-to-Pay values otherwise)” (Ricci and Black, 2005, p.268).
A comparison between intermodal transport and an all-road option per load
unit moved across three European corridors has shown that the external costs
of intermodal transport are 50-70% lower than for all-road transport.
The approaches to internalising external costs, as suggested in this paper,
should lead to “fair and efficient charges to reflect the application of the user
pays principle through the internalisation of external costs” (Ricci and Black,
2005, p.279). These charges can be calculated in €/tonne km or in €/vehicle
km. However, it was pointed out that it is difficult to establish a transparent

12
and standardised system across the whole chain as intermodal movements
involve a multitude of operators.
3.2.2 Internalising externalities
The expansion of road freight transport in Europe is a significant contributor to
congestion, pollution and accidents. Beuthe et al (2002) present results from
detailed GIS modelling of the Belgian multimodal freight transport network.
The paper argues in favour of the promotion of transportation modes with less
negative effects. This study, which employed the NODUS virtual network
methodology, conducted simulation of the flows over the Belgian network in
1995 to estimate some of the external costs of freight transport such as the
costs of pollution, congestion, accidents, noise and road damage. This paper
also provides “the simulated impacts on modal choice of a marginal external
cost internalisation and an estimation of the corresponding external cost
savings.”
Nash et al (2001) claim that “…failing to take account of external costs,
transport prices has led to excessive growth of the more polluting modes of
transport, and constrained the growth of more environmentally friendly
modes.” Results from 5 case studies were presented and methodologies for
the valuation of externalities were applied to these examples to provide
estimates of the marginal costs mainly of air pollution and global warming.
Conclusions on transport pricing regarding inter-urban and urban car
transport, road freight and inter-urban public transport were reported. The
overall conclusion was that “…the impact of optimal pricing on transport
volume and mode split appears likely to achieve a significant improvement in
air quality in major congested urban areas, but to make little contribution to
more general air pollution or greenhouse gas reduction” (Nash et al, 2001, p.
429).
3.2.3 Pricing and Regulatory instruments to internalise externalities
13
The European Commission’s Green Paper entitled ‘Towards Fair and Efficient
Pricing in Transport: Policy Options for Internalising the External Costs of
Transport in the European Union’ discusses different policy options for
internalising the external costs of transport in the European Union. Policy
approaches to reduce the size of the externality include:
(1) the internalisation approach, which aims at ensuring that each transport
user pays the full social costs associated to each individual trip and therefore
this approach offers an incentive to reduce the underlying problem;
(2) the regulatory approach which tries to achieve a reduction in the
externality without relying on the price mechanism for altering transport
behaviour, e.g. by introducing rules for products which reduce the
environmental consequences of transport (e.g. enforced use of cleaner
engine technology).
The paper argues that policy in this area should aim for achieving an optimal
level at which, in economic terms, the marginal costs equal the marginal
benefits. It also suggests the following approaches to measuring externalities:
“Externalities can be measured in monetary terms either by inferring their
value from observed market transactions (e.g. expenditure on damage
avoidance, health costs, property value loss, etc) or by asking people how
much they would be willing to pay for the reduction of a specific negative
transport externality by a certain amount” (CEC, 1995, p. 6). Existing
estimates, however, measured as % of GDP, were found insufficient. CEC
(1995) argued in favour of more detailed estimates of externalities,
distinguishing between transport modes, times, location and types of
externality.
The main transport externalities were identified and ranked in the following
order: (1) external congestion costs; (2) accidents and (3) environmental
problems (air pollution and noise).
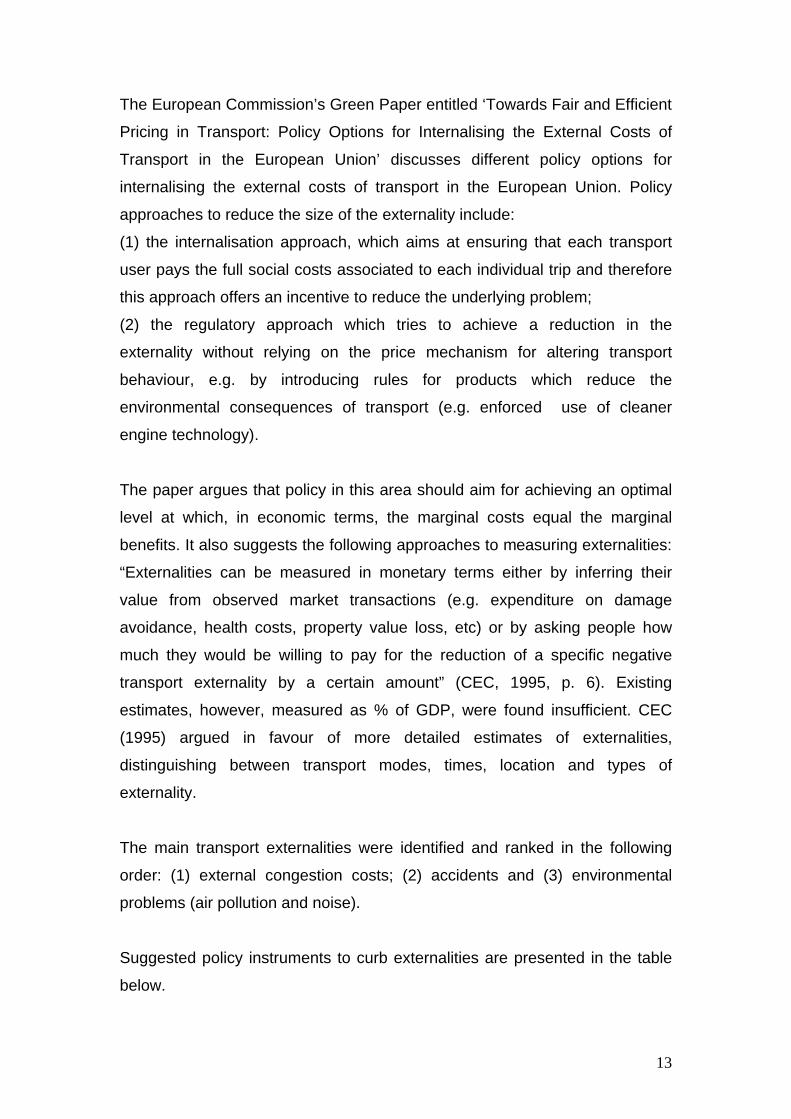
Suggested policy instruments to curb externalities are presented in the table
below.
14
Table 3.1: Possible policy instruments for efficient and equitable pricing
Short/Medium Term Long Term
Road Other Modes Road Other Modes
Infrastructure
Costs &
Congestion
- more differentiation according to use and damage in existing charging systems - kilometre tax for HGV (axle based) - tolls
- infrastructure use related charges
- electronic road pricing for congestion and infrastructure costs
- track charges and other infrastructure-use related charges
- progress in gearing assurance systems to the desired long term structure
Accidents
- labelling
- insurance systems covering full social costs and differentiating according to risk (e.g. bonus/malus)
Air Pollution
& Noise
- for cars: emission (and possibly mileage) dependent annual taxes - for HGVs: surcharges on kilometre tax - differentiated excises according to environmental characteristics of fuel - CO2 tax for global warming – identical across modes
- introduction of emissions based charges e.g. landing charges in aviation based on noise emissions
- fees based on actual emissions/noise with differentiated costs according to geographical conditions (and, possibly, time of day)
Source: CEC (1995), p. 45
3.2.4 Optimal pricing

15
Proost et al (2002) analyse the gap between present transport prices and
efficient transport prices in Europe. Efficient transport prices are defined as
“those prices that maximise economic welfare, including external costs
(congestion, air pollution, accidents)” (Proost et al, 2002, p. 41). Six urban and
interregional case studies covering both passenger and freight transport were
covered in this study, which employed an enhanced version of the TRENEN
model.
The general conclusion of this paper was that “…prices need to be raised
most for peak urban passenger car transport and to a lesser extent for
interregional road transport” (op. cit., 2002, p. 41). The paper also concluded
that “…current external costs on congested roads are a bad guide for optimal
taxes and tolls: the optimal toll that takes into account the reaction of demand
is often less than one third of the present marginal external cost” (op. cit.,
2002, p. 41).
3.2.5 Valuation of externalities: policy implications (Sansom et al, 2001)
and sources of methodological uncertainty which affect the value of
external cost estimates (Ricci, 2002)
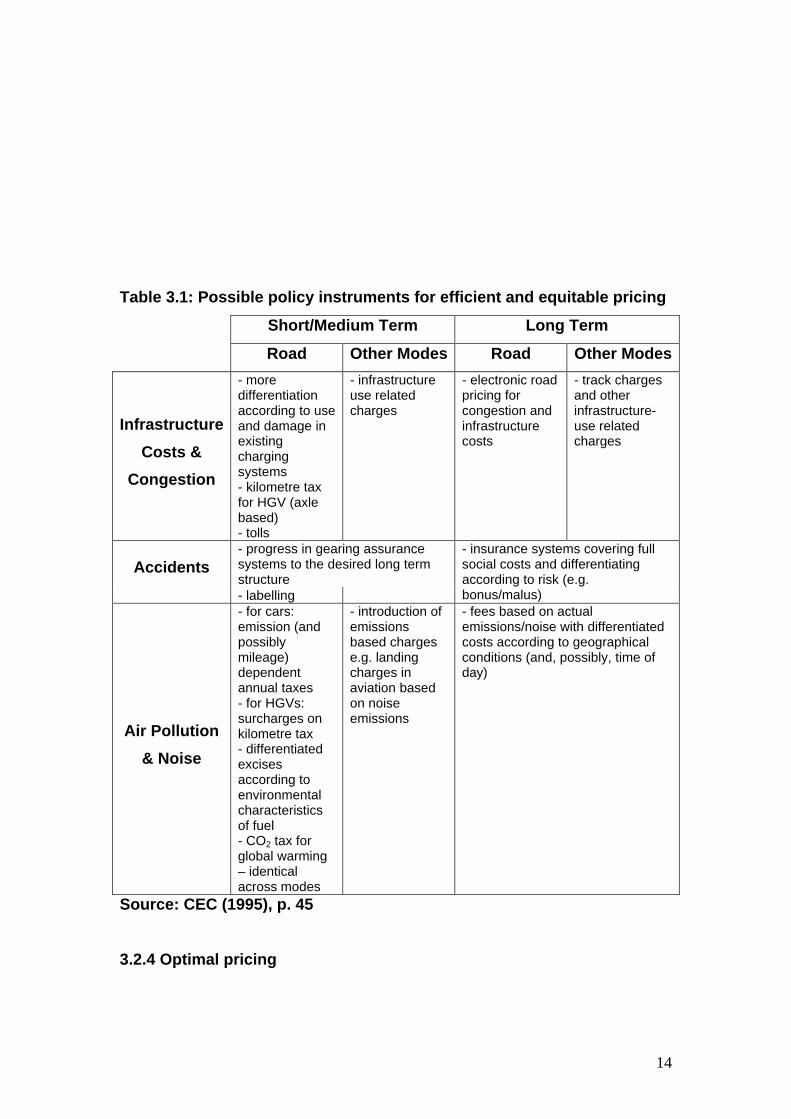
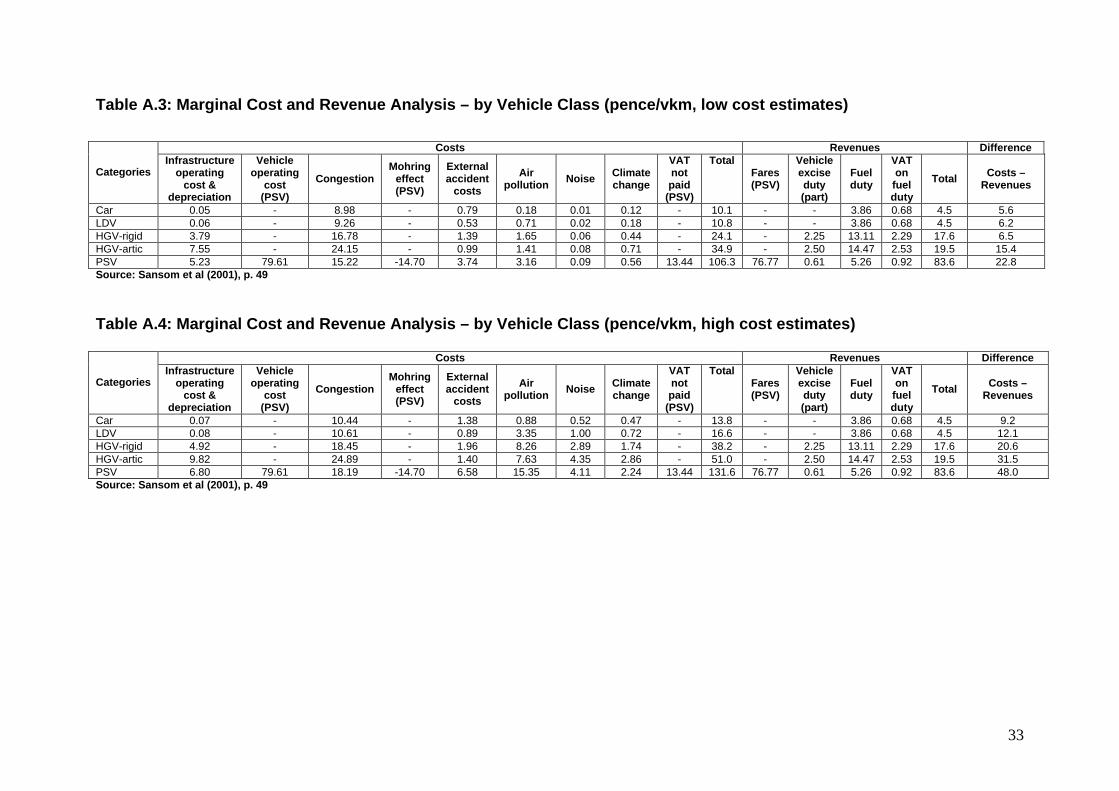
Sansom et al (2001) provide estimates of the marginal external costs of
congestion, accidents, air pollution, noise, climate change, etc. Some tables
with more detailed results of the study are enclosed in Appendix A.
The policy implications of the estimate results were considered in turn for:
• Charging
The paper provided an answer to the following questions:
(1) “What should the direction of change in prices be if existing charges are
set to maximise economic welfare? Existing charges include fuel duties and
vehicle excise duty for road and charges to rail passengers and freight
customers.”

16
For road transport, a major increase would be necessary in most cases in
order to bring prices in line with marginal costs. In the case of rail transport,
some reduction would be justified.
(2) “In broad terms, does there appear to be a need for the introduction of new
pricing instruments in the road sector? These include urban and inter-urban
pricing systems (both low technology and more sophisticated solutions) and
electronic tachographs for HGVs.”
It was concluded that “…a clear case for the introduction of more
differentiated charging mechanisms in the road sector. In addition to area,
road and vehicle type, the underlying environmental analysis confirms the
issue of reflecting strong differentials by fuel type (petrol/diesel) and Euro
vehicle emissions standard.” (Sansom et al, 2001, p. 64).
(3) “How do weighted short run marginal costs compare to charges for the
road and rail sectors at the national level? Weighting by overall vehicle or train
kilometres yields an overall measure of the overall direction of change in
charges.”
For road transport, the marginal costs substantially exceed revenues for the
five vehicle classes analysed (car, light delivery, rigid lorries, articulated lorries
and public service vehicles). In the case of rail transport, costs exceed
revenues for the passenger sector but not in the freight sector.
(4) “How do total costs on the fully allocated cost basis compare to overall
charges for the road and rail sectors at the national level?”
For the road sector it was suggested that “…revenues are in excess of fully
allocated costs by a fairly substantial margin when low estimates are used…a
more ambiguous picture emerges with high cost estimates” (op. cit., 2001, p.
65). In case of rail freight, “…overall costs on the fully allocated cost basis are
in balance with average revenues” (op. cit., 2001, p. 65).
• Taxation
It was concluded that “…the implication from an efficiency perspective would
be that fuel duty should be increased in order to reduce the gap between
marginal costs and revenues. Price increases would result in demand
reductions that would lower the marginal cost of congestion.” (op. cit., 2001,
p.65). Furthermore, a more highly differentiated system of vehicle excise

17
duties “could reward cleaner vehicles and potentially encourage a more rapid
turnover of older, more polluting vehicles”.
The introduction of differentiated road charging mechanisms was considered
as a long-term prospect. In the medium term the role of fuel duty as an
important contributor to efficiency was acknowledged.
• Subsidy
“Are current levels of subsidy justified on economic efficiency grounds? If
marginal costs are lower than (or equal to) existing charges this implies that to
maximise economic welfare the current level of subsidy is insufficiently high
(or is appropriate)”
For rail freight a greater degree of subsidy than at present was suggested.
Ricci (2002), amongst other things, claims to have contributed to the
enhancement of the credibility of valuation methodologies for estimating
external costs. Three sources of methodological uncertainty which affect the
value of the external costs estimates were identified:
(1) the scale of the production unit (emissions from vehicles, accident rates)
(2) the model of the physical impact (on a population’s health and damage to
crops for instance)
(3) the final translation into monetary terms (the value attached to better
health for instance)
The RECORDIT project quoted in Ricci (2002) has developed a dedicated
tool (the RECORDIT DSS), which allows simulation of the impacts on policy
packages on costs and price formation.
3.3 Uncertainties related to future scenarios and their implications for
travel demand and transport provision
At the top level, there are inherent uncertainties relating to the long-term
direction of world economic philosophy. Will the current trend towards global
capitalism and market forces continue unabated, leading to global logistics

18
and its inherent problems, or will there be a trend towards localisation, greater
co-operation and self-sufficiency, putting recent trends into reverse?
Beecroft and Chatterjee (2003) contribute to the existing debate about
whether the production and consumption of goods should be on a global basis
or whether these activities should be limited within the boundaries of the
nation or even the local community. The report outlines three possible
scenarios:
• Going Global
“Society will function on a global level with national and regional boundaries
becoming increasingly insignificant. People will consider that spatial range
should not act as a barrier to the production and consumption of goods with a
resultant stimulation of existing and new international markets.”
• Nation State
“The nation state will constitute the most important context for economic,
political and social development. Society will decide that the best way to
provide for the production and consumption of goods will be from within its
national boundaries with regional development and specialisation replacing
international markets wherever possible.”
• Local Living
“Society will operate primarily on a local level. Society’s production and
consumption of goods will be provided, as far as is possible, from within the
local community – be that a city, town or village – with local diversity rather
than national and international markets being the means of satisfying the
demands of consumer choice.”

19
A range of objectives to improve the efficiency and sustainability of the
movement of goods under each of the scenarios is suggested (see the table
below).
Table 3.2: Approaches to Achieving Efficiency and Sustainability under
Each Scenario
Vision Ideas to Meet Objectives Objective Going Global Nation State Local Living
To reduce freight tonne-kilometres
travelled
Virtual Globalisation
Regional Specialisation
Retailer Consolidation
To promote use of more sustainable
modes
Product Preservation and
Modification Freight Villages Bus-Trucks
To make better use of transport infrastructure
and services
Trans-European Rail Freight
Network Freight Lanes
Local Authority Freight
Transport Fleet
To reduce development
pressures on the environment
Trans-Shipment Hubs
Conveyor Distribution
Systems
Recycle and Exchange
Culture
Source: Beecroft et al (2003) Although these ideas are rather ‘futuristic’, non-conventional and a
demonstration of good will and positive thinking, they also provide an
important and innovative framework for the businesses and policy-makers of
the future. The ideas themselves have been generated by young
professionals under 35 years of age and reflect the views of the future
decision-makers about the role of the logistics and transportation sector in
society.

20
Chatterjee and Gordon (2005) also contribute to the existing debate about the
long-term direction of society by considering the implications of four future
scenarios for Great Britain and a ‘business-as-usual’ scenario for travel
demand and transport provision by 2030.
Methodological approaches for dealing with uncertainty in long-term planning
(such as ‘scenario planning’ and ‘system dynamics modelling’) have also
been discussed. The SCENES project is quoted for having adopted an
alternative approach to modelling long-term scenarios. This project has
employed a system dynamics model, ASTRA, “to generate transport forecasts
for the European Union in 2026 for a business-as-usual scenario and for an
increased road investment scenario and higher car costs scenario”
(Chatterjee and Gordon, 2005, p.261). Comparing the two methodological
approaches, ‘scenario planning’ was regarded as a “more appropriate
approach for taking account of uncertainty in long term planning” as the
‘system dynamics modelling’ approach will fail to represent reliably the
complexity of our social and economic systems and their evolution.
4. Uncertainties associated with freight modelling
4.1 Uncertainty related to the accuracy and availability of data for freight
modelling
In order to be meaningful, freight modelling must be undertaken at the
appropriate level of detail and data disaggregation. Accuracy and availability
of data for freight modelling are equally important (Whiteing et al, 2004;
Fowkes et al, 2006; ME&P, 2002; Chatterjee and Gordon, 2005). There are
some aspects for which some disaggregation will generally be needed.
Commodity type is one such dimension, though very fine disaggregation is
rarely possible here. Other potential disaggregations might include the
method of rail freight operation (i.e. trainload, wagonload, intermodal) and
length of haul.

21
The requirement for further disaggregation and detail depends very much on
the purpose of the modelling exercise. One such case in point is the need for
spatial detail, relating both to the zonal detail for freight generation and
attraction and to the network detail. Such detail will be required, for example,
if the aim of modelling is to identify particular bottlenecks on networks most in
need of capacity enhancement for any given scenario. For a purely strategic
appraisal of broad policy options, such network detail is not likely to be
required.
Another relevant issue relates to the range of transport modes incorporated
into the model. In most cases the emphasis is likely to be on road and rail. If
international movements are being considered (which is quite likely) then air
and sea transport may also need to be modelled, or at least airports, seaports
and the Channel Tunnel may need to be incorporated as places of entry/exit
to and from the UK. The increased interest in coastal shipping may call for
improved capability to model maritime flows between UK ports.
4.2 Uncertainty related to policy objectives of government or industry
Uncertainty related to policy objectives of government or industry influence
model outputs. The outputs required from any modelling exercise will depend
largely on the reasons for undertaking that exercise. Given that recent stated
objectives of government and the rail industry, as set out in the Ten Year
Plan, have been to increase rail freight by 80% in terms of tonne-kilometres,
then there is a clear need for models to produce outputs expressed in
physical measures such as tonnes lifted and tonne-kilometres moved.
Other output measures may however also be important. Tonnage-based
measures may need to be converted into levels of traffic on the relevant
networks. Hence we may need to estimate measures such as gross freight-
train kilometres operated or changes in road vehicle kilometres operated,
Emphasis might also be placed on implications for externalities, in which case
it will be important to estimate accident impacts or emissions levels, for
example, or to estimate the impact of changes in the various categories of

22
‘sensitive lorry miles’. Measures of vehicle-kilometres rather than tonne-
kilometres are particularly relevant if we wish to capture the full use of freight
vehicles and the resulting levels of pollution – including that caused by empty
running.
It is conceivable that the focus of policy might move away from physical
growth in rail freight towards increasing rail’s market share. Hence it is
important that freight models can produce forecasts of modal shares for the
scenarios to which they might be applied.
Other studies will focus on modal choice, i.e. understanding and evaluating
the factors that are considered to influence decision-makers with respect to
their choice of freight transport mode. In such cases the required model
outputs will be rather different, and will focus on the relative valuations placed
on the range of factors deemed to be appropriate.
Tavasszy (2006) provides an overview of the key issues in freight policy and
the associated modelling needs in a predominantly (though not entirely)
European context (see table 4.1). Two major requirements of freight modelling
in European context have been outlined: (1) the need for more detail (vehicle
types, logistics and spatial detail); (2) the requirement to link transport and the
economy, i.e. to extend the dimensions of freight modelling, both
geographically and functionally, into the broader transport system.
The importance of technology, especially the use of cameras and radar
technology as new methods for monitoring of freight flows, was acknowledged
as a means of enhancing the ability to collect data for freight modelling.

23
Table 4.1: Key policy issues and associated modelling needs
Policy Issues Modelling needs Growth of freight: a doubling of freight flows by 2050, worldwide (WBCSD, 2004), is expected. Within Europe, international flows are growing at twice the rate of domestic flows.
Forecasting international freight growth. Decoupling freight/economy. Sensitivity to cost changes.
Growing freight shares on the roads: as passenger traffic growth is slowing down and freight is moved by more and smaller trucks, freight is becoming more dominant on the streets.
Truck traffic behaviour Influence on freight intensities on car drivers.
Creation of seamless multimodal networks, new focus on Motorways of the Sea and inland waterways
Linking sea- and land transport models, EU multimodal networks
Concerns about international competitiveness of the EU economy, two-way relation between worldwide networks and global trade. “Freight and the economy” discussion: what are the costs and (mainly indirect) benefits of freight investments?
Develop suitable worldwide models and continental models. Improve relation between SCGE and network models.
Pricing: Additional charging all modes of transport what they can bear (or, what is fair, given external costs unaccounted for) is becoming reality. EU and member states have different attitudes and strategies towards pricing.
Situational response to cost changes (truck type, road type, time of day)
Logistic performance: the freight logistics sector is customizing its products and is creating complex, flexible networks using advanced logistics concepts such as hybrid supply chains, collaborative networks, e-logistics (both business-to-consumers and business-to-business) and return logistics.
Differentiating between goods with different logistic backgrounds; making detailed statistics available.
Changes in vehicle types HGV/LGV: light vehicle growth figures surpass other categories and appear to be more difficult to capture (both in terms of measurement and public policy).
Forecasting (causes and impacts of) choice of vehicle type
Local environmental damage: new regulations of noise and emissions require more accurate prediction of freight impacts. New technology requires investments. Citizen involvement in freight planning.
Accuracy of forecasts and level of detail (type of traffic, spatial, temporal)
24-hrs economy: to deal with congestion, firms are spreading production and logistics over day and night.
Explaining sprawl of flows to different periods of the day.
Security and safety: traffic needs to be monitored for degree of risk depending on contents or origin of freight.
Modelling critical global movements: containers, oil, dangerous goods, food
City distribution: as more stern policies are developed for city access and activities, freight requires new delivery concepts
Forecasting of tours at urban level, time of day dependent
Source: Tavasszy (2006), p. 2

24
4.3 Uncertainty related to strategic information flows
In a dynamic business environment characterised by globalisation of
economic activities and supply chains, the availability of information at the
strategic level is crucial for decision-making and yet increasingly uncertain. A
model called SMILE (Strategic Model for Integrated Logistic Evaluations),
quoted in Tavasszy et al (1998), is a Decision Support System (DSS)
constructed to provide strategic information on expected future developments
of freight flows to public and private decision makers in the transport and
logistics sector. The system is designed in a way to generate “forecasts of
freight flows related to the Netherlands for a large number of products and
modes of transport” and “by means of a graphical user interface, the DSS
assists the user with designing scenarios for simulations up to 25 years ahead
and visualises the impacts of policy measures on freight flows and the
environment” (Tavasszy et al, 1998, p. 447).
Following a review of the model and explaining the theory behind DSS,
Tavasszy et al (1998, p.458) made the following recommendations for further
research into:
• The information needs of policy makers, focusing also on conceptual
information by means of reasoning models;
• Different ways to improve the modelling of logistics processes in freight
transport system models.
5. Summary
This paper has reviewed various literature sources in the area of freight
transport costs, demand and modelling. The following categories of
uncertainty which have (either direct or indirect) impact on vehicle operating
costs have been identified:
1. Uncertainties related to the level of vehicle operating costs, including:

25
• Fuel uncertainties: (price and availability) of conventional and
alternative fuels and the cost of technologies to produce them;
• Labour uncertainties: labour shortages and the cost of provision of
training and skills development in the logistics sector;
• Impact of congestion and variability in journey times on vehicle
operating costs.
2. Cost impacts of uncertainties at the policy level, including:
• Regulation of freight transport (e.g. through taxation);
• Measuring and evaluating supply chain performance;
• Valuation of external costs and policy measures to internalise them;
• Uncertainties related to future scenarios for the long-term direction of
society and their implications for travel demand and transport provision.
3. Uncertainties associated with freight modelling, including:
• Uncertainty related to the accuracy and availability of data for freight
modelling;
• Uncertainty linked to policy objectives of government or industry, which
influence model outputs and modelling needs.
Overall, it can be concluded that there are many uncertainties relating to the
future direction of transport costs and to the future direction of transport policy
(which will influence freight users’ strategic decision-making and hence the
longer term costs of their logistics operations). Whilst there is much
agreement about the nature of the external effects emanating from the use of
freight transport, there is much less clarity about how future transport policy
should attempt to ameliorate these effects. The various papers discussed in
this review do not, for example, paint a clear picture of the efficacy of road
pricing as a means of reducing congestion and/or pollution. The lack of clarity
in policy direction is caused, at least in part, by shortcomings in the current
state of freight demand modelling and freight forecasting. Existing models do
not provide policymakers with a robust forecasting base on which to develop

26
(and perhaps more importantly to justify) their policy decisions, partly because
weaknesses in the models themselves and partly by shortcomings in the data
that underlies them. The result is a lack of clear direction of future policy,
leading to inability on the part of industry to make decisions which would
improve the environmental performance of freight transport. Operators and
shippers are not in a position, for example, to make informed decisions on
which modes of transport to use in future, or on which of the various
alternative fuels to invest in, because they are uncertain as to whether
government policies in the future will support the decisions they have made.
A much better understanding of the use of freight transport in supply chains,
better freight data and improved modelling and forecasting methods are
therefore key to informing the policy debate, leading to much greater certainty
as to route towards the more sustainable use of freight transport in the future.

27
Bibliography
Anderson, D. (2006) ‘Costs and Finance of Abating Carbon Emissions in the
Energy Sector’ [online]. Available (as at 11/12/06): http://www.hm-
treasury.gov.uk/media/8A3/32/stern_review_supporting_technical_material_d
ennis_anderson_231006.pdf
Beecroft, M., Lyons, G. and Chatterjee, K. (2003) ‘Freight and Logistics:
Number Seven in a Series of Eight Reports from the Transport Visions
Network’, Landor Publishing Ltd, London.
Beuthe, M., Degrandsart F., Geerts, J-F. and Jourquin, B. (2002) ‘External
Costs of the Belgian Interurban Freight Traffic: A Network Analysis of Their
Internalisation’, Transportation Research Part D: Transport and Environment,
vol. 7, issue 4, pp. 285-301.
Bjørner, T. B. (1999) ‘Environmental Benefits from Better Freight Transport
Management: Freight Traffic in a VAR model’, Transportation Research Part
D: Transport and Environment, vol. 4, issue 1, pp. 45-64.
Campisi, D. and Gastaldi, M. (1996) ‘Environmental Protection, Economic
Efficiency and Intermodal Competition in Freight Transport’, Transportation
Research Part C: Emerging Technologies, vol. 4, issue 6, pp. 391-406.
Chatterjee, K. and Gordon, A. (2005) ‘Planning for an Unpredictable Future:
Transport in Great Britain in 2030’, Transport Policy, vol. 13, issue 3, pp. 254-
264.
Commission of the European Communities (1995) ‘Towards Fair and Efficient
Pricing in Transport: Policy Options for Internalising the External Costs of
Transport in the European Union’, Communication by Mr Neil Kinnock to the
Commission, COM(95)691, Brussels.

28
Danielis, R., Marcucci, E. and Rotaris, L. (2005) ‘Logistics Managers’ Stated
Preferences for Freight Service Attributes’, Transportation Research Part E:
Logistics and Transportation Review, vol. 41, issue 3, pp. 201-215.
De Borger, B., Ochelen, S., Proost, S. and Swysen, D. (1997) ‘Alternative
Transport Pricing and Regulation Policies: A Welfare Analysis for Belgium in
2005’, Transportation Research Part D: Transport and Environment, vol. 2,
issue 3, pp. 177-198.
de Jong, G., Gunn, H. and Ben-Akiva, M. (2004) ‘A Meta-model for Passenger
and Freight Transport in Europe’, Transport Policy, vol. 11, issue 4, pp. 329-
344.
Fowkes, A. S., D. H. Johnson and Whiteing, A. E. (2006) ‘Freight Modelling
Final Report’, A ‘Rail Research UK’ project final report, Institute for Transport
Studies, University of Leeds, Leeds.
Fowkes, A. S., Firmin, P. E., Tweddle, G. and Whiteing, A. E. (2004) ‘How
Highly Does the Freight Transport Industry Value Journey Time Reliability –
and for What Reasons?’, International Journal of Logistics: Research and
Applications, vol. 7, no. 1, pp. 33-43.
Golob, T. F. and Regan, A. C. (2001) ‘Impacts of Highway Congestion on
Freight Operations: Perceptions of Trucking Industry Managers’,
Transportation Research Part A: Policy and Practice, vol. 35, issue 7, pp. 577-
599.
Jourquin, B. and Beuthe, M. (1996) ‘Transportation Policy Analysis with a
Geographic Information System: The Virtual Network of Freight
Transportation in Europe’, Transportation Research Part C: Emerging
Technologies, vol. 4, issue 6, pp. 359-371.

29
Koopman, G. J. (1997) ‘Long-term Challenges for Inland Transport in the
European Union: 1997-2010: Consequences for Transport Fuel Economy and
Use’, Energy Policy, vol. 25, issue 14-15, pp. 1151-1161.
Lai, K-H., Ngai, E. W. T. and Cheng, T. C. E. (2004) ‘An Empirical Study of
Supply Chain Performance in Transport Logistics’, International Journal of
Production Economics, vol. 87, issue 3, pp. 321-331.
Litman, T. (2005) ‘Efficient Vehicles Versus Efficient Transportation.
Comparing Transportation Energy Conservation Strategies’, Transport Policy,
vol. 12, issue 2, pp. 121-129.
McKinnon, A. and Ge, Y. (2004) ‘Use of a Synchronised Vehicle Audit to
Determine Opportunities for Improving Transport Efficiency in a Supply
Chain’, International Journal of Logistics: Research and Applications, vol. 7,
no. 3, pp. 219-238.
ME&P (2002) ‘Review of Freight Modelling’, Final Report of project
undertaken for DfT by a study team led by ME&P, Cambridge.
Nash, C., Sansom, T. and Still, B. (2001) ‘Modifying Transport Prices to
Internalise Externalities: Evidence from European Case Studies’, Regional
Science and Urban Economics, vol. 31, issue 4, pp. 413-431.
Proost, S., Van Dender, K., Courcelle, C., De Borger, B., Peirson, J., Sharp,
D., Vickerman, R., Gibbons, E., O’Mahony, M., Heaney, Q. et al (2002) ‘How
Large is the Gap Between Present and Efficient Transport Prices in Europe?’,
Transport Policy, vol. 9, issue 1, pp. 41-57.
Reister, D. B. (1978) ‘The Total Energy Cost of Freight Transport’, Energy,
vol. 3, issue 4, pp. 493-498.
Ricci, A. (2002) ‘Pricing of Intermodal Transport: Lessons Learned from
RECORDIT’, an essay prepared for the second seminar of the IMPRINT-

30
EUROPE Thematic Network entitled “Implementing Reform on Transport
Pricing: Identifying Mode-specific Issues”, Brussels, 14th-15th May 2002.
Ricci, A. and Black, I. (2005) ‘The Social Costs of Intermodal Freight
Transport’, Research in Transportation Economics, vol. 14, pp. 245-285.
RTITB (Road Transport Industry Training Board) (1989) ‘Calculating Vehicle
Costs: An Open Learning Pack in Support of RTITB Modules RH05IB and
RH053C’
Runhaar, H. and van der Heijden, R. (2005) ‘Public Policy Intervention in
Freight Transport Costs: Effects on Printed Media Logistics in the
Netherlands’, Transport Policy, vol. 12, issue 1, pp. 35-46.
Sansom, T., Nash, C., Mackie, P., Shires, J. and Watkiss, P. (2001) ‘Surface
Transport Costs and Charges: Great Britain 1998’, Final report for the
Department of the Environment, Transport and the Regions, Institute for
Transport Studies, University of Leeds, Leeds.
Skills for Logistics (2005a) ‘The Logistics Sector Skills Agreement: An
Assessment of Current Provision for Skills Needs in the Logistics Sector
(Stage 2)’ [online]. Available (as at 02/02/2007):
http://www.skillsforlogistics.org/documents/ssa_stage2report.pdf
Skills for Logistics (2005b) ‘The Logistics Sector Skills Agreement:
Assessment of Current and Future Skills Needs in the Logistics Sector (Stage
1)’ [online]. Available (as at 02/02/2007):
http://www.skillsforlogistics.org/documents/ssa_stage1report.pdf
Stern, N. (2006) ‘Stern Review on the Economics of Climate Change’ [online].
Available (as at 06/12/2006): http://www.hm-
treasury.gov.uk/independent_reviews/stern_review_economics_climate_chan
ge/stern_review_report.cfm

31
Tavasszy, L. A. (2006) ‘Freight Modelling – An Overview of International
Experiences’, paper prepared for the TRB Conference on ‘Freight Demand
Modelling: Tools for Public Sector Decision Making’, September 25-27, 2006,
Washington DC.
Tavasszy, L. A., Smeenk, B., Ruijgrok, C. J. (1998) ‘A DSS for Modelling
Logistic Chains in Freight Transport Policy Analysis’, International
Transactions in Operational Research, vol. 5, issue 6, pp. 447-459.
Van Schijndel W.-J. and Dinwoodie J. (2000) ‘Congestion and Multimodal
Transport: A Survey of Cargo Transport Operators in the Netherlands’,
Transport Policy, vol. 7, issue 4, pp. 231-241.
Whiteing, A. E. and Fowkes, A (2004) ‘Freight Demand Modelling, with
Particular Respect to Rail Freight’, A ‘Rail Research UK’ project report ,
Institute for Transport Studies, University of Leeds, Leeds.

32
Appendix A Table A.1: Fully Allocated Cost and Revenue Analysis – by Vehicle Class (pence/vkm, low cost estimates)
Costs Revenues Difference
Categories Cost of capital
Infrastructure operating
cost & depreciation
Vehicle operating
cost (PSV)
External accident
costs
Air pollution Noise Climate
change
VAT not paid
(PSV)
Total Fares (PSV)
Vehicle excise duty (part)
Fuel duty
VAT on
fuel duty
Total Costs – Revenues
Car 0.70 0.33 - 0.07 0.18 0.16 0.12 - 1.6 - 1.03 3.86 0.68 5.6 -4.0 LDV 0.83 0.38 - 0.04 0.71 0.30 0.18 - 2.4 - 1.03 3.86 0.68 5.6 -3.1 HGV-rigid 1.45 4.61 - 0.04 1.65 0.87 0.44 - 9.1 - 2.25 13.11 2.29 17.6 -8.6 HGV-artic 1.88 8.74 - 0.03 1.41 1.31 0.71 - 14.1 - 2.50 14.47 2.53 19.5 -5.4 PSV 1.67 6.29 79.61 0.18 3.16 1.24 0.56 13.44 106.1 76.77 0.61 5.26 0.92 83.6 22.6 Source: Sansom et al (2001), p. 48
Table A.2: Fully Allocated Cost and Revenue Analysis – by Vehicle Class (pence/vkm, high cost estimates)
Costs Revenues Difference
Categories Cost of capital
Infrastructure operating
cost & depreciation
Vehicle operating
cost (PSV)
External accident
costs
Air pollution Noise Climate
change
VAT not paid
(PSV)
Total Fares (PSV)
Vehicle excise duty (part)
Fuel duty
VAT on
fuel duty
Total Costs – Revenues
Car 1.21 0.43 - 0.82 0.88 0.52 0.47 - 4.3 - 1.03 3.86 0.68 5.6 -1.2 LDV 1.43 0.49 - 0.46 3.35 1.00 0.72 - 7.5 - 1.03 3.86 0.68 5.6 1.9 HGV-rigid 2.49 6.00 - 0.61 8.26 2.89 1.74 - 22.0 - 2.25 13.11 2.29 17.6 4.3 HGV-artic 3.22 11.36 - 0.50 7.63 4.35 2.86 - 29.9 - 2.50 14.47 2.53 19.5 10.4 PSV 2.87 8.18 79.61 2.33 15.35 4.11 2.24 13.44 128.1 76.77 0.61 5.26 0.92 83.6 44.6 Source: Sansom et al (2001), p. 48
33
Table A.3: Marginal Cost and Revenue Analysis – by Vehicle Class (pence/vkm, low cost estimates)
Costs Revenues Difference
Categories Infrastructure
operating cost &
depreciation
Vehicle operating
cost (PSV)
Congestion Mohring
effect (PSV)
External accident
costs
Air pollution Noise Climate
change
VAT not paid
(PSV)
Total Fares (PSV)
Vehicle excise duty (part)
Fuel duty
VAT on
fuel duty
Total Costs – Revenues
Car 0.05 - 8.98 - 0.79 0.18 0.01 0.12 - 10.1 - - 3.86 0.68 4.5 5.6 LDV 0.06 - 9.26 - 0.53 0.71 0.02 0.18 - 10.8 - - 3.86 0.68 4.5 6.2 HGV-rigid 3.79 - 16.78 - 1.39 1.65 0.06 0.44 - 24.1 - 2.25 13.11 2.29 17.6 6.5 HGV-artic 7.55 - 24.15 - 0.99 1.41 0.08 0.71 - 34.9 - 2.50 14.47 2.53 19.5 15.4 PSV 5.23 79.61 15.22 -14.70 3.74 3.16 0.09 0.56 13.44 106.3 76.77 0.61 5.26 0.92 83.6 22.8 Source: Sansom et al (2001), p. 49
Table A.4: Marginal Cost and Revenue Analysis – by Vehicle Class (pence/vkm, high cost estimates)
Costs Revenues Difference
Categories Infrastructure
operating cost &
depreciation
Vehicle operating
cost (PSV)
Congestion Mohring
effect (PSV)
External accident
costs
Air pollution Noise Climate
change
VAT not paid
(PSV)
Total Fares (PSV)
Vehicle excise duty (part)
Fuel duty
VAT on
fuel duty
Total Costs – Revenues
Car 0.07 - 10.44 - 1.38 0.88 0.52 0.47 - 13.8 - - 3.86 0.68 4.5 9.2 LDV 0.08 - 10.61 - 0.89 3.35 1.00 0.72 - 16.6 - - 3.86 0.68 4.5 12.1 HGV-rigid 4.92 - 18.45 - 1.96 8.26 2.89 1.74 - 38.2 - 2.25 13.11 2.29 17.6 20.6 HGV-artic 9.82 - 24.89 - 1.40 7.63 4.35 2.86 - 51.0 - 2.50 14.47 2.53 19.5 31.5 PSV 6.80 79.61 18.19 -14.70 6.58 15.35 4.11 2.24 13.44 131.6 76.77 0.61 5.26 0.92 83.6 48.0 Source: Sansom et al (2001), p. 49

34
Table A.5: Marginal Cost and Revenue Analysis – by Vehicle Class and Time Period (pence/vkm, low cost estimates)
Costs Revenues Difference
Categories
Infrastructure
operating cost & depreciat
ion
Vehicle operating
cost (PSV)
Congestion Mohring
effect (PSV)
External accident
costs
Air pollution Noise Climate
change
VAT not paid
(PSV)
Total
Fares (PSV)
Vehicle excise duty (part)
Fuel duty
VAT on
fuel duty
Total Costs – Revenues
Car, peak 0.05 - 13.22 - 0.78 0.18 0.01 0.12 - 14.4 - - 3.86 0.68 4.5 9.8 Car, off-peak 0.05 - 7.01 - 0.80 0.18 0.01 0.12 - 8.2 - - 3.86 0.68 4.5 3.6 LDV, peak 0.06 - 13.99 - 0.52 0.76 0.02 0.19 - 15.5 - - 3.86 0.68 4.5 11.0 LDV, off-peak 0.06 - 7.07 - 0.53 0.68 0.02 0.18 - 8.5 - - 3.86 0.68 4.5 4.0 HGV-rigid, peak 3.82 - 26.00 - 1.40 1.84 0.06 0.44 - 33.6 - 2.25 13.11 2.29 17.6 15.9 HGV-rigid, off-peak 3.77 - 12.75 - 1.39 1.57 0.06 0.43 - 20.0 - 2.25 13.11 2.29 17.6 2.3 HGV-artic, peak 7.57 - 33.45 - 0.99 1.42 0.07 0.72 - 44.2 - 2.50 14.47 2.53 19.5 24.7 HGV-artic, off-peak 7.55 - 19.81 - 0.99 1.41 0.08 0.71 - 30.5 - 2.50 14.47 2.53 19.5 11.0 PSV, peak 5.74 78.73 20.31 -14.43 3.82 3.17 0.09 0.58 13.33 111.3 76.19 0.61 5.26 0.92 83.0 28.4 PSV, off-peak 4.93 80.10 12.31 -14.86 3.69 3.15 0.09 0.55 13.49 103.5 77.10 0.61 5.26 0.92 83.9 19.6 Source: Sansom et al (2001), p. 56
Table A.6: Illustration of Disaggregate Output from the Road Analysis for the Outer Conurbation Area Type (pence/vkm, low cost estimates)
Costs Revenues Difference
Categories
Infrastructure
operating cost & depreciat
ion
Vehicle operating
cost (PSV)
Congestion Mohring
effect (PSV)
External accident
costs
Air pollution Noise Climate
change
VAT not paid
(PSV)
Total
Fares (PSV)
Vehicle excise duty (part)
Fuel duty
VAT on
fuel duty
Total Costs – Revenues
Car, peak 0.04 - 23.01 - 1.68 0.32 0.02 0.13 - 25.2 - - 3.86 0.68 4.5 20.7 Car, off-peak 0.04 - 7.73 - 1.68 0.29 0.02 0.12 - 9.9 - - 3.86 0.68 4.5 5.3 LDV, peak 0.05 - 23.01 - 0.88 1.45 0.04 0.20 - 25.6 - - 3.86 0.68 4.5 21.1 LDV, off-peak 0.05 - 7.73 - 0.88 1.30 0.04 0.18 - 10.2 - - 3.86 0.68 4.5 5.6 HGV-rigid, peak 2.35 - 38.72 - 1.68 3.54 0.14 0.46 - 46.9 - 2.25 13.11 2.29 17.6 29.2 HGV-rigid, off-peak 2.35 - 13.01 - 1.68 3.11 0.14 0.42 - 20.7 - 2.25 13.11 2.29 17.6 3.1 HGV-artic, peak 7.84 - 56.59 - 1.68 4.36 0.27 0.87 - 71.7 - 2.50 14.47 2.53 19.5 52.2 HGV-artic, off-peak 7.84 - 19.05 - 1.68 3.84 0.27 0.78 - 33.5 - 2.50 14.47 2.53 19.5 14.0 PSV, peak 1.57 83.87 34.52 -14.00 4.20 4.98 0.14 0.65 13.48 129.4 77.04 0.61 5.26 0.92 83.8 45.6 PSV, off-peak 1.57 83.87 11.60 -14.00 4.20 4.45 0.14 0.59 13.48 105.9 77.04 0.61 5.26 0.92 83.8 22.1 Source: Sansom et al (2001), p. 58

35
Table A.7: Fully Allocated Cost and Revenue Analysis for Rail Freight (£/train km, low cost estimates)
Costs
Category Infrastructure
Vehicle
operating Air pollution Noise
Climate
change Total
Revenue
Difference
Costs -
Revenue
Bulk 3.53 8.60 0.166 0.170 0.131 12.60 13.01 -0.41
Other 3.33 9.70 0.166 0.170 0.131 13.50 13.61 -0.11
Freight Sector 3.41 9.28 0.166 0.170 0.131 13.16 13.41 -0.25
Note: low cost estimates apply to environmental categories only. Source: Sansom et al (2001), p. 62
Table A.8: Fully Allocated Cost and Revenue Analysis for Rail Freight (£/train km, high cost estimates)
Costs
Category Infrastructure
Vehicle
operating Air pollution Noise
Climate
change Total
Revenue
Difference
Costs -
Revenue
Bulk 3.53 8.60 1.201 0.563 0.525 14.42 13.01 1.41
Other 3.33 9.70 1.201 0.563 0.525 15.32 13.61 1.71
Freight Sector 3.41 9.28 1.201 0.563 0.525 14.98 13.41 1.57
Note: high cost estimates apply to environmental categories only. Source: Sansom et al (2001), p. 62

36
Table A.9: Marginal Cost and Revenue Analysis for Rail Freight (£/train km, low cost estimates) Costs
Category Marginal
infrastructure
usage
Vehicle
operating
cost
Air pollution Noise Climate
change Total
Revenue
Difference
Costs -
Revenue
Bulk 1.79 8.60 0.166 0.170 0.131 10.86 13.01 -2.15
Other 0.88 9.70 0.166 0.170 0.131 11.05 13.61 -2.56
Freight Sector 1.19 9.28 0.166 0.170 0.131 10.94 13.41 -2.47
Note: low cost estimates apply to environmental categories only. Source: Sansom et al (2001), p. 62
Table A.10: Marginal Cost and Revenue Analysis for Rail Freight (£/train km, high cost estimates)
Costs
Category Marginal
infrastructure
usage
Vehicle
operating
cost
Air pollution Noise Climate
change Total
Revenue
Difference
Costs -
Revenue
Bulk 1.79 8.60 1.201 0.563 0.525 12.68 13.01 -0.33
Other 0.88 9.70 1.201 0.563 0.525 12.87 13.61 -0.74
Freight Sector 1.19 9.28 1.201 0.563 0.525 12.76 13.41 -0.65
Note: high cost estimates apply to environmental categories only. Source: Sansom et al (2001), p. 63
37
Table A.11: Average environmental costs of road vehicles (1998 fleet, central estimate), pence per vehicle km Air Pollution Climate change Noise Cars 0.35 0.24 0.34 Lights 1.39 0.36 0.65 Rigids 3.40 0.87 1.88 Artic 3.08 1.43 2.84 PSVs 6.48 1.13 2.68 Source: Sansom et al (2001), p.98

38
Table A.12: Marginal Environmental Costs for the Average LDV (1998) Air Quality Climate Change Noise M-way (1) 5.9 0.4 2.5 T&P (1) 8.5 0.5 1.6 Other (1) 9.6 0.5 2.4 M-way (2) 4.1 0.3 2.1 T&P (2) 6.6 0.5 2.4 Other (2) 6.6 0.5 2.1 M-way (3) 2.9 0.3 1.3 T&P (3) 4.1 0.4 1.3 Other (3) 4.6 0.5 1.3 M-way (4) 5.1 0.4 1.4 T&P (4) 5.8 0.4 1.4 Other (4) 6.6 0.5 1.4 M-way (5) 2.3 0.3 1.4 T&P (5) 2.8 0.4 1.3 Other (5) 2.8 0.4 1.3 T&P (6) 2.2 0.4 1.3 Other (6) 2.2 0.4 1.3 T&P (7) 2.2 0.4 1.3 Other (7) 2.0 0.4 1.3 T&P (8) 1.5 0.4 1.2 Other (8) 1.5 0.4 1.2 T&P (9) 1.2 0.4 1.0 Other (9) 1.2 0.4 1.0 T&P (10) 0.9 0.4 0.8 Other (10) 0.9 0.4 0.8 M-way (11) 0.8 0.4 0.3 T&P (11) 0.6 0.3 0.2 Other (11) 0.6 0.3 0.3 Key: 1=Central London; 2=Inner London; 3=Outer London; 4=Central Conurbations; 5=Outer Conurbations; 6=Area>25 sq kms; 7=Area 15-25 sq kms; 8=Area 10-15 sq kms; 9=Area 5-10 sq kms; 10=Area 0.01-5 sq kms; 11=Rural Source: Sansom et al (2001), p.101

39
Table A.13: Marginal Environmental Costs for the Average Rigid Vehicle (1998) Air Quality Climate Change Noise M-way (1) 14.4 0.8 7.7 T&P (1) 25.7 1.3 5.0 Other (1) 31.0 1.5 8.7 M-way (2) 9.8 0.8 10.6 T&P (2) 19.9 1.3 8.7 Other (2) 19.9 1.3 10.6 M-way (3) 7.0 0.8 4.0 T&P (3) 10.9 1.1 4.0 Other (3) 14.2 1.3 4.0 M-way (4) 12.7 0.9 4.2 T&P (4) 15.3 1.1 4.1 Other (4) 19.9 1.3 4.1 M-way (5) 5.5 0.8 4.2 T&P (5) 7.1 0.9 4.1 Other (5) 7.1 0.9 4.1 T&P (6) 5.6 0.9 4.0 Other (6) 5.6 0.9 4.1 T&P (7) 5.6 0.9 3.9 Other (7) 4.9 0.8 4.0 T&P (8) 3.7 0.8 3.5 Other (8) 3.7 0.8 3.5 T&P (9) 3.1 0.8 3.2 Other (9) 3.1 0.8 3.2 T&P (10) 2.5 0.8 2.5 Other (10) 2.5 0.8 2.6 M-way (11) 1.6 0.9 0.8 T&P (11) 1.6 0.9 0.7 Other (11) 1.6 0.8 0.9 Key: 1=Central London; 2=Inner London; 3=Outer London; 4=Central Conurbations; 5=Outer Conurbations; 6=Area>25 sq kms; 7=Area 15-25 sq kms; 8=Area 10-15 sq kms; 9=Area 5-10 sq kms; 10=Area 0.01-5 sq kms; 11=Rural Source: Sansom et al (2001), p.101

40
Table A.14: Marginal Environmental Costs for the Average Artic Vehicle (1998) Air Quality Climate Change Noise M-way (1) 17.9 1.6 15.4 T&P (1) 30.7 2.2 9.9 Other (1) 36.5 2.4 17.4 M-way (2) 12.1 1.4 21.3 T&P (2) 23.9 2.2 17.4 Other (2) 23.9 2.2 21.3 M-way (3) 8.7 1.4 8.0 T&P (3) 13.4 2.0 7.9 Other (3) 17.2 2.2 7.9 M-way (4) 15.8 1.8 8.4 T&P (4) 18.7 2.0 8.3 Other (4) 23.9 2.2 8.3 M-way (5) 6.9 1.4 8.3 T&P (5) 9.0 1.8 8.2 Other (5) 9.0 1.8 8.2 T&P (6) 7.2 1.8 8.0 Other (6) 7.2 1.8 8.1 T&P (7) 7.2 1.8 7.9 Other (7) 6.4 1.6 7.9 T&P (8) 4.9 1.6 7.1 Other (8) 4.9 1.6 7.1 T&P (9) 4.1 1.6 6.4 Other (9) 4.1 1.6 6.4 T&P (10) 3.3 1.6 5.1 Other (10) 3.3 1.6 5.2 M-way (11) 1.9 1.5 1.5 T&P (11) 2.0 1.4 1.5 Other (11) 2.3 1.4 1.9 Key: 1=Central London; 2=Inner London; 3=Outer London; 4=Central Conurbations; 5=Outer Conurbations; 6=Area>25 sq kms; 7=Area 15-25 sq kms; 8=Area 10-15 sq kms; 9=Area 5-10 sq kms; 10=Area 0.01-5 sq kms; 11=Rural Source: Sansom et al (2001), p.102

41
Table A.15: Total Environmental Costs for the Road Sector (1998) by vehicle type, £Million Low Central High Cars 1,714 3,499 7,045 Lights 584 1,180 2,492 Rigids 393 817 1,713 Artic 419 896 1,809 PSVs 253 525 1,107 Source: Sansom et al (2001), p.106