unccd: the linkages between climate change and land degradation · 2015-06-05 · unccd: the...
TRANSCRIPT

UNCCD: The Linkages
between Climate
Change and Land
Degradation
United Nations Convention
to Combat Desertification
Sergio A. Zelaya Bonilla
SBSTA Dialogue 2015
Bonn, 4 June 2015

Subject Vulnerability to Land
Degradation (LD) : A global issue

Land: part of the CC problem
• AFOLU ~ 25% (10-12 GtCO2e/yr) anthropogenic GHG emissions (IPCC 2014)
• AFOLU emissions are originated
• ~ 50% by agricultural production and
• ~ 50% by LULUCF
• AFOLU emissions are the major source of GHG emissions in many developing countries with limited fossil fuel use
Without addressing AFOLU = no effective CC agreement

Subject
The 8 world’s major emitters (USA, China, the EU, Brazil, the Democratic Republic of the Congo, India, Indonesia and Mexico) = 57% of global AFOLU emissions (Source: Union of concerned scientists: Halfway There? What the Land Sector Can Contribute to Closing the Emissions Gap, p 2-3.)
Who’s emissions?

Subject
An untapped opportunity:
Using AFOLU’s mitigation potentials to narrow the emission gap while further advancing to a low-carbon economy
• AFOLU uniqueness: the only sector allowing for emission reductions AND carbon sequestration
• AFOLU max. mitigation potential: ~ 7–11 GtCO2e/yr in 2030 (IPCC 2014)
Has this large potential been used so far? Only marginally!
• So far land-related mitigation focused on forests (REDD, CDM af/reforestation etc.)
Land: part of the CC solution

Subject
~ 7 Gt CO2eq/year (2020, 2030)
or about three-fourths of the 2020 gap and half of the 2030 gap.
(Source: Union of concerned scientists: Halfway There? What the Land Sector Can Contribute to Closing the Emissions Gap, p 2-3.)
AFOLU median mitigation Potential of 8 major emitters

Subject
• Land / Agriculture mitigation potential > Forestry
• Restoration of organic soils and degraded land alone: up to 2 GtCO2e/yr
• Soil organic carbon (SOC) overall sequestration potential : 1.5 – 4 tCO2e/yr
(IPCC 2007)
Source: IPCC
2014: 849

Subject
1. Between 10–20 % of drylands are degraded; 24 % of globally usable land is degraded, with an estimated economic annual loss of USD 40 billion
2. The adoption of sustainable land management (SLM) practices could deliver up to US$ 1.4 trillion in increased crop production
LD Basic economics
(ELD The rewards of investing in sustainable land management, p. 12) UNCCD 2013. The Economics of Desertification, Land Degradation and Drought: Methodologies and Analysis for Decision-Making. Background document. UNCCD 2nd Scientific Conference. http://2sc.unccd.int/fileadmin/unccd/upload/documents/Background_documents/Background_Document_web3.pdf • ELD Initiative. 2013. The rewards of investing in sustainable land management. Interim Report for the ELD Initiative: A global
strategy for sustainable land management. http://www.eld-initiative.org/fileadmin/pdf/ELD-Interim_Report_web.pdf)

Subject
1. Consequences of LD:
• food insecurity,
• reduced availability of clean water,
• increased vulnerability of affected areas and their populations to climate change,
• biodiversity loss,
• presence of invasive species, pests,
• Migration and socio-political insecurity.
2. 1 to 1.5 billion people currently are directly negatively affected by LD
(Source: Economics of Land Degradation (ELD) Initiative: A global strategy for sustainable land management, 2013)
LD threatens fertile land

Subject
• Today:
• 52% of agricultural land affected by degradation
• Drylands=40% land mass (6 billion ha); 1/3 population; 44% food production
• Nearly 1 billion hungry (80% small farmers, landless poor) in LDCs, developing
• 40% international conflicts linked with land and NNRR: in 2008 > 30 countries
• Globally, Land area stricken by drought more than doubled since 1970s
• AFOLU emissions 10-12 Gt of CO2e per year (24% of total emissions): 5-5.8 Gt CO2e per year from agriculture and 4.3-5.5. Gt CO2e per year from LULUCF
• In 10 Years: 1.8 billion of world population in 2025 will be living with absolute water scarcity and 2/3 (or 5.3 billion) could live under water-stress conditions
• In 25 years: LD may reduce global food production up to 12%, and lead to an increase of 30% of world food prices
• In 30 years: Some 135 million people may be displaced as a result of desertification and LD (Source: UNCCD, 2014)
Land is a finite resource Global arable lands = 1/32 of the planet

Subject
1. Unsustainable land practices
2. Climate change
3. Population dynamics
4. Changes in consumption patterns
5. Changes in investment
(Source: ELD Initiative: A global strategy for sustainable land management, 2013; UNCCD 2014)
Main drivers of LD
The map can be interpreted as an indicator of change /stability of land apparent capacity to sustain the dynamic equilibrium of primary productivity.

Subject
The scientific basis:
• reversing LD (restoring degraded land) is in itself adaptation and mitigation to CC.
The political basis:
• “The future we want” in 2012, UN country members resolved to achieve a land-degradation neutral (LDN) world (paragraph 206).
• SD Goal 15 & target 15.3 by 2030: Protect, restore and promote sustainable use of terrestrial ecosystems, sustainably manage forests, combat desertification, and halt and reverse LD and halt biodiversity loss.
Why care about CC and LD?

Subject CC and LD Feedbacks
• GHG emissions associated with soil / vegetation loss are the key mechanism which land degradation contributes to CC (MA, 2005a)
• Dryland soil contain more than a quarter of global organic carbon stores and nearly all the inorganic carbon (MA, 2005a)
• Around 300 million tons/year of carbon likely to be lost to the atmosphere from drylands as a result of LD (4% of total global emissions from all sources combined) (MA, 2005a; Neely et al., 2009)
• Increases in extreme weather events and human-induced LD are likely to lead to a loss of vegetation cover, mostly in areas with 500-750mm annual rainfall (Thomas,2008)
• Grazing-induced LD likely to emit 100 million tCO2e per year in drylands
alone (FAO/LEAD 2006)
• Conversely, restoration of degraded drylands could sequester 12–20 PgC over 50 years, if SLM practices applied globally (Lal, 2001, 2004; Suleimenov and Thomas, 2007;
Thomas, 2008)
Source: Impulse Report – Climate change and desertification: Anticipating, assessing & adapting to future change in drylands.
Available at: <http://3sc.unccd.int/documents-outputs/preparatory-documents/impulse-report>

• AR 5: Dry areas expected to increase in many parts of the world, with a growing extent of current semi-arid areas, posing a risk of proper ecosystem functioning.
• As the productivity and availability of land resources fall, so does adaptive capacity and resilience: unsustainable use of natural resources for food and energy causes land degradation locally, increases carbon emissions, reduces biodiversity, and diminishes rainfall at multiple scales.
Policy Focus for CC mitigation and adaptation: Common approach for addressing LD in drylands today and in non-dryland areas at risk with urbanization and infrastructure development included.
Subject Land and climate: small changes cause larger global changes

• Land ecosystems (LE) used for: • provisioning services (food: croplands, rangelands…) and • “natural” purposes (parks protected areas).
• Large proportion of LE used for provisioning services is “degraded” mostly due to the modes of use
Policy focus for CC mitigation and adaptation: address non-degraded productive land and under restoration in drylands and those at risk of becoming drier, by exploring, identifying and further improving SLM methods and practices thus preventing and avoiding “extensification” of LD.
Subject
Land and climate: small changes cause larger global changes (cont.)

Subject
SLM / ecosystem-based approaches have the potential to simultaneously enable CC adaptation, land restoration and biodiversity protection: • SLM can build resilience for CC by increasing soil organic matter
(addressing GHG emissions)
• SLM maintains biomass/vegetation contributing to stable regional climates (addressing biomass and vegetation cover loses)
• Scientific knowledge on adaptation with understanding of local knowledge leads to cost-effective development of appropriate adaptation choices
• Adaptation options need to be complementary; bundles of adaptation options implemented together can avoid maladaptation and reduce vulnerability to land degradation
Source: Impulse Report – Climate change and desertification: Anticipating, assessing & adapting to future change in drylands. Available at: <http://3sc.unccd.int/documents-outputs/preparatory-documents/impulse-report>
A “triple-win” option
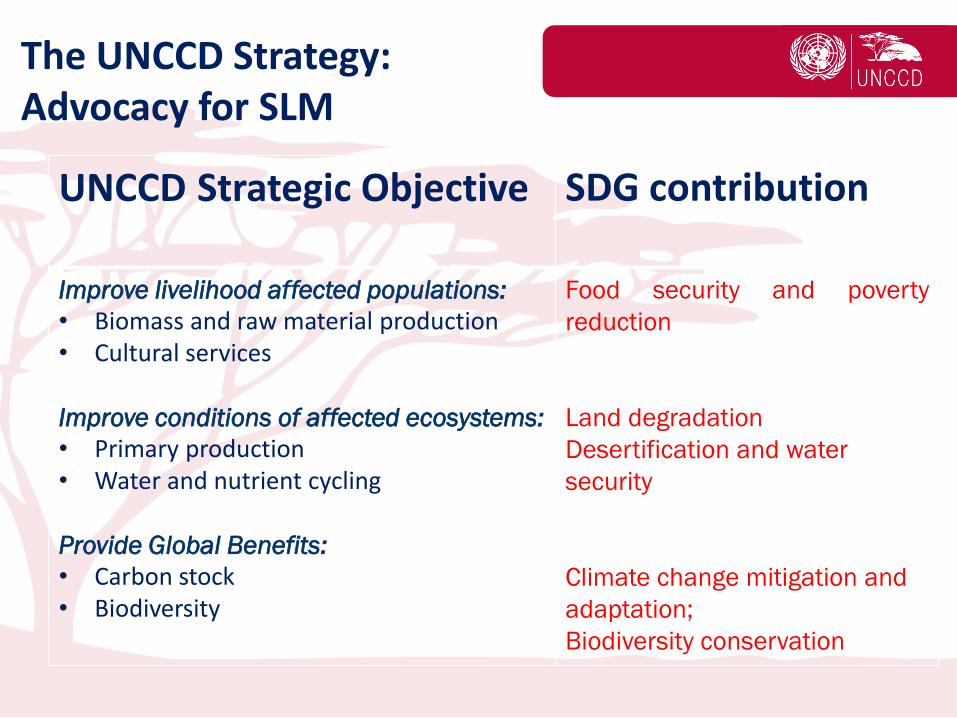
UNCCD Strategic Objective SDG contribution
Improve livelihood affected populations:
• Biomass and raw material production • Cultural services
Improve conditions of affected ecosystems:
• Primary production • Water and nutrient cycling
Provide Global Benefits:
• Carbon stock • Biodiversity
Food security and poverty
reduction
Land degradation
Desertification and water
security
Climate change mitigation and
adaptation;
Biodiversity conservation
The UNCCD Strategy: Advocacy for SLM

Subject
Achieving LDN require: reducing the
rate of LD and newly occurring
degradation by restoring the productive capacity
and the provision of other ecosystem services
of actual degraded lands (Source: Chasek et al. 2014 Journal of Arid Environments)
Source (G. Kust 2015)
Working Definition of LDN: LDN is a state whereby the amount and quality of land resources, necessary to support ecosystem functions and services and enhance food security, remains stable or increases within specified temporal and spatial scales and ecosystems (Source: UNCCD IWG on LDN, 2015)
The Land Degradation Neutrality argument: an opportunity for SLM

Subject Some SLM/ LDN Benefits
1. Contribution to a low carbon world
Total AFOLU mitigation potential (2030): 7.1-10.6 Gt CO2e per year
Maximum mitigation potential (at a price of 100 USD per ton of CO2e) • for restoration of degraded lands: O.7 Gt CO2e per year • for restoration of organic soils: 1.25 GtCO2e per year
• Conservative option: 6% of potential of degraded lands
• Opportunity: restoring 12 million ha/year @ 3.5t CO2e/Ha = 0.042 GtCO2e
• 180 million ha restored by 2030: Impact @ 3.5t CO2e/Ha = 0.63 Gt CO2e
• Sustainable option: Full potential of degraded lands
• Restoring 133 million ha/year @ 3.5t CO2e/Ha = 0.47 GtCO2e
• 2 billion ha restored by 2030: Impact @ 3.5t CO2e/Ha = 7 GtCO2e (Using IPCC figures; IPCC 2014:817 and 849)
2. Multiple benefits Improved livelihoods (food and water security/ productivity increase / employment options) primarily target 1 billion people living in dryland areas (but such benefits for all)

Subject
1. Support to Intended Nationally Determined Contributions (INDCs). Key Information on land use for the scope and nature of the INDCs likely to include:
• Methodologies for assessing land use emissions and removals on various scales (IPCC methodologies)
• Mitigation potential analyses for land use sector and specific countries and activities (if available)
• National reports (national communications, GHG inventories, biennial reports with information on mitigation actions)
• Projects, actions and plans (NAMAs, national strategies for LDN/SLM, national climate change plans, national economic development plans)
Opportunities:
UNCCD support to Parties

Subject
2. Practical approach:
• Integrating/combining sources of data for the INDCs: - assessing the mitigation potential of existing plans/policies
using IPCC default stock change and emission factors
3. Setting up of national land use mitigation targets, their potential and co- benefits
• INDCs and their AFOLU/LULUCF emissions component: - Target setting at several scales - Baselines/references - Measuring, reporting and verification
4. Focused action towards achieving LDN can be a starting point when reporting on INDCs implementation. UNCCD continues offering support to countries for the development of land components in the INDCs
Opportunities:
UNCCD support to Parties

Opportunities: UNCCD support to Parties
• Trends in land use/cover (land cover change can be used as a proxy for
land use change)
• Trends in land productivity (to identify and prioritize areas with high magnitude and extent of LD); and
• Trends in soil organic carbon stocks (Positive trends in SOC reflect the impact of SLM practices)
These indicators are already part of the UNCCD framework. Can UNFCCC consider DLDD trends more explicitly using these opportunities when addressing the 2 degrees c target?
5. Land-based indicators common for reporting on CC adaptation and mitigation and on progress on LDN and SLM

Subject
Thank you!
Presentation prepared by the UNCCD secretariat
Contact: Sergio A. Zelaya, [email protected]