un egov background paper 2 - united nations public...
TRANSCRIPT

E-Government and its Measurements
UN E-Government EGM Meeting Background Paper
4 May 2017

Page 2
1. E-government and its Measurements
Why Measure e-government?1
To build effective public sector governance, ICT is used to make the functioning of government more efficient and in
improving the delivery of government services for organizations and individuals.
E-government development measurement over the years and across the nations is important to analyze the relative
and absolute development of e-government world-wide and also to measure the development against the 2030
Agenda for Sustainable Development and other major international commitments and goals.
E-government development is at varying stages across countries. Developed economies are relatively advanced in
usage of ICT for improving functioning of the public sector and service delivery. However, most developing countries
are less advanced and a comparable measurement framework is important for their e-government improvements.
Examples: Access to information on available services to complete online processing of requests related to permits,
certificates or payments. Effective use of e-government can also improve the efficiency and effectiveness of the public
sector and linkages among government agencies.
Computers and networks are used to improve the personal productivity of government workers and help in building a
more efficient business process which is transitioned to offer government services electronically. In this context, an
emerging imperative is to reformulate e-government policies and programmes to exploit these capacities.
1.1. Overview on Benchmarks2
The digital government, e-government development and the uptake of ICT in the public sector are measured across
the globe and benchmarked against each other by various methodologies provided by universities, companies (such as
Mckinsey, Cisco, etc.), public-private organizations and multi-lateral international organizations (UN, World Bank,
World Economic Forum, European Commission, OECD, etc.)
These benchmarks mainly assess the progress made by an individual country over a period of time and compare its
growth against other countries which have a political and potentially economic impact and which can influence the
development of e-government services.
The high-level macro indicators to measure the uptake of the ICT and e-government in the public sector of a country
are mainly related to the political and regulatory environment, business and innovation environment, infrastructure,
affordability, digital skills, people, business and government usage, economic and social impacts.
These benchmarking surveys and reports serve as a tool for the countries and public institutions to learn from each
other, identify areas of opportunities and challenges in e-government or digital government and accordingly develop
strategies, policies, initiatives for those areas. It also helps in assessing the ICT readiness of the country and build
capacities in the gap areas. It further enables discussions of intergovernmental bodies, including the United Nations
General Assembly and the Economic and Social Council, on development and critical role of ICT and issues related to
e-government.
Benchmarking publications are mainly intended for –
� Policy makers
� Government officials
� Academia
� Civil society
� Private sector
1 Framework for a set of e-government core indicators, Economic Commission for Africa, March 2012
2 E-government Benchmarking in European Union: A Multicriteria Extreme Ranking Approach, 17 February 2017

Page 3
� Other practitioners or experts in the areas of public administration, e-government, and ICT for development
1.1.1. United Nations E-government Benchmark Indicators:3
United Nations e-government issued a survey which covers 193 countries and helps countries launch their
implementation of the 2030 agenda for sustainable development and covers 17 sustainable development goals in
support of the agenda.
Progress of e-government development in United Nations (UN) is assessed by E-government Development Index
(EGDI) and is the composite index based on weighted average of three normalized indices.
� 1/3rd: Telecommunications Infrastructure Index (TII) wherein data is provided by the International
telecommunication union (ITU)
� 1/3rd: Human capital index (HCI) wherein data is provided by the United Nations Educational, Scientific and
Cultural Organization (UNESCO)
� 1/3rd: Online service index (OSI) wherein data is collected from an independent survey questionnaire that
assesses the national online presence of all 193 United Nations Member States
� E-participation index: quantitative sub-index of the OSI
E-government Development Index (EGDI):
It is the weighted average of normalized scores on the 3 dimensions: OSI, HCI and TII. These are composite measures
and can be analysed and extracted independently.
Before normalizing the 3 component indicators, the Z-score standardization procedure is implemented for each
component indicator to ensure that the overall EGDI is equally decided by the three component indexes (comparable
variance subsequent to the Z-score standardization). If the standardization treatment is not done then EGDI would
mainly depend on the component index with the greatest dispersion. The arithmetic average sum becomes a good
statistical indicator.
The composite value of each composite index is further normalized to fall between the range of 0 to 1 and the overall
EGDI is derived by taking the arithmetic average of the 3 component indexes.
Indicator Index Description/Components
e-government
Development
Index (EGDI)
Telecommunications
Infrastructure Index (TII)
� 1/5: Individuals using the Internet (% population)
� 1/5: Fixed (wired)-broadband subscriptions (per 100)
� 1/5: Wireless broadband subscriptions (per 100)
� 1/5: Mobile-cellular subscriptions (per 100)
� 1/5: Fixed-telephone subscriptions (per 100)
Human capital index (HCI)
� 1/3: Adult literacy rate (%)
� 2/9: Mean years of schooling
� 2/9: Expected years of schooling
� 2/9: Gross enrolment ratio (%)
3 United nations e-government survey 2016

Page 4
Indicator Index Description/Components
Online service index (OSI)
� United Nations Volunteers (UNVs) assessed the country’s national
website in its native language including the national portal, e-services
portal and e-participation portal as well as websites of education,
labour, social services, health, finance and environment ministries
� The survey has a binary response and generated patterns for every
positive answer
� After initial assessment, the evaluations were done on each country
and compared and discrepancies are reviewed again
� Final review is done by the data team co-ordinators by using multiple
methods and sources and then sent for senior researcher approval
� After the 3 step evaluation process, the statistics team produces the
OSI ranking and scores are created
� The total points scored are normalized in the range of 0 to 1
� The online index value for a given country is equal to the actual total
score less the lowest total score divided by the range of total score
values for all countries
E-participation index
� Derived as a supplementary index to the UN e-government survey
� Focus on use of online services to provide information to citizens (e-
information sharing), interaction with stakeholders (e-consultation)
and engagement in decision-making processes (e-decision-making)
� Identify which countries use online tools to promote interaction
between the citizens and government and also within the citizens of
the country
� It is a qualitative assessment and based on the participatory services
available on the government websites and then carries out a
comparative ranking of the countries
� It is not an absolute measurement of e-participation but a relative
comparison between the performances of the countries at a
particular time
� EPI is normalized by taking the total score value for a given country
subtracting the lowest total score for any country in the survey and
dividing by the range of total score values for all countries
After calculating the composite indexes, countries are ranked as –

Page 5
Figure 1: EGDI Index Data for 2016
1. Very high EGDI: values greater than 0.75
2. High EGDI: values between 0.50 and 0.75
3. Middle EGDI: values between 0.25 and 0.50
4. Low EGDI: Less than 0.25
1.1.2. The Networked Readiness Index (NRI) by WEF4
The Networked Readiness Index (NRI), as launched by World Economic Forum in 2001, measures the capacity of
countries to use ICT for increased competitiveness and well-being. NRI also considers innovation trends of recent
years. The framework for the NRI is made up of four main categories (sub-indexes), 10 subcategories (pillars), and 53
individual indicators against different pillars. The full list of indicators, grouped by pillars and sub-indexes are given
below—
� The Environment sub-index measures the extent to which a country’s market conditions and regulatory
framework support ICT development, entrepreneurship and innovation
� The Readiness sub-index assesses the country by the extent to which the infrastructure and other factors
support the uptake of ICT
� The Usage sub-index considers the level of ICT adoption by a society’s main stakeholders — government,
businesses, and individuals
� The Impact sub-index determines the broad economic and social impacts accruing from ICT
4 The Global Information Technology Report, WEF-Cornell University-INSEAD, 2016

Page 6
Figure 2: The Networked Readiness Index Framework by WEF
Note: The indicators marked in asterisk (*) are derived from the WEF Executive Opinion Survey and the remaining indicators are taken from the
external sources or sourced from international organizations such as International Telecommunication Union, UNESCO and other UN agencies, and
the World Bank
As per the NRI 2016 results, the composition of the group of top 10 performers is unchanged from the previous year
and mainly consists of the high income countries such as the US, European countries (Finland, Sweden, Norway, the
Netherlands, Switzerland, the United Kingdom, and Luxembourg), Singapore and Japan. Thus, the networked
readiness of a country is highly correlated with per capita income.
1.1.3. EU E-government Benchmark Indicators5
European Union e-government benchmarks implementation has been improving every year and covers 28 countries in
its category. The benchmarking framework found on key EU e-government priorities is built on a very rich source of
research data using different methods with strong collaboration from member States to build a robust and coherent
insight into the current state of e-government plays in the EU-28+ countries.
EU e-government benchmark is evaluated through the priority areas of the government action plan and analyzed
through the progress of those priority areas which are measured by one or more indicators.
5 e-government Benchmark 2016,European Commission

Page 7
Mystery shopping method was used to assess these indicators wherein, shoppers are trained and experienced to
observe and measure a public service process. They act as prospective users and follow a detailed, objective
evaluation checklist. At the start of the evaluation, member states validate the sample of the services under
assessment and then validate the results with the responsible organizations in the country. Seven life events are
selected as measurements from the common domains of public services and covered in this evaluation process. Each
life event is measured once in 2 years wherein countries arrange follow-ups for improvements and compare the
progress in Europe as well as other countries.
Figure 3: Overview of Life Events under Assessment
European e-government landscape has undergone a visible transformation to achieve the policy targets of the e-
government action plan and captured the progress made by the EU28+ countries. After three levels of biennial rounds
of assessment, the e-government benchmarking technique measures the progress as –

Page 8
Figure 4: Biennial Averages of the Top Level Benchmarks for Eu28+ Countries6
� User centricity:
It assesses user expectation fulfillment by the government’s online services including the availability and experience. It
is designed around user’s needs and supports flexible and pro-active interactions between citizens, businesses and
public organizations. Governments have advanced in making public services digital but the focus is less on the quality
of the delivery from the user’s perspective. This growth majorly focuses on the availability and usability but citizens
have not gained major benefits in terms of ease and speed.
The absolute score was 77 in 2014-2015 from a score of 70 in 2012-2013 (online availability: 81% with an increase of
+9 points since 2012 and online usability: 83% with an increase of +4 points since 2012).
� Transparency:
It is a part of the user empowerment priority area and focuses on building trust with the citizens and improve the
policy maker’s accountability through better use of personal data in the decision making process. It measures the
extent of public organization information about their processes which is made accessible to the users. There has been
a progress over the years but it has not been consistent and variation has been observed between the countries.
Score is 56% with +8 points rise over the years. Transparency is covered as accessibility of personal data to users with
a measure of 55% and implementation of service delivery procedures with a measure of 47%.
� Cross-border services:
It measures the extent to which e-government services support citizens and business mobility across the EU28+
borders. It uses the user centric indicators to assess whether the services are available online (quantity) and are also
usable (quality). As highlighted in the national assessment, the supply-side performed better than the demand side,
thus being the concern area.
They are divided as business mobility with a score of 64% (rise of +13 points over the years) and citizen mobility with a
score of 52% (rise of +11 points).
� Key enablers:
It investigates the availability of the five key enablers; Electronic Identification (eID), Electronic Documents
(eDocuments), Authentic Sources, Electronic Safe (eSafe), Single Sign On (SSO) in the online services.
Score is 54% but some of the individual enablers have scored marginally high in the 2014-2015 period.
Country Clusters Using Benchlearning Approach:
6 The graph is built based on the guesstimates from the original source
0 10 20 30 40 50 60 70 80 90
User centric government
Transparent government
Citizen mobility
Business mobility
Key enablers
Biennial averages for 2014+2015 Biennial averages for 2013+2014 Biennial averages for 2012+2013

Page 9
This approach aims to support the definition of e-government policies and strategies that a country should implement
by considering the following points –
1. Impact of specific context on e-government maturity performances
2. Context-specific differences of countries with similar performances
3. Country differences with similar context and different performances
There is a two step process followed which calculates the absolute and relative indicators to cluster the countries.
Step 1: Two absolute indicators are used to measure e-government maturity namely Penetration (usage of online e-
government services) and Digitisation (Public administration’s efficiency and effectiveness in internal procedures).
Table 1: Indicators representation
Indicator Composed variables Data source
Penetration Internet usage to interact with public administration Eurostat
Submitting completed forms (from last 12 months)
Percentage of individuals who used the internet within the last year
Digitization Authentic Sources: personal data pre-filled, documentation required E-government
benchmark –
Mystery Shopping Automated Service: percentage of automated services per country (across
all life events Mystery shopping)
These indicators have been calculated as a biennial average of 7 life events similar to the mystery shopping method
with 3 time series (2012-2013, 2013-2014 and 2014-2015).
Step 2: Evaluate the factors which shape the specific context of individual countries with three relative indicators –
� Government supply: Spread of e-government services
� e-government demand: citizens willingness to use online services
� Environment: Readiness of the background like socio-demographic data, ICT Readiness and Governance structure
A cluster analysis is conducted using the absolute and relative indicators to identify the countries with similar e-
government maturity performances and context.
Five groups of countries with similar context are identified with respect to the context variables (e-government
Supply, e-government Demand and Environment).
Table 2: Country grouping
Group Countries
Group 1 Latvia Slovenia Luxembourg Iceland Cyprus Estonia Lithuania Malta
Group 2 Poland Germany Italy France UK Spain
Group 3 Netherlands Belgium Austria
Group 4 Romania Czech
Republic
Greece Hungary Portugal Bulgaria Croatia Slovakia Turkey
Group 5 Sweden Ireland Denmark Finland Norway
Page 10
� Group1: Smaller population (relatively young), highly educated and of medium income (measured by GDP per
capita)
� Group2: Largest population (relatively old), high level of education, maturity of infrastructure in line with the EU
average
� Group3: Large population, high income countries, skilled in ICT and ICT infrastructure is developed, more inclined
in using e-commerce and banking services
� Group4: Less urbanized population with lower income, relatively low education level, few digital skills,
infrastructure not highly developed, higher levels of public sector corruption
� Group5: Small population with high income highly educated and inclined to e-commerce and banking services
infrastructures, well developed centralization of services and low levels of corruption
The countries are then divided into clusters based on e-government performance factors –
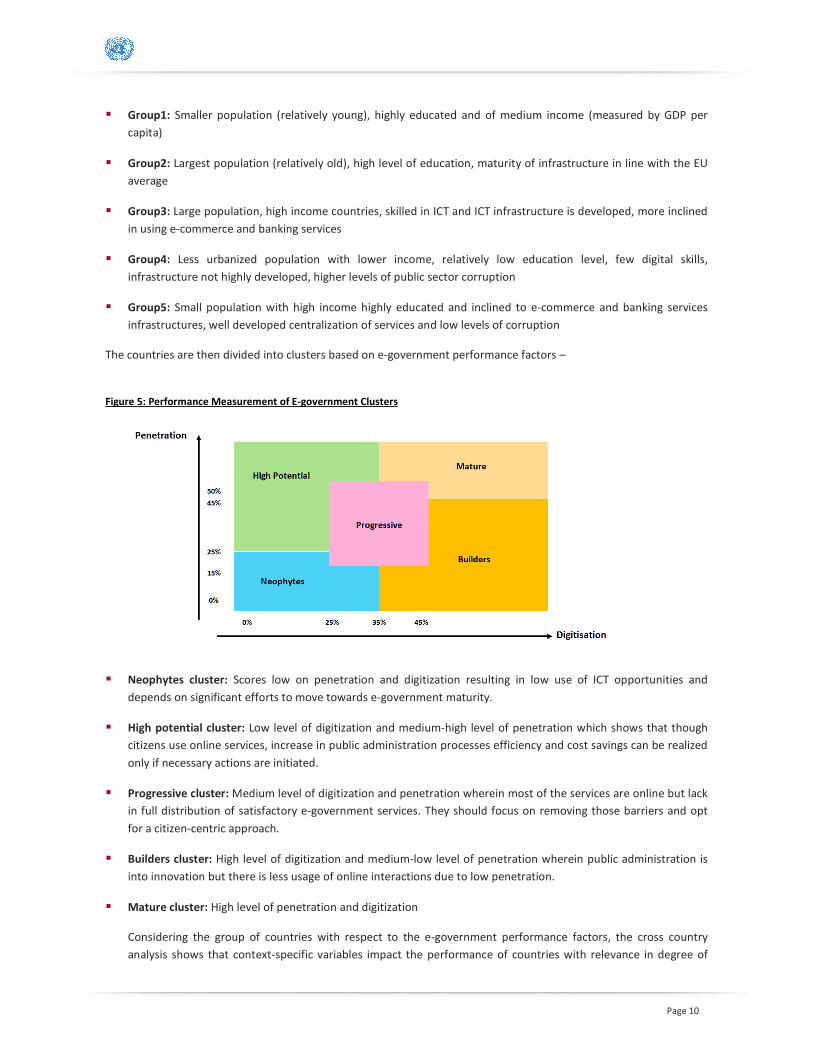
Figure 5: Performance Measurement of E-government Clusters
� Neophytes cluster: Scores low on penetration and digitization resulting in low use of ICT opportunities and
depends on significant efforts to move towards e-government maturity.
� High potential cluster: Low level of digitization and medium-high level of penetration which shows that though
citizens use online services, increase in public administration processes efficiency and cost savings can be realized
only if necessary actions are initiated.
� Progressive cluster: Medium level of digitization and penetration wherein most of the services are online but lack
in full distribution of satisfactory e-government services. They should focus on removing those barriers and opt
for a citizen-centric approach.
� Builders cluster: High level of digitization and medium-low level of penetration wherein public administration is
into innovation but there is less usage of online interactions due to low penetration.
� Mature cluster: High level of penetration and digitization
Considering the group of countries with respect to the e-government performance factors, the cross country
analysis shows that context-specific variables impact the performance of countries with relevance in degree of

Page 11
penetration and digitization. Over the time, the countries move from one cluster to another and display different
performance paths.
1.1.4. The Digital Economy and Society Index (DESI) by European Commission7
The Digital Economy and Society Index (DESI) also measure Europe’s digital performance and EU member states in
digital competitiveness through certain indicators under the five main dimensions.
Figure 6: Digital Economy and Society Index 2017 Ranking8
As per the DESI 2017 ranking, countries such as Denmark, Finland, Sweden and the Netherlands have the most
advanced digital economies in the EU followed by Luxembourg, Belgium, the UK and Ireland. Romania, Bulgaria,
Greece and Italy have the lowest scores on the DESI. However, all the Member States have improved in 2016 -
Slovakia and Slovenia improved the most (more than 0.04 as opposed to an EU average of 0.028) and Portugal, Latvia
and Germany (below 0.02) improved a little.
The DESI was developed following the guidelines and recommendations in the OECD’s “Handbook on constructing
composite indicators: methodology and user guide”. The data included in the index were mostly collected by the
European Commission services (DG CNECT, Eurostat) and by ad-hoc studies launched by the Commission services.
The DESI is composed of 5 principal dimensions, each divided in a set of sub-dimensions, which are in turn composed
by individual indicators –
� The Connectivity dimension measures the deployment of broadband infrastructure and its quality.
� The Human Capital dimension measures the skills required to leverage the opportunities offered by a digital
society.
� The use of internet dimension measures the variety of activities performed by online citizens. The activities
mainly range from consumption of online content (videos, music, games, etc.) to modern communication
activities or online shopping and banking.
7 The Digital Economy and Society Index (DESI), European Commission, 2017 8 The graph is built based on the guesstimates from the original source
0.00
0.10
0.20
0.30
0.40
0.50
0.60
0.70
0.80
DX FI SE NL LU BE UK IE EE AT DE MT LT ES PT EU FR SI CZ LV SK HU CY PL HR IT EL BG RO
1 Connectivity 2 Human Capital 3 use of Internet 4 Integration of Digital Technology 5 Digital Public Service

Page 12
� Integration of digital technology dimension assesses the digitisation of businesses and their exploitation of
the online sales channel.
� Digital public services dimension measures the digitisation of public services, focusing on e-government.
Dimension Sub-dimension Indicator
Connectivity
Fixed Broadband Fixed Broadband Coverage
Fixed Broadband Take-up
Mobile Broadband
Mobile Broadband Take-up
4G Coverage
Spectrum
Speed NGA Coverage
Subscriptions to Fast Broadband
Affordability Fixed Broadband Price
Digital Skills
Basic Skills and Usage Internet Users
At Least Basic Digital Skills
Advanced skills and Development ICT Specialists
STEM Graduates
Use of Internet
Content
News
Music, Videos and Games
Video on demand
Communication Video Calls
Social Networks
Transactions Banking
Shopping
Integration of Digital Technology
Business Digitization
Electronic Information Sharing
RFID
Social Media
eInvoices
Cloud
E-commerce
SMEs Selling Online
eCommerce Turnover
Selling Online Cross-border
Digital Public Services e-government
e-government Users
Pre-filled Forms
Online Service Completion
Open Data
1.1.5. Middle East Digitisation Index Benchmark by Mckinsey9
The Middle East digitisation index assesses the impact and position of digitisation across nine Middle Eastern
countries namely Bahrain, Egypt, Jordan, Kuwait, Lebanon, Oman, Qatar, Saudi Arabia, and the United Arab Emirates.
9 Digital Middle East: Transforming the region into a leading digital economy

Page 13
It was observed that only 6 percent of the Middle Eastern public fall under the purview of a digitised smart
government.
The study reveals that there is a strong correlation between a country’s GDP per capita score with the McKinsey
Digitisation Index wherein a healthy GDP growth value allows countries to spend more on the digital adoption
increasing the countries performance on the digitisation index which in turn contributes to an increase in the GDP and
the economic growth.
After considering the sources like International Monetary Fund, World Economic Forum, World Industry Service
Database, World Bank, World Market Monitor, Wearesocial.org, Euromonitor, ITU, UN data, Countries are assessed on
the level of digital adoption across four areas –
� Consumer
� Business
� Government sectors
� ICT supply and innovation
Further, the McKinsey Middle East Digitisation Index assesses the country’s level of digitisation based on 24 variables
of supply (digital creation) and demand (digital adoption) as provided in the table below –
Sub-index Area Metric Description
Consumer Internet usage Internet penetration Active Internet users over total population
Mobile broadband
usage
Mobile broadband users per 100 people
Smartphone
usage
Smartphone
penetration
Active smartphone users over population
Social networks
usage
Active social network
accounts (% internet
users)
Active social media users divided by active internet
users
Time spent on social
media
Hours spent per day
Internet retail Internet retail value as
% of total retail
Internet retail divided by total retail
Business Technology
usage
B2B internet usage Survey (ranking of min 1 to max 7) response: (what
extent do businesses use ICTs for transactions with
other businesses?)
Firm level-technology
absorption
Survey (ranking of min 1 to max 7) response: (what
extent do businesses adopt new technology?)
Advertising Online ad spend per
capita
Internet advertisement spending per capita in USD
Online ad spend as %
of total
Internet spending as a percentage of total
advertisement spending
Government Promotion of ICT Government’s success
in ICT promotion
Survey (ranking of min 1 to max 7) response: How
successful is the government in promoting the use of
ICT

Page 14
Sub-index Area Metric Description
Usage of ICT Government Online
Service Index
Survey response: The Government Online Service Index
assesses the quality of government’s delivery of online
services on a 0-to-1(best) scale
ICT use and
government efficiency
Survey (ranking of min 1 to max 7) response: what
extent does the use of ICT by the government improve
the quality of government services to the population?
Core administration
system digitization
Based on multiple indicators/surveys such as financial
management information system, human resources
information system, e-tax, e-customs, e-procurement
Digital identification Based on multiple indicators/surveys such as access to
services, digital signature, card features
E-government index United Nations E-government development index
ICT supply
and
innovation
Coverage 3G network coverage Mobile network coverage as percentage of population
Connectivity International Internet
bandwidth
International internet bandwidth in kbps per user
Secure Internet
servers per million
population
Secure internet server per capita
Average download
speed
Average download speed in kbps
Affordability Broadband tariffs Fixed-broadband internet tariffs in PPP USD per month
Mobile broadband
pricing
Mobile-broadband pricing PPP adjusted
PCT patents PCT patents
application per million
population
PCT patents, applications per capita
ICT companies Share of country’s ICT
companies’ revenue in
global Top 1000
Share of 2015 revenues per country as % of overall top
1000 revenues
1.1.6. E-Government Rankings by Waseda University - IAC International10
Waseda University, the institute of e-government conducted a survey through numerous workshops, forums,
professional meetings and discussions. This data was taken from Organization for Economic Co-operation and
Development (OECD), Asia Pacific Economic Cooperation (APEC), the International Telecommunications Union (ITU),
the World Bank (WB), and many government agencies, Think tanks and NGO/NPOs in charge of e-government
10
The 12th
Waseda – IAC International e-Government Rankings Survey 2016 Report

Page 15
activities in their respective countries. It includes economies of 65 countries and evaluates the application of new ICT
administration trends in those countries.
The Waseda-IAC International e-government ranking considers the benchmarking indicators to assess the latest ICT
developments of e-government. Researchers found that IT is increasing and is widely used in government activities
and IT applications are used in different fields of various sectors.
Due to the trending information and communication technologies role in development of e-government across the
countries, 10 indicators are classified along with its 35 sub-indicators –
Indicators Sub-indicators
Network preparedness/Infrastructure � Internet Users
� Broadband subscribers
� Mobile Cellular subscribers
Management Optimization/ Efficiency � Optimization Awareness
� Integrated Enterprise Architecture
� Administrative and Budgetary Systems
Online Services / Functioning Applications � E-procurement
� E-tax Systems
� E-custom Systems
� E-health Systems
� One-stop Services
National Portal/Homepage � Navigation
� Interactivity
� Interface
� Technical Aspects
Government CIO � GCIO Presence
� GCIO Mandate
� CIO Organizations
� CIO Development Programs
e-government Promotion � Legal Mechanism
� Enabling Mechanism
� Support Mechanism
� Assessment Mechanism
E-Participation/Digital Inclusion � E-Information Mechanisms
� Consultation
� Decision-Making
Open Government � Legal Framework
� Society
� Organization
Cyber Security � Legal Framework
� Cyber Crime Countermeasure
Page 16
� Internet Security Organization
The use of Emerging ICT � The use of Cloud Computing
� The use of Internet of Things
� The use of Big Data
Network Preparedness/Digital Infrastructure: It is an essential requirement for conducting data communication
between two access points. Communication from government’s premises to the citizens becomes a necessity for
effective e-government implementation. This indicator is supported by three sub-indicators.
Management optimization: This indicator reflects the ICT utilization for improving government business processes
and optimizes the effort to integrate the silo of business processes using ICT. This indicator is supported by five sub-
indicators.
Online Services/ Applications: Integrates business processes, policies, procedures, tools, technologies and human
efforts to support both assisted and unassisted customer services using networks. Government provides
communication services at all levels and plans to establish e-service infrastructure and organizational capacity for
constituents to transact official business online. This indicator is supported by five sub-indicators.
National Portal/Homepage: It is the foundation of e-government’s basic interface for stakeholders to access
government and also making all services available via one portal. It also helps reduce costs, improve communication
experience and improves perceptions about the government. This indicator is supported by four sub-indicators.
Government Chief Information Officer (GCIO): The CIO has the rights to align management strategy with ICT
investment so that the balance between the applied business strategy, organizational reform and management
reform is achieved. This indicator is supported by four sub-indicators.
E-government Promotion: It is evaluated by using a list of parameters to judge the degree of development in each
sector and current status of e-government promotion. This indicator is supported by four sub-indicators.
E-Participation/ Digital Inclusion: It refers to ICT supported participation in government and governance processes
like service delivery, policy making. It takes the demand side of e-government into the account and checks as to see to
what degree people are using e-government platforms. This indicator is supported by three sub-indicators.
Open Government Data: Data which can be freely used, reused and redistributed by anyone with respect to the
requirement to attribute and share sources. The released data is available to allow the public to access it without
having to pay fees and avoid unfair restrictions over its use. This indicator is supported by three sub-indicators.
Cyber Security: It strives to attain and maintain security properties of the organization and user assets against
relevant security risks in the cyber environment. This indicator is supported by three sub-indicators.
The Use of Emerging ICT: Aims to accommodate developed countries that examine the emerging technologies for
improving e-government quality and developing countries which expect to obtain an important score by implementing
ICT technologies for their e-government. This indicator is supported by three sub-indicators.
1.1.7. HAL E-government Evaluation11
HAL is a multi-disciplinary open access archive for the deposit and dissemination of scientific research documents. The
documents come from teaching and research institutions in France or abroad, or from public or private research
centres.
As per a research document by HAL, the global e-government evaluation is done through putting quantitative criteria
and dimensions to each of the four major qualitative points of view such as infrastructure, investments, e-processes
and user attitude. Further the criteria are grouped and ranked for assessment of the European Union countries in e-
government development.
11
E-government Benchmarking in European Union: A Multicriteria Extreme Ranking Approach

Page 17
In this paper, 21 EU countries are evaluated and ranked over their e-government progress. Their ranking is obtained
through an additive value model which is assessed by an ordinal regression method and the use of the decision
support system, MIIDAS.
Figure 7: The Evaluation System of Global e-government

Page 18
1.2. Methods and Instruments Used to Measure E-government Progress
E-government development ranking studies conducted by various institutions, use a mix of instruments
(Benchmarking, bench-learning, self-assessment) and methodologies (web research, public data analysis, user testing,
interviews) to measure the progress of e-government in various countries. Some of the methods and instruments
used by the benchmarking studies illustrated in our study are as follows –
EU eGovernment Benchmark Indicators12
Indicator Direct Source of Data/ Method used
User Centricity
Transparency
Cross-border services
Key technological enablers
� Mystery shopping method: Involves shoppers (prospective users) who
are trained and experienced to observe a public service process. It is
method of choice for assessing all the top level benchmarks
� Benchlearning: This approach divides the countries into clusters with
similar e-Government maturity performance as Neophytes, High
Potential, Progressive, Builders, and Matured clusters
United Nations e-Government Benchmark Indicators13
Index Direct Source of Data/ Method used
EGDI Survey Method: Aims to give an indicative assessment of e-Government
through a performance rating of national governments relative to one
another. EGDI is a weighted average of normalised scores on the three most
important dimensions of e-government: scope and quality of online services
(Online Service Index, OSI), status of the development of telecommunication
infrastructure (Telecommunication Infrastructure Index, TII) and inherent
human capital (Human Capital Index, HCI).
Telecommunications Infrastructure
Index (TII)
Data is collected from the International Telecommunications Union (ITU)
Human capital index (HCI) Data is collected from United Nations Educational, Scientific and Cultural
organization (UNESCO)
Online service index (OSI)
� Data is collected from an independent questionnaire, assessing the
national online presence of all 193 United Nations member states
� It assesses a number of features related to online service delivery,
which includes government approaches, open government data, e-
participation, multi-channel service delivery, mobile services, usage up-
take, digital divide and innovative partnerships using ICT
� This data is collected by researchers under UNDESA supervision through
12
eGovernment Benchmark 2016,European Commission 13
United nations eGovernment survey 2016

Page 19
primary research and collection endeavour
E-participation index (supplementary
index)
UN eGovernment Survey includes additional questions to address data
publishing and sharing by government agencies
The Networked Readiness Index (NRI) by WEF14
Sub-index Direct Source of Data/ Method used
The NRI index is divided into four
main subindexes which are further
classified as 10 subcategories (pillars)
with 53 individual indicators
1. The Environment
2. The Readiness
3. The Usage
4. The Impact
The 53 indicators which are a part of the four sub-indexes are sourced in
two ways:
� The individual indicators partly are sourced from international
organizations like International telecommunication union (ITU),
UNESCO, other UN agencies and World Bank
─ In order to align them with the Survey results, a min-max
transformation is applied to transform them into a 1-to-7 scale
� World Economic Forum’s Executive Opinion Survey (the Survey)
─ The survey measures concepts which are qualitative in nature for those
countries wherein the International comparable statistics are not
available
─ It is administered annually to over 14,000 business executives of the
economies covered in the NRI
─ It is a unique source of insight into critical aspects related to a country’s
enabling environment, preparedness of population, ICT usage, ICT
impacts
─ The survey scores are measured on a 1-to-7 scale and do not require
transformation prior to aggregation process
The Digital Economy and Society Index (DESI) by European Commission15
Dimensions Direct Source of Data/ Method used
The index covers five dimensions
with sub dimensions and indicators
are described further.
The Dimensions cover:
1. Connectivity
2. Digital skills
3. Use of Internet
4. Integration of Digital technology
5. Digital public services
� Data is collected from the European Commission services (DG CNECT,
Eurostat) and also by ad-hoc studies launched by the Commission
services
Middle East Digitisation Index Benchmark by Mckinsey16
14
The Global Information Technology Report, WEF-Cornell University-INSEAD, 2016 15
The Digital Economy and Society Index (DESI), European Commission, 2017 16
Digital Middle East: Transforming the region into a leading digital economy

Page 20
Subindex Direct Source of Data/ Method used
The index measures the country’s
level of digitization based on 24
variables on supply and demand
under 4 major subindexes
1. Consumer
2. Business
3. Government sectors
4. ICT Supply and innovation
Data is collected in two ways according to the nature of the variables:
� The data is collected from various sources like International Monetary
Fund (IMF), World Economic Forum (WEF), World Industry Service
Database, World Bank, World Market Monitor, Wearesocial.org,
Euromonitor, ITU, UN data
� Some of the data for variables is obtained through surveys with the
scale of 1-to-7 (1= not successful at all; 7= extremely successful
E-Government Rankings by Waseda University - IAC International17
Indicator Direct Source of Data/ Method used
Waseda-IAC International e-
Government ranking includes 10
main indicators which are classified
along 35 sub-indicators:
1. Network
preparedness/Infrastructure
2. Management Optimization/
Efficiency
3. Online Services/ Functioning
Applications
4. National Portal/Homepage
5. Government CIO
6. E-Government Promotion
7. E-Participation/Digital Inclusion
8. Open Government
9. Cyber Security
10. The use of Emerging ICT
� E-Government development is evaluated by this ranking survey based
on group of sub-indicators in a country ranging from policy
development and e-Services implementation to management
optimization and eGovernment promotion
� For the Survey, the data is researched through workshops and forums
with a variety of organizations like Organization for Economic Co-
operation and Development (OECD), Asia Pacific Economic
Cooperation (APEC), the International Telecommunications Union
(ITU), the World Bank (WB), government agencies, think tanks and
NGO/NPO’s of respective countries
HAL E-Government Evaluation18
Criteria Direct Source of Data/ Method used
The global e-government evaluation
is done through putting quantitative
criteria and dimensions to each of
the four major qualitative points of
view such as
1. Infrastructure
2. Investments
3. E-processes
4. User attitude
� The primary data is collected from reliable and recognized sources
such as the Statistical Administration of the European Commission
(Eurostat) and the International Monetary Fund (IMF)
� Data is also collected from the e-government surveys (e.g. UN survey)
17 The 12
th Waseda – IAC International e-Government Rankings Survey 2016 Report
18 E-government Benchmarking in European Union: A Multicriteria Extreme Ranking Approach

Page 21
Indicators used in benchmarks are
usually quantitative and collectively
form a framework for assessment
and ranking. The multicriteria
evaluation system uses 4 major
points which are further classified
into 8 criterias
Open Data Maturity by European Data Portal, 2016
Criteria Direct Source of Data/ Method used
Open data (OD) maturity is assessed
for EU28+ (31 countries) based on
following indicators and sub-
indicators:
1. Open data readiness – policy:
a. Presence of OD policy
b. Licensing norms
c. National coordination
d. Use of data
2. Portal maturity:
a. Usability of the portal
b. Re-usability of data
c. Spread of data across
domains
3. Open data readiness – impact:
a. Social
b. Economic
c. Political
� The indicators and the sub-indicators are assessed through a list of 72
questions that describe the ideal situation for the open data maturity
� The questionnaire was finalised with the individual country
representatives from the Public Sector Information (PSI) expert group,
chaired by the European Commission
� The questions are then categorised into four main categories:
presence of an OD policy, use of OD, impact of OD, and portal features
─ Out of 72 questions, 54 questions were multiple-choice or open
quantifiable questions that are scored
� The sources used for answering these questions or assessing indicators
were:
─ Insights from the existing open data monitoring activities such as the
Open Data Monitor and the Open Data Barometer, Open Data Index
and the ePSI scoreboard
─ Survey method to collect additional information from each European
country for the list of questions
─ Desk research on different national portals for validating data
availability and portals usability
─ Consider various monitoring activities and studies that assess the
benefits of Open Data
1.3. Summary of Benchmarks
E-government development benchmarking or digitization assessment for the countries across the globe is done by
various international organizations, companies and universities. Some of the key insights from the study of the
benchmarking practices are:
� More governments are using ICT to deliver services to engage people in decision-making processes in all
regions of the world.
� There is a positive global trend towards higher levels of e-government as countries in all regions are
increasingly embracing innovation and utilizing ICT to deliver services and engage people in decision-making
processes.
� An uneven e-government progress has been witnessed within and among countries due to lack of access to
technology, poverty and inequality that hinder citizens’ uptake of ICT and e-government for sustainable
development.

Page 22
� E-government has the potential to help support the implementation of the 2030 UN agenda and its 17
sustainable development goals (SDGs).
� Efforts are made by more countries to ensure that public institutions are more inclusive, effective,
accountable and transparent through opening up their data for public information and scrutiny.
� The methods used for collecting data for benchmark indicators were mystery shopping, user survey,
statistical analysis, interviews, etc. and some of the instruments used to conduct the benchmarking studies
were benchlearning approach, self-assessment and benchmarking.

Page 23
Summary of Benchmarks
EU e-government
benchmarks
UN e-government
benchmarks
Networked Readiness
Index by WEF
Digital Economy and
Society Index by EU
McKinsey Middle East
Digitisation Index
e-government rakings
by Waseda University
and IAC International
HAL Global Evaluation
System
Description
� EU e-government
benchmarks measure
progress over the years
with four indicators
and ranks the
countries into clusters
basis penetration and
digitization
� UN e-government
benchmarks the
countries according to
four quantitative/
qualitative indexes
with components like
digital infrastructure,
education/literacy,
population,
participation,
transparency and
finally ranks them
according to the EDGI
index
� The Network readiness
index benchmarks the
countries according to
four sub-indexes with
10 pillars as sub-
categories and 53
individual indicators
� Indicators linked to
Education, Population,
digital Infrastructure,
Government
transparency,
participation and
economy growth are
covered
� DESI tracks the
evolution of EU
member states in
digital competitiveness
through 5 principal
dimensions and 13 sub
dimensions
� Measures the digital
economy in nine
countries in the Middle
East
� Considers the
benchmarking
indicators to assess the
latest ICT
developments of e-
government
� Researchers found that
IT is increasing and is
widely used in
government activities
and IT applications are
applied in fields of
various sectors
� As per a research
document by HAL, the
global e-government
evaluation is done
through putting
quantitative criteria
and dimensions to
each of the four major
qualitative points of
view such as
infrastructure,
investments, e-
processes and user
attitude
Type of Agencies
� European Commission
(EU institution)
� UN (Intergovernmental
organization)
� United Nations
Department of
Economic and Social
Affairs (DESA)
� Division for Public
Administration
and Development
Management (DPADM)
� World Economic forum
(Non-profit
foundation)
� INSEAD (Business
school, France)
� European Commission
(EU institution)
� McKinsey & Company
(Private global
management
consulting company)
� The Institute of e-
government-Waseda
University in Japan
� IAC International
(academic institution)
� National Technical
University of Athens
(University)
No. of countries
assessed
� 28 European Union
countries
� 193 UN member states � 139 countries across
the globe
� 29 EU Member States � 9 countries in the
Middle East
� 65 countries across the
globe
� 21 European countries

Page 24
Top 10 countries
- 2016 rankings
� Countries with higher
e-government maturity
- Norway, Sweden,
Estonia, Netherlands,
Finland, Ireland,
Iceland, Germany,
France and Denmark
� Top 10 countries -
United Kingdom,
Australia, Republic of
Korea, Singapore,
Finland, Sweden,
Netherlands, New
Zealand, Denmark and
France
� US, Finland, Sweden,
Norway, the
Netherlands,
Switzerland, the
United Kingdom,
Luxembourg,
Singapore and Japan
� Denmark, Finland,
Sweden, Netherlands,
Luxembourg, Belgium,
the UK, Ireland, Estonia
and Austria
� Bahrain, Egypt, Jordan,
Kuwait, Lebanon,
Oman, Qatar, Saudi
Arabia, and the United
Arab Emirates
� Top 10 countries -
Singapore, USA,
Denmark, Korea,
Japan, Estonia, Canada,
Australia, New
Zealand, UK and
Taiwan
� Sweden, Denmark,
Finland, Netherlands,
Norway, Germany,
United Kingdom,
France, Estonia and
Austria
High-level
Dimensions/Ben
chmarks
� User centricity
� Transparency
� Cross-border services
� Key enablers
� Telecommunication
infrastructure index
(TII)
� Human capital index
(HCI)
� Online service index
(OSI)
� E-participation index
� Environment sub-
indexes
� Readiness sub-indexes
� Usage sub-indexes
� Impact sub-indexes
� Connectivity
� Human capital
� Use of internet
� Integration of digital
technology
� Digital public services
� Consumer
� Business
� Government sectors
� ICT supply and
innovation
� Network preparedness
� Management
optimization
� Online services
� National portal
� Government CIO
� e-government
promotion
� E-participation/Digital
inclusion
� Open government
� Cyber security
� Infrastructure
� Investments
� E-processes
� User's attitude
Strengths
� Detailed in-depth
indicators
� Constant evolving of
indicators
� Mix of indicators (from
backoffice to user
centricity)
� Validation of figures by
EU Member States
� Strong political support
� Primary data collection
� Extensive Country
Coverage (193)
� Strong
brand/reputation,
especially the ranking
� Combination of
different relevant
dimensions (TII, HCI
and OSI)
� Primary data collection
for OSI
� Thematic topics for
different editions
emphasizes
� Focus on enabling
environment and
readiness
� Primary data collection
among many
enterprises
� Condensed view of
politically relevant
indicators
� Leverages existing EU
data
� Focus on Digital
Society as a whole and
not just E-Government
� Very specific regional
focus
� Condensed summary
of key findings
� Broad set of indicators � Mix of Qualitative and
Quantitative indicators
based on existing
sources

Page 25
Weaknesses
� Limited country
coverage globally
� Resource intensive to
do the mystery
shopping
� Validation of results by
MS costs a lot of time
and can lead to
‘negotiation behavior’
� Focus on national
portals
� Limited number of
services/indicators that
can be assessed
� Supply-side focused
� Country coverage not
the entire world
� Limited primary data
collection
� Composite indicator of
numerous existing
benchmarks
� E-Government
Dimension uses a small
subset of figures of the
E-Government
Benchmark
� Limited country
coverage globally
� Very limited country
coverage
� Limited data collection
� Commercial focus
� Very high level
� Not all countries in the
world covered
� No new data collected
compared to other
benchmarks
� High level focus of
indicators
� Limited country
coverage
� Limited set of
indicators

Page 26