#um - ucl - london's global university · 2008-09-20 · the equilibrium relationship between...
TRANSCRIPT

Journal of Physiology (1988), 395, pp. 131-159 131With 9 text-figure8Printed in Great Britain
ACTIVATION OF ION CHANNELS IN THE FROG END-PLATE BY HIGHCONCENTRATIONS OF ACETYLCHOLINE
BY D. COLQUHOUN AND D. C. OGDEN*From the MRC Receptor Mechanisms Research Group, Department of Pharmacology,
University College London, Gower Street, London WClE 6BT
(Received 26 March 1987)
SUMMARY
1. The equilibrium relationship between acetylcholine (ACh) concentration andresponse (fraction of channels open), corrected for the effects of desensitization, hasbeen estimated by single-ion-channel recording at the adult frog skeletal neuro-muscular junction. At high ACh concentration channel openings occur in well-defined clusters separated by long desensitized intervals. The response, p0, wasestimated as the proportion of time for which a single channel was open during acluster.
2. At negative membrane potential (- 120 mV) p0 reached a maximum value of0-9 at 100 juM-ACh and was half-maximum at 15 #UM with a Hill slope of 1-6 at thispoint. At concentrations higher than 200 /LM-ACh, p0 declined as a result of open-channel block by free ACh itself.
3. At positive membrane potentials (+ 100 mV) there was little channel block byACh; po reached a maximum value of 0-41 at 500,M-ACh, with half-maximumactivation at 50 /IM and Hill slope of 1-2 at this point.
4. Particular mechanisms for channel activation by ACh were fitted to the data bythe method of least squares. Fits were fully determinate only if the two bindingsites for ACh were assumed to be equivalent with no co-operativity in the AChbinding reactions. At negative potential the microscopic equilibrium constant forbinding was K1 = K2 = 77 ,CM and the equilibrium constant for channel opening(opening/closing rates, 8/ca) was 32. At positive potential the affinity was slightlyhigher, K = 32 ,UM, which confirms the view that the binding sites for ACh are outsidethe membrane electric field. The equilibrium constant for channel opening wasreduced to 0-7 mainly as a result of the much shorter open lifetime (increased closingrate a) at positive potentials.
5. The data were also fitted well by very high values of fl/ca together with a highdegree of negative co-operativity or non-equivalence in ACh binding affinity(K2 > K1). A good fit could also be obtained with moderate positive co-operativitycombined with non-equivalence of the binding sites.
6. A mechanism that postulates a receptor with two independent gating subunitsprovided a poor fit to the data at negative potential.
* Present address: Department of Pharmacology, King's College London, Strand, LondonWC2R 2LS.
5-2

D. COLQUHOUN AND D. C. OGDEN
7. The rate constants for channel opening and ACh dissociation were estimated byconstraining the fitted parameters so that the burst length for channel opening wasequal to its observed value at low concentrations of ACh. The results were consistentwith those of Colquhoun & Sakmann (1985) and support their interpretation of thefine structure of bursts at low ACh concentration. The rate constants estimated givehigh values for the ACh association and dissociation rates (8 x 10⁷ M-1 s-1 and6000 s-1) and for the channel opening rate (20000 s-'). These are similar to the valuesobtained by Colquhoun and Sakmann at low concentration.
INTRODUCTION
It is often, and properly, said that the nicotinic acetylcholine receptor is the mostthoroughly characterized receptor-ion channel. It is also true that one of the mostfundamental things that one would like to know about any drug receptor system isits equilibrium concentration-response relationship. It is, therefore, perhapssurprising that considerable doubt still exists about this relationship (for a review,see Colquhoun, Ogden & Cachelin, 1986). The first problem is to define exactly whatconcentration-response curve we are interested in: if genuine equilibrium is attainedthe curve will reflect desensitization and channel block, as well as channel activation.When the term 'equilibrium concentration-response relationship' is used it is usuallyintended to refer to the activation process only, and this is the sense in which theterm will be used here. It is the relationship thus defined which can give informationabout the mechanism of ion channel activation, and hence the mechanism ofsynaptic transmission.The biggest problem has always been desensitization (Katz & Thesleff, 1957) which
is very profound. At the frog end-plate the equilibrium response to high agonistconcentrations is only a few per cent of the peak response (e.g. Colquhoun et al. 1986).More recently ion channel block by the agonist itself has been discovered (Sine &Steinbach, 1984b; Ogden & Colquhoun, 1985). Many ingenious experiments havebeen done to try to avoid (e.g. by rapid agonist application) or to correct for, theeffects of desensitization (Adams, 1975; Dionne, Steinbach & Stevens, 1978; Dreyer,Peper & Sterz, 1978; Lester & Nerbonne 1982; Pasquale, Takeyasu, Udgaonkar,Cash, Severski & Hess, 1983; Dilger & Adams, 1984). Despite the difficulty of someof these experiments, they have not led to unanimity. More recently single-channelmethods have allowed more effective elimination of the effects of desensitization thanwas previously possible (Sakmann, Patlak & Neher, 1980). The methods available atthat time did not permit the use of sufficiently large concentrations of agonist forsaturation to be reached. In this paper we use a method based on that of Sakmannet al. (1980) to investigate the response to ACh over a wide range of concentrationsand membrane potential. Some preliminary results have been published (Ogden &Colquhoun, 1983, 1985; Ogden, 1985).
METHODS
Twitch fibres of m. cutaneus pectoris, m. semitendinosus or m. sartorius of Rana temporaria wereused. Connective tissue and presynaptic terminals were removed from the end-plate region bydigestion with collagenase 02% (Sigma type 1 a) and protease 002% (Sigma type 7) (Betz &
132

ACTIVATION OF END-PLATE CHANNELS
Sakmann, 1973). Ringer solution contained (mM): NaCl, 116-5; KCl, 2-5; CaCl2, 1 5; HEPES, 10;pH 7-2; tetrodotoxin (Sankyo), 50 nM. Pipettes contained acetylcholine (ACh) dissolved in normalRinger solution. During recording, fibres were depolarized by bathing in high-KCl Ringer solutioncontaining 15 or 25 mM-KCl substituted for NaCl. This minimized movement of the fibre when apipette containing high ACh concentration approached the end-plate region. Diffusion ofACh fromthe tip was also reduced by employing high-resistance (20-40 MQ) patch pipettes made fromborosilicate glass. Fibres were viewed with Nomarski optics and high-resolution patch clamprecordings were made in the cell-attached mode (Hamill, Marty, Neher, Sakmann & Sigworth,1981) from a point at, or very near to, the postsynaptic end-plate membrane. Membrane potentialwas measured with an intracellular microelectrode. Data were stored on FM tape.The mean current during a record was measured by integration over a specified interval, either
with an analogue integrator and light-pen recorder (Medelec FOR1004) or by numerical integrationof the digitized record. For single-channel analysis the record was filtered at 3 kHz (-3 dB,48 dB/octave Bessel) and a continuous section digitized at 32 or 40 kHz. An idealized record ofamplitudes, open and gap times was obtained by direct fitting of transitions with the systemresponse to a step input. A consistent time resolution was imposed on the data, usually 40 or50 ,us for shut periods and 80 or 100 ,us for openings. Data were displayed as histograms of apparentopen or closed times and fitted with probability density functions by the method of maximumlikelihood (Colquhoun & Sigworth, 1983).
Curve fitting and assessment of errors
The equations for various possible reaction mechanisms were fitted to experimental data by aweighted least-squares criterion. A general minimization procedure was used to find the values ofthe parameters (e.g. equilibrium constants) that minimized the weighted sum of squareddeviations, S = Ewi(yi-Y )2,
where yi is the mean of the observed values at the ith concentration, Y1 is the calculated value atthis concentration, and the weight is w, = l/s2(y,) where s(y,) is the observed standard error.
It is possible to calculate approximate standard errors for each of the parameter estimates (e.g.as described by Colquhoun, Dreyer & Sheridan, 1979, or Colquhoun & Sigworth, 1983). Theseprovide a satisfactory indication of the range of uncertainty in linear cases (i.e. when the calculatedresponse is a linear function of the parameters) or if the parameter estimates are rather precise.However, the present cases are all non-linear and some parameters are poorly determined, sostandard errors are unsatisfactory. A much better way of specifying errors, which has been adoptedhere, is to calculate likelihood intervals (or support intervals; see Edwards, 1972, and Colquhoun &Sigworth, 1983). If the observed means have a Gaussian distribution then the log-likelihood, L,iS L = -S/2.
Thus, the least-squares estimates of the parameters, which minimize S, are the same as themaximum likelihood estimates, which maximize L, since LmaX = -Smin/2. The most likely valuesof the parameters are those that correspond to Lmax. The likelihood intervals for a particularparameter were found by holding that parameter at a fixed value (away from its maximumlikelihood value) and repeating the fit with all other parameters free to vary. The maximum valueof L that is achieved, Lerit say, will not be as large as that for the unconstrained fit. In order tofind the 0*5-unit likelihood interval the fixed value is adjusted until a log-likelihood value ofLerit = Lmax -05 is obtained. This value of Lcrit can (normally) be obtained for two values of theparameter, one above and one below its maximum likelihood estimate; these upper and lower limitsare usually unsymmetrically disposed relative to the best-fit value, whereas standard errorestimates necessarily produce symmetrical limits. It is not possible to attach exact probabilities tolikelihood intervals, but it may be noted that a 0-5-unit interval would correspond, in the case oflinear problems, to plus or minus one standard error. When, as here, there is more than oneparameter the errors for the parameters jointly might more properly be represented by a likelihoodregion (e.g. Colquhoun, 1979); the single-parameter limits represent tangents to this region, and aremore convenient for the present purposes.
133

D. COLQUHOUN AND D. C. OGDEN
RESULTS
Experiments at negative membrane potentialsSingle-channel currents recorded with high concentrations ofACh occur in clusters
of high channel opening activity separated by long silent intervals. This is illustratedby a record obtained with 200 jtM-ACh in the pipette at -116 mV shown in Fig. 1.Four clusters, of 500-4020 ms duration were observed, separated by silent intervalsof 19-2-446 s (7 4 min) as indicated at the end of each trace. This behaviour of thenicotinic ion channel was described by Sakmann et al. (1980). The long silent periodsare interpreted as times when all receptors in the patch are simultaneouslydesensitized. The durations of clusters are given for several ACh concentrations at-95 to - 130 mV in Table 1. In the experiments reported here channel openingwithin clusters was studied as a function of ACh concentration in order to obtaininformation about nicotinic channel activation while eliminating, as far as possible,the effects of desensitization processes.
It was important for the interpretation of results that channel opening withinthose clusters studied was due to the activity of only one channel, despite the factthat histological evidence suggests that many hundreds should be present within thearea of a patch on the postsynaptic membrane (Matthews-Bellinger & Salpeter,1978). Recording sites were selected on the basis of a large extracellular currentrecorded with the patch pipette in close proximity to the membrane, due to leakageofACh from the tip. With this procedure, sites of high activity were located to within1-2 /um, so recordings were made from areas of high channel density on thepostsynaptic membrane. Once a high-resistance seal was formed, isolated clustersrarely showed more than a single level of current amplitude at ACh concentrationsgreater than 5 fM. Those showing more than one level were excluded from analysis.Calculation shows that a double event would occur with 0 99 probability in fiftyopenings of a cluster of overall open probability 0-1 if two channels wereindependently active (see Colquhoun & Hawkes, 1983). In the experiments reporteddata were obtained at ACh concentrations greater than 2-5 gm in which the openprobability was greater than 0 05. Since only one channel was active at a time, it maybe supposed that others present were in long-lived desensitized states and unavailablefor activation by ACh in the pipette. Furthermore, if the density of receptors in eachpatch were as high as expected, then each cluster would probably have arisen fromthe activity of a different channel.The quantity of main interest here was the probability, denoted po, that a channel
is open during a cluster (the open probability, for short). This is equivalent to thefraction of a population of identical, independent, non-desensitized channels inthe open state. The value ofpo was estimated as the proportion of time for which thechannels were open during clusters obtained over a wide range of ACh concentra-tions. Figure 2 shows records of clusters obtained at four agonist concentrations at- 120 mV membrane potential. The upper trace in each panel shows inward currentdue to channel opening as downward deflections and the lower trace is the output ofan integrator. This was used to calculate the mean current during a cluster from theratio of total charge to cluster duration. As previously noted (Neher, 1983; Ogden &Colquhoun, 1985) with this procedure the mean current obtained is not reduced by
134

ACTIVATION OF END-PLATE CHANNELS 135
n_P S 218 s
446 s
i a- urn 19 2 s
5 pA
_ ~~~~~~~~05sFig. 1. Continuous record of single-channel currents recorded with 200 /M-ACh in thepipette solution. Potential -116 mV. Temperature 10-12 'C. Low-pass filter 3 kHz,-3 dB. Duration of silent intervals between clusters of openings given adjacent to eachtrace.
TABLE 1. Duration of clusters of openings and open probability within clusters at severalACh concentrations. Membrane potential -95 to -130 mV. Temperature 10-12 'C
Cluster lengthConcentration mean + S.D. pO
(#M) (ms) mean S.D. S.E.M. n
5 3910+2200 0 09 0 044 0-018 610 876+1180 0-38 0-174 0-041 2520 836+764 0-57 0-114 0-033 1240 388+387 0-67 0-119 0-036 1150 141+99 0-82 0-072 0-024 9100 154+73 0-87 0-092 0-018 26200 193+207 0-82 0-112 0-028 16500 740+590 0 70 0-056 0-015 141000 168+ 92 0 55 0-065 0-038 3
low-pass filtering during recording. The proportion of time for which the channel wasopen was estimated as the ratio ofmean current to the amplitude of the channel openlevel, measured directly from the current trace. At concentrations greater than200 gM-ACh, the channel openings were so brief (as a result of channel block by ACh,see Ogden & Colquhoun, 1985) that few of them reached full amplitude. In thesecases, the full current amplitude was obtained from data at low concentration undersimilar conditions. The error associated with this procedure is unlikely to be largebecause of the small variation of channel conductance from one fibre to another thatis observed at the neuromuscular junction (Gardner, Ogden & Colquhoun, 1984). Asmay be seen in the records of Fig. 2, the open probability, po, within clustersincreased from 009 in the record at 5 ,tM-ACh to 0-91 at 100,tM-ACh, and at1 mM-ACh declined to 0 55.The increase ofpo was associated with a reduction in the duration of gaps between

136 D. COLQUHOUN AND D. C. OGDEN
5pM-ACh -120mV p0=0*09
3pG
500 ms
10vM-ACh -120mV p = 0 47
I~IaIMIIIJiiiWWMU 13 pA
3 pC _
500 ms
100pMm-ACh -120mV pO=0 91
14 pA
2 pCj200 ms
1 mM-ACh -1 25 mV p= 0-611 1 - 1 1 ~~~~3 pA0.5 pC
50 ms
Fig. 2. Single clusters of unitary currents recorded with different concentrations of AChin the pipette. ACh concentration and open probability given above each record. Uppertrace: pipette current; lower trace: integral of pipette current. Mean currents calculatedby dividing integral by cluster length; open probability by dividing mean current by fullsingle-channel current amplitude. Potentials - 120 to - 125 mV. Temperature 10-12 'C.Low-pass filter 3 kHz (-3 dB).
openings. At ACh concentrations up to 50 ,tM, distributions of gaps within clusterswere fitted well by the sum of three exponential components, one of mean about20 ,us and large amplitude due mainly to channel block in this range of concentrations(and partly to spontaneous shuttings, which also last about 20 ,us), an intermediatecomponent of mean 041-0 5 ms and very small amplitude, and a third componentwith mean duration which depended on ACh concentration, decreasing from 40 msat 5 /tM to 1 ms at 40,M. The strong concentration dependence of the lattercomponent suggests that it represents the time between individual channelactivations (spent largely in the unliganded state). In this concentration range, gaps

ACTIVATION OF END-PLATE CHANNELS
within clusters more than five times longer than this 'mean time between activations'occurred with frequencies of less than 1 %. Gaps of this latter kind were probably notassociated with the activation process but with fast receptor desensitization(Sakmann et al. 1980). At higher concentrations they occurred with greater frequencyand would produce underestimates of po if included. Thus, at concentrations greater
1.0
08
PO+06 O
0*4
02
0 O
1 10 100 1000ACh concentration (WM)
Fig. 3. Open probability, p., plotted against ACh concentration (log scale). Pointsare mean+S.E.M. (vertical bars) of three to eighteen experiments. Potential -95 to- 130 mV. Temperature 10-12 °C.
than 50 /LM, gaps longer than 10 ms were excluded from analysis, resulting insubdivision of clusters into groups, and the mean current was determined withingroups. Reference to the overall distribution of shut times suggests that this criterionwould result, if anything, in a slight underestimation of po as a result of inclusion ofsome brief desensitized periods. Table 1 summarizes the mean durations of clusters(up to 50 /LM-ACh) and groups within clusters from which po measurements weremade.The mean and standard error of po in eight to seventeen estimates at each ACh
concentration are summarized in Table 1 and plotted in Fig. 3 against logconcentration. This shows a steep increase of p0 in the range 5-50 jtM-ACh withpo = 0 5 at about 15 ,UM, a maximum of po = 0-87 at 100 JtM, and then a decline of p0with further increase of concentration above 200 ,IM to 0 55 at 1 mm. The steep riseof open probability at low concentrations when plotted as a Hill plot (see Fig. 8) isin agreement with membrane potential and conductance data obtained with lowconcentrations of ACh or ACh analogues (Jenkinson, 1960; Rang, 1971; Adams,1975; Dionne et al. 1978; Dreyer et al. 1978). The decline of po at high concentration
137

D. COLQUHOUN AND D. C. OGDEN
has been described previously at the neuromuscular junction and may be attributedto block of the open ion channel by free ACh molecules (see Ogden & Colquhoun,1985, for further discussion). The maximum level ofpo - 0-9 shows that at least 90%of available channels can be activated by high concentrations of ACh at theneuromuscular junction. However, the presence of block of open channels suggeststhat the true maximum for channel activation by ACh is probably much greater.
Experiments at positive membrane potentialsIt is well known that block of open nicotinic ion channels by cationic organic
compounds shows a marked reduction in affinity as the membrane potential is mademore positive (Adams, 1977 b; Neher & Steinbach, 1978). This has been shown tooccur also with ACh in BC3H-1 cell line (Sine & Steinbach, 1984b) and at theneuromuscular junction (Ogden & Colquhoun, 1985). To obtain better definition ofthe maximum pO, experiments were made at membrane potentials of +85 to+110 mV to minimize the blocking action of ACh and to investigate the potentialdependence of the activation process.At positive potentials and high concentrations, currents occurred in clusters
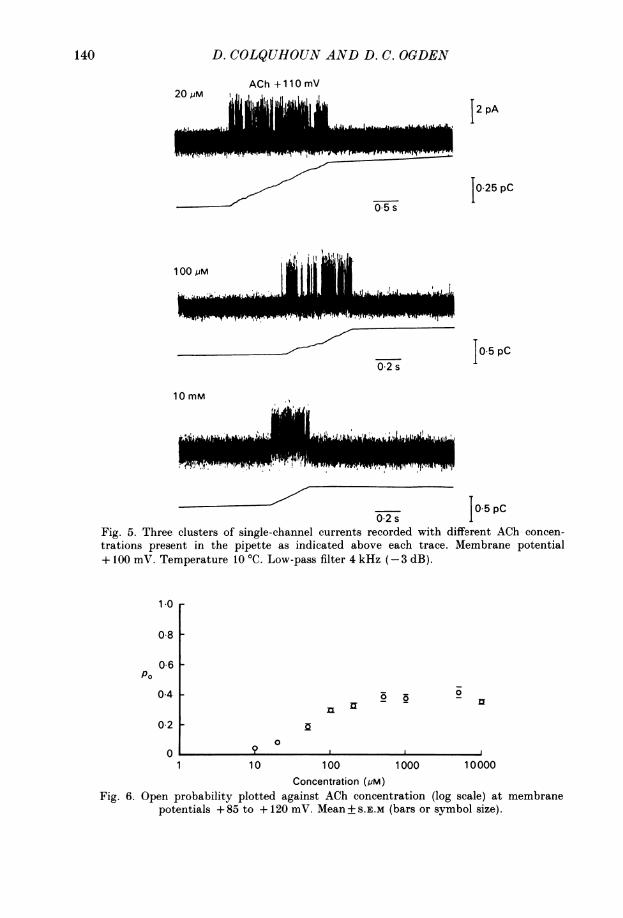
separated by long silent intervals as at negative membrane potential. These aresummarized in Table 2. Figure 4 shows two clusters recorded in the same membranepatch with 500 jtM-ACh present in the pipette. The upper trace was recorded at amembrane potential of +85 mV, the lower a few seconds later after changing thepotential to -95 mV. The mean duration of an opening is far shorter at positivepotentials than at negative potentials, as expected (Magleby & Stevens, 1972).Inspection of the records at +85 mV shows that the currents were attenuated bylow-pass filtering (in this case to an apparent maximum level of + 1-7 pA at 4 kHzbandwidth). However, data obtained with 400 nM-ACh under the same conditionscontained a sufficient number of full-amplitude openings to permit estimation of amean value of + 2-64 pA for the current amplitude, and a mean apparent open timeof 90 Its. This amplitude suggests a channel conductance of 31 pS (assuming areversal potential near 0 mV), which is the same as the value found in the negativerange of potentials (Anderson & Stevens, 1973; Gardner et al. 1984). The apparentopen time is in reasonable agreement with a value obtained from noise analysis byAdams, Nonner, Dwyer & Hille (1981) and is consistent with an e-fold increase of thechannel closing rate in about 70 mV of depolarization, similar to values obtained inthe negative range of potentials (Magleby & Stevens, 1972; Anderson & Stevens,1973; Colquhoun & Sakmann, 1985). The reduced amplitude of currents at positivemembrane potentials can therefore be attributed to attenuation of brief currentpulses by low-pass filtering. At positive potentials the reduced apparent open timeis unlikely to be due to open-channel block by the agonist since it occurs at both lowand high agonist concentrations.The mean currents and open probabilities during clusters were measured as
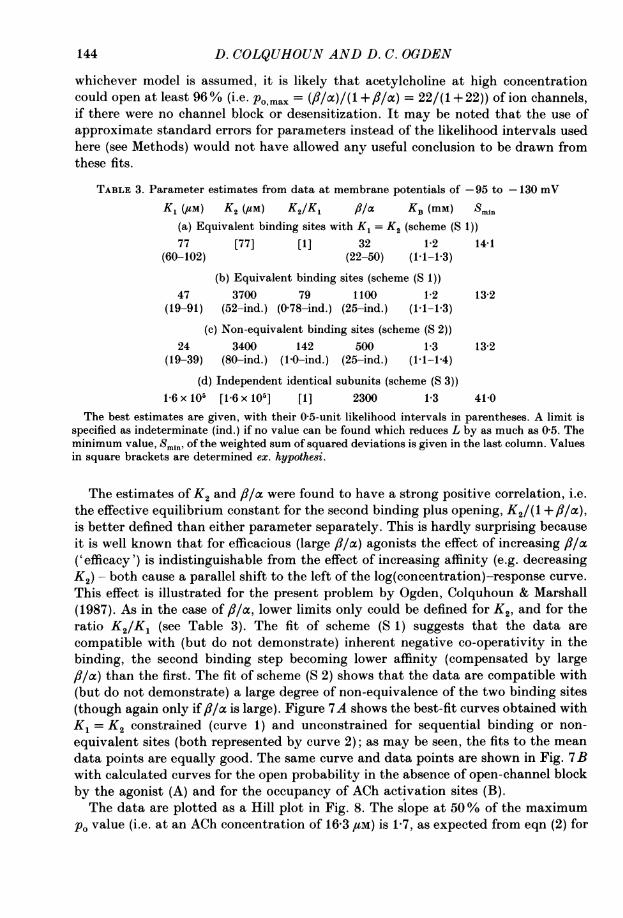
described above and examples of clusters recorded at + 100 mV at three AChconcentrations are illustrated in Fig. 5. The durations of clusters, summarized inTable 2, were similar to those observed at negative membrane potential, and clusterlength decreased at high concentration of ACh. The mean p0 data (±S.E.M) aresummarized in Table 2 and plotted against log ACh concentration in Fig. 6. In
138

ACTIVATION OF END-PLATE CHANNELS
+85 mV
-95 mV
2 pA\ lo~~~~ ~~~.5r)
200msFig. 4. Comparison of clusters recorded at membrane potentials of + 85 mV (upper trace)and shortly after in the same patch at -95 mV (lower trace). 500,uM-ACh in the pipette.Temperature 12 'C. Low-pass filter 4 kHz (-3 dB).
TABLE 2. Duration of clusters and open probabilities at several ACh concentrations. Membranepotential range + 85 to + 120 mV. Temperature 10-12 °C
Concentration(jSM)
102050100200500
1000500010000
Clusterlength
mean + S.D.(ms)
2135+1210964+ 7861180+661608+ 996327 + 363529+ 522532 + 714311+8974+67
Pomean
0 0470-0850.190-300-330-390-380-420-36
S.D. S.E.M.
0-02 0 0050-02 0-0060 05 0-0200-06 0-0150 07 0-0140-08 0-0300 09 0-0260 09 0-0360-07 0 011
contrast with data at negative membrane potential, it can be seen that po increasedmore slowly to a maximum of 0-42 at 500 ,sM-ACh and declined only slightly at veryhigh concentrations; the results look like a classical concentration-response curve fora partial agonist (see Discussion).
Interpretation of equilibrium concentration-response dataThe open probability measured within clusters provides an estimate of the
equilibrium occupancy of the open state of the non-desensitized channel. This openprobability as a function of concentration, plotted in Figs 3 and 6, therefore providesa good representation of the equilibrium concentration-response relation, after
n1611616257
126
40
139
-FTWIFF"J" F - , I , , I - ., - .- - . I
2 pA 0.5 PC
200 ms
D. COLQUHOUN AND D. C. OGDEN
ACh +110mV
L2 pA
0 5 s
10.25 pC
100 PM
".1f,~ ~ ,~A.L J iL
0.5 pC02 s
10mM
/ 1~~~~~~~~0.5PC02sJop
Fig. 5. Three clusters of single-channel currents recorded with different ACh concen-
trations present in the pipette as indicated above each trace. Membrane potential+ 100 mV. Temperature 10 'C. Low-pass filter 4 kHz (-3 dB).
1.0 r
08 F
Po06
0*4 F 0
a
02
0
0
10 100 1000 10000
Concentration (pM)Fig. 6. Open probability plotted against ACh concentration (log scale) at membrane
potentials +85 to + 120 mV. Mean+s.E.M (bars or symbol size).
140
tiA.L...Lij
1

ACTIVATION OF END-PLATE CHANNELS
elimination, as far as is possible, of the effects of desensitization. A comparison maybe made between these data and the predictions of models for channel opening toobtain estimates of the equilibrium constants for the reactions involved.The simplest plausible model for activation has sequential agonist binding and
channel-opening steps (del Castillo & Katz, 1957). To account for the sigmoid rise ofresponse with increasing concentration, and the Hill slope of greater than unity, twobinding steps (at least) are required (Katz & Thesleff, 1957; Jenkinson, 1960; Rang,1971; Magleby & Terrar, 1975; Adams, 1975; Dionne et al. 1978; Dreyer et al. 1978).The presence of two binding sites for ACh has been clearly demonstrated instructural studies of the nicotinic receptor (see Karlin, Cox, Kaldany, Lobel &Holtzman, 1983).The conformation change resulting in channel opening occurs mainly in the doubly
occupied channel. Although evidence obtained by Colquhoun & Sakmann (1985)suggests that brief openings of the singly-bound channel may occur at very low AChconcentrations, these were shown to decline sharply in frequency as concentrationwas increased and were found to occur with very low frequency at 5 /LM-ACh andwere not detected at higher concentrations in the present analysis. There is strongevidence to suggest that the decline of open probability seen with high AChconcentrations at - 120 mV is due to a rapid block of the open channel by free ACh(Ogden & Colquhoun, 1985).
Three reaction schemesThree reaction schemes were fitted to the data. The first has sequential binding of
two ACh molecules, denoted A, to two equivalent sites, R, on the receptor, followedby opening and then block. It is represented by the scheme
lKI 2K2 fl/a KBR AR A2R AA2R*= A2R*A (S 1)
in which R* represents the open channel and A2R*A the doubly liganded openchannel blocked by an ACh molecule. K1 and K2 are microscopic equilibriumconstants for the binding reactions (the subscripts indicate binding of the 1st and 2ndmolecules respectively), ,/a is the equilibrium constant for the channel openingreaction (opening/closing rate constants) and KB is the equilibrium constant forblock of the open channel by free agonist. In this scheme the order in which AChbinds to or dissociates from the sites is not specified (they are equivalent), but thepossibility that an interaction between first and second binding steps can occur canbe described by specifying different values for K1 and K2. The ratio K1/K2 is thus ameasure of the inherent co-operativity in the binding reaction; the response,i.e. pO, will, of course, show co-operativity with an initial Hill slope of 2 (declining to1 at high concentrations) even when K1 = K2, i.e. when the binding steps do notinteract. The occupancy of the open state at equilibrium for this scheme is given bythe expression
po = 1+2c,/a ,(1)1+ c + cl C2(1 + ,8a-) + CB cl C2,f//otwhere cl, c2 and cB denote the agonist concentration divided by the microscopicequilibrium constants for first and second bindings and for open-channel block by the
141

D. COLQUHOUN AND D. C. OGDEN
agonist, respectively. The slope nH of the Hill plot for this scheme in the absence ofchannel block is
/ 1 + C1nH = 2 ~~~~~~~~~~~~(2)1i+2c]J
At low concentration nH = 2, and it declines to nH = 1 at high concentrations; it isindependent of both K2 and /3c/a. The presence of open-channel block introduces aslope of nH of-1 at very high concentrations (when CB > 1; Ogden & Colquhoun,1985).The second scheme considered here arises from biochemical evidence that the two
binding sites have inherently different affinities for some ligands, possibly includingACh (Weiland & Taylor, 1979; Sine & Taylor, 1981). The binding sites are non-equivalent in the sense that two distinguishable mono-liganded forms exist. Themodel for non-equivalent subunits can be written as the scheme
AR1. R2K, K2
R1 R2 AR AARKAI' R2/A1*AR2 ( AR1AR2)* 'K~(AR,. AR2)*AK2 K,
a Open BlockedR1.AR2 (S 2)
where Kl, K2, //a and KB are microscopic equilibrium constants as before,(AR1 . AR2)* is the open-channel conformation and (AR1 . AR2)* . A is the openchannel blocked by free ACh. It should be noted that the subscripts 1 and 2 have aquite different significance in scheme (S 2) from that in scheme (S 1). The ratioK1/K2 measures the extent of non-equivalence of the two sites in scheme (S 2); whichsite is numbered 1, and which 2, is therefore entirely arbitrary. This version assumesthat the affinity for the binding to subunit type 1 is the same whether subunittype 2 is occupied or not (and vice versa), i.e. it assumes that there is inherent co-operativity in the binding reactions. The equilibrium occupancy of the open state isgiven by c1c2 fl/c
gP + Cl + C2 + Cl C2(1 +fl/a) + CB Cl C2fl/8l (3)where cl, c2 and CB represent the ACh concentration divided by the equilibriumconstants K1, K2 and KB respectively.Schemes (S 1) and (S 2) both have four arbitrary parameters to be estimated from
the observations. If we constrain K1 to be equal to K2, then the two schemes becomethe same (and the number of parameters is reduced to three). The parameters can bechosen as K1, K2, 8/c and KB, or, if we wish to estimate the uncertainty in therelative values of K1 and K2, they can be chosen as K1, K2/K1, /3cc and KB. Bothapproaches have been used to obtain the results in Tables 3 and 4. The slope of theHill plot for this scheme, in the absence of channel block, is given by
=(2 1+cl+C2)) (4)
Again nH falls from 2 at low concentration to 1 at high concentration.A third possible mechanism can be envisaged along the lines of the Hodgkin-
142

ACTIVATION OF END-PLATE CHANNELS
Huxley postulate for the sodium channel mechanism. Suppose that the receptorcontains two entirely independent (but not necessarily identical) subunits each ofwhich can bind one agonist molecule, and then change its conformation according tothe mechanism of del Castillo & Katz (1957). Suppose also that the channel is openonly when both subunits are in the altered conformation (denoted by the asterisk).The scheme can be written, in the absence of block, as
R Z-ARl AR*K2 fl1/a2 (S3)2R1=T--AR--AR*
R2=AR2 = AR2*
The open state (AR*, AR2*) can then be blocked with equilibrium constant KB,as before. It was found (see below) that the best fit was obtained on the assumptionthat the two subunits are identical (so K1 = K2 = K, c = concentration/K, and,//ac = Ih/a-1 = /2/ac2); in this case
(C/3/cc)2 5
=
[1 + C(1 +///a)]2 + (C/I/a)2 CB (5)
and the Hill slope in the absence of channel block is
n =2 1+2c(1+3/c))' (6)
which, as in the other models, falls from 2 at low concentration to 1 at highconcentration.
Results of fitting po curves
Sequential binding. Table 3 gives the least-squares estimates, and their likelihoodintervals (or support intervals, see Methods), for fits to the po curve found at negativemembrane potentials. The only scheme for which all the parameters can be estimatedis that with K1 = K2. The microscopic equilibrium constant for binding is 77 /IM, and,8/cc = 32 is quite large (with limits 22-50). The equilibrium constant for block ofopen ion channels was about 1'3 mM; this was the most precisely determined valuefor all models. These values are compared below with those estimated by othermethods.When the assumption that K1 = K2 is relaxed, a somewhat better fit is obtained,
the value ofSmin being reduced from 14-1 to 13-2 (for either scheme (S 1) or (S 2)). Thisimprovement in fit is slight, as may be seen by comparing the curves plotted with themean data points in Fig. 7A or as judged by an approximate likelihood ratio test,or partial F test (see, for example, Colquhoun, 1979; Horn & Vandenberg, 1984).Even though our data are not precise enough to show clearly that K1 and K2 differit is nevertheless desirable to consider how our conclusions would be affected if theydid in fact differ. None of the models are entirely determined when we do not assumethat K1 and K2 are equal; nevertheless the use of likelihood intervals allows usefullimits to be placed on the values of the parameters. In particular, if either model(S 1) or (S 2) were true then neither //a nor K2 separately would be well defined, butnevertheless we can say that ,/3c is unlikely to be less than 25 (though it might haveany value larger than this - the upper limit is effectively infinite). This lower limit for,/3c is similar to the lower limit (22) found when we assume K1 = K2. Thus,
143
D. COLQUHOUN AND D. C. OGDEN
whichever model is assumed, it is likely that acetylcholine at high concentrationcould open at least 96 % (i.e. pO max = (/l/ac)/(( +/3/ce) = 22/(1 + 22)) of ion channels,if there were no channel block or desensitization. It may be noted that the use ofapproximate standard errors for parameters instead of the likelihood intervals usedhere (see Methods) would not have allowed any useful conclusion to be drawn fromthese fits.
TABLE 3. Parameter estimates from data at membrane potentials of -95 to - 130 mVK1 (,UM) K2 (UM) K2/K1 /3/a KB (mM) Smin
(a) Equivalent binding sites with K1 = K2 (scheme (S 1))77 [77] [1] 32 1-2 14-1
(60-102) (22-50) (1-1-13)(b) Equivalent binding sites (scheme (S 1))
47 3700 79 1100 1 2 13-2(19-91) (52-ind.) (0-78-ind.) (25-ind.) (1-1-1-3)
(c) Non-equivalent binding sites (scheme (S 2))24 3400 142 500 1-3 13-2
(19-39) (80-ind.) (1-0-ind.) (25-ind.) (1-1-1-4)(d) Independent identical subunits (scheme (S 3))
1-6 x 10⁵ [1-6 x 10⁵] [1] 2300 1-3 41-0The best estimates are given, with their 0-5-unit likelihood intervals in parentheses. A limit is
specified as indeterminate (ind.) if no value can be found which reduces L by as much as 0-5. Theminimum value, Smin, of the weighted sum of squared deviations is given in the last column. Valuesin square brackets are determined ex. hypothesi.
The estimates of K2 and /l//a were found to have a strong positive correlation, i.e.the effective equilibrium constant for the second binding plus opening, K2/(1 +f//a),is better defined than either parameter separately. This is hardly surprising becauseit is well known that for efficacious (large /3/a) agonists the effect of increasing /1/a('efficacy') is indistinguishable from the effect of increasing affinity (e.g. decreasingK2)- both cause a parallel shift to the left of the log(concentration)-response curve.This effect is illustrated for the present problem by Ogden, Colquhoun & Marshall(1987). As in the case of /3/a, lower limits only could be defined for K2, and for theratio K2/K1 (see Table 3). The fit of scheme (S 1) suggests that the data arecompatible with (but do not demonstrate) inherent negative co-operativity in thebinding, the second binding step becoming lower affinity (compensated by large/3/a) than the first. The fit of scheme (S 2) shows that the data are compatible with(but do not demonstrate) a large degree of non-equivalence of the two binding sites(though again only if fl/a is large). Figure 7A shows the best-fit curves obtained withK1 = K2 constrained (curve 1) and unconstrained for sequential binding or non-equivalent sites (both represented by curve 2); as may be seen, the fits to the meandata points are equally good. The same curve and data points are shown in Fig. 7Bwith calculated curves for the open probability in the absence of open-channel blockby the agonist (A) and for the occupancy of ACh activation sites (B).The data are plotted as a Hill plot in Fig. 8. The slope at 50% of the maximum
p0 value (i.e. at an ACh concentration of 16-3 fLM) is 1-7, as expected from eqn (2) for
144

ACTIVATION OF END-PLATE CHANNELS
A
1.0
08
06
Po
0-4
0-2
0
B
1 0
08
06
Po
0-4
0-2
0
1
01
O0
10 100ACh concentration (MM)
1000
0
1 10 100 1000Concentration (pM)
Fig. 7. A, best-fit least-squares curves for p0 as a function ofACh concentration (log scale)plotted with mean data points at -95 to - 130 mV membrane potential. Curve 1: scheme(S 1) or (S 2) constrained with K1 = K2. Minimum sum of squares = 14 1. Curve 2: scheme(S 1) (co-operative binding) or (S 2) (non-equivalent subunits) with K1 and K2 independent.Minimum sum of squares = 13-2. B, best-fit curve for pr (continous line), p0 calculatedwith same parameters without open-channel block (long dashes, curve A) and calculatedoccupancy of all ACh sites (short dashes, curve B) plotted with mean data points againstACh concentration (log scale).
the fit with K1 = K2; the other fits are similar. The effect of either negative co-operativity in binding, or of non-equivalence of the binding sites, is to reduce theslope of the po curve; the increased ,/a value found in these two cases is needed torestore the slope to a value that fits the data (nH = 1-7). If we consider a combinationof schemes (S 1) and (S 2) in which both co-operativity and non-equivalence are
145

D. COLQUHOUN AND D. C. OGDEN
allowed, and we fix //a at 32, then a fit very similar to those already obtained canbe found with a tenfold non-equivalence of the binding sites combined with a 2-foldpositive co-operativity of binding. The results are, therefore, also compatible withthe view that a slight positive co-operativity in the binding cancels the effect of non-equivalence on the slope of the po relationship, the value of f8/cc being in the range
1.5
0
E0~
0*
o /~~~~~/Q ~~//° -05 _/
///o/
-1 5-6 -5 -4 -3
log ACh concentration
Fig. 8. Hill plot of log [PO/(PO max -po)] against log ACh concentration. Symbols: mean datapoints at -95 to - 130 mV. Continuous curve: best-fit parameters for schemes (S 1) and(S 2). Dashed curve: best fit for independent-subunits scheme (S 3).
expected from low-concentration experiments, although it should be noted that theparameter values for this model are not well defined.
Independent subunits (scheme S 3). This mechanism did not fit nearly as well as theothers. The results are shown in Table 3. The best fit was found when the subunitswere supposed to be identical, a condition that made the curve as steep as possible.Only the affinity for channel block was well defined (1P3 mm as in other fits). Both Kand f/oc were very large, but their separate values were not well defined; essentiallyonly their ratio, the effective equilibrium constant K/(1 +l/ca) - 7 /IM, was welldefined. However, even the best fit with the independent-subunit schemes was farworse than the best fits obtained with the other schemes (Smim = 410 as against 14-1or 13-2). Thus the results at negative potentials seem to be clearly inconsistent withthe independent-subunit mechanism. The reason for this is that the curve cannot bemade steep enough to provide a good fit to the results. Although all three schemeshave a Hill slope (nH) of 2 at low concentrations nH falls more rapidly for theindependent subunit case than for the others. For schemes (S 1) and (S 2) thepredicted Hill slope at pO = Pormax/2 is 1-6-1P7 which fits the observations well, butfor scheme (S 3) the Hill slope at this point is only 1 17. The fitted curves for schemes(S 1), (S 2) and (S 3) are presented as Hill plots with the mean data points forcomparison in Fig. 8.
146

ACTIVATION OF END-PLATE CHANNELS
Data at positive membrane potentialsAs would be expected, open-channel block is far less prominent at positive than at
negative membrane potentials; very little decline of p0 is seen at high agonistconcentrations (Fig. 6) and the equilibrium constant for block is estimated to be
TABLE 4. Parameter estimates from data at membrane potentials of + 85 to + 120 mV
K1 (#UM) K2 (1UM) K2/K1 fl/cx KB (mM) Smin(a) Equivalent binding sites with K1 = K2 (scheme (S 1))32 [32] [1] 0-69 33 8-7
(30-35) (0 65-0{73) (23-54)
(b) Equivalent binding sites (scheme (S 1))16 46 2-9 0 75 23 7-4
(4-25) (33-59) (1 1-75) (0-68-083) (17-38)
(c) Non-equivalent binding sites (scheme (S 2))9-3 81 8-7 0 75 23 7-4(4-25) (45-115) (16-27-6) (0-68-0-83) (17-38)
(d) Independent identical subunits (scheme (S 3))64 [64] [1] 1-84 25 7-7
(59-71) (1-75-1-94) (20-40)The values are specified as in Table 3.
1.0
08
06
p02
02
1 10 100 1000 10000Concentration (pM)
Fig. 9. Comparison of po data plotted against ACh concentration (log scale) at -95to - 130 mV (mean data, filled symbols) and + 85 to + 120 mV (mean+ S.E.M., opensymbols). Best-fit curves for sequential schemes (S 1) or (S 2) are drawn through the points.
greater than 20 mm, whichever model is fitted (Table 4). This value corresponds toan e-fold reduction of blocking affinity per 70 mV of depolarization (Ogden &Colquhoun, 1985). It is assumed that the same activation schemes apply as atnegative membrane potential and the opening of singly occupied channels has beenneglected as before, although this point could not be examined in detail because ofthe short open lifetime at positive potentials.The maximum response (po) is more clearly defined (Fig. 6), and is well below 1,
so conditions are much more favourable than at negative potentials for the separate
147

D. COLQUHOUN AND D. C. OGDEN
estimation of ,/3c and K2. The value of fl/a was about 0 7 whichever model was fitted(roughly 50-fold smaller than at negative potentials), so the maximum fraction ofchannels that could be opened at + 100 mV would be 41 % in the absence ofdesensitization and channel block.The equilibrium constant for binding, under the assumption that K, = K2, is about
32 /M, slightly over twice the affinity at negative potentials. The voltage dependenceof binding therefore seems to be far less pronounced than that of the mean open time,or of channel block; there appears to be an e-fold increase in binding affinity forabout 250 mV depolarization. As in the case of data at negative potentials,relaxation of the assumption that K1 = K2 leads to a fit that is not demonstrablybetter, but again it is advisable to consider such fits because it is not improbable thatthe binding sites may in fact interact and/or be non-equivalent. As in the case ofnegative potentials, the result of fitting scheme (S 1) is consistent with a slight (3-fold)inherent negative co-operativity in the binding steps (taken in isolation); the fit toscheme (S 2) is consistent with a substantial (9-fold) degree of non-equivalence.However, in both cases the 0f5-unit likelihood intervals (roughly equivalent to + one
standard deviation, see Methods) indicate the results are also consistent with a ratioof K2/K1 close to unity. Figure 9 shows the best-fit curve obtained with K1 = K2 inscheme (S 1) or (S 2) plotted with the mean data points and for comparison the meandata points and best-fit curve obtained at - 120 mV.The slope, nH, of the Hill plot at 50% of the maximum p0 value (i.e. at a
concentration of 50'0 /M) is 1'24 for the fit with K,= K2. For the other two fits we
find nH = 1 12 at 50% maximum (at 60 uM). If we allow both non-equivalence andco-operativity then the results are found to be consistent with a slight (1*8-fold)degree of positive co-operativity in binding (which will cancel the effect of the formerin reducing nH). This conclusion is similar to that reached at negative membranepotentials.Independent subunits. The results given in Table 4 show that at positive membrane
potentials the independent-subunit mechanism (S 3) fits the results as well as theother models, contrary to what was found at negative potentials. This happensbecause, as pointed out above, the Hill slope of the data at positive potentials ismuch shallower than at negative potentials. The equilibrium constant for bindingwas 64 /tM for each subunit, and the conformational equilibrium constant,/3/c, was
1-84, so the predicted maximum response was (1.84/2.84)2 = 0-42.
Fits that incorporate knowledge of the low-concentration burst length
The results given above provide estimates of the equilibrium constants for AChbinding to receptors and for the channel-opening reaction and therefore giveinformation only of the ratios of the rate constants for the forward and backwardreactions. On the other hand, Colquhoun & Sakmann (1985) have made measure-
ments of the kinetics of channel opening at low concentrations of ACh and haveinterpreted them in terms of the activation schemes given here to provide estimatesof the rate constants associated with channel opening and closing and the dissociationof ACh. In doing the fitting it therefore seems sensible to introduce some kineticinformation by taking into account the known value of the burst length of channelopenings associated with a single activation (see below). The burst length is a directly
148

ACTIVATION OF END-PLATE CHANNELS
observable quantity and its use introduces no assumptions about the existence,detectability, or mechanism of interruptions that may occur during a single-channelactivation.Colquhoun & Sakmann (1985) observed brief shut periods (mean duration 20 ,us)
interrupting the channel opening produced by low concentrations of ACh. The eventproduced by a single activation of the receptor by ACh was therefore described as aburst of openings. They found (at a membrane potential of - 130 mV) that a burstconsisted, on average, of 2-9 openings, each of mean duration 1-4 ms, so the meanlength of the burst was 4-2 ms. Very similar mean values have been observed at lowACh concentration in the present work: short gap duration 17 Ius with 4-4 openingsof 1-3 ms in long bursts of 5-8 ms duration. If these results are interpreted in termsof oscillation between A2R and A2R*, according to scheme (S 1) or scheme (S 2), thenvalues for the dissociation rate constant, kA2, for the channel opening rate constant,/5, and for the shutting rate constant, a, can be estimated. For example scheme(S 1) can be written 2k+2 k+2 fI
R = AR A2R A2R*, (S 4)k-I 2k-2 a
where K2 = k_2/k+2 and K1 = k-1lk+1. Colquhoun and Sakmann found, in this way,, = 30600 s-1 and k12 = 8150 s-1 (Table 5a). It is of interest to consider whether thepresent results can cast any light on the correctness or otherwise of theirinterpretation, since alternative explanation have been proposed for observationsshowing some similarities in the nicotinic receptor of a cell line (BC3H-1, Sine &Steinbach, 1986). The equilibrium models fitted so far can, of course, give noinformation about the rate constants. However, the fits to the po data can beconstrained so that the mean burst length must have its observed value. The meanburst length at low agonist concentrations was 4-2 ms at - 130 mV, and this valueshould not depend on concentration (provided a burst is defined as A2R A2R*oscillations). All the suggested mechanisms imply that channel re-opening (oscil-lation) can, in principle, occur, but use of this sort of constrained fit introduces noassumptions whatsoever concerning whether the brief shut periods that are actuallyobserved originate from such oscillations, or whether they have some quite differentorigin (the shut periods introduced by oscillations being, perhaps, too rare or toobrief to be seen at all).
In the scheme (S 4), the mean number of openings per burst isnO= 1+/5/2k22, (7)
the mean duration of shut periods within bursts is
(8)#s= 1/(fl+2k-2),and the mean duration of individual openings is
It.= I/a.The mean burst length, P,b is given by the sum of the mean open and shut times perburst, viz.
Ib =n0o0+(no-1)#s (10)
(see, for example, Colquhoun & Sakmann, 1981). The fits were done on theassumption that k1- = k12 and k1, = k+2 (so K1 = K2). The parameters estimated
149
(9)

D. COLQUHOUN AND D. C. OGDEN
TABLE 5. Comparison of burst characteristics calculated by curve fitting with those observedat low ACh concentration
(a) Burst characteristics at - 130 mV, 100 nM [ACh] (Colquhoun & Sakmann, 1985)
Mean no. ofopeningsper burst
2-9
Mean gap Mean openduration duration
(.Ics) (ms)ft
(s-')k-2(s-')
20 1-4 30 600 8150
(b) Results of curve fitting with K1 = K2 (mean burst length constrained to 4-2 ms)
Mean no. ofopeningsper burst1P8 x 105
6-2
Medi
3.5
2-6
1P98
1*11
ean gap Mean openuration duration f
(,us) (ms) (s-'))0013 2-3 x 10⁻⁵ 7.9 x 10817-5 0-68 47 840
(20400-ind.)
26-7 1P20 26780(14400-84000)
30 9 1-59 20131(11800-47600)
32-9 2-12 15052(9430
-29700)11P8 3-88 8358
(5760-13600)
k-2 ( = k-1)(s-i)22094599(4118-51225360(4215-7194)6116(4820-8210)7654(6030
-10280)38280(30130-51430)
(c) Free fit of k+2 ( = k+1)2-3 32-0 1-85 17220
(5304-ind.)
(d) Equivalent sites, K1, K2 not constrained13-3 1-2 1P0 3-63
(e) Non-equivalent sites1P1 0X8
6832(2740-ind.)
K21K0130000 35 0
3-96 68000 730Values in parentheses are 085-unit likelihood intervals. A limit is specified as indeterminate (ind.)
if no value can be found which reduces L by as much as 0 5.
were ,/, k2 and KB (rather than fl/, K2 and KB as before). The values of ,/ and k-2,in conjunction with /b, allow a calculation of a from eqns (7)-(10), and hence 8/3is obtained. Postulation of a value of the association rate constant, k+, = k+2, or
treating k+2 as another parameter to be estimated, allows calculation of K2 = K1from the estimated k-2 value. Table 5b shows the best fits obtainable with
Fb= 4-2 ms and k+2 fixed within the plausible range of values 4 x 10⁷ to 5 x 10⁸ M-1s-1; the Table also shows the predicted burst characteristics calculated from eqns(7)-(10). Table 5c shows the result of a free fit with k+2 taken as one of the parametersto be estimated.
Mean burstduration
(ms)4-2
k+2( = k+1)(M-1 s-')
4 x 1076x 107
7x 10⁷
8x 10⁷
1 x 10⁸
5x 10⁸
Smin18-714-11
14-11
14-11
14-11
14-11
14-118-9 x 10⁷(6-4 x 10⁷-2 x 10⁸)
1-7 x 10⁸
2-2 x 10⁸ 13X3
150

ACTIVATION OF END-PLATE CHANNELS
The free fit gives values of ,6 and k-2 that are close to the values estimated, by aquite different argument, by Colquhoun & Sakmann (1985); the two estimates differby a factor of less than two. The value of the association rate constant,8-9 x 10 M-1 s- (limits 6-5-20 x 10 M-1 -1) is exactly in the range expected fordiffusion-limited access to the receptors. The lower limits for , and k12 are well-defined but no upper limit can be found; the data are consistent, from a statisticalpoint of view, with indefinitely large values of these rate constants. However,inspection of the results of fits with fixed k+2 values in Table 5 b shows that the rangeof uncertainty is found to be much smaller than is suggested by these statisticallimits when physical and experimental constraints are taken into account. Values forthe association rate constant, k+2, of anything much greater than 108 M-1 s-1 arephysically implausible (e.g. Gutfreund, 1972) so values of , much less than 8000 s-are unlikely. Furthermore values of k+2 much smaller than 7 x 10⁷ M-1 s-1, althoughperfectly plausible from a physical point of view, are seen to fit the results only if wepostulate that both , and a are very large so that a channel activation would consistof a large number of very short openings. If this were the case the channel openingsshould be very noisy, but this is not observed; there is only a small amount of extranoise while the channel is open at the frog end-plate at low ACh concentration(unpublished observations; see also Sigworth, 1985). It might be argued thatindividual openings are so brief (and numerous) that most of the excess noise isoutside the observable bandwidth, but if this were the case it would be expected thatthe frequency and duration of openings and, therefore, the apparent single-channelconductance would depend on the nature of the agonist (which is not the case at thefrog end-plate; Gardner et al. 1984), and quite possibly on membrane potential too(which is also not the case; the single-channel conductance was found to be 30 pS at+ 100 mV, the same as at negative potentials). The range of parameter values thatis consistent with experimental results is thus restricted approximately to those inTable 5b that correspond to k+2 = 6 x 10⁷ to 108 M-1 s-'. These values are exactly inthe range predicted according to the interpretation placed on the fine structure ofchannel activation by Colquhoun & Sakmann (1985).Removing the constraint K1 = K2 also produces a good fit to the data, achieved by
introducing a high degree of negative co-operativity between equivalent sites(Table 5d) or non-equivalence of affinity for the two sites (Table 5e). With a burstlength of 4-2 ms, both , and k2 can take large values and the value of the mean opentime, 1/cx, approaches the burst length. However, this results in rather few (0-05-0-15) and very brief (1 jts) short gaps within bursts when compared with the observedfrequency and duration of short gaps at low concentration (of 1-9 and 20,s,respectively). Thus, although the high values of ,/3/ associated with negative co-operativity or non-equivalence are consistent with the concentration-po data, theinfrequent and very brief gaps within bursts predicted a low concentration are notconsistent with the interpretation suggested by Colquhoun and Sakmann.
151

D. COLQUHOUN AND D. C. OGDEN
DISCUSSION
Acetylcholine as a transmitterThe results reported here suggest that high concentrations of acetylcholine would
be able to open a large proportion, 97%, of ion channels at the neuromuscularjunction if it were not for the effects of open-channel block by ACh itself and ofdesensitization, although the microscopic affinity for its binding to receptors is low(~77 tcm). These attributes are exactly what is needed for an efficient fastneurotransmitter. ACh molecules will bind rapidly because the transmitterconcentration is high in the synaptic cleft, most channels will open very soon afterbinding (large opening rate constant, fi) and ACh will dissociate rapidly after a fewopenings have occurred in quick succession (see, for example, Colquhoun &Sakmann, 1983, 1985). Even the high concentration ofACh in the synaptic cleft willproduce little open-channel block (especially as such block becomes weaker as thepostsynaptic membrane depolarizes) and the transmitter is not normally present fora sufficiently long time to produce any noticeable desensitization (but see Magleby &Palotta, 1981). Thus, the characteristics of ACh action which we have attempted toassess appear to be ideally suited to its physiological function as a fast synaptictransmitter.
Comparison with results at low concentrationThe results are also of interest for the light which they can cast on the
interpretation of the brief interruptions that can be seen during activations of the ionchannel by low ACh concentrations (Colquhoun & Sakmann, 1981, 1985). The resultsfound here are consistent with the proposal that these interruptions representoscillations between the shut and open forms of the doubly occupied ion channel, i.e.repeated openings of the channel while it is occupied. This interpretation implies thatthe rate constant for ACh dissociation is not, as is often assumed, much faster thanthe channel opening reaction (Magleby & Stevens, 1972; Anderson & Stevens, 1973)but that both reactions occur at comparable rates. However, ACh is not the idealagonist for a quantitative test of this hypothesis because of its high efficiency atopening ion channels. The results at low concentrations suggested that ACh would becapable of opening 98% of channels at high concentration (at - 130 mV, 10-12 TC)and the results here suggest that it is capable of opening at least 97% of channelsin the absence of open-channel block and desensitization. These values arecertainly consistent with each other, and they imply that f/cc is large (becausePo,max = (fl1/x)/(1 +fl/a)). However, they are both so close to 100% that there isconsiderable uncertainty as to exactly how large fl/a really is, since changes ofaffinity and of the channel-opening equilibrium both result in a parallel shift of theconcentration-po relation under these conditions (see Ogden, Colquhoun & Marshall,1987). This corresponds, in terms of classical ideas about receptors, to the well-known fact that it is difficult to distinguish between changes in affinity and changesin efficacy for agonists of high efficacy. In principle a more accurate numerical testwould be provided by a partial agonist for which the maximum po value wouldprovide a more precise estimate of l/a. Our results (Fig. 6) show that ACh itself isa partial agonist at positive membrane potentials, where at saturating concentrations
152

ACTIVATION OF END-PLATE CHANNELS
only 41 % of channels can be opened, i.e. /3a is about 0 7. This low value for /1/aresults mainly from the greatly increased value ofa at positive membrane potentials.However, the very short open times make it difficult to detect brief interruptions ofopenings at positive membrane potentials and so prevent a test of the multiple-opening hypothesis in this potential range.The predictions of the burst structure at low concentration made from the data
given here differ from those observed by Sine & Steinbach (1986) in BC3H-1 cell line.The main differences in BC3H-1 are the longer gaps due to oscillations between openand shut doubly bound states and an additional component of short gaps whichprobably represent brief closures to an additional receptor state. These differencesare accounted for in their proposed activation scheme by slower rate constants forchannel opening and closing, and by an additional closed occupied state beyond theopen state. As discussed below, at high concentration, the range of AChconcentrations for activation and the maximum po are similar to those found here(Sine & Steinbach, 1987).
The origins of co-operativityFor all the mechanisms considered here, and for any other in which two molecules
must be bound before opening can occur, the equilibrium response at lowconcentrations must be proportional to the square of the free agonist concentration,and the slope (nH) of the Hill plot must approach 2 at low concentrations. This is trueregardless of whether the binding reactions themselves show co-operativity, andwhether the binding sites are equivalent or not. Results at the lowest concentrationstested here (5-10 /SM) are consistent with this hypothesis (see Fig. 7). Brief openingsoccurring with a frequency consistent with opening of singly occupied channels havebeen reported at very low agonist concentrations of suberyldicholine (4-20 nM,Colquhoun & Sakmann, 1985) and these should result in a shallower Hill slope atvery low concentrations (see Dionne et al. 1978, and Adams, 1981, for evidence onthis point). However, p0 could not be measured in that concentration range with thepresent methods.The presence of co-operativity, or of non-equivalence, in the binding steps is
reflected in the steepness of the p0 curve, e.g. in the rate at which the Hill slopedeclines towards unity as agonist concentration is increased. The Hill slope at thehalf-maximum response (p. = 05Po max) is 1-6 or 1-7 for the results at negativemembrane potentials. The results are fitted perfectly well on the assumptionthat there is no co-operativity or non-equivalence in the binding reaction(K1 = K2 = 77 /tM at - 120 mV, 32#M at + 100 mV). They are, however, alsoconsistent with either inherent negative co-operativity in the binding reactions orwith non-equivalence of the binding sites, though any substantial degree of negativeco-operativity or non-equivalence would require that 8/3a was very large indeed(otherwise the p0 curve would be too shallow to fit the data). Although consistentwith the p0 curve alone, high values of 8/3 were shown above to predict infrequentand very brief gaps within bursts compared with those observed at lowconcentrations. If they occurred, such gaps would not be resolved at the presentrecording resolution and it would become necessary to propose a differentexplanation, not connected with channel activation by ACh, for the gaps within
153

D. COLQUHOUN AND D. C. OGDEN
bursts that are seen at low ACh concentration. The arguments presented byColquhoun & Sakmann (1985), in particular the differences of gap frequency andduration observed with different agonists, strongly support the multiple-openinghypothesis for the 20 #cs gaps within bursts at low ACh concentration. From eqns (7)and (8) this places upper limits on , and k2 which are not consistent with a highdegree of negative co-operativity or non-equivalence of binding site affinities.The results are also consistent with the possibility that the binding sites are indeed
non-equivalent, but the effect of this on the slope of the po curve (e.g. on nH) iscancelled by some inherent positive co-operativity in the binding. It was found thatthe observations at both negative and positive membrane potentials are consistentwith a slight (2-fold) degree of positive co-operativity if this is combined with non-equivalence (to the extent of 10- or 20-fold) in the binding sites.
Dependence on membrane potentialA number of comparisons may be made of data obtained at membrane potentials
of - 120 and + 100 mV in these experiments. The changes in the concentration-Porelation on going from negative to positive membrane potentials can be accountedfor almost entirely by two factors; a large decrease in the affinity ofACh for the openion channel, thus reducing the effects of open-channel block, and by the relatively lowfl//c, which gives a maximum po of 0-41 at positive potentials.
Desensitization. First, the characteristics of desensitization were not noticeablychanged. The clusters of openings were of similar duration, as may be seen bycomparing values given in Tables 1 and 2. Also, the gaps between clusters were notnoticeably different, usually of several tens or hundreds of seconds long at bothpotential levels. These results suggest that the voltage dependence of the rate ofdesensitization is small compared for instance with that of the channel open lifetime,although it is not clear how these results compare with the voltage dependence seenin whole-cell currents (Magazanik & Vyskocil, 1970; Scubon-Mulieri & Parsons,1978; A. B. Cachelin & D. Colquhoun, unpublished observations). In the presentcase experiments done at potentials close to the equilibrium potential for calciumions (+110 mV; internal calcium concentration assumed to be 200 nM) showed noalleviation of desensitization when compared with those at negative potentials,suggesting that calcium influx is not essential for the occurrence of desensitization,in agreement with experiments in which internal and external calcium are bufferedto low levels (A. B. Cachelin & D. Colquhoun, unpublished observations). How-ever, an influence on the extent of equilibrium desensitization would probably nothave been detected in these experiments.Channel closing and opening rates. The analysis of lifetimes at positive membrane
potentials posed a number of problems that will be dealt with in detail in anotherpaper. The mean duration of the apparent channel open lifetime was found to bemuch shorter, about 90 /ss, at + 100 mV than at - 120 mV, where the mean value (atlow concentration) was 1 5 ms. These values imply an e-fold increase of the shuttingrate constant, a, for 78 mV of depolarization. This is similar to the voltagedependence estimated by various kinetic methods at more negative potentials undersimilar conditions (Magleby & Stevens, 1972; Anderson & Stevens, 1973; Neher &Sakmann, 1975; Adams et al. 1977 a, 1981; Colquhoun & Sakmann, 1985). The results
154

ACTIVATION OF END-PLATE CHANNELS
of curve fitting show that,/3 was much reduced at +100 mV, declining from about32 at - 120 mV to 0-7 at +100 mV, an e-fold decrease for about 58 mV depolarization.These results indicate that the channel opening rate constant, /3, has only a smalldependence on membrane potential, decreasing e-fold for about 230 mV ofdepolarization. This result supports previous suggestions, from experiments over anarrower range of potentials, that the potential dependence of the channel openingrate is small (Magleby & Stevens, 1972; Neher & Sakmann, 1975; Colquhoun &Sakmann, 1985). The voltage dependence of /3, although it is, as expected, in theopposite direction to the voltage dependence of ac, is surprisingly small. If the voltagedependence of the channel closing rate is due to movement of charge during theconformation change of channel shutting, as proposed by Magleby & Stevens (1972),one might expect the reverse charge displacement to occur during channel openingand that as a result the rate constant would have a greater potential dependencethan that observed here. For this theory to be tenable it is necessary to propose thatthe energy barrier between shut and open states is asymmetric with respect to themembrane field, being closer (in terms of the fraction of the field) to the shut thanthe open conformation.
Affinity of ACh binding. The results of curve fitting suggest that there is a slightincrease in binding affinity when the membrane is depolarized from - 120 to+ 100 mV. When the two binding constants are assumed equal, there appears to bea 2*4-fold increase of affinity, corresponding to an e-fold increase in about 250 mV ofdepolarization. This is unexpected because a cationic molecule binding to a site in themembrane electric field would be expected to show a decrease of affinity. Theobservation that the competitive effect of (+ )-tubocurarine showed no dependenceon membrane potential (under similar conditions to those used here) suggests thatthe agonist binding site is outside the electric field (Colquhoun et al. 1979) thoughtheir measurements were over a smaller range of negative potentials, so a small effectmight have been missed. Structural data for the receptor are also consistent with theview that the agonist binding sites are outside the membrane.
If the change of affinity is genuine (it could result from attempts to fit incorrectmechanisms to the data), then the anomalous direction of the change certainlysuggests that the agonist binding sites are not in the electric field. It is conceivablethat it could result from changes in the conformation of the binding site whichoriginate from potential-dependent conformation changes in distant parts of themolecule that are within the electric field, or from potential-dependent changes in theionic composition of the solution immediately adjacent to the binding sites.
Comparison with other workSakmann et al. (1980) made the first observations of desensitization clusters from
junctional-type channels in the extrajunctional membrane of denervated frog musclefibres. The mean cluster duration at 20 1LM-ACh of 4 s in their experiments may becompared with the mean value found here of 900 ms. Since the number of channelspresent in a patch is not known a comparison of the duration of long desensitizationgaps is not possible, but qualitatively these appear to be of a similar pattern in thetwo studies. The mean cluster duration decreases when the ACh concentration is highin both studies, a result consistent with the increased rate of the early component of
155

D. COLQUHOUN AND D. C. OGDEN
desensitization observed in voltage clamp experiments in whole fibres. Indeed,averaging a large number of clusters recorded with 200 tM-ACh in the pipettereproduced the exponential decline of current seen under similar conditions withrapid application of ACh to a voltage-clamped end-plate (A. B. Cachelin &D. Colquhoun, unpublished observations).
Estimates of the open probability as a function of ACh concentration by whole-cellvoltage clamp methods are hindered by uncertainty of the number of channelspresent as well as by desensitization. Estimates of the maximum p0 for ACh havebeen cited by Adams (1981) as about 0'7 in Rana esculenta muscle at 22°C and-140 mV membrane potential (A. Feltz & P. R. Adams, unpublished data) andabout 0-85 in Rana pipiens at 10 °C and -80 mV membrane potential (B. Sakmann& P. R. Adams, unpublished data). These suggest a value for /3/a of about 8-0. Therelation between conductance (as a fraction of the total) and ACh concentration up
to 40 ftM was similar to that found here. Results at higher concentrations were notreported. Data from single-channel recording in BC3H-1 cell line at low and high AChconcentration have shown that /3/(/3 +a) is about 0-93 in these cells, although the rateconstants themselves are smaller than those at the neuromuscular junction (Sine &Steinbach, 1986, 1987).Dionne et al. (1978) determined the concentration-response relation for carbachol
at the frog neuromuscular junction by ionophoresis and reported a maximumresponse of about 0 5 and positive co-operativity in receptor binding with equilibriumconstants of 600 and 60 /UM. These results agree fairly well with recent estimates(Marshall & Ogden, 1986; Ogden et al. 1987) of carbachol affinity and response
maximum made with the methods described here (although it was not foundnecessary to introduce co-operative binding). However, the low maximum response
found by Dionne et al. (1978) is most probably due to open-channel block by freecarbachol (Ogden & Colquhoun, 1985) suggesting that thepo max for activation andopening is higher (approximately 0 90) and that carbachol is, like ACh, an efficaceousagonist at nicotinic receptors.The ACh concentration required to produce 50% receptor activation has been
found to be close to 15/M in extrajunctional regions of frog muscle (Sakmann et al.1980) at the frog end-plate (Dreyer, 1978; Adams, 1981), in rat (Siegelbaum,Trautmann & Koenig, 1984) and human (Adams & Bevan, 1985) primary myotubesand in BC3H-1 cell line (Sine & Steinbach, 1987). Thus, activation appears to occur
over the same range of concentrations in skeletal muscle receptor of junctional andextrajunctional types from different vertebrates. Data over a wide range ofconcentrations have been reported by Takeyasu, Udgaonkar & Hess (1983) forElectrophorus receptor reconstituted into lipid vesicles. Their results showed a steeprise of the initial rate of 86Rb uptake when the ACh concentration was increasedabove10tM, with a maximum at about 100#UM and at high concentration an
inhibition of the response which was apparent only when the membrane was
polarized to -45 mV. At this potential they estimated equilibrium constants of77/M for ACh binding to the receptor sites, of 2-5 for the channel opening reaction(/3/a in our notation) and 0-8 mm for the inhibition at high concentration, possiblydue to open-channel block. These results are similar to those found here, except thatthe equilibrium for channel opening is about 5-fold smaller, perhaps as a result of
156
ACTIVATION OF END-PLATE CHANNELS
uncertainty about the relation between response and p0 in their experiments. It willbe interesting to compare these parameters for activation of nicotinic receptors byACh with those from neuronal nicotinic receptors when they become available.
REFERENCES
ADAMS, D. J. & BEVAN, S. (1985). Some properties of acetylcholine receptors in human culturedmyotubes. Proceedings of the Royal Society B 224, 183-196.
ADAMS, D. J., NONNER, W., DWYER, T. M. & HILLE, B. (1981). Block of endplate channels bypermeant cations in frog sketetal muscle. Journal of General Physiology 78, 593-615.
ADAMS, P. R. (1975). An analysis of the dose-response curve at voltage clamped frog endplates.PflJigers Archiv 360, 145-153.
ADAMS, P. R. (1977a). Relaxation experiments using bath-applied suberyldicholine. Journal ofPhysiology 268, 271-289.
ADAMS, P. R. (1977b). Voltage-jump analysis of procaine action at frog endplate. Journal ofPhysiology 268, 291-318.
ADAMS, P. R. (1981). Acetylcholine receptor kinetics. Journal of Membrane Biology 58, 161-174.ANDERSON, C. R. & STEVENS, C. F. (1973). Voltage clamp analysis of acetylcholine produced
end-plate current fluctuations at frog neuromuscular junction. Journal of Physiology 235,655-691.
BETZ, W. & SAKMANN, B. (1973). Effects of proteolytic enzymes on function and structure of frogneuromuscular junctions. Journal of Physiology 230, 673-688.
COLQUHOUN, D. (1979). Critical Analysis of Numerical Biological Data, Proceedings of the SixthInternational Codata Conference, ed. DREYFUS, B., pp. 113-120. Oxford: Pergamon Press.
COLQUHOUN, D., DREYER, F. & SHERIDEN, R. E. (1979). The actions of tubocurarine at the frogneuromuscular junction. Journal of Physiology 293, 247-284.
COLQUHOUN, D. & HAWKES, A. G. (1983). The principles of the stochastic interpretation of ionchannel mechanisms. In Single-Channel Recording, ed. SAKMANN, B. & NEHER, E., pp. 135-175.New York: Plenum Press.
COLQUHOUN, D., OGDEN, D. C. & CACHELIN, A. B. (1986). Mode of action of agonists on nicotinicreceptors. In Ion Channels in Neural Membranes, ed. RITCHIE, J. M., KEYNES, R. D. & BOLIS, L.,pp. 255-273. New York: Alan Liss.
COLQUHOUN, D. & SAKMANN, B. (1981). Fluctuations in the microsecond time range of the currentthrough single acetylcholine receptor ion channels. Nature 294, 464-466.
COLQUHOUN, D. & SAKMANN, B. (1983). Bursts of openings in transmitter-activated ion channels.In Single-Channel Recording, ed. SAKMANN, B. & NEHER, E., pp. 345-364. New York: PlenumPress.
COLQUHOUN, D. & SAKMANN, B. (1985). Fast events in single-channel currents activated byacetylcholine and its analogues at the frog muscle end-plate. Journal of Physiology 369,501-557.
COLQUHOUN, D. & SIGWORTH, F. J. (1983). Fitting and statistical analysis of single channel records.In Single-Channel Recording, ed. SAKMANN, B. & NEHER, E., pp. 191-263. New York: PlenumPress.
DEL CASTILLO, J. & KATZ, B. (1957). Interaction at end-plate receptors between different cholinederivatives. Proceedings of the Royal Society B 146, 369-381.
DILGER, J. P. & ADAMS, P. R. (1984). Rapid perfusion of excised patches - activation anddesensitization of nicotinic receptor channels. Biophysical Journal 45, 386a
DIONNE. V. E., STEINBACH, J. H. & STEVENS, C. F. (1978). An analysis of the dose-responserelationship at voltage-clamped frog neuromuscular junctions. Journal of Physiology 281,421-444.
DREYER, F., PEPER, K. & STERZ, R. (1978). Determination of dose-response curves by quantitativeionophoresis at the frog neuromuscular junction. Journal of Physiology 281, 395-419.
EDWARDS, A. W. F. (1972). Likelihood. Cambridge: Cambridge University Press.GARDNER, P., OGDEN, D. C. & COLQUHOUN, D. (1984). Conductances of single ion channels openedby nicotinic agonists are indistinguishable. Nature 309, 160-162.
GUTFREUND, H. (1972). Enzymes: Physical Principles. London: Wiley.
157

D. COLQUHOUN AND D. C. OGDEN
HAMILL, 0. P., MARTY, A., NEHER, E., SAKMANN, B. & SIGWORTH, F. J. (1981). Improved patchclamp techniques for high resolution current recording from cells and cell-free membranepatches. Pfiuigers Archiv 391, 85-100.
HORN, R. & VANDENBERG, C. A. (1984). Statistical properties of single sodium channels. Journalof General Physiology 84, 505-534.
JENKINSON, D. H. (1960). The antagonism between tubocurarine and substances which depolarizethe motor end-plate. Journal of Physiology 152, 309-324.
KARLIN, A., Cox, R., KALDANY, R-R., LOBEL, P. & HOLTZMAN, E. (1983). The arrangement andfunctions of the chains of the acetylcholine receptor of Torpedo electric tissue. Cold Spring HarborSymposia on Quantitative Biology 48, 1-8.
KATZ, B. & THESLEFF, S. (1957). A study of the desensitization produced by acetylcholine at themotor end-plate. Journal of Physiology 138, 63-80.
LESTER, H. A. & NERBONNE, J. M. (1982). Physiological and pharmacological manipulations withlight flashes. Annual Reviews of Biophysics and Bioengineering 11, 151-175.
MAGAZANIK, L. G. & VYSKOCIL, F. (1970) Dependence of acetylcholine desensitization on themembrane potential of frog muscle fibres and on the ionic changes in the medium. Journal ofPhysiology 210, 507-518
MAGLEBY, K. L. & PALLOTTA, B. S. (1981). A study of desensitization of acetylcholine receptorsusing nerve-released transmitter in the frog. Journal of Physiology 316, 225-250.
MAGLEBY, K. L. & STEVENS, C. F. (1972). A quantitative description of end-plate currents. Journalof Physiology 233, 173-197.
MAGLEBY, K. L. & TERRAR, D. (1975). Factors affecting the time course of decay of end-platecurrents: a possible cooperative action of acetylcholine on receptors at the frog neuromuscularjunction. Journal of Physiology 244, 467-495.
MARSHALL, C. G. & OGDEN, D. C. (1986). The concentration response relationship for carbacholactivation of single channels at the frog endplate. British Journal of Pharmacology 87, 140P.
MATTHEWS-BELLINGER, J. & SALPETER, M. M. (1978). Distribution of acetylycholine receptors atfrog neuromuscular junctions with a discussion of some physiological implications. Journal ofPhysiology 279, 197-213.
NEHER, E. (1983). The charge carried by single-channel currents of rat cultured muscle cells in thepresence of local anaesthetics. Journal of Physiology 339, 663-678.
NEHER, E. & SAKMANN, B. (1975). Voltage-dependence of drug-induced conductance in frogneuromuscular junction. Proceedings of the National Academy of Sciences of the U.S.A. 72,2140-2144
NEHER, E. & STEINBACH, J. H. (1978). Local anaesthetics transiently block currents through singleacetylcholine receptor channels. Journal of Physiology 277, 153-176.
OGDEN, D. C. (1985). The dependence of channel opening probability on acetylcholineconcentration at the frog neuromuscular junction. Journal of Physiology 365, 77P.
OGDEN, D. C. & COLQUHOUN, D. (1983). The efficacy of agonists at the frog neuromuscular junctionstudied with single channel recording. Pftilgers Archiv 399, 246-248.
OGDEN, D. C. & COLQUHOUN, D. (1985).Ion channel block by acetylcholine, carbachol andsuberyldicholine at the frog neuromuscular junction. Proceedings of the Royal Society B 225,329-355.
OGDEN, D. C., COLQUHOUN, D. & MARSHALL, C. G. (1987). Activation of nicotinic ion channels byacetylcholine analogues. In Cellular and Molecular Basis of Cholinergic Function, ed. DOWDALL,M. J. & HAWTHORNE, J. N., pp. 133-151. Chichester: Ellis Horwood.
PASQUALE, E. B., TAKEYASU, K., UDGAONKAR, J. B., CASH, D. J., SEVERSKI, M. C. & HESS, G. P.(1983). Acetylcholine receptor: Evidence for a regulatory binding site in investigations ofsuberyldicholine induced transmembrane ion flux in Electrophorus electricus membrane vesicles.Biochemistry 22, 5967-5973.
RANG, H. P. (1971). Drug receptors and their function. Nature 231, 91-96.SAKMANN, B., PATLAK, J. & NEHER, E. (1980). Single acetylcholine activated channels show burst
kinetics in the presence of desensitizing concentrations of agonist. Nature 286, 71-73.SCUBON-MULIERI, B. & PARSONS, R. L. (1978). Desensitization onset and recovery at the potassium-
depolarized frog neuromuscular junction are voltage sensitive. Journal of General Physiology 71,285-299.
SIEGELBAUM, S. A., TRAUTMANN, A. & KOENIG, J. (1984). Single acetylcholine activated channelcurrents in developing muscle cells. Developmental Biology 104, 366-379.
158

ACTIVATION OF END-PLATE CHANNELS 159
SIGWORTH, F. J. (1985). Open channel noise I. Noise in acetylcholine receptor currents suggestsconformational fluctuations. Biophysical Journal 47, 709-720
SINE, S. M. & STEINBACH, J. H. (1984a). Activation of a nicotinic acetylcholine receptor.Biophysical Journal 45, 175-185.
SINE, S. M. & STEINBACH, J. H. (1984b). Agonists block currents through nicotinic acetylcholinereceptor channels. Biophysical Journal 46, 277-283.
SINE, S. M. & STEINBACH, J. H. (1986). Activation of acetylcholine receptor on clonal mammalianBC3H-1 cells by low concentrations of the agonist. Journal of Physiology 373, 129-162.
SINE, S. M. & STEINBACH, J. H. (1987). Activation of acetylcholine receptors on clonal mammalianBC3H-1 cells by high concentrations of agonist. Journal of Physiology 385, 325-360.
SINE, S. M. & TAYLOR, P. (1981). Relationship between reversible antagonist occupancy and thefunctional capacity of the acetylcholine receptor. Journal of Biological Chemistry 256,6692-6699.
TAKEYASU, K., UDGAONKAR, J. B. & HESS, G. P. (1983). Acetylcholine receptor: Evidence for avoltage dependent regulatory site for acetylcholine. Chemical kinetic measurements in membranevesicles using a voltage clamp. Biochemistry 22, 5973-5978.
WEILAND, G. & TAYLOR, P. (1979). Ligand specificity for state transitions in the cholinergicreceptor: behaviour of agonists and antagonists. Molecular Pharmacology 15, 197-212.