ultraviolet, x-ray, and optical radiation from the geminga ... · ultraviolet, x-ray, and optical...
TRANSCRIPT
ULTRAVIOLET, X-RAY, AND OPTICAL RADIATION FROM THE GEMINGA PULSAR1
O. Y. Kargaltsev,2G. G. Pavlov,
2V. E. Zavlin,
3and R. W. Romani
4
Receivved 2004 December 22; accepted 2005 February 2
ABSTRACT
We observed the �-ray pulsar Geminga with the FUV-MAMA and NUV-MAMA detectors of the Space TelescopeImaging Spectrometer to measure Geminga’s spectrum and pulsations in the ultraviolet. The slope of the far-ultraviolet(FUV) spectrum is close to that of a Rayleigh-Jeans spectrum, suggesting that the FUV radiation is dominated bythermal emission from the neutron star (NS) surface. The measured FUV flux, FFUV ¼ (3:7 � 0:2) ; 10�15 ergs cm�2
s�1 in the 1155–17028 band, corresponds to a brightness temperature TRJ � (0:3–0:4)(d200 /R13)2 MK, depending on
the interstellar extinction (d ¼ 200d200 pc andR ¼ 13R13 km are the distance and the NS radius, respectively). The softthermal component of Geminga’s X-ray spectrum measured with the XMM-Newton observatory corresponds toa temperature Ts ¼ 0:49 � 0:01 MK and radius Rs ¼ (12:9 � 1:0)d200 km. Contrary to other NSs detected in theUV-optical, for which the extrapolation of the X-ray thermal component into the optical underpredicts the observedflux of thermal radiation, the FUV spectrum of Geminga lies slightly below the extrapolation of the soft thermalcomponent, which might be associated with Geminga’s very low temperature. Surprisingly, the thermal FUVradia-tion is strongly pulsed, showing a narrow dip at a phase close to that of a broader minimum of the soft X-ray lightcurve. The strong pulsations might be attributed to partial occultations of the thermal UV radiation by regions ofthe magnetosphere filled with electron/positron plasma. In contrast to the FUV spectrum, the near-infrared (NIR)through near-ultraviolet (NUV) spectrum of Geminga is clearly nonthermal. It can be described by a power-lawmodel, F� / ���þ1, with a photon index � ¼ 1:43 � 0:15, close to the slope � ¼ 1:56 � 0:24 of the hard X-ray(E > 2:5 keV) magnetospheric component. The extrapolation of the X-ray magnetospheric spectrum into theoptical is marginally consistent with (or perhaps lies slightly above) the observed NIR-optical-NUV spectrum. TheNUV pulsations, however, do not show a clear correlation with the hard X-ray pulsations.
Subject headinggs: pulsars: individual (Geminga) — stars: neutron — ultraviolet: stars
1. INTRODUCTION
Spin-powered pulsars show highly pulsed emission from theradio to �-rays, arising from acceleration zones in their magneto-spheres. In the UV to soft X-ray band, however, thermal emissionfrom the neutron star (NS) surface can contribute significantly formiddle-aged pulsars, with characteristic ages � � 104–106 yr.Spectral and timing measurements can separate these two compo-nents, allowing a measure of the surface temperature and thermalluminosity. By measuring thermal emission as a function of age,one can probe the equation of state of matter at supranucleardensities in the NS core and constrain the surface composition.Observations with the Chandra and XMM-Newton X-ray obser-vatories have begun to reveal much about the thermal component(see Pavlov et al. [2002] and Kaspi et al. [2006] for recent re-views). However, since typical effective temperatures of middle-aged pulsars are as low as�30–100 eV, and interstellar absorptionseverely attenuates the flux below�0.1 keV, the X-ray observa-tions of these objects can only probe the Wien tail of the surfacethermal spectrum. Two issues then complicate the interpretation.First, surface composition can dramatically affect the X-ray flux(Romani 1987; Zavlin & Pavlov 2002) with light element at-
mosphere leading to a large Wien excess. Second, any surfacetemperature inhomogeneities will also complicate the spectrum,with hot spots disproportionately important in the high-energy(X-ray) tail. For these reasons, comparison of the X-ray resultswith UV emission from the Rayleigh-Jeans side of the thermalbump is particularly valuable. The challenge here is that non-thermal magnetospheric emission becomes increasingly domi-nant as one moves to the red (Pavlov et al. 2002). Fortunately,the NUV-MAMA and FUV-MAMA detectors of the Space Tele-scope Imaging Spectrometer (STIS) aboard the Hubble SpaceTelescope (HST ) offer access to the UVemission and provide thephase-resolved measurements that can help to separate the ther-mal and nonthermal fluxes.
We report here onHST STIS observations of the middle-aged�-ray pulsar Geminga. Discovered in 1972 by the SAS 2 satellite(Thompson et al. 1977), this object had been known only as a�-ray source until it was detected in X-rays by the Einsteinobservatory (Bignami et al. 1983) and associated with a faint(V � 25:5) optical counterpart (Bignami et al. 1987; Bignamiet al. 1988; Halpern & Tytler 1988). The discovery of a periodP ¼ 237 ms in X-rays with ROSAT (Halpern & Holt 1992) andin �-rays with the Compton Gamma Ray Observatory (CGRO)(Bertch et al. 1992) proved the source to be a spin-poweredpulsar, with a characteristic age � � P/(2P) ¼ 342 kyr and spin-down energy loss rate E ¼ 3:3 ; 1034 ergs s�1. Unlike most spin-powered pulsars, Geminga is not a strong radio source. Detectionof pulsed radio emission at 102MHzwas claimed byMalofeev&Malov (1997), Kuz’min & Losovskii (1997), and Shitov &Pugachev (1998), but the pulsar has not been detected at otherfrequencies (e.g., McLaughlin et al. 1999).
ROSAT, Extreme Ultraviolet Explorer (EUVE ), and AdvancedSatellite for Cosmology and Astrophysics (ASCA) observationshave established that the X-ray spectrum of Geminga consists of
1 Based on observations made with the NASA/ESAHubble Space Telescope,obtained at the Space Telescope Science Institute, which is operated by the Asso-ciation of Universities for Research in Astronomy, Inc., under NASA contractNAS5-26555. These observations are associated with programs GO-9182 andGO-9756.
2 Department of Astronomy and Astrophysics, Pennsylvania State Univer-sity, 525 Davey Laboratory, University Park, PA 16802; [email protected],[email protected].
3 Space Science Department, NASA Marshall Space Flight Center, SD50,Huntsville, AL 35812; [email protected].
4 Department of Physics, Stanford University, Stanford, CA 94305; [email protected].
307
The Astrophysical Journal, 625:307–323, 2005 May 20
# 2005. The American Astronomical Society. All rights reserved. Printed in U.S.A.

a soft thermal component, likely emitted from the NS surface,and a nonthermal component, presumably generated in the pulsarmagnetosphere (Halpern & Ruderman 1993; Halpern & Wang1997; Jackson et al. 2002). Recent observations of Geminga withXMM-Newton have shown an extended emission resembling abow-shock nebula (Caraveo et al. 2003). From a two-component,blackbody (BB) plus power law (PL) fit of the phase-integratedXMM-Newton spectrum, Zavlin & Pavlov (2004b) found a tem-perature TBB � 0:5 MK for the thermal component and a photonindex � � 2 for the magnetospheric component. The X-ray pulseprofile shows a strong dependence on energy, changing from asingle broad peak at EP 0:8 keV to a double-peak structure atEk 2 keV.
The shape of Geminga’s optical spectrum remains contro-versial. Based on photometry with a few broadband filters,Bignami et al. (1996) proposed a broad emission feature around�50008, superimposed on a Rayleigh-Jeans thermal spectrum(see also Mignani et al. 1998), and interpreted the feature as anion cyclotron line emitted from the NS atmosphere.Martin et al.(1998) reported a possible broad dip over 6300–65008 in a flat(� � 1:8) spectrum spanning 3700–8000 8, but the spectrumwas severely contaminated by the sky background. Harlow et al.(1998) detected Geminga in two near-infrared (NIR) bands,which proved that the spectrum grows toward lower frequencies,similar to another middle-aged pulsar B0656+14 (Koptsevichet al. 2001). Overall, it is clear that the optical spectrum is pre-dominantly nonthermal, perhaps with a hint of a Rayleigh-Jeanscomponent at kP 3000 8A. Optical pulsations of Geminga were(marginally) detected in the B band only (Shearer et al. 1998).
Based on three HST WFPC2 observations, Caraveo et al.(1996) found Geminga’s parallax of 6:4� 1:7mas, correspond-ing to d � 160 pc. Our reanalysis of these data together with afourth WFPC2 observation shows that the result is not reliablebecause the exposures were too short to determine Geminga’spositions with the required accuracy (G. Pavlov et al. 2005, inpreparation). Therefore, the distance to Geminga is currentlyunknown. In this paper we scale the distance to d ¼ 200 pc.
Particularly interesting would be an observation of Gemingain the far-ultraviolet (FUV) range, where one could expectthermal radiation from the NS surface to take over the appar-ently nonthermal radiation that prevails in the optical. More-over, observing pulsations of Geminga shortward of �4000 8allow one to study the transformation of the pulse profile in thetransition from the nonthermal to thermal regime and elucidatethe nature of Geminga’s radiation in the optical-UV range. Tomeasure the spectrum and pulsations in the ultraviolet, wecarried out an imaging observation with NUV-MAMA and aspectral observation with FUV-MAMA, both with time reso-lution of 125 �s. These observations and the data analysis, in-cluding the NIR-optical-UV data, are described in x 2. In x 3 wepresent the spectral and timing analyses of a recent XMM-Newton observation of Geminga. Implications of the broadband(NIR through X-rays) observations are discussed in x 4. Theresults of our work are summarized in x 5.
2. OBSERVATIONS AND DATA ANALYSIS
2.1. NUV-MAMA Photometry
Geminga was observed with the STIS NUV-MAMA on 2002February 27 (start date is 52,332.4340 MJD UT). The broad-band filter F25SRF2 (pivot wavelength 22998, FWHM 11288)was used in this imaging observation tominimize the contributionof geocoronal lines. The data were taken during four consecutiveorbits. The total scientific exposure time was 11,367 s.
To avoid possible additional errors associated with the pipe-line subtraction of the strong dark current background (seex 7.4.2 of Kim Quijano et al. 2003), we reprocessed the ‘‘raw’’NUV-MAMA images by repeating all standard calibration pipe-line steps except for this subtraction. As an output, we obtainedfour flat-fielded, ‘‘low-resolution’’ images (1024 ; 1024 pixels;plate scale 0B0244 pixel�1). The target was detected in each ofthe four exposures. To increase the signal-to-noise ratio (S/N),we combined the images from the four exposures into a singleimage using the STSDAS5 taskmscombine. From the sharpnessof the source count distributions for the two point sources de-tected, Geminga and star G (see Fig. 1), we conclude that theimages are aligned well enough for the photometry purposes.(Slight apparent elongations of the images of the two pointsources, in different directions for Geminga and star G, are likelycaused by nonuniformities of the background.) We measure thebackground, which is dominated by the detector dark current,in the annulus with the inner radius of 40 pixels and outer ra-dius of 55 pixels, centered on the source (X ¼ 539:5 and Y ¼540:5 pixels). Themean background count rate within the annu-lus is 1:59 ; 10�3 counts s�1 pixel�1.To find an optimal aperture radius, we measured the number
of source counts, Ns ¼ Nt � Nb (where Nt is the total number ofcounts andNb is the number of background counts estimated byscaling the mean background in the annulus to the aperture area),and its uncertainty, �Ns, in apertures with radii of about 2, 3, 4, 5,6, and 7 pixels (see Table 1). To evaluate the background uncer-tainty needed for calculating �Ns, we put each of the apertures at15 positions randomly distributed over the annulus, measuredthe number of background counts within the aperture for eachposition, and calculated the rms, �Nb, of the differences betweenthis number and the mean background scaled to the aperture area.The uncertainty of the source counts can then be calculated as�Ns ¼ ½Ns þ �N2
b (1þ 1/15)�1=2 for each of the apertures. FromTable 1 we see that the dependence of S/N (=Ns /�Ns) on
Fig. 1.—NUV-MAMA image of the field around the Geminga pulsar (at thecenter of the image). The only other point source in the field is star G (e.g.,Halpern et al. 1985), used for acquisition. The inset shows brightness contoursin the 2B1 ; 2B2 region centered on Geminga.
5 The Space Telescope Data Analysis System is available at http://www.stsci.edu/ resources /software_hardware/stsdas.
KARGALTSEV ET AL.308 Vol. 625
aperture radius has a flat maximum at a level of S/N � 35 atr � 3–6 pixels.
We also measured the numbers of counts in the image com-bined from the automatically processed images (with the darkcurrent subtracted), performing standard aperture photometrywith the IRAF task phot from the apphot package.6 A goodagreement with the results obtained from the direct measure-ments of the total (dark current plus sky) background (e.g.,Ns��Ns ¼ 1821 � 51 vs. 1808 � 50, for the 4 pixel radius aper-ture) shows that the pipeline subtraction of the dark current doesnot introduce substantial errors in this case.
The source spectral flux Fk is connected with the number ofsource counts in a given aperture by the integral relation
Ns ¼ t
ZRkkFk�k dk; ð1Þ
where t is the exposure time, Rk is the integrated systemthroughput, including the Optical Telescope Assembly (OTA)and filter throughputs,7 and �k is the wavelength-dependentencircled energy fraction. One can define the average flux inthe filter passband as either
Fk ¼Ns
tRRkk�k dk
ð2Þ
or
Fkh i ¼ Ns
t�RRkk dk
; ð3Þ
where � is in average encircled energy fraction in the filterpassband and Ns /(t� ) ¼ C is the source count rate correctedfor the finite aperture. We calculated the average spectral fluxesin both ways (see Table 1) using the �k-values measured byProffitt et al. (2003) for several aperture radii. We see that themean fluxes, Fk ’ Fkh i ’ 1:5 ; 10�18 ergs cm�2 s�1 8�1, areclose to each other for rk3 pixels. The uncertainty of thesevalues, �10%, is mostly due to systematic errors in the en-circled energy fraction.
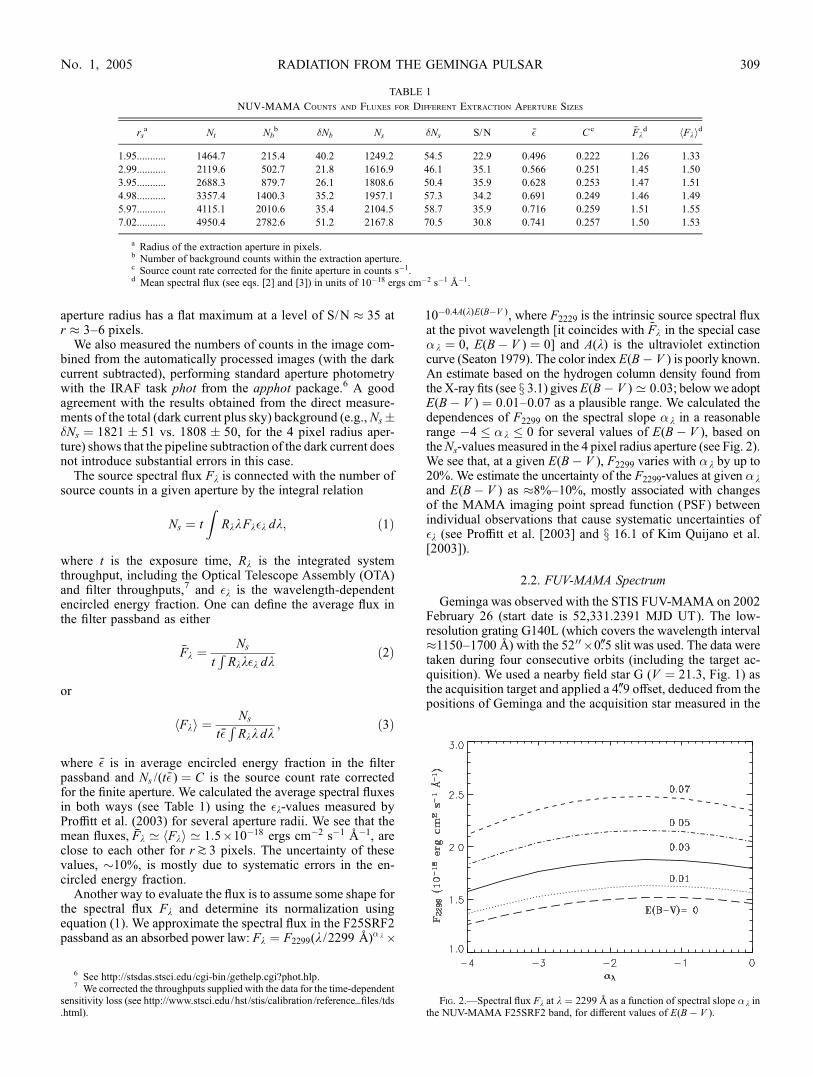
Another way to evaluate the flux is to assume some shape forthe spectral flux Fk and determine its normalization usingequation (1). We approximate the spectral flux in the F25SRF2passband as an absorbed power law: Fk ¼ F2299(k /2299 8)� k ;
10�0:4A(k)E(B�V ), where F2229 is the intrinsic source spectral fluxat the pivot wavelength [it coincides with Fk in the special case�k ¼ 0, E(B� V ) ¼ 0] and A(k) is the ultraviolet extinctioncurve (Seaton 1979). The color index E(B� V ) is poorly known.An estimate based on the hydrogen column density found fromthe X-ray fits (see x 3.1) gives E(B� V ) ’ 0:03; belowwe adoptE(B� V ) ¼ 0:01–0.07 as a plausible range. We calculated thedependences of F2299 on the spectral slope �k in a reasonablerange �4 � �k � 0 for several values of E(B� V ), based ontheNs-values measured in the 4 pixel radius aperture (see Fig. 2).We see that, at a given E(B� V ), F2299 varies with �k by up to20%. We estimate the uncertainty of the F2299-values at given �kand E(B� V ) as �8%–10%, mostly associated with changesof the MAMA imaging point spread function (PSF) betweenindividual observations that cause systematic uncertainties of�k (see Proffitt et al. [2003] and x 16.1 of Kim Quijano et al.[2003]).
2.2. FUV-MAMA Spectrum
Geminga was observed with the STIS FUV-MAMA on 2002February 26 (start date is 52,331.2391 MJD UT). The low-resolution grating G140L (which covers the wavelength interval�1150–1700 8) with the 5200 ; 0B5 slit was used. The data weretaken during four consecutive orbits (including the target ac-quisition). We used a nearby field star G (V ¼ 21:3, Fig. 1) asthe acquisition target and applied a 4B9 offset, deduced from thepositions of Geminga and the acquisition star measured in the
TABLE 1
NUV-MAMA Counts and Fluxes for Different Extraction Aperture Sizes
rsa Nt Nb
b �Nb Ns �Ns S/N � C c Fkd Fkh id
1.95........... 1464.7 215.4 40.2 1249.2 54.5 22.9 0.496 0.222 1.26 1.33
2.99........... 2119.6 502.7 21.8 1616.9 46.1 35.1 0.566 0.251 1.45 1.50
3.95........... 2688.3 879.7 26.1 1808.6 50.4 35.9 0.628 0.253 1.47 1.51
4.98........... 3357.4 1400.3 35.2 1957.1 57.3 34.2 0.691 0.249 1.46 1.49
5.97........... 4115.1 2010.6 35.4 2104.5 58.7 35.9 0.716 0.259 1.51 1.55
7.02........... 4950.4 2782.6 51.2 2167.8 70.5 30.8 0.741 0.257 1.50 1.53
a Radius of the extraction aperture in pixels.b Number of background counts within the extraction aperture.c Source count rate corrected for the finite aperture in counts s�1.d Mean spectral flux (see eqs. [2] and [3]) in units of 10�18 ergs cm�2 s�1 8�1.
Fig. 2.—Spectral flux Fk at k ¼ 2299 8 as a function of spectral slope �k inthe NUV-MAMA F25SRF2 band, for different values of E(B� V ).
6 See http://stsdas.stsci.edu/cgi-bin /gethelp.cgi?phot.hlp.7 We corrected the throughputs supplied with the data for the time-dependent
sensitivity loss (see http://www.stsci.edu/hst /stis/calibration /reference_files/tds.html).
RADIATION FROM THE GEMINGA PULSAR 309No. 1, 2005
archival HST images, which placed Geminga about 0B1 off theslit center. The total scientific exposure time was 10,674 s.
For each exposure, we processed the raw ‘‘high-resolution’’images (2048 ; 2048 pixels, plate scale of 0B0122 pixel�1—see x 11 of Kim Quijano et al. 2003) using the calibration filesavailable on 2003 July 1. As an output, we obtained flat-fielded,low-resolution (1024 ; 1024 pixels, plate scale 0B0244 pixel�1,spectral resolution 0.58 8 pixel�1) images and used them forthe spectral analysis.
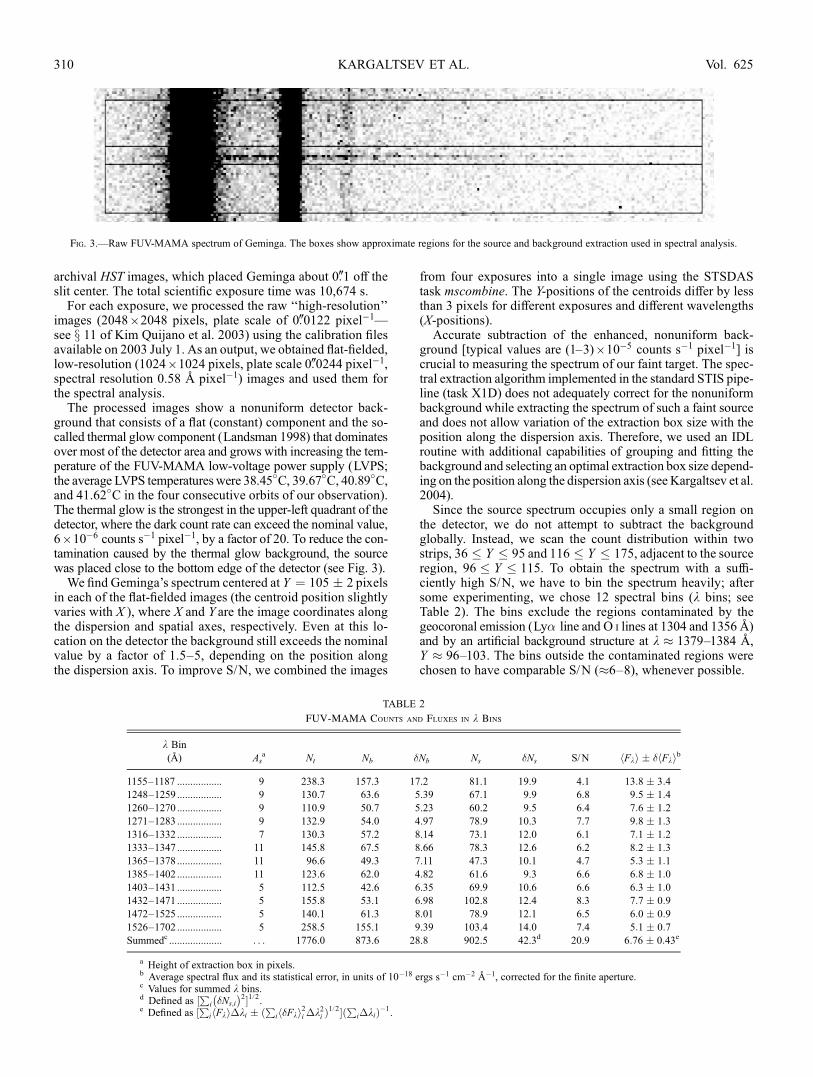
The processed images show a nonuniform detector back-ground that consists of a flat (constant) component and the so-called thermal glow component (Landsman 1998) that dominatesover most of the detector area and grows with increasing the tem-perature of the FUV-MAMA low-voltage power supply (LVPS;the average LVPS temperatures were 38.45
�C, 39.67
�C, 40.89
�C,
and 41.62�C in the four consecutive orbits of our observation).The thermal glow is the strongest in the upper-left quadrant of thedetector, where the dark count rate can exceed the nominal value,6 ; 10�6 counts s�1 pixel�1, by a factor of 20. To reduce the con-tamination caused by the thermal glow background, the sourcewas placed close to the bottom edge of the detector (see Fig. 3).
We find Geminga’s spectrum centered at Y ¼ 105 � 2 pixelsin each of the flat-fielded images (the centroid position slightlyvaries with X ), where X and Y are the image coordinates alongthe dispersion and spatial axes, respectively. Even at this lo-cation on the detector the background still exceeds the nominalvalue by a factor of 1.5–5, depending on the position alongthe dispersion axis. To improve S/N, we combined the images
from four exposures into a single image using the STSDAStask mscombine. The Y-positions of the centroids differ by lessthan 3 pixels for different exposures and different wavelengths(X-positions).Accurate subtraction of the enhanced, nonuniform back-
ground [typical values are (1–3) ; 10�5 counts s�1 pixel�1] iscrucial to measuring the spectrum of our faint target. The spec-tral extraction algorithm implemented in the standard STIS pipe-line (task X1D) does not adequately correct for the nonuniformbackground while extracting the spectrum of such a faint sourceand does not allow variation of the extraction box size with theposition along the dispersion axis. Therefore, we used an IDLroutine with additional capabilities of grouping and fitting thebackground and selecting an optimal extraction box size depend-ing on the position along the dispersion axis (see Kargaltsev et al.2004).Since the source spectrum occupies only a small region on
the detector, we do not attempt to subtract the backgroundglobally. Instead, we scan the count distribution within twostrips, 36 � Y � 95 and 116 � Y � 175, adjacent to the sourceregion, 96 � Y � 115. To obtain the spectrum with a suffi-ciently high S/N, we have to bin the spectrum heavily; aftersome experimenting, we chose 12 spectral bins (k bins; seeTable 2). The bins exclude the regions contaminated by thegeocoronal emission (Ly� line and O i lines at 1304 and 13568)and by an artificial background structure at k � 1379–1384 8,Y � 96–103. The bins outside the contaminated regions werechosen to have comparable S/N (�6–8), whenever possible.
Fig. 3.—Raw FUV-MAMA spectrum of Geminga. The boxes show approximate regions for the source and background extraction used in spectral analysis.
TABLE 2
FUV-MAMA Counts and Fluxes in k Bins
k Bin
(8) Asa Nt Nb �Nb Ns �Ns S/N Fkh i � � Fkh ib
1155–1187 ................. 9 238.3 157.3 17.2 81.1 19.9 4.1 13:8 � 3:41248–1259 ................. 9 130.7 63.6 5.39 67.1 9.9 6.8 9:5 � 1:4
1260–1270 ................. 9 110.9 50.7 5.23 60.2 9.5 6.4 7:6 � 1:2
1271–1283 ................. 9 132.9 54.0 4.97 78.9 10.3 7.7 9:8 � 1:3
1316–1332 ................. 7 130.3 57.2 8.14 73.1 12.0 6.1 7:1 � 1:21333–1347 ................. 11 145.8 67.5 8.66 78.3 12.6 6.2 8:2 � 1:3
1365–1378 ................. 11 96.6 49.3 7.11 47.3 10.1 4.7 5:3 � 1:1
1385–1402 ................. 11 123.6 62.0 4.82 61.6 9.3 6.6 6:8 � 1:0
1403–1431 ................. 5 112.5 42.6 6.35 69.9 10.6 6.6 6:3 � 1:01432–1471 ................. 5 155.8 53.1 6.98 102.8 12.4 8.3 7:7 � 0:9
1472–1525 ................. 5 140.1 61.3 8.01 78.9 12.1 6.5 6:0 � 0:9
1526–1702 ................. 5 258.5 155.1 9.39 103.4 14.0 7.4 5:1 � 0:7
Summedc .................... . . . 1776.0 873.6 28.8 902.5 42.3d 20.9 6:76 � 0:43e
a Height of extraction box in pixels.b Average spectral flux and its statistical error, in units of 10�18 ergs s�1 cm�2 8�1, corrected for the finite aperture.c Values for summed k bins.d Defined as ½
Pi �Ns;i
� �2�1=2.
e Defined as ½P
i Fkh i�ki � ðP
ih�Fki2i �k2i Þ1=2�ð
Pi�ki�1
.
KARGALTSEV ET AL.310 Vol. 625
For each of the k bins, we calculate the total number ofcounts,Nt , within the extraction boxes of different heights (one-dimensional apertures): As ¼ 3, 5, 7, 9, 11, 13, 15, and 17 pixels,centered at Y ¼ 106 for the first two k bins and at Y ¼ 105 forthe rest of the k bins. To evaluate the background, we first cleanthe background strips (see above) fromoutstanding (>10�3 countss�1 pixel�1) values (‘‘bad pixels’’) by setting them to local averagevalues. Then for each of the k bins, we fit the Y-distribution ofthe background countswith a first-order polynomial (interpolatingacross the source region), estimate the number Nb of backgroundcounts within the source extraction aperture As, and evaluate thenumber of source counts, Ns ¼ Nt � Nb (Table 2).
The uncertainty �Ns of the source counts can be evaluated as�Ns ¼ ½Ns þ �N 2
b (1þ As /Ab)�1=2, where �Nb is the background
uncertainty in the source aperture. We binned the distribution ofbackground counts along the Y-axis with the bin sizes equal toAs and calculated �Nb as the rms of the differences between theactual numbers of background counts in the bins and those ob-tained from the fit to the background. We calculated �Ns andS/N for various extraction box heights and found the As-valuesmaximizing S/N for each k bin (see Table 2).
We calculated the average spectral fluxes in the k bins (cf.eq. [3]),
Fkh ii ¼R�ki
RkkFk dkR�ki
Rkk dk¼ CiR
�kiRkk dk
; ð4Þ
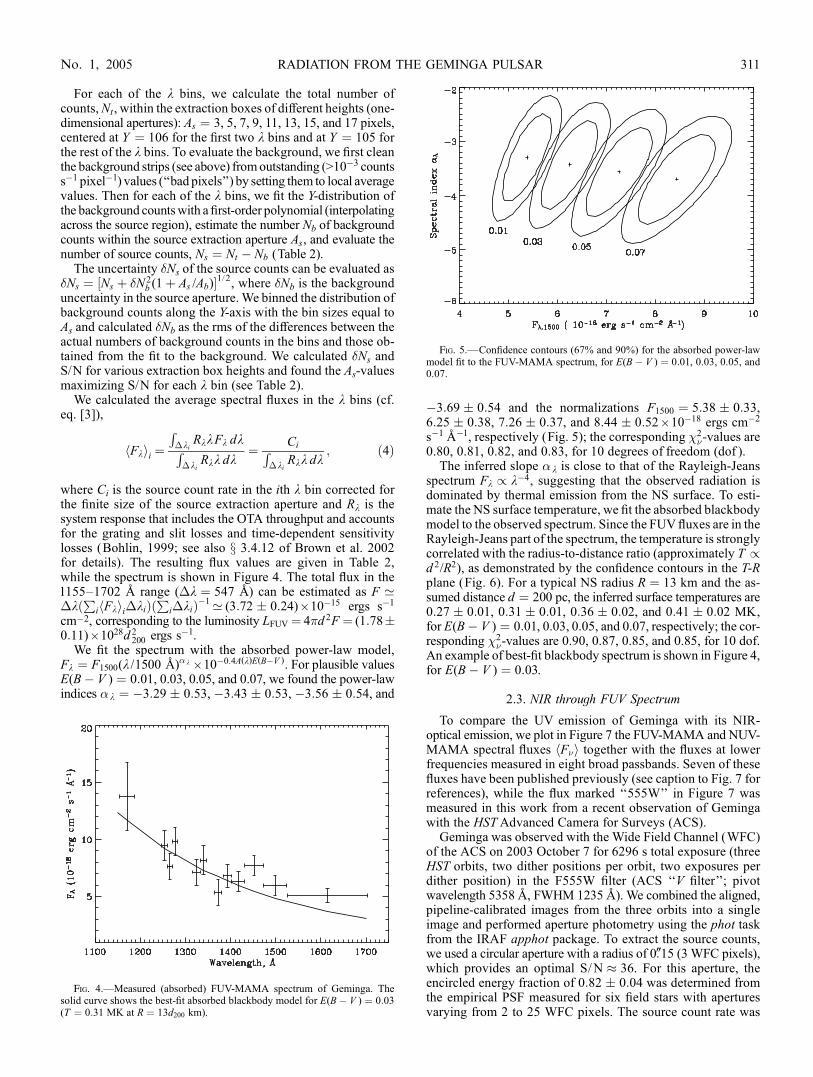
where Ci is the source count rate in the ith k bin corrected forthe finite size of the source extraction aperture and Rk is thesystem response that includes the OTA throughput and accountsfor the grating and slit losses and time-dependent sensitivitylosses (Bohlin, 1999; see also x 3.4.12 of Brown et al. 2002for details). The resulting flux values are given in Table 2,while the spectrum is shown in Figure 4. The total flux in the1155–1702 8 range (�k ¼ 547 8) can be estimated as F ’�kð
Pi Fkh ii�kiÞð
Pi�kiÞ�1’ (3:72 � 0:24) ; 10�15 ergs s�1
cm�2, corresponding to the luminosity LFUV ¼ 4�d 2F ¼ (1:78�0:11) ; 1028d 2
200 ergs s�1.We fit the spectrum with the absorbed power-law model,
Fk ¼ F1500(k /1500 8)� k ; 10�0:4A(k)E(B�V ). For plausible valuesE(B� V ) ¼ 0:01, 0.03, 0.05, and 0.07, we found the power-lawindices �k ¼ �3:29 � 0:53, �3:43 � 0:53, �3:56 � 0:54, and
�3:69 � 0:54 and the normalizations F1500 ¼ 5:38 � 0:33,6:25 � 0:38, 7:26 � 0:37, and 8:44 � 0:52 ; 10�18 ergs cm�2
s�1 8�1, respectively (Fig. 5); the corresponding 2�-values are
0.80, 0.81, 0.82, and 0.83, for 10 degrees of freedom (dof ).The inferred slope �k is close to that of the Rayleigh-Jeans
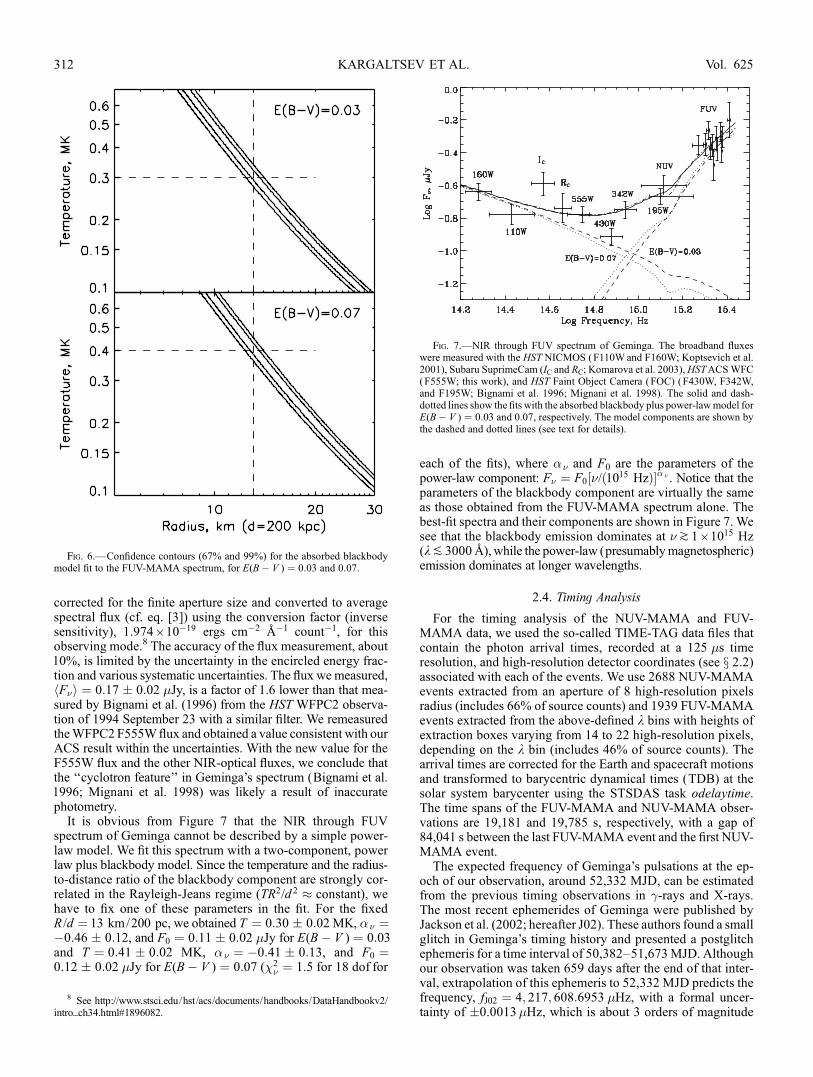
spectrum Fk / k�4, suggesting that the observed radiation isdominated by thermal emission from the NS surface. To esti-mate the NS surface temperature, we fit the absorbed blackbodymodel to the observed spectrum. Since the FUVfluxes are in theRayleigh-Jeans part of the spectrum, the temperature is stronglycorrelated with the radius-to-distance ratio (approximately T /d 2/R2), as demonstrated by the confidence contours in the T-Rplane (Fig. 6). For a typical NS radius R ¼ 13 km and the as-sumed distance d ¼ 200 pc, the inferred surface temperatures are0:27 � 0:01, 0:31 � 0:01, 0:36 � 0:02, and 0:41 � 0:02 MK,for E(B� V ) ¼ 0:01, 0.03, 0.05, and 0.07, respectively; the cor-responding 2
�-values are 0.90, 0.87, 0.85, and 0.85, for 10 dof.An example of best-fit blackbody spectrum is shown in Figure 4,for E(B� V ) ¼ 0:03.
2.3. NIR through FUV Spectrum
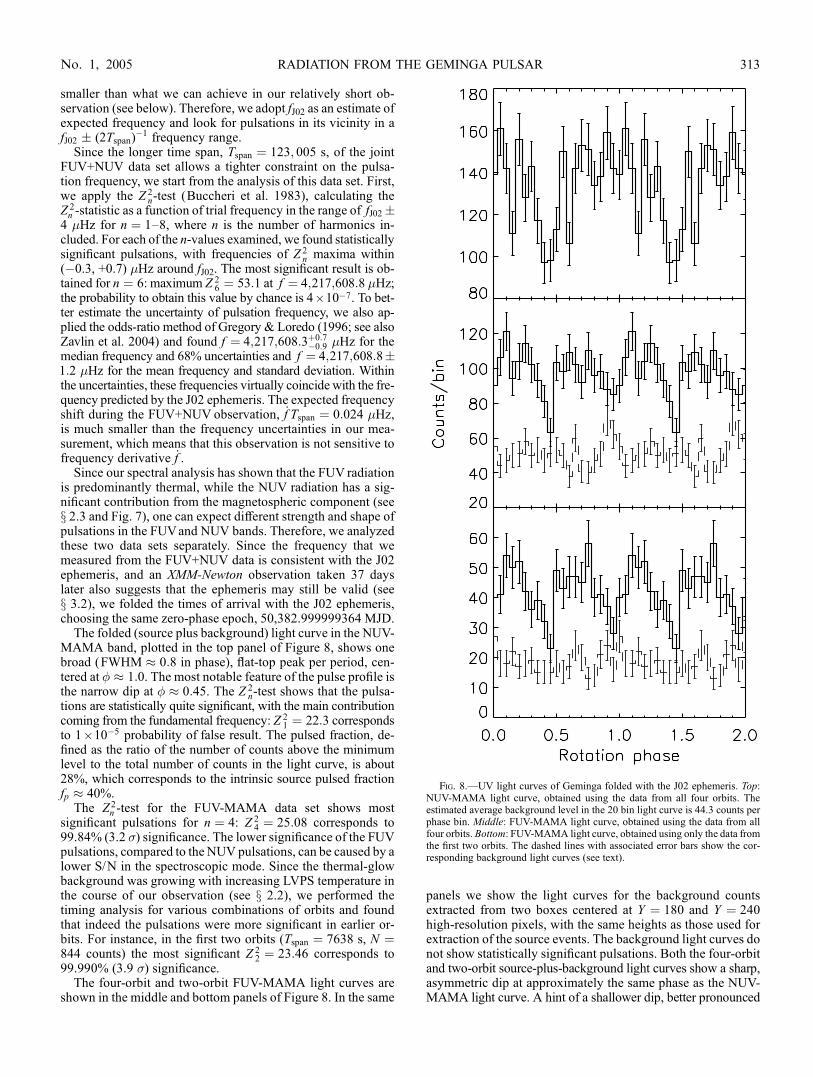
To compare the UV emission of Geminga with its NIR-optical emission, we plot in Figure 7 the FUV-MAMA and NUV-MAMA spectral fluxes F�h i together with the fluxes at lowerfrequencies measured in eight broad passbands. Seven of thesefluxes have been published previously (see caption to Fig. 7 forreferences), while the flux marked ‘‘555W’’ in Figure 7 wasmeasured in this work from a recent observation of Gemingawith the HSTAdvanced Camera for Surveys (ACS).
Geminga was observed with the Wide Field Channel (WFC)of the ACS on 2003 October 7 for 6296 s total exposure (threeHST orbits, two dither positions per orbit, two exposures perdither position) in the F555W filter (ACS ‘‘V filter’’; pivotwavelength 53588, FWHM 12358). We combined the aligned,pipeline-calibrated images from the three orbits into a singleimage and performed aperture photometry using the phot taskfrom the IRAF apphot package. To extract the source counts,we used a circular aperture with a radius of 0B15 (3 WFC pixels),which provides an optimal S/N � 36. For this aperture, theencircled energy fraction of 0:82 � 0:04 was determined fromthe empirical PSF measured for six field stars with aperturesvarying from 2 to 25 WFC pixels. The source count rate was
Fig. 4.—Measured (absorbed) FUV-MAMA spectrum of Geminga. Thesolid curve shows the best-fit absorbed blackbody model for E(B� V ) ¼ 0:03(T ¼ 0:31 MK at R ¼ 13d200 km).
Fig. 5.—Confidence contours (67% and 90%) for the absorbed power-lawmodel fit to the FUV-MAMA spectrum, for E(B� V ) ¼ 0:01, 0.03, 0.05, and0.07.
RADIATION FROM THE GEMINGA PULSAR 311No. 1, 2005
corrected for the finite aperture size and converted to averagespectral flux (cf. eq. [3]) using the conversion factor (inversesensitivity), 1:974 ; 10�19 ergs cm�2 8�1 count�1, for thisobserving mode.8 The accuracy of the flux measurement, about10%, is limited by the uncertainty in the encircled energy frac-tion and various systematic uncertainties. The flux wemeasured,F�h i ¼ 0:17 � 0:02 �Jy, is a factor of 1.6 lower than that mea-sured by Bignami et al. (1996) from the HST WFPC2 observa-tion of 1994 September 23 with a similar filter. We remeasuredtheWFPC2 F555Wflux and obtained a value consistent with ourACS result within the uncertainties. With the new value for theF555W flux and the other NIR-optical fluxes, we conclude thatthe ‘‘cyclotron feature’’ in Geminga’s spectrum (Bignami et al.1996; Mignani et al. 1998) was likely a result of inaccuratephotometry.
It is obvious from Figure 7 that the NIR through FUVspectrum of Geminga cannot be described by a simple power-law model. We fit this spectrum with a two-component, powerlaw plus blackbody model. Since the temperature and the radius-to-distance ratio of the blackbody component are strongly cor-related in the Rayleigh-Jeans regime (TR2/d 2 � constant), wehave to fix one of these parameters in the fit. For the fixedR /d ¼ 13 km/200 pc, we obtained T ¼ 0:30 � 0:02 MK, �� ¼�0:46 � 0:12, and F0 ¼ 0:11 � 0:02 �Jy for E(B� V ) ¼ 0:03and T ¼ 0:41 � 0:02 MK, �� ¼ �0:41 � 0:13, and F0 ¼0:12 � 0:02 �Jy for E(B� V ) ¼ 0:07 (2
� ¼ 1:5 for 18 dof for
each of the fits), where �� and F0 are the parameters of thepower-law component: F� ¼ F0 �/ 10
15 Hzð Þ½ ��� . Notice that theparameters of the blackbody component are virtually the sameas those obtained from the FUV-MAMA spectrum alone. Thebest-fit spectra and their components are shown in Figure 7. Wesee that the blackbody emission dominates at �k 1 ; 1015 Hz(kP 30008), while the power-law (presumablymagnetospheric)emission dominates at longer wavelengths.
2.4. Timing Analysis
For the timing analysis of the NUV-MAMA and FUV-MAMA data, we used the so-called TIME-TAG data files thatcontain the photon arrival times, recorded at a 125 �s timeresolution, and high-resolution detector coordinates (see x 2.2)associated with each of the events. We use 2688 NUV-MAMAevents extracted from an aperture of 8 high-resolution pixelsradius (includes 66% of source counts) and 1939 FUV-MAMAevents extracted from the above-defined k bins with heights ofextraction boxes varying from 14 to 22 high-resolution pixels,depending on the k bin (includes 46% of source counts). Thearrival times are corrected for the Earth and spacecraft motionsand transformed to barycentric dynamical times (TDB) at thesolar system barycenter using the STSDAS task odelaytime.The time spans of the FUV-MAMA and NUV-MAMA obser-vations are 19,181 and 19,785 s, respectively, with a gap of84,041 s between the last FUV-MAMA event and the first NUV-MAMA event.The expected frequency of Geminga’s pulsations at the ep-
och of our observation, around 52,332 MJD, can be estimatedfrom the previous timing observations in �-rays and X-rays.The most recent ephemerides of Geminga were published byJackson et al. (2002; hereafter J02). These authors found a smallglitch in Geminga’s timing history and presented a postglitchephemeris for a time interval of 50,382–51,673MJD. Althoughour observation was taken 659 days after the end of that inter-val, extrapolation of this ephemeris to 52,332 MJD predicts thefrequency, fJ02 ¼ 4; 217; 608:6953 �Hz, with a formal uncer-tainty of �0.0013�Hz, which is about 3 orders of magnitude
Fig. 7.—NIR through FUV spectrum of Geminga. The broadband fluxeswere measured with the HST NICMOS (F110W and F160W; Koptsevich et al.2001), Subaru SuprimeCam (IC and RC; Komarova et al. 2003),HSTACSWFC(F555W; this work), and HST Faint Object Camera (FOC) (F430W, F342W,and F195W; Bignami et al. 1996; Mignani et al. 1998). The solid and dash-dotted lines show the fits with the absorbed blackbody plus power-lawmodel forE(B� V ) ¼ 0:03 and 0.07, respectively. The model components are shown bythe dashed and dotted lines (see text for details).
Fig. 6.—Confidence contours (67% and 99%) for the absorbed blackbodymodel fit to the FUV-MAMA spectrum, for E(B� V ) ¼ 0:03 and 0.07.
8 See http://www.stsci.edu/hst/acs/documents/handbooks/DataHandbookv2/intro_ch34.html#1896082.
KARGALTSEV ET AL.312 Vol. 625
smaller than what we can achieve in our relatively short ob-servation (see below). Therefore, we adopt fJ02 as an estimate ofexpected frequency and look for pulsations in its vicinity in afJ02 � (2Tspan)
�1 frequency range.Since the longer time span, Tspan ¼ 123; 005 s, of the joint
FUV+NUV data set allows a tighter constraint on the pulsa-tion frequency, we start from the analysis of this data set. First,we apply the Z 2
n-test (Buccheri et al. 1983), calculating theZ 2n -statistic as a function of trial frequency in the range of fJ02�
4 �Hz for n ¼ 1–8, where n is the number of harmonics in-cluded. For each of the n-values examined, we found statisticallysignificant pulsations, with frequencies of Z 2
n maxima within(�0.3, +0.7) �Hz around fJ02. The most significant result is ob-tained for n ¼ 6: maximum Z 2
6 ¼ 53:1 at f ¼ 4;217;608:8 �Hz;the probability to obtain this value by chance is 4 ; 10�7. To bet-ter estimate the uncertainty of pulsation frequency, we also ap-plied the odds-ratio method of Gregory & Loredo (1996; see alsoZavlin et al. 2004) and found f ¼ 4;217;608:3þ0:7
�0:9 �Hz for themedian frequency and 68% uncertainties and f ¼ 4;217;608:8�1:2 �Hz for the mean frequency and standard deviation. Withinthe uncertainties, these frequencies virtually coincide with the fre-quency predicted by the J02 ephemeris. The expected frequencyshift during the FUV+NUV observation, f Tspan ¼ 0:024 �Hz,is much smaller than the frequency uncertainties in our mea-surement, which means that this observation is not sensitive tofrequency derivative f .
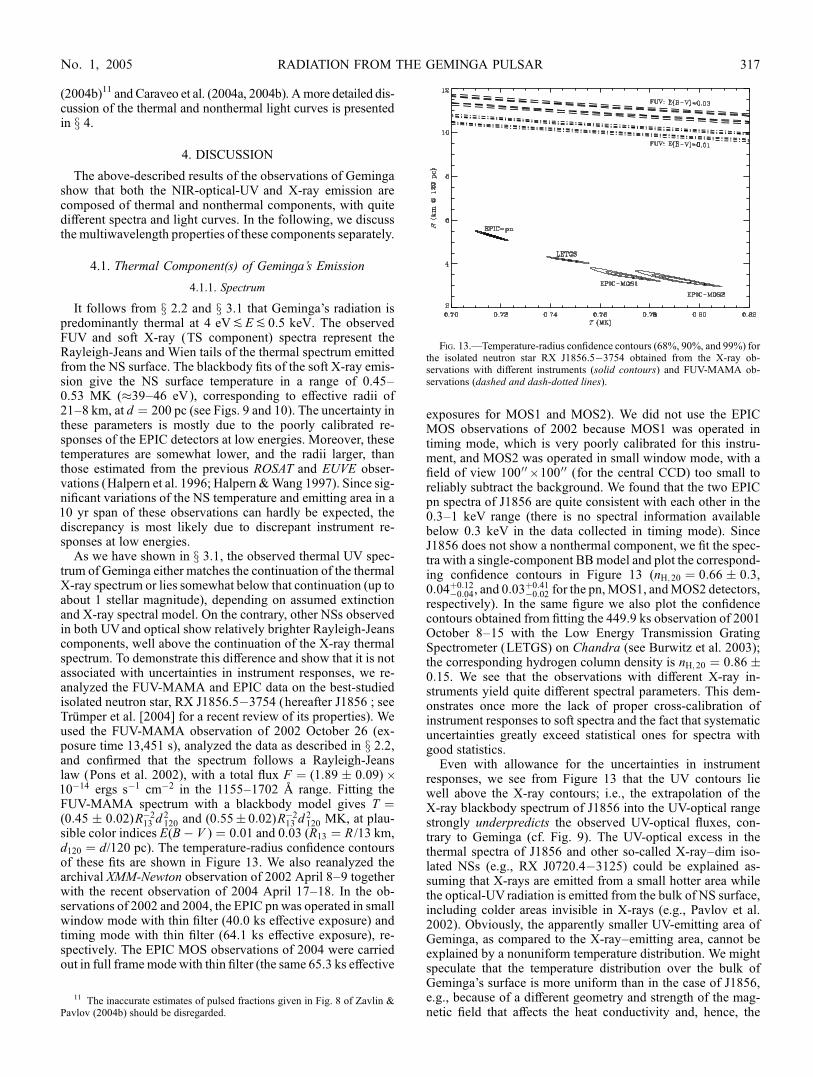
Since our spectral analysis has shown that the FUV radiationis predominantly thermal, while the NUV radiation has a sig-nificant contribution from the magnetospheric component (seex 2.3 and Fig. 7), one can expect different strength and shape ofpulsations in the FUVand NUV bands. Therefore, we analyzedthese two data sets separately. Since the frequency that wemeasured from the FUV+NUV data is consistent with the J02ephemeris, and an XMM-Newton observation taken 37 dayslater also suggests that the ephemeris may still be valid (seex 3.2), we folded the times of arrival with the J02 ephemeris,choosing the same zero-phase epoch, 50,382.999999364 MJD.
The folded (source plus background) light curve in the NUV-MAMA band, plotted in the top panel of Figure 8, shows onebroad (FWHM � 0:8 in phase), flat-top peak per period, cen-tered at � 1:0. The most notable feature of the pulse profile isthe narrow dip at � 0:45. The Z 2
n-test shows that the pulsa-tions are statistically quite significant, with the main contributioncoming from the fundamental frequency: Z 2
1 ¼ 22:3 correspondsto 1 ; 10�5 probability of false result. The pulsed fraction, de-fined as the ratio of the number of counts above the minimumlevel to the total number of counts in the light curve, is about28%, which corresponds to the intrinsic source pulsed fractionfp � 40%.
The Z 2n -test for the FUV-MAMA data set shows most
significant pulsations for n ¼ 4: Z 24 ¼ 25:08 corresponds to
99.84% (3.2 �) significance. The lower significance of the FUVpulsations, compared to the NUV pulsations, can be caused by alower S/N in the spectroscopic mode. Since the thermal-glowbackground was growing with increasing LVPS temperature inthe course of our observation (see x 2.2), we performed thetiming analysis for various combinations of orbits and foundthat indeed the pulsations were more significant in earlier or-bits. For instance, in the first two orbits (Tspan ¼ 7638 s, N ¼844 counts) the most significant Z 2
2 ¼ 23:46 corresponds to99.990% (3.9 �) significance.
The four-orbit and two-orbit FUV-MAMA light curves areshown in the middle and bottom panels of Figure 8. In the same
panels we show the light curves for the background countsextracted from two boxes centered at Y ¼ 180 and Y ¼ 240high-resolution pixels, with the same heights as those used forextraction of the source events. The background light curves donot show statistically significant pulsations. Both the four-orbitand two-orbit source-plus-background light curves show a sharp,asymmetric dip at approximately the same phase as the NUV-MAMA light curve. A hint of a shallower dip, better pronounced
Fig. 8.—UV light curves of Geminga folded with the J02 ephemeris. Top:NUV-MAMA light curve, obtained using the data from all four orbits. Theestimated average background level in the 20 bin light curve is 44.3 counts perphase bin. Middle: FUV-MAMA light curve, obtained using the data from allfour orbits. Bottom: FUV-MAMA light curve, obtained using only the data fromthe first two orbits. The dashed lines with associated error bars show the cor-responding background light curves (see text).
RADIATION FROM THE GEMINGA PULSAR 313No. 1, 2005

in the two-orbit light curve, is seen at � 0:95. The pulsedfraction in the observed (source + background) radiation isabout 35% and 45% for the four orbits and first two orbits,respectively. The corresponding intrinsic pulsed fractions arerather high, about 60%–70%. It should be noted, however, thatthese values are rather uncertain because of the large statisticalerror of the minimum level.
3. X-RAY SPECTRUM AND PULSATIONS OF GEMINGA
To better understand the UV spectrum and pulsations ofGeminga, observations at X-ray wavelengths are particularlyuseful. The deepest observation of Geminga in X-rays was car-ried out with the XMM-Newton observatory on 2002 April 4–5 (orbit 425). The European Photon Imaging Camera (EPIC)MOS and pn instruments observed the pulsar for 101.4 and71.4 ks of effective exposures, respectively. Two EPIC MOSdetectors were operated with medium filters in full frame mode,providing an image of a large area, r �140, with time resolutionof 2.6 s. EPIC pn was used in combination with thin filter insmall window mode that covers a 4A37 ; 4A37 region and pro-vides a 5.7 ms time resolution. First results of this observationhave been reported by Zavlin & Pavlov (2004b) and Caraveoet al. (2004a, 2004b). Here we briefly describe the X-ray spec-trum and pulsations of Geminga, with emphasis on the proper-ties most useful for the comparison with the optical-UV data.
3.1. X-Ray Spectrum
The most detailed X-ray spectrum of Geminga was obtainedwith the EPIC pn instrument. The EPIC pn data, processed withthe SAS package (ver. 6.0.0),9 were used for the spectral andtiming analysis. We extracted the source (plus background)photons from a 4000 radius circle centered at the pulsar position,which contains about 88% of source counts. The estimated to-tal source count rate (corrected for finite extraction radius) is0:813 � 0:004 counts s�1 in the 0.2–10 keV range for singleand double events (with photon-induced charge detected in asingle CCD pixel and two adjacent pixels). The 0.2–10 keVphase-integrated spectrum was binned in 222 spectral bins withat least 40 source counts per bin. The detector response matrixand effective area were generated with the rmfgen and arfgentools, respectively. Fitting this spectrumwith a two-component,blackbody (BB) plus power-law (PL), model, we find the black-body temperature TBB ¼ 0:47� 0:02MKand radiusR ¼ (17:0�2:5)d200 km, which suggests that the thermal component origi-nates from the NS surface. The PL component, with a photonindex � ¼ 2:02 � 0:05, dominates at energies Ek 0:6 keVand contains about 10% of the total luminosity in the 0.2–10 keV band, L
pl0:2–10 keV ¼ (2:6 � 0:1) ; 1030 d 2
200 ergs s�1 ’7 ; 10�5d 2
200 E. Extrapolated into the optical domain, the PLcomponent exceeds the observed optical fluxes by a factor of100–500, which might be interpreted as a flattening of the pul-sar magnetospheric spectrum at lower photon energies. Thehydrogen column density derived from this fit is nH ¼ (2:9�0:2) ; 1020 cm�2.
Although the two-component model cannot be rejectedbased on the overall fit quality (2
� ¼ 1:11 for 217 dof ; sys-tematic errors in the EPIC pn response not included), the fitresiduals show some excess of observed counts over the best-fitmodel at higher energies, Ek 7 keV, indicating a harder PLspectrum. Indeed, fitting the high-energy tail (E > 2:5 keV) of
the spectrum with a single PL model gives � ¼ 1:56 � 0:24and L
pl0:2–10 keV ¼ (2:2 � 0:2) ; 1030 d 2
200 ergs s�1 (2� ¼ 0:98
for 30 dof ). The BB+PL fit with � fixed at this value is sta-tistically unacceptable (� ¼ 2:95 for 219 dof ). Therefore, wetried a three-component model consisting of soft (TS) and hard(TH) blackbody components and a PL component. With the PLparameters fixed at the values obtained from the best PL fit inthe 2.5–10 keV band (� ¼ 1:56,N ¼ 5:5 ; 10�5 photons cm�2
s�1 keV�1 at 1 keV), we obtain the following parameters forthe thermal components: Ts ¼ 0:49 � 0:01 MK, Rs ¼ (12:9 �1:0)d200 km, Th ¼ 2:32� 0:08MK, Rh ¼ (46� 12)d200 m, andnH ¼ (2:4 � 0:2) ; 1020 cm�2 (2
� ¼ 1:10 for 217 dof ). Fittingthe EPIC MOS spectra obtained in this observation yields al-most the same model parameters (discarding the EPIC MOSevents below 0.3 keV, where the responses of the MOS detec-tors are known very poorly).In the TS+TH+PL model the TS component can be inter-
preted as emission from the bulk of NS surface, the TH com-ponent can be ascribed to emission from smaller, hotter regionsof the NS surface, and the PL component represents the magneto-spheric radiation. Such an interpretation of Geminga’s X-rayspectrum is in line with the results obtained from Chandraand XMM-Newton observations of the other bright middle-agedpulsars, B0656+14 and B1055�52, whose X-ray spectra canalso be described by the TS+TH+PL model with similar param-eters (Pavlov et al. 2002; Zavlin & Pavlov 2004b). However,the effective radius of Geminga’s TH component is much smallerthan those of B0656+14 and B1055�52, about 0:6(d /0:3 kpc)and 0:4(d /0:7 kpc) km, respectively.The confidence contours for the temperature and radius
of the TS component are shown in Figure 9. In the same fig-ure we plotted the temperature-radius confidence contours ob-tained from the blackbody fit of the FUV-MAMA spectrum forE(B� V ) ¼ 0:03 and 0.07 (see x 2.2 and Fig. 6). We see that atplausible values of interstellar extinction, E(B� V )P0:07, theFUV contours lie at smaller radii (or lower temperatures) thanthe X-ray contours. This means that the extrapolation of the
Fig. 9.—Confidence contours (68%, 90%, and 99%) in the temperature-radius plane obtained from fitting the EPIC pn spectra (solid lines) with theTS+TH+PL and BB+PL models (labels near the contours). The TS+TH+PLcontours were obtained at the fixed parameters of the PL component; nH wasfree for the upper contours, while it was fixed at the value obtained from ROSATdata for the lower contours. All the model parameters were free for the EPIC pnBB+PL contours. The dashed and dash-dotted lines show the confidence con-tours obtained from fitting the FUV-MAMA spectrum with a blackbody modelfor two values of the color index E(B� V ).9 Available at http://xmm.vilspa.esa.es.
KARGALTSEV ET AL.314 Vol. 625

thermal X-ray component into the UV-optical goes above theobserved FUV flux: (TR2)X /(TR
2)FUV ’ 1:8, 1.6, 1.4, and 1.2for E(B� V ) ¼ 0:01, 0.03, 0.05, and 0.07, respectively, for thebest-fit parameter values (see also Fig. 10). Such behavior is incontrast to other neutron stars observed in both X-rays andoptical, for which such an extrapolation usually underpredictsthe optical-UV fluxes10 by a factor of 2–7 (see x 4.1). To obtaina similar ratio for Geminga, one would have to assume unre-alistically high extinction, E(B� V ) � 0:2–0.4.
If we adopt the above-described two-component (BB+PL)model, the discrepancy between the X-ray and FUV tempera-ture and radius is even more pronounced, as demonstrated bythe corresponding confidence contours in the upper left part ofFigure 9 and the top panel of Figure 10. We note, however, thatthe nH-values corresponding to these contours, (2:4 � 0:2) ;1020 and (2:9 � 0:2) ; 1020 cm�2 for the TS+TH+PL andBB+PLmodels, respectively, significantly exceed the nH ’ (1:1 � 0:2) ;1020 cm�2 obtained from theROSAT PSPC observations (Halpern&Wang 1997), which indicates a discrepancy between the PSPCand EPIC responses at low energies. If we fix nH at the best-fit PSPC value, the confidence contours shift to higher temper-atures and lower radii (see the lower-right EPIC pn contoursin Fig. 9), overlapping the FUV contours. For this nH, the FUVfluxes lie on the extrapolation of the best-fit X-ray TS componentat E(B� V )P 0:04 (see Fig. 10, bottom panel ). Since neitherEPIC nor PSPC have been accurately calibrated for very softspectra, systematic errors can substantially exceed the statisticalerrors, and the model parameters inferred from such fits may notbe very accurate. Therefore, there still remains some uncertaintyin the comparison of the X-ray (Wien) and UV (Rayleigh-Jeans)tails of the thermal spectrum. However, even accounting for thisuncertainty, Geminga exhibits a fainter UV-optical thermal ra-diation, relative to the soft X-ray radiation, than the other neutronstars for which such a comparison is possible (see x 4.1).
Figure 10 also shows that the continuation of the best-fitX-ray PL into the optical very strongly overpredicts the observedNIR-optical fluxes for the BB+PL model. However, the predictedand observed fluxes become marginally consistent if we use thePL component inferred from the E > 2:5 keV spectral tail.
3.2. X-Ray Pulsations
To study the X-ray pulsations of Geminga, we use the sameEPIC pn data (Tspan ¼ 101:9 ks, epoch of the middle of the timespan 52,369.2997 MJD). First, we measured the pulsationfrequency using the Z 2
n and odds-ratio methods for variousenergy bands and extraction radii and found most probablefrequencies in the range of 4,217,607.75–4,217,607.96 �Hz,with typical uncertainties of about 0.1 �Hz for individualmeasurements. For example, the odds-ratio method applied for42,170 events in the 0.23–4.0 keV band, extracted from a 4000
radius circle, gives f ¼ 4; 217; 607:85 � 0:10 �Hz for the meanfrequency and standard deviation and f ¼ 4; 217; 607:86 (�0.05,+0.05; �0.16, +0.12; �0.24, +0.19) �Hz for the median fre-quency and 68%, 90%, and 99% uncertainties. The most prob-able frequencies are consistently lower, by 0.1–0.3�Hz, than thefrequency fJ02 ¼ 4; 217; 608:0664 � 0:0013 �Hz predicted bythe J02 ephemeris. However, since the differences do not exceed3 � uncertainties of our measurements, it is still possible that theJ02 ephemeris is applicable at the epoch of the XMM-Newtonobservation.
We have also directly checked the phase alignment of thelight curves extracted from the XMM-Newton data with thoseobserved by ASCA in 1999 October 5–11. The bottom panel ofFigure 11 shows the XMM-Newton light curve folded with theJ02 ephemeris in the energy band 0.5–2 keV (10,264 counts ina 4000 radius aperture). The top panel of the same figure showsthe light curve obtained with the two ASCA Gas Imaging Spec-trometer (GIS) instruments (Texp ¼ 207:8 ks, Tspan ¼ 486:5 ks,epoch of the middle of the time span MJD 51,459.7356; 1819counts in a 30 radius aperture) folded with the same ephemerisand in the same energy range.We see that not only are the shapesof these light curves virtually the same, but also their phases are
Fig. 10.—NIR through X-ray spectrum of Geminga for different X-rayspectral models and different color indices. The solid lines show the best-fit(absorbed) spectra in the X-ray range and their extrapolations into the NIR-FUVrange. The short-dashed and dash-dotted lines show the (soft) thermal and PLcomponents, respectively, the dotted lines in three bottom panels show the THcomponent (its contribution is negligible in the NIR-FUV range), and the long-dashed lines present the unabsorbed total spectra. The crosses depict the mea-sured NIR-FUV spectral fluxes (cf. Fig. 7). The hatched areas along the PL andthermal components in the NIR-FUV range demonstrate propagated uncertain-ties of the corresponding extrapolations. The top panel shows a two-component(BB+PL) X-ray fit, while three bottom panels show TS+TH+PL fits with fixedparameters of the PL component. The fit shown in the bottom panel was ob-tained at a fixed nH-value, while nH was a fitting parameter in three top panels.(See text for more details.)
10 A possible exception is the Vela pulsar (see Romani et al. 2005).
RADIATION FROM THE GEMINGA PULSAR 315No. 1, 2005

in excellent agreement, within the phase uncertainty (’0.12) ofthe J02 timing solution propagated to the epoch of the XMM-Newton observation. Therefore,we assume that the J02 ephemerisis still applicable in 2002 April and use it to compare the lightcurves observed with different instruments.
The background-subtracted light curves in the energy ranges0.2–0.5, 0.6–1.0, and 2–8 keV are shown in Figure 12. In the0.2–0.5 and 2–8 keV bands the radiation is dominated by theTS and PL components, respectively, while the 0.6–1.0 keVband was chosen around the maximum of the TH component(see Fig. 10). The light curves were extracted from a smaller,3000 radius, aperture and a shorter, 80.0 ks, time span (excludingintervals of strong background flares at the beginning and endof the observation) to reduce the background contamination andmaximize the S/N. The 2–8 keV light curve (pulsed fractionfp ¼ 34% � 8%) shows two pronounced peaks per period, re-sembling the �-ray light curve (albeit with smaller distancebetween the peaks) and a hint of a third peak at � 0:2. On thecontrary, the 0.2–0.5 keV light curve ( fp ¼ 30% � 2%) is char-acterized by one broad peak per period (with small ‘‘ripples,’’perhaps due to contribution from the PL and TH components).The 0.6–1.0 keV light curve shows the highest pulsed fraction,fp ¼ 62% � 5%, with one asymmetric peak, possibly composedof several peaks associated with contributions from differentcomponents in this band (Fig. 10). The minimum of the 0.2–0.5 keV light curve is approximately aligned in phase with oneof the minima of the 2–8 keV light curve, being shifted by� � 0:1 from the sharp dips of the NUVand FUV light curves.(One should remember, however, that the shift can be causedby errors in phase alignment.) Examples of X-ray light curvesfor other energy ranges can be found in Zavlin & Pavlov
Fig. 12.—Background-subtracted light curves of Geminga in UV (NUV-MAMA + FUV-MAMA), X-ray (EPIC pn), and �-ray (EGRET) bands, foldedwith the J02 ephemeris. The �-ray light curve is taken from J02.
Fig. 11.—ASCAGIS andXMM-Newton EPIC pn light curves in the 0.5–2 keVrange folded with the J02 ephemeris.
KARGALTSEV ET AL.316 Vol. 625
(2004b)11 and Caraveo et al. (2004a, 2004b). Amore detailed dis-cussion of the thermal and nonthermal light curves is presentedin x 4.
4. DISCUSSION
The above-described results of the observations of Gemingashow that both the NIR-optical-UV and X-ray emission arecomposed of thermal and nonthermal components, with quitedifferent spectra and light curves. In the following, we discussthe multiwavelength properties of these components separately.
4.1. Thermal Component(s) of Geminga’s Emission
4.1.1. Spectrum
It follows from x 2.2 and x 3.1 that Geminga’s radiation ispredominantly thermal at 4 eVPEP 0:5 keV. The observedFUV and soft X-ray (TS component) spectra represent theRayleigh-Jeans and Wien tails of the thermal spectrum emittedfrom the NS surface. The blackbody fits of the soft X-ray emis-sion give the NS surface temperature in a range of 0.45–0.53 MK (�39–46 eV), corresponding to effective radii of21–8 km, at d ¼ 200 pc (see Figs. 9 and 10). The uncertainty inthese parameters is mostly due to the poorly calibrated re-sponses of the EPIC detectors at low energies. Moreover, thesetemperatures are somewhat lower, and the radii larger, thanthose estimated from the previous ROSAT and EUVE obser-vations (Halpern et al. 1996; Halpern &Wang 1997). Since sig-nificant variations of the NS temperature and emitting area in a10 yr span of these observations can hardly be expected, thediscrepancy is most likely due to discrepant instrument re-sponses at low energies.
As we have shown in x 3.1, the observed thermal UV spec-trum of Geminga either matches the continuation of the thermalX-ray spectrum or lies somewhat below that continuation (up toabout 1 stellar magnitude), depending on assumed extinctionand X-ray spectral model. On the contrary, other NSs observedin both UVand optical show relatively brighter Rayleigh-Jeanscomponents, well above the continuation of the X-ray thermalspectrum. To demonstrate this difference and show that it is notassociated with uncertainties in instrument responses, we re-analyzed the FUV-MAMA and EPIC data on the best-studiedisolated neutron star, RX J1856.5�3754 (hereafter J1856 ; seeTrumper et al. [2004] for a recent review of its properties). Weused the FUV-MAMA observation of 2002 October 26 (ex-posure time 13,451 s), analyzed the data as described in x 2.2,and confirmed that the spectrum follows a Rayleigh-Jeanslaw (Pons et al. 2002), with a total flux F ¼ (1:89 � 0:09) ;10�14 ergs s�1 cm�2 in the 1155–1702 8 range. Fitting theFUV-MAMA spectrum with a blackbody model gives T ¼(0:45 � 0:02)R�2
13 d2120 and (0:55� 0:02)R�2
13 d2120 MK, at plau-
sible color indices E(B� V ) ¼ 0:01 and 0.03 (R13 ¼ R /13 km,d120 ¼ d/120 pc). The temperature-radius confidence contoursof these fits are shown in Figure 13. We also reanalyzed thearchival XMM-Newton observation of 2002 April 8–9 togetherwith the recent observation of 2004 April 17–18. In the ob-servations of 2002 and 2004, the EPIC pn was operated in smallwindow mode with thin filter (40.0 ks effective exposure) andtiming mode with thin filter (64.1 ks effective exposure), re-spectively. The EPIC MOS observations of 2004 were carriedout in full framemode with thin filter (the same 65.3 ks effective
exposures for MOS1 and MOS2). We did not use the EPICMOS observations of 2002 because MOS1 was operated intiming mode, which is very poorly calibrated for this instru-ment, and MOS2 was operated in small window mode, with afield of view 10000 ; 10000 (for the central CCD) too small toreliably subtract the background. We found that the two EPICpn spectra of J1856 are quite consistent with each other in the0.3–1 keV range (there is no spectral information availablebelow 0.3 keV in the data collected in timing mode). SinceJ1856 does not show a nonthermal component, we fit the spec-tra with a single-component BB model and plot the correspond-ing confidence contours in Figure 13 (nH;20 ¼ 0:66 � 0:3,0:04þ0:12
�0:04, and 0:03þ0:41�0:02 for the pn,MOS1, andMOS2 detectors,
respectively). In the same figure we also plot the confidencecontours obtained from fitting the 449.9 ks observation of 2001October 8–15 with the Low Energy Transmission GratingSpectrometer (LETGS) on Chandra (see Burwitz et al. 2003);the corresponding hydrogen column density is nH;20 ¼ 0:86 �0:15. We see that the observations with different X-ray in-struments yield quite different spectral parameters. This dem-onstrates once more the lack of proper cross-calibration ofinstrument responses to soft spectra and the fact that systematicuncertainties greatly exceed statistical ones for spectra withgood statistics.
Even with allowance for the uncertainties in instrumentresponses, we see from Figure 13 that the UV contours liewell above the X-ray contours; i.e., the extrapolation of theX-ray blackbody spectrum of J1856 into the UV-optical rangestrongly underpredicts the observed UV-optical fluxes, con-trary to Geminga (cf. Fig. 9). The UV-optical excess in thethermal spectra of J1856 and other so-called X-ray–dim iso-lated NSs (e.g., RX J0720.4�3125) could be explained as-suming that X-rays are emitted from a small hotter area whilethe optical-UV radiation is emitted from the bulk of NS surface,including colder areas invisible in X-rays (e.g., Pavlov et al.2002). Obviously, the apparently smaller UV-emitting area ofGeminga, as compared to the X-ray–emitting area, cannot beexplained by a nonuniform temperature distribution. We mightspeculate that the temperature distribution over the bulk ofGeminga’s surface is more uniform than in the case of J1856,e.g., because of a different geometry and strength of the mag-netic field that affects the heat conductivity and, hence, the
Fig. 13.—Temperature-radius confidence contours (68%, 90%, and 99%) forthe isolated neutron star RX J1856.5�3754 obtained from the X-ray ob-servations with different instruments (solid contours) and FUV-MAMA ob-servations (dashed and dash-dotted lines).
11 The inaccurate estimates of pulsed fractions given in Fig. 8 of Zavlin &Pavlov (2004b) should be disregarded.
RADIATION FROM THE GEMINGA PULSAR 317No. 1, 2005

surface temperature distribution. However, to explain why themore uniformly heated Geminga exhibits quite substantialpulsations of its thermal radiation ( fp � 30% in soft X-rays)while no pulsations have been detected from J1856, one has toassume a special orientation of the spin axis of J1856.
Any realistic interpretation of thermal emission from NSsshould take into account possible deviations of thermal spectraemitted from NS surface layers (e.g., atmospheres) from theidealized Planck spectra as well as the anisotropy of the surfaceemission associated with strong magnetic fields (e.g., Pavlovet al. 1995; Rajagopal et al. 1997; Zavlin & Pavlov 2002). Forinstance, since the X-ray spectrum emitted from a stronglyionized hydrogen atmosphere is harder than the Planck spec-trum, a blackbody fit of such a spectrum gives a temperatureexceeding the actual effective temperature by a factor of 1.5–2.5 and a radius a factor of 3–15 smaller than the actual radiusof the NS at a given distance. Moreover, the optical part of thespectrum emitted from such an atmosphere strongly exceeds theextrapolation of the blackbody fit of its X-ray spectrum intothe optical domain (Pavlov et al. 1996). Although the fully ion-ized atmosphere models are not applicable to cold NSs (e.g., theygive an improbably large radius-to-distance ratio, R � 100 kmat d ¼ 200 pc, for Geminga; Meyer et al. 1994), atmosphericeffects might, in principle, explain the large difference betweenthe observed UV spectrum and the continuation of the black-body fit of the X-ray thermal spectrum in J1856 and similarNSs. However, no realistic models adequately describing theobserved broadband spectrum of J1856 have been suggested sofar, which is not surprising, given the extremely complicatedphysics of the dense, strongly magnetized matter at the rela-tively low temperature of the surface layers. If we adopt such aninterpretation of the strong deviation of the J1856 broadbandspectrum from a pure blackbody spectrum, then we have toexplain why the broadband spectrum of Geminga is so differentfrom that of J1856. Possible hypotheses might involve differentchemical compositions of the surface layers and/or substantiallydifferent magnetic fields (a crude estimate of Geminga’s mag-netic field is�2 ; 1012 G, but the magnetic field of J1856 is quiteuncertain12). Moreover, the surface layers of Geminga andJ1856 might be in different phase states. For instance, one couldspeculate that the cold surface of Geminga is in a solid statewhile the (hotter) surface of J1856 is in a gaseous or liquidstate, which might explain their different spectra. To distinguishbetween these possibilities, reliable models for NS thermal emis-sion at relatively low temperatures, accounting for the contri-bution of molecules in the opacity of gaseous atmospheres withstrong magnetic fields (Turbiner & Lopez Vieyra 2004) andpossible condensation of the surface layers into a liquid or solidstate (van Adelsberg et al. 2004), are to be developed and com-pared with the observational data. Until reliable models areavailable, the temperatures and radii obtained from applyingsimplified models (blackbody, fully ionized atmospheres, par-tially ionized atmospheres without molecules) should be con-sidered as crude estimates only, and any conclusions based onsuch fits should be considered with caution. However, althoughwe cannot trust absolute values of the parameters obtained withthe aid of simplified models, some interesting qualitative resultscan be obtained from comparison of the same parameter mea-sured for different NSs. For instance, fits of the soft X-ray spectraof Geminga and an older pulsar B1055�52 with any model
available give a lower temperature for the younger Geminga,which may have very interesting implications for the NS coolingmodels, suggesting different masses of these NSs (Yakovlev &Pethick 2004).As we mentioned in x 3.1, in addition to the thermal soft (TS)
component, the X-ray spectrum of Geminga apparently has athermal hard (TH) component, with a much higher temperatureTh � 2 MK and an apparent (isotropic) luminosity Lh � 4 ;1029 ergs s�1. Although such a component has been seen in thespectra of other middle-aged pulsars, the effective radius, Rh �50d200 m, for Geminga’s TH component is surprisingly small incomparison with the conventional polar cap radius, Rpc ¼(2�f R3)1
=2c�1=2 � 300 m, suggested by the pulsar models. Sucha small value ofRhmight be explained by a projection effect (if themagnetic axis remains almost perpendicular to the line of sightin the course of NS rotation), but this explanation can hardly bereconciled with the high pulsed fraction at energies where theTH component contribution is maximal (see x 4.1.2). On theother hand, we should remember that the TS component wasobtained assuming Planck spectra for both thermal componentsand a single power law for the magnetospheric spectrum. Becauseboth these assumptions are not necessarily correct, we cannot ruleout the possibility that the ‘‘TH component’’ is simply associatedwith a harder, high-energy tail of the surface radiation (comparedto the pureWien spectrum) or that it is due to a steepening of theslope of the phase-integrated magnetospheric spectrum withdecreasing photon energy (see x 4.2).
4.1.2. Pulsations in Thermal Emission
One of the most intriguing results of our STIS MAMA ob-servations of Geminga is the strong, nonsinusoidal pulsations inthe FUVrange, where the spectrum is dominated by the thermalcomponent, most likely emitted from the bulk of NS surface.The shape of the FUV pulsations is different from that of thesoft X-ray pulsations, where the TS component dominates (seeFig. 12). Obviously, neither FUV nor soft X-ray pulsations canbe produced by the locally isotropic blackbody emission. Toexplain the unusual pulse shape and the large pulsed fraction ofthe thermal FUV and soft X-ray radiation, we have to invokeeffects of strong magnetic field on the angular dependence ofNS surface emission or assume that there is a ‘‘screen’’ in theNS magnetosphere that may partially eclipse the surface emis-sion at some rotation phases.In a strong magnetic field, B3 1011(E /1 keV) G, when the
electron cyclotron energy Ec exceeds the photon energy, thelocal emission is essentially anisotropic (in particular, beamedalong the direction of the magnetic field), which may lead tostrong pulsations of the thermal radiation. The angular distri-bution and the shape of pulsations depend on the properties ofthe emitting region. For instance, the angular distribution oflocal emission from a fully ionized NS atmosphere shows astrong, narrow peak [�� � (E/Ec)
1=2] along the magnetic field(pencil component) and a broad fanlike component across themagnetic field (Pavlov et al. 1994). When integrated over thevisible surface of a NS with a dipole magnetic field, the angulardistribution of NS radiation is beamed along the magnetic axis,even in the case of a uniformly heated NS surface (Zavlin &Pavlov 2002). Such peaks could explain the soft X-ray pulsa-tions (at Ek kTeA), including the observed increase of pulsedfraction with energy. In this hypothesis, the 0.2–0.5 keV pulseprofile (see Fig. 12) can be interpreted as a sum of a smooththermal component (the broad thermal peak, with a maximumat � 0:8, corresponds to the closest approach of the magneticaxis to the line of sight), and small ‘‘wiggles’’ (e.g., at � 0:9)
12 For instance, Pavlov & Zavlin (2003) consider the possibility that J1856is a millisecond pulsar with a very low magnetic field, B � 108–109 G, whileTrumper et al. (2004) suggest that it has a very strong field B > 1013 G.
KARGALTSEV ET AL.318 Vol. 625

due to the contribution of the magnetospheric radiation. How-ever, at ETkTeA the peaks in the model angular distributionare too low to be responsible for the observed FUV pulsa-tions. On the other hand, as we mentioned above, the fullyionized atmosphere models are not directly applicable to thecold Geminga, while the partially ionized atmospheres have notbeen well investigated.
If the NS surface matter is in a condensed state, we alsoshould expect an anisotropic emission. Although the angulardistribution of emission from a condensed surface has not beenstudied, the examples of spectral emissivity for several directions,calculated by van Adelsberg et al. (2004), suggest that at leastlocal radiation is beamed along the magnetic field. To understandwhether the radiation from the entire NS surface can show pul-sations similar to those observed fromGeminga, the local specificfluxes should be integrated over the visible NS surface for variousmagnetic field geometries and orientations of the spin and mag-netic axes (see Perez-Azorın et al. 2005 for a few examples).
An alternative explanation for the narrow deep minima in theUV pulse profiles could be a partial eclipse by an object coro-tating with the NS. Since the shapes of the UV and soft X-raylight curves are different (in particular, the minima are broaderin soft X-rays), the eclipsing object should have a wavelength-dependent effective size. A natural candidate for such a screenis themagnetospheric electron-positron plasma, which can absorbthe NS surface radiation as a result of the cyclotron resonancescattering in a resonance layer, where the cyclotron energy isequal to the photon energy in the rest frame of the electron (e.g.,Blandford & Scharlemann 1976). Two types of models havebeen discussed for the scattering region: a stationary nonrelativ-istic plasma in the closed magnetic field lines zone (Rajagopal &Romani 1997; Wang et al. 1998; Ruderman 2003) and streams ofultrarelativistic electron-positron pairs ejected along the open fieldlines (e.g., Lyubarskii & Petrova 1998, 2000, and referencestherein). In the latter case, the effects of the resonant inverseCompton scattering on the properties of observed UV and/orX-ray radiation have not been investigated in detail; however,crude estimates show that an extremely large pair multiplicity isneeded to reach an optical thickness of k1. In the case of non-relativistic plasma in the closed zone, which can be supportedagainst the gravitational force by the thermal radiation pressureenhanced by the cyclotron resonance (Mitrofanov & Pavlov1982; Rajagopal & Romani 1997), the effects of resonant cy-clotron scattering become significant if the electron/positronnumber density is a factor of �102 larger than the corotation(Goldreich-Julian) density, nGJ � 1013 cm�3 for Geminga. Theelectron-positron pairs could be supplied from accelerationzones, but rapid pair production ( large multiplicity) is needed toprovide such high densities. In addition, it remains unclear howthe electrons/positrons would lose the longitudinal momentumto become nonrelativistic particles (the transverse momentumis essentially nonrelativistic because of the fast synchrotron/cyclotron losses). If, nevertheless, there is such a nonrelativisticplasma screen in the closed zone, the wavelength dependence ofits optical thickness depends on spatial distribution of scatteringparticles. In particular, the assumption that the minima in theUV light curves of Geminga are caused by such a rotatingscreen implies a significant amount of electron-positron pairs ata distance of�15RNS, where the magnetic field is�109 G. Onemight speculate that the broader minima in the soft X-ray lightcurve are also caused by a partial eclipse by the screen. In thiscase, the X-ray resonance layer (at a distance �5RNS) shouldsubtend a larger solid angle than the UV resonance layer. Al-ternatively, if the soft X-ray pulsations are caused not by the
screen but by the intrinsic anisotropy of the thermal radiation inthe strongmagnetic field (see above), then the magnetosphere istransparent for the X-rays we observe, i.e., the inner boundaryof the plasma screen is located beyond �5RNS.
To infer the size of the putative screen and understand thespatial distribution of electrons and positrons, independent in-formation on the orientation of the spin and magnetic axes wouldbe very useful. Such information could be obtained from X-raypulsations of the TH component emitted by hot polar caps, whichapparently contribute to theX-ray spectrum around�0.7 keV (seeFig. 10). Caraveo et al. (2004b) have interpreted the EPIC data asdisplaying a varying TH component arising from a rotating polarcap. However, in our analysis the contribution of this componentto the spectral flux is small and is not clearly seen in the pulseprofile. Indeed, the 0.6–1.0 keV pulse profile (Fig. 12) can be de-composed into a broad thermal pulse with a maximum at �0:8, similar to the mainly thermal 0.2–0.5 keV pulse, and anarrower nonthermal pulse centered at the same phase, � 0:6,as the higher of the two purely nonthermal peaks in 2–8 keVlight curve. In other words, we see no convincing evidence forthe TH component (hence, polar caps) in the energy-dependentlight curves. More definitive information on the axis orientationcould be obtained from phase-resolved X-ray polarimetry (e.g.,Pavlov & Zavlin 2000; Lai & Ho 2003), but it is not possiblewith the currently operating X-ray missions.
4.2. Nonthermal Emission
The multiwavelength observations of Geminga show that itsemission in the NIR-optical, hard X-rays, and �-rays is non-thermal, presumably generated in the NS magnetosphere. Thecomparative analysis of the results of these observations pro-vides an opportunity to understand the mechanisms responsiblefor the magnetospheric emission in different energy bands.
First, we can compare the phase-integrated X-ray spectra atEk 2 keVand optical spectra at EP3 eV, where the nonthermalemission dominates. As shown in x 3.1, the fits to the X-rayspectrum yield substantially different slopes of the PL com-ponent, depending on whether the TH component is included inthe model. With the data available, we cannot statistically proveor reject the TH component. However, we can extrapolate thePL components of the two different models (with and withoutthe TH component) to the optical and compare the extrapo-lations with the observed nonthermal spectra (Figs. 7 and 10).The PL fit of the 2.5–10 keV tail has about the same slope as theoptical PL component [�X ¼ 1:56 � 0:24, �O ¼ 1:46 � 0:12and 1:41� 0:13 for E(B� V ) ¼ 0:03 and 0.07, respectively],and the extrapolation of the X-ray PL spectrum is marginallyconsistent with the optical fluxes (the uncertainty of the ex-trapolation is shown in Fig. 10 [bottom panel] and Fig. 14for absorbed and unabsorbed spectra, respectively). The NIRthrough X-ray spectrum can be crudely described by a PLmodel with a slope �OX � 1:3, which is smaller than �X
and �O , but the differences are close to 1 � uncertainties ofthe photon indices. Similar NIR through X-ray behavior, with�X � �O � 1:5, has been seen in another middle-aged pulsar,B0656+14 (Pavlov et al. 2002; Zavlin & Pavlov 2004b). Suchbehavior implies that the optical and X-ray emission are gen-erated by the same population of relativistic particles with a PLenergy spectrum and by the same (likely synchrotron) mecha-nism. This conclusion is supported by the fact that the ratioof optical-to–X-ray luminosities is about the same for all thepulsars observed in both X-rays and optical, despite a largescatter of the X-ray and optical ‘‘efficiencies,’’ LX/E and LO/E(Zavlin & Pavlov 2004a).
RADIATION FROM THE GEMINGA PULSAR 319No. 1, 2005

If the TH component is not included in the fit, the extrapo-lation of the PL component (�X ¼ 2:02 � 0:05) of the BB+PLfit of the 0.2–10 keV spectrum exceeds the optical fluxes bymore than 2 orders of magnitude (see Fig. 10, top panel ). Thismight imply a flattening of the spectrum with decreasing energy,as observed in the younger Crab and Vela pulsars (Sollerman et al.2000; Romani et al. 2005). However, the continuation towardhigher energies of the NIR-optical PL component crosses theX-ray PL component at energies k10 keV, which means a‘‘double break’’ of the spectrum between the optical and X-raybands (i.e., � becomes smaller than �O and then increases to �X).Although such behavior has been suggested (with a considerableuncertainty) for the young LMC pulsar B0540�69 (Serafimovichet al. 2004), it was not observed in other pulsars and currently doesnot look very plausible.
One can also extrapolate the best-fit X-ray PL componentstoward higher energies to compare with the �-ray data (Fig. 14).The CGRO EGRET �-ray spectrum has a slope �� ¼ 1:50 �0:08 in the energy range 70 MeV to 2 GeV (Mayer-Hassel-wander et al. 1994), close to that inferred from the PL fit of the2.5–10 keV tail. However, the extrapolation of the EGRETspectrum into the X-ray range exceeds the X-ray PL tail byabout 1 order of magnitude, while the extrapolation of theX-ray spectrum into the EGRET range underpredicts the ob-served flux by a factor of �20 at 2 GeV. (The discrepancy is ofcourse much larger if we take the PL component of the BB+PLfit.) Interestingly, the extrapolation of the PL that crudelyconnects the optical and X-ray points (�OX � 1:3) predicts ap-proximately correct �-ray fluxes at�0.5 GeV, but the differencein the slopes is a factor of 2.5 larger than the 1 � error of ��.Thus, unless there is a significant systematic error in theEGRET data analysis,13 we have to conclude that there should
be a double break in the spectrum between the EPIC andEGRET bands, which likely means that the �-ray emission isgenerated by a different mechanism (e.g., curvature radiation),or by a different population of relativistic particles, than theoptical and X-ray emission. The CGRO COMPTEL and OSSEobservations were not sensitive enough to prove or reject the ex-istence of such a break (Kuiper et al. 1996; Strickman et al. 1996).In the above discussion on the connection between the NIR-
optical and hard X-ray phase-integrated spectra, it was assumedthat each of them could be adequately described by a PL model.In fact, it is quite plausible that the nonthermal high-energyradiation of pulsars is composed of several components that arepeaked in different directions (phases) and have differentspectral slopes, as it has been recently observed in the hardX-ray emission of the Vela pulsar (Harding et al. 2002) and isroutinely seen in the �-ray range (e.g., Fierro et al. 1998). In thiscase one should expect the phase-integrated spectrum to have aconcave shape (in a log-log scale), with excesses at low andhigh energies dominated by the softer and harder components,respectively. Some indications of such a concave spectrum areseen in Geminga’s nonthermal X-ray component: while fittingthe high-energy tail of Geminga’s EPIC pn spectrum with asingle PL and different low-energy cutoffs (Emin), we noticedthat the best-fit � increases with decreasing Emin (e.g., � ¼1:45 � 0:30, 1:56 � 0:24, and 1:60 � 0:20 at Emin ¼ 3:0, 2.5,and 2.0 keV, respectively). Although the change of � is notstatistically significant, such a trend suggests that the tail isconcave rather than flat, which, in turn, hints that there may beseveral emission components (unless the high-energy tail of thethermal component is harder than in the thermal models weused). Unfortunately, the S/N at Ek 2 keV is too low to verifythis directly with phase-resolved spectroscopy.It is also interesting to compare the nonthermal pulsations in
different energy bands. The �-ray light curve (Fig. 12, bottompanel ) shows two peaks per period, at ’ 0:55 (peak 1) and ’ 1:05 (peak 2), with a bridge between them. In the X-ray 2–8 keV band, we also see two peaks, but they are broader, theirseparation (� � 0:35 or 0.65) differs significantly from the� ’ 0:5 in �-rays, and about 60%–70% of the 2–8 keVemission is unpulsed, in contrast to about 100% pulsed �-rayemission. We cannot determine from these data alone what isthe correspondence (if any) between the X-ray and �-ray peaks(e.g., the higher X-ray peak could correspond to either peak 2 orpeak 1, which would mean that it trails the corresponding �-raypeak by � � 0:55 or 0.05, respectively). It is tempting toidentify the stronger X-ray emission at phases �0.1–0.5 as abridge similar to that in the �-ray light curve (which wouldmean that the higher X-ray peak corresponds to peak 2), but thelow S/N at these phases makes this identification rather un-certain. Moreover, since no statistically significant change ofthe peak phases with energy is seen in the 0.03–3 GeV EGRETrange, it is quite possible that the 2–8 keV X-ray peaks donot directly correspond to the �-ray peaks, being produced bya distinct mechanism. Observations at intermediate energies,10 keV to 10 MeV, are needed to clarify this issue.
As we mentioned above, the highly asymmetric pulse profileat intermediate X-ray energies 0.6–1 keV can possibly bedecomposed into two components: a broad, likely thermal, com-ponent centered at � 0:75, similar to that seen in the 0.2–0.5 keV band, and a narrower nonthermal peak around the phase � 0:6 of the higher of two 2–8 keV peaks. However, theputative nonthermal peak at 0.6–1 keV looks significantlybroader than the corresponding peak at 2–8 keV, while thelower 2–8 keV peak is hardly seen in the 0.6–1 keV band. The
Fig. 14.—Multiwavelength phase-integrated spectrum of Geminga. TheEGRET, COMPTEL, and OSSE points are from Mayer-Hasselwander et al.(1994), Kuiper et al. (1996), and Strickman et al. (1996), respectively. Fits withthe PL model for three spectral bands (with �1 � uncertainties) and their ex-trapolations are shown.
13 We should note in this respect that Grenier et al. (1993) reported a sub-stantially softer spectrum from the COS B observations of Geminga: �� ¼1:84 � 0:05 in the 0.05–5 GeV range, or 2:02 � 0:07 in the 0.14–5 GeV range,with an indication of a spectral turnover below�0.2 GeV.With such a soft �-rayspectrum, a double spectral break in between the EPIC and EGRET bands iscertainly required. On the other hand, Fierro et al. (1998) found a somewhatharder spectrum from theEGRETdata:�� ¼ 1:42 � 0:02 in the 0.03–2Gev range.Given the large uncertainties in�X (including systematic ones; see the discussionin the next paragraph), the necessity of the double break becomes less certain.
KARGALTSEV ET AL.320 Vol. 625
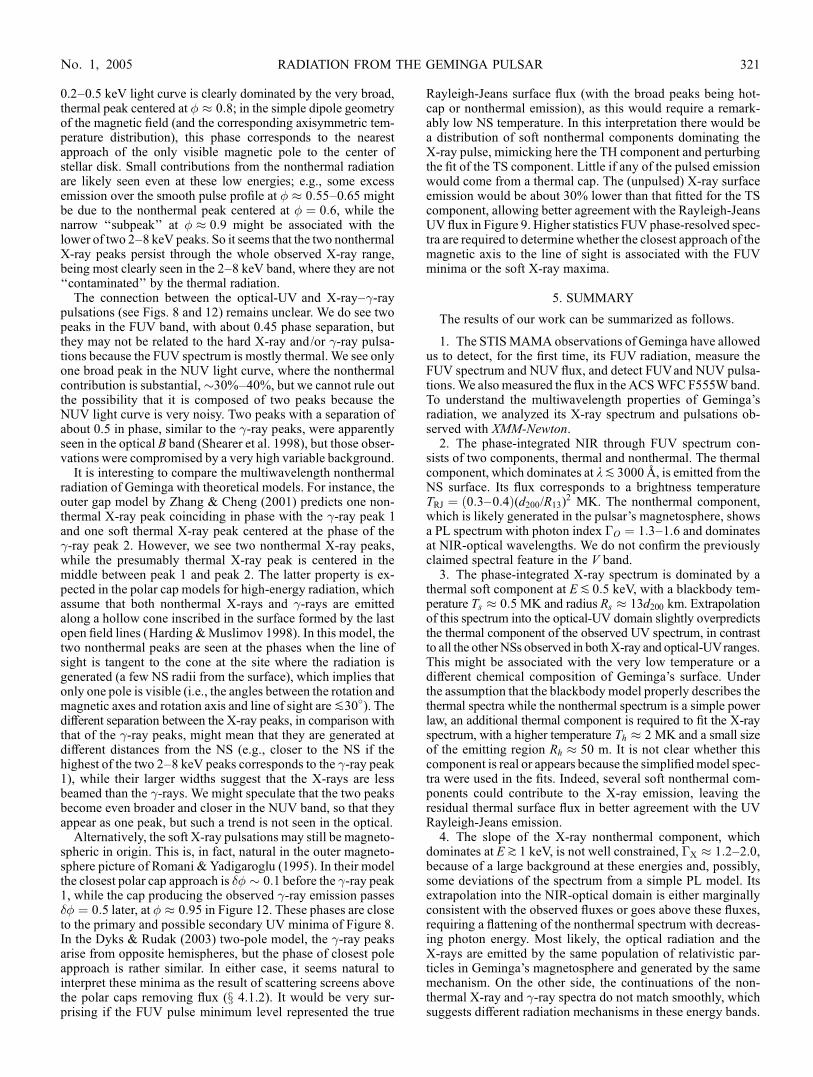
0.2–0.5 keV light curve is clearly dominated by the very broad,thermal peak centered at � 0:8; in the simple dipole geometryof the magnetic field (and the corresponding axisymmetric tem-perature distribution), this phase corresponds to the nearestapproach of the only visible magnetic pole to the center ofstellar disk. Small contributions from the nonthermal radiationare likely seen even at these low energies; e.g., some excessemission over the smooth pulse profile at � 0:55–0.65 mightbe due to the nonthermal peak centered at ¼ 0:6, while thenarrow ‘‘subpeak’’ at � 0:9 might be associated with thelower of two 2–8 keV peaks. So it seems that the two nonthermalX-ray peaks persist through the whole observed X-ray range,being most clearly seen in the 2–8 keV band, where they are not‘‘contaminated’’ by the thermal radiation.
The connection between the optical-UV and X-ray–�-raypulsations (see Figs. 8 and 12) remains unclear. We do see twopeaks in the FUV band, with about 0.45 phase separation, butthey may not be related to the hard X-ray and/or �-ray pulsa-tions because the FUV spectrum is mostly thermal. We see onlyone broad peak in the NUV light curve, where the nonthermalcontribution is substantial,�30%–40%, but we cannot rule outthe possibility that it is composed of two peaks because theNUV light curve is very noisy. Two peaks with a separation ofabout 0.5 in phase, similar to the �-ray peaks, were apparentlyseen in the optical B band (Shearer et al. 1998), but those obser-vations were compromised by a very high variable background.
It is interesting to compare the multiwavelength nonthermalradiation of Geminga with theoretical models. For instance, theouter gap model by Zhang & Cheng (2001) predicts one non-thermal X-ray peak coinciding in phase with the �-ray peak 1and one soft thermal X-ray peak centered at the phase of the�-ray peak 2. However, we see two nonthermal X-ray peaks,while the presumably thermal X-ray peak is centered in themiddle between peak 1 and peak 2. The latter property is ex-pected in the polar cap models for high-energy radiation, whichassume that both nonthermal X-rays and �-rays are emittedalong a hollow cone inscribed in the surface formed by the lastopen field lines (Harding &Muslimov 1998). In this model, thetwo nonthermal peaks are seen at the phases when the line ofsight is tangent to the cone at the site where the radiation isgenerated (a few NS radii from the surface), which implies thatonly one pole is visible (i.e., the angles between the rotation andmagnetic axes and rotation axis and line of sight areP30�). Thedifferent separation between the X-ray peaks, in comparison withthat of the �-ray peaks, might mean that they are generated atdifferent distances from the NS (e.g., closer to the NS if thehighest of the two 2–8 keV peaks corresponds to the �-ray peak1), while their larger widths suggest that the X-rays are lessbeamed than the �-rays. We might speculate that the two peaksbecome even broader and closer in the NUV band, so that theyappear as one peak, but such a trend is not seen in the optical.
Alternatively, the soft X-ray pulsations may still be magneto-spheric in origin. This is, in fact, natural in the outer magneto-sphere picture of Romani & Yadigaroglu (1995). In their modelthe closest polar cap approach is � � 0:1 before the �-ray peak1, while the cap producing the observed �-ray emission passes� ¼ 0:5 later, at � 0:95 in Figure 12. These phases are closeto the primary and possible secondary UV minima of Figure 8.In the Dyks & Rudak (2003) two-pole model, the �-ray peaksarise from opposite hemispheres, but the phase of closest poleapproach is rather similar. In either case, it seems natural tointerpret these minima as the result of scattering screens abovethe polar caps removing flux (x 4.1.2). It would be very sur-prising if the FUV pulse minimum level represented the true
Rayleigh-Jeans surface flux (with the broad peaks being hot-cap or nonthermal emission), as this would require a remark-ably low NS temperature. In this interpretation there would bea distribution of soft nonthermal components dominating theX-ray pulse, mimicking here the TH component and perturbingthe fit of the TS component. Little if any of the pulsed emissionwould come from a thermal cap. The (unpulsed) X-ray surfaceemission would be about 30% lower than that fitted for the TScomponent, allowing better agreement with the Rayleigh-JeansUV flux in Figure 9. Higher statistics FUV phase-resolved spec-tra are required to determine whether the closest approach of themagnetic axis to the line of sight is associated with the FUVminima or the soft X-ray maxima.
5. SUMMARY
The results of our work can be summarized as follows.
1. The STISMAMA observations of Geminga have allowedus to detect, for the first time, its FUV radiation, measure theFUV spectrum and NUV flux, and detect FUVand NUV pulsa-tions.We also measured the flux in the ACSWFC F555W band.To understand the multiwavelength properties of Geminga’sradiation, we analyzed its X-ray spectrum and pulsations ob-served with XMM-Newton.
2. The phase-integrated NIR through FUV spectrum con-sists of two components, thermal and nonthermal. The thermalcomponent, which dominates at kP30008, is emitted from theNS surface. Its flux corresponds to a brightness temperatureTRJ ¼ 0:3ð –0:4Þ(d200/R13)
2 MK. The nonthermal component,which is likely generated in the pulsar’s magnetosphere, showsa PL spectrum with photon index �O ¼ 1:3–1.6 and dominatesat NIR-optical wavelengths. We do not confirm the previouslyclaimed spectral feature in the V band.
3. The phase-integrated X-ray spectrum is dominated by athermal soft component at EP 0:5 keV, with a blackbody tem-perature Ts � 0:5 MK and radius Rs � 13d200 km. Extrapolationof this spectrum into the optical-UV domain slightly overpredictsthe thermal component of the observed UV spectrum, in contrastto all the other NSs observed in bothX-ray and optical-UVranges.This might be associated with the very low temperature or adifferent chemical composition of Geminga’s surface. Underthe assumption that the blackbody model properly describes thethermal spectra while the nonthermal spectrum is a simple powerlaw, an additional thermal component is required to fit the X-rayspectrum, with a higher temperature Th � 2 MK and a small sizeof the emitting region Rh � 50 m. It is not clear whether thiscomponent is real or appears because the simplifiedmodel spec-tra were used in the fits. Indeed, several soft nonthermal com-ponents could contribute to the X-ray emission, leaving theresidual thermal surface flux in better agreement with the UVRayleigh-Jeans emission.
4. The slope of the X-ray nonthermal component, whichdominates at Ek1 keV, is not well constrained, �X � 1:2–2.0,because of a large background at these energies and, possibly,some deviations of the spectrum from a simple PL model. Itsextrapolation into the NIR-optical domain is either marginallyconsistent with the observed fluxes or goes above these fluxes,requiring a flattening of the nonthermal spectrum with decreas-ing photon energy. Most likely, the optical radiation and theX-rays are emitted by the same population of relativistic par-ticles in Geminga’s magnetosphere and generated by the samemechanism. On the other side, the continuations of the non-thermal X-ray and �-ray spectra do not match smoothly, whichsuggests different radiation mechanisms in these energy bands.
RADIATION FROM THE GEMINGA PULSAR 321No. 1, 2005
5. Unexpectedly, we detected strong pulsations in the FUVband. The light curve of the predominantly thermal FUVradiation, with a narrow, deep minimum and possibly anotherminimum shifted by about half a period, differs significantlyfrom the light curve of the thermal soft X-ray radiation, whichshows one broad, smooth peak per period, possibly distorted bya small contribution from the magnetospheric component. Be-cause the FUV pulsations can hardly be explained by an an-isotropic temperature and/or magnetic field distributions, wesuggest that they could be associated with a resonance scat-tering of the thermal UV photons in the NS magnetosphere.
6. The light curve of the nonthermal X-ray emission showstwo peaks, as the �-ray light curve does, but the X-ray peaks aresubstantially broader, and their separation differs significantlyfrom the half-period separation of the �-ray peaks. At least oneof the nonthermal peaks is apparently seen at lower X-ray en-ergies, superimposed on the broader peak of thermal emission.We see no clear connection between the nonthermal X-raypulsations and single-peaked NUV pulsations. Two peaks havebeen apparently seen in the optical, but this very noisy lightcurve is badly in need of confirmation.
To conclude, the HST STIS MAMA observations have al-lowed us to study the UV spectrum and pulsations of Geminga.Combined with the results of the previous optical and �-ray ob-servations and our analysis of the XMM-Newton data, this studyhas provided a connection between different energy bands forthe thermal and magnetospheric components and elucidated themultiwavelength picture of Geminga’s radiation. However, someimportant properties of this radiation remain unclear. First, thetrue nature of the UV (particularly FUV) pulsations is still
uncertain. To understand it, phase-resolved spectroscopy ofthe FUV radiation would be particularly useful, which wouldrequire deeper FUV-MAMA observations, quite feasible withthe HST STIS if it is brought back to life in a future servicingmission. Second, it remains unclear whether we indeed see asmall, high-temperature polar cap or whether this is an artifactcaused by the use of simplified spectral models. To answer thisquestion we need realistic models for thermal and nonthermalX-ray radiation and phase-resolved spectroscopy at Ek0:5 keVwith high S/N. Third, we do not understand the connectionbetween the nonthermal X-ray emission and �-ray emission.This problem could be resolved by observations in a 10 keV to10 MeV band with a future mission equipped with detectorsmore sensitive in this energy range than the detectors of theRXTE and INTEGRALmissions. NUSTAR, for example, shouldbe able to offer sensitive measurements in the hard X-ray range.
We thank Rosa Diaz-Miller for the help with the STIS dataanalysis, Divas Sanwal for useful discussions, Hans-AlbertMayer-Hasselwander for providing the �-ray data, and IgorVolkov for the help with timing analysis. The work of V. E. Z.is supported by a National Research Council Research Asso-ciateship Award at NASA MSFC. Support for programs GO-9182 and GO-9756 was provided by NASA through a grantfrom the Space Telescope Science Institute, which is operatedby the Association of Universities for Research in Astronomy,Inc., under NASA contract NAS5-26555. This work was alsopartly supported by NASA grants NAG5-10865, NAG5-13344,and NNG 04GI80G.
REFERENCES
Bertch, D. L., et al. 1992, Nature, 357, 306Bignami, G. F., Caraveo, P. A., & Lamb, R. C. 1983, ApJ, 272, L9Bignami, G. F., Caraveo, P. A., Mignani, R., Edelstein J., & Bowyer, S. 1996,ApJ, 456, L111
Bignami, G. F., Caraveo, P. A., & Paul, J. A. 1988, A&A, 202, L1Bignami, G. F., Caraveo, P. A., Paul, J. A., Salotti, L., & Vigroux, L. 1987,ApJ, 319, 358
Blandford, R. D., & Scharlemann, E. T. 1976, MNRAS, 174, 59Bohlin, R. 1999, Ultraviolet Imaging Telescope Research Activities (Baltimore:STScI)
Brown, T., et al. 2002, in HST STIS Data Handbook, ver. 4.0, ed. B. Mobashner(Baltimore: STScI), http://www.stsci.edu/hst /stis /documents/handbooks/currentDHB/STIS_longdhbTOC.html
Buccheri, R., et al. 1983, A&A, 128, 245Burwitz, V., Haberl, F., Neuhauser, R., Predehl, P., Trumper, J., & Zavlin, V. E.2003, A&A, 399, 1109
Caraveo, P. A., Bignami, G. F., De Luca, A., Mereghetti, S., Pellizzoni, A.,Mignani, R., Tur, A., & Becker, W. 2003, Science, 301, 1345
Caraveo, P. A., Bignami, G. F., De Luca, A., Pellizzoni, A., Mereghetti, S.,Mignani, R. P., Tur, A., & Becker, W. 2004a, Mem. Soc. Astron. Italiana, 75,470
Caraveo, P. A., Bignami, G. F., Mignani, R., & Taff, L. G. 1996, ApJ, 461, L91Caraveo, P. A., De Luca, A., Mereghetti, S., Pellizzoni, A., & Bignami, G. F.2004b, Science, 305, 376
Dyks, J., & Rudak, B. 2003, ApJ, 598, 1201Fierro, J. M., Michelson, P. F., & Nolan, P. L. 1998, ApJ, 494, 734Gregory, P. C., & Loredo, T. J. 1996, ApJ, 473, 1059Grenier, I. A., Hermsen, W., & Henriksen, R. N. 1993, A&A, 269, 209Halpern, J. P., Grindlay, J. E., & Tytler, D. 1985, ApJ, 296, 190Halpern, J. P., & Holt, S. S. 1992, Nature, 357, 222Halpern, J. P., Martin, C., & Marshall, H. L. 1996, ApJ, 473, 37LHalpern, J. P., & Ruderman, M. 1993, ApJ, 415, 286Halpern, J. P., & Tytler, D. 1988, ApJ, 330, 201Halpern, J. P., & Wang, F. Y.-H. 1997, ApJ, 477, 905Harding, A. K., & Muslimov, A. G. 1998, ApJ, 500, 862Harding, A. K., Strickman, M. S., Gwinn, C., Dodson, R., Moffet, D., &McCulloch, P. 2002, ApJ, 576, 366
Harlow, J. J. B., Pavlov, G. G., & Halpern, J. P. 1998, BAAS, 30, 1309
Jackson, M. S., Halpern, J. P., Gotthelf, E. V., & Mattox, J. R. 2002, ApJ, 578,935 (J02)
Kargaltsev, O., Pavlov, G. G., & Romani, R. W. 2004, ApJ, 602, 327Kaspi, V. M., Roberts, M. S. E., & Harding, A. K. 2006, in Compact StellarX-Ray Sources, ed. W. H. G. Lewin &M. van der Klis (Cambridge: CambridgeUniv. Press), in press (astro-ph/0402136)
KimQuijano, J., et al. 2003, STIS InstrumentHandbook, ver. 7.0 (Baltimore: STScI),http://www.stsci.edu / hst /stis/documents/ handbooks/currentIHB/stis _
ihbTOC.htmlKomarova, V., et al. 2003, in Pulsars, AXPs, and SGRs Observed withBeppoSAX and Other Observatories, ed. G. Cusumano, E. Massaro, &T. Mineo (Rome: Aracne Editrice), 77
Koptsevich, A. B., Pavlov, G. G., Zharikov, S. V., Sokolov, V. V., Shibanov, Yu.A., & Kurt, V. G. 2001, A&A, 370, 1004
Kuiper, L., Hermsen, W., Bennett, K., Connors, A., Much, R., Ryan, J.,Schonfelder, V., & Strong, A. 1996, A&AS, 120, 73
Kuz’min, A. D., & Losovskii, B. Ya. 1997, Astron. Lett., 23, 283Lai, D., & Ho, W. C. G. 2003, ApJ, 588, 962Landsman, W. 1998, Characteristics of the FUV-MAMADark Rate (Baltimore:STScI)
Lyubarskii, Y. E., & Petrova, S. A. 1998, A&A, 337, 433———. 2000, A&A, 355, 406Malofeev, V. M., & Malov, O. I. 1997, Nature, 389, 697Martin, C., Halpern, J. P., & Schiminovich, D. 1998, ApJ, 494, L211Mayer-Hasselwander, H.-A., et al. 1994, ApJ, 421, 276McLaughlin, M. A., Cordes, J. M., Hankins, T. H., & Moffett, D. A. 1999, ApJ,512, 929
Meyer, R. D., Pavlov, G. G., & Meszaros, P. 1994, ApJ, 433, 265Mignani, R. P., Caraveo, P. A., & Bignami, G. F. 1998, A&A, 332, L37Mitrofanov, I. G., & Pavlov, G. G. 1982, MNRAS, 200, 1033Pavlov, G.G., Shibanov, Yu. A., Ventura, J., &Zavlin, V. E. 1994,A&A, 289, 837Pavlov, G. G., Shibanov, Yu. A., Zavlin, V. E., & Meyer, R. D. 1995, in TheLives of the Neutron Stars, ed. M. A. Alpar, U. Kizilolu, & J. van Paradijs(NATO ASI Ser. C, 450; Dordrecht: Kluwer), 71
Pavlov, G. G., & Zavlin, V. E. 2000, ApJ, 529, 1011———. 2003, in Proc. XXI Texas Symposium on Relativistic Astrophysics, ed.R. Bandiera, R. Maiolino, & F. F. Manucci (Singapore: World Scientific),319
KARGALTSEV ET AL.322 Vol. 625
Pavlov, G. G., Zavlin, V. E., & Sanwal, D. 2002, in Proc. 270 Heraeus Seminaron Neutron Stars, Pulsars, and Supernova Remnants, ed. W. Becker,H. Lesch, & J. Trumper (MPE Rep. 278; Garching: MPE), 273
Pavlov, G. G., Zavlin, V. E., Trumper, J., & Neuhauser R. 1996, ApJ, 472, L33Perez-Azorın, J. F., Miralles, J. A., & Pons, J. A. 2005, A&A, 433, 275Pons, J. A., Walter, F. M., Lattimer, J. M., Prakash, M., Neuhauser, R., & An, P.2002, ApJ, 564, 981
Proffitt, C. R., Brown, T. M., Mobasher, B., & Davies J. 2003, Absolute FluxCalibration of STIS MAMA Imaging Modes (Baltimore: STScI)
Rajagopal, M., & Romani, R. W. 1997, ApJ, 491, 296Rajagopal, M., Romani, R. W., & Miller, M. C. 1997, ApJ, 479, 347Romani, R. W. 1987, ApJ, 313, 718Romani, R. W., Kargaltsev, O. Y., & Pavlov, G. G. 2005, ApJ, in pressRomani, R. W., & Yadigaroglu, I.-A. 1995, ApJ, 438, 314Ruderman, M. 2003, preprint (astro-ph/0310777)Seaton, M. J. 1979, MNRAS, 187, 73PSerafimovich, N. I., Shibanov, Yu. A., Lundqvist, P., & Sollerman, J. 2004,A&A, 425, 1041
Shearer, A., et al. 1998, A&A, 335, L21Shitov, Yu. P., & Pugachev, V. D. 1998, NewA, 3, 101
Sollerman, J., Lundqvist, P., Lindler, D., Chevalier, R. A., Fransson, C., Gull, T. R.,Pun, C. S. J., & Sonneborn, G. 2000, ApJ, 537, 861
Strickman, M. S., et al. 1996, ApJ, 460, 735Thompson, D. J., Fichtel, C. E., Hartman, R. C., Kniffen, D. A., & Lamb, R. C.1977, ApJ, 213, 252
Trumper, J., Burwitz, V., Haberl, F., & Zavlin, V. E. 2004, Nucl. Phys. B Proc.Suppl., 132, 560
Turbiner, A. V., & Lopez Vieyra, J. C. 2004, Mod. Phys. Lett. A, 19, 1919Van Adelsberg, M., Lai, D., & Potekhin, A. Y. 2004, ApJ, submitted (astro-ph/0406001)
Wang, F. Y.-H., Ruderman, M., Halpern, J. P., & Zhu, T. 1998, ApJ, 498, 373Yakovlev D. G., & Pethick C. J. 2004, ARA&A, 42, 169Zavlin, V. E., & Pavlov, G. G. 2002, in Proc. 270 Heraeus Seminar on NeutronStars, Pulsars, and Supernova Remnants, ed. W. Becker, H. Lesch, &J. Trumper (MPE Rep. 278; Garching: MPE), 263
———. 2004a, ApJ, 616, 452———. 2004b, Mem. Soc. Astron. Italiana, 75, 458Zavlin, V. E., Pavlov, G. G., & Sanwal, D. 2004, ApJ, 606, 444Zhang, L., & Cheng, K. S. 2001, MNRAS, 320, 477
RADIATION FROM THE GEMINGA PULSAR 323No. 1, 2005