ultratech cement ltd. · 2018-02-12 · ultratech cement ltd. q3fy18 result snapshot key takeaways...
TRANSCRIPT

Ultratech Cement Ltd.
RESULT UPDATE 19th January, 2018

2Page
Result highlights:
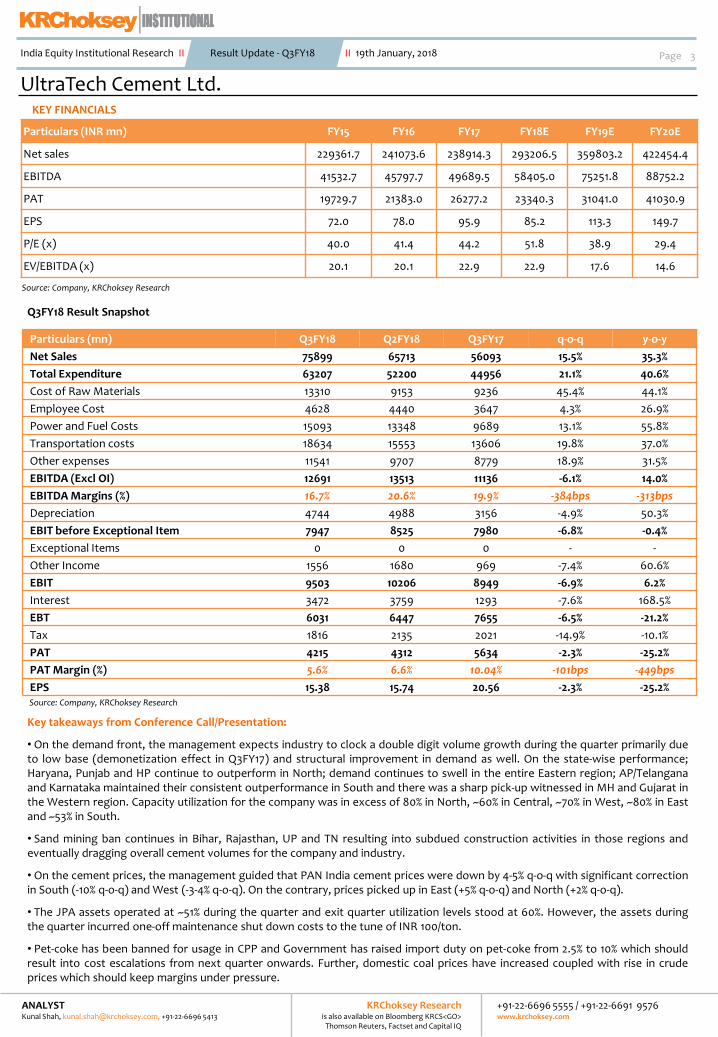
•Net sales stood at INR 75899 mn as against our estimate of INR 73700 mn; which was up by 35.3% y-o-y and 15.5% q-o-q. Volumegrowth stood at 37.3% y-o-y with cement volumes scaling to 15.1 MT (est. 14.96 MT) as against 11 MT in Q3FY17.
•EBIDTA stood at INR 12691 mn which was up by 14% y-o-y and down 6.1% q-o-q while EBIDTA margin stood at 16.7% (est. of 19.7%) asagainst 19.9% same quarter last year. Higher than anticipated raw material costs resulted in lower than expected EBITDA margins.Further, the company incurred maintenance costs at JPA units resulting into incremental other expenses to the tune of INR 100/ton.Adj.PAT stood at INR 4215 mn which was down by 25.2% y-o-y and 2.3% q-o-q. Likewise, PAT margins stood at 5.6%; down by 449 bps y-o-y (higher depreciation and interest costs post JPA acquisition) and 101 bps q-o-q.
UltraTech Cement Ltd. Softer realizations; higher input costs result into lower margins!
CMP
INR 4409Target
INR 4870Potential Upside
10.5%Market Cap (INR mn)
1,210,431Recommendation
ACCUMULATESector
Cement
SHARE PRICE PERFORMANCE
Shares outs (mn) 274
EquityCap (INR mn) 2746
Mkt Cap (INR mn) 1210431
52 Wk H/L (INR) 4594/3377
Volume Avg (3m K) 226
Face Value (INR) 10
Bloomberg Code UTCEM IN
MARKET DATA
SENSEX 35260
NIFTY 10817
MARKET INFO
Volumes in-line with estimates:Ultratech Cement Ltd (UTCEM) during the quarter delivered a volume growth of 37.3% y-o-ywhile the ex-JPA volume growth stood at 15.12% y-o-y (low base due to demonetizationeffect in Q3FY17). However, we believe that the organic volumes for UTCEM hasoutperformed as against the expected industry volume growth of ~9.8% y-o-y during thequarter. Further, the company and industry continue to face significant slow-down involume off-take in few regions of UP, Bihar, Rajasthan and TN due to non-availability ofsand. The management guided that JPA assets have operated at 51% utilization level duringthe quarter and Q3 exit utilization levels stood at 60%.
Going ahead; we believe that the company should deliver a strong volume growth of 16.79%over FY17-FY20E from 50.19 MT to 79.9 MT outperforming the capacity addition growth of11.57% during the same period.
Operating efficiencies to remain under pressure:UTCEM posted EBITDA margins of 16.7% for the quarter; down by 313 bps y-o-y owing tosofter realizations and higher input costs. Total cost of production/ton rose by 5.2% y-o-ywhile NPR stood flattish y-o-y. The company operated at EBITDA/ton of INR 801 (est. of INR980) as against INR 950 in Q3FY17 and INR 1028 in Q2FY18. Higher raw material costs andone-off maintenance expenses at JPA units led to cost escalation for the company. Further,we reckon that the industry as a whole faces significant headwinds with respect to fuelcosts due to the latest import duty hike on pet-coke from 2.5% to 10% and surge in domesticcoal prices. Consequently, we expect operating efficiencies to remain under pressure.
We believe that ramp-up in JPA assets and increasing NPR of JPA assets to UTCEMstandards will prove beneficial for the company and set-off rise in input costs to a certainextent. Consequently, we expect EBITDA/ton for the company to increase from INR 990 toINR 1110 over FY17-FY20E.
Valuation and Outlook:Company during the quarter reduced net debt to the tune of INR 6290 mn as compared toQ2FY18. We expect that the company on an average will allocate 30% of its EBITDA towardsdebt reduction and we estimate net debt should reduce to INR 86857 mn by FY20E fromcurrent levels of INR 151610 mn. Further, we believe that the company will continue to tradeat premium valuations primarily due to significant PAN India market share(~20% postacquisition) and healthy operating efficiencies. Rolling on our estimates; we value thecompany at 16x EV/EBITDA on FY20E resulting into a target price of INR 4870, which is anupside of 10.5% from CMP of INR 4409. We maintain our ACCUMULATE rating on the stock.
Particulars Dec 17 Sep 17 Jun 17
Promoters 62.05 62.13 62.14
FIIs 22.2 22.15 21.89
DIIs 5.67 5.55 5.53
Others 10.08 10.18 10.45
Total 100 100 100
SHARE HOLDING PATTERN (%)
Volume CAGR between FY 17 and FY 20E
16.8%EBITDA CAGR between FY 17
and FY 20E
21.3%
India Equity Institutional Research II Result Update - Q3FY18 II 19th January, 2018
80
120
160
Jan
-15
Jul-1
5
Jan
-16
Jul-1
6
Jan
-17
Jul-1
7
Jan
-18
Ultra Tech Cement Sensex
+91-22-6696 5555 / +91-22-6691 9576www.krchoksey.com
KRChoksey Researchis also available on Bloomberg KRCS<GO>
Thomson Reuters, Factset and Capital IQ
ANALYSTKunal Shah, [email protected], +91-22-6696 5413
UltraTech Cement Ltd.
Q3FY18 Result Snapshot
Key takeaways from Conference Call/Presentation:
• On the demand front, the management expects industry to clock a double digit volume growth during the quarter primarily dueto low base (demonetization effect in Q3FY17) and structural improvement in demand as well. On the state-wise performance;Haryana, Punjab and HP continue to outperform in North; demand continues to swell in the entire Eastern region; AP/Telanganaand Karnataka maintained their consistent outperformance in South and there was a sharp pick-up witnessed in MH and Gujarat inthe Western region. Capacity utilization for the company was in excess of 80% in North, ~60% in Central, ~70% in West, ~80% in Eastand ~53% in South.
• Sand mining ban continues in Bihar, Rajasthan, UP and TN resulting into subdued construction activities in those regions andeventually dragging overall cement volumes for the company and industry.
• On the cement prices, the management guided that PAN India cement prices were down by 4-5% q-o-q with significant correctionin South (-10% q-o-q) and West (-3-4% q-o-q). On the contrary, prices picked up in East (+5% q-o-q) and North (+2% q-o-q).
• The JPA assets operated at ~51% during the quarter and exit quarter utilization levels stood at 60%. However, the assets duringthe quarter incurred one-off maintenance shut down costs to the tune of INR 100/ton.
• Pet-coke has been banned for usage in CPP and Government has raised import duty on pet-coke from 2.5% to 10% which shouldresult into cost escalations from next quarter onwards. Further, domestic coal prices have increased coupled with rise in crudeprices which should keep margins under pressure.
Particulars (mn) Q3FY18 Q2FY18 Q3FY17 q-o-q y-o-y
Net Sales 75899 65713 56093 15.5% 35.3%
Total Expenditure 63207 52200 44956 21.1% 40.6%
Cost of Raw Materials 13310 9153 9236 45.4% 44.1%
Employee Cost 4628 4440 3647 4.3% 26.9%
Power and Fuel Costs 15093 13348 9689 13.1% 55.8%
Transportation costs 18634 15553 13606 19.8% 37.0%
Other expenses 11541 9707 8779 18.9% 31.5%
EBITDA (Excl OI) 12691 13513 11136 -6.1% 14.0%
EBITDA Margins (%) 16.7% 20.6% 19.9% -384bps -313bps
Depreciation 4744 4988 3156 -4.9% 50.3%
EBIT before Exceptional Item 7947 8525 7980 -6.8% -0.4%
Exceptional Items 0 0 0 - -
Other Income 1556 1680 969 -7.4% 60.6%
EBIT 9503 10206 8949 -6.9% 6.2%
Interest 3472 3759 1293 -7.6% 168.5%
EBT 6031 6447 7655 -6.5% -21.2%
Tax 1816 2135 2021 -14.9% -10.1%
PAT 4215 4312 5634 -2.3% -25.2%
PAT Margin (%) 5.6% 6.6% 10.04% -101bps -449bps
EPS 15.38 15.74 20.56 -2.3% -25.2%
3Page
Source: Company, KRChoksey Research
India Equity Institutional Research II Result Update - Q3FY18 II 19th January, 2018
Particulars (INR mn) FY15 FY16 FY17 FY18E FY19E FY20E
Net sales 229361.7 241073.6 238914.3 293206.5 359803.2 422454.4
EBITDA 41532.7 45797.7 49689.5 58405.0 75251.8 88752.2
PAT 19729.7 21383.0 26277.2 23340.3 31041.0 41030.9
EPS 72.0 78.0 95.9 85.2 113.3 149.7
P/E (x) 40.0 41.4 44.2 51.8 38.9 29.4
EV/EBITDA (x) 20.1 20.1 22.9 22.9 17.6 14.6
Source: Company, KRChoksey Research
KEY FINANCIALS
+91-22-6696 5555 / +91-22-6691 9576www.krchoksey.com
KRChoksey Researchis also available on Bloomberg KRCS<GO>
Thomson Reuters, Factset and Capital IQ
ANALYSTKunal Shah, [email protected], +91-22-6696 5413

UltraTech Cement Ltd.Key takeaways from Conference Call/Presentation:
• Company repaid debt to the tune of INR 6290 mn as compared to the last quarter and the company plans to continue itsprogressive debt reduction going ahead.
• The company expects additional capacity of ~35 MT taking total industry capacity to ~440 MT by end of March-2019.However, the management believes that demand should outperform the incremental effective capacity in the industry.
• On the future outlook, management remains bullish on the demand front and believes that humongous inflow of funds in theinfrastructure sector should boost demand for cement. Among the marquee projects, Mumbai metro, Ahmedabad-Mumbai bullettrain project, affordable housing projects, development of Amarawati city and irrigation projects should be the key growth drivers.
4PageIndia Equity Institutional Research II Result Update - Q3FY18 II 19th January, 2018
Operating metrics (in INR) Q3FY18 Q3FY17 % change y-o-y Q2FY18 % change q-o-q
Realization/ton 4788.6 4781.8 0.1% 5001.0 -4.25%
COGS cost/ton 839.8 787.3 6.7% 696.6 20.56%
Employee cost/ton 292.0 310.9 -6.1% 337.9 -13.58%
Power and fuel cost/ton 952.3 826.0 15.3% 1015.8 -6.26%
Transportation and Handling cost/ton 1175.6 1159.9 1.4% 1183.6 -0.68%
Other Expenses/ton 728.2 748.4 -2.7% 738.7 -1.43%
EBITDA/ton 800.7 949.2 -15.6% 1028.3 -22.13%
Particulars (in INR mn)FY18E FY19E FY20E
Revised Old % change Revised Old % change Revised
Volumes (MT) 58.72 63.8 -7.96% 70.07 72.2 -2.95% 79.96
Net sales 293206.5 312299.3 -6.11% 359803.2 366035.4 -1.70% 422454.4
EBITDA 58405.0 64427.35 -9.35% 75251.8 85505.87 -11.99% 88752.2
EBITDA margins (%) 19.92% 20.63% -71.06 bps 20.91% 23.36% -244.53 bps 21.01%
PAT 23340.3 23647.01 -1.30% 31041.0 38813.38 -20.03% 41030.9
PAT margins (%) 7.96% 7.57% 38.84 bps 8.63% 10.60% -197.65 bps 9.71%
EBITDA/ton (in INR) 994.61 949.35 4.77% 1073.93 1184.37 -9.32% 1109.97
Change in estimates:
+91-22-6696 5555 / +91-22-6691 9576www.krchoksey.com
KRChoksey Researchis also available on Bloomberg KRCS<GO>
Thomson Reuters, Factset and Capital IQ
ANALYSTKunal Shah, [email protected], +91-22-6696 5413
Source: Company, KRChoksey Research
Source: Company, KRChoksey Research

UltraTech Cement Ltd.Financialss
Balance Sheet (INR mn) FY15 FY16 FY17 FY18E FY19E FY20E
Equity Share Capital 2744.0 2744.3 2745.1 2745.1 2745.1 2745.1
Reserves 185832.8 204616.6 236665.0 257204.4 284520.5 320627.7
Net worth 188576.8 207360.9 239410.1 259949.5 287265.6 323372.8
Total loans 74141.0 76607.0 52471.2 194471.2 174471.2 144471.2
Capital Employed 283262 289821 322385 485406 493380 500082
Net block 230211.5 239482.7 241101.5 408382.6 417767.3 426101.9
Current Investments 25229.8 20276.1 54059.5 54059.5 54059.5 54059.5
Inventories 27514.1 24260.9 22249.9 25258.2 30441.7 35084.8
Sundry debtors 12031.9 14148.9 12761.7 14459.5 17743.7 20833.4
Sundry creditors 27389.7 16135.7 17138.0 20206.6 24353.4 28067.8
Cash and bank 2139.4 22352.0 22177.4 12760.8 2740.1 3554.9
Total Current assets 79124.2 91910.0 124750.5 120266.6 119046.6 127907.3
Total Current liabilities 87868.1 112090.3 80584.0 80360.4 80551.1 91044.3
Capital Deployed 283262 289821 322385 485406 493380 500082
5Page
Profit & Loss (INR mn) FY15 FY16 FY17 FY18E FY19E FY20E
Net Sales 229361.7 241073.6 238914.3 293206.5 359803.2 422454.4
COGS 35600.8 39810.8 40245.1 46096.3 55556.2 64029.8
Employee Expenses 12182.9 13415.2 14134.4 18374.7 20212.2 24254.6
Power and fuel 47428.9 42408.1 39265.5 56462.9 75461.6 94721.1
Transportation cost 54003.8 59349.0 58452.2 70113.4 85338.7 99328.6
Other Expenses 38612.6 40292.8 37127.6 43754.2 47982.7 51368.2
EBITDA 41532.7 45797.7 49689.5 58405.0 75251.8 88752.2
D&A 11331.1 12890.3 12678.7 17608.9 20615.4 21665.4
Other income 3717.8 2351.6 6599.5 6000.0 6000.0 6000.0
EBIT 33919.4 35259.0 43610.3 46796.2 60636.4 73086.8
Interest Expense 5474.5 5052.9 5713.9 11960.0 14306.6 11846.6
PBT 28444.9 30206.1 37896.4 34836.2 46329.8 61240.2
Tax 8715.2 8823.1 11482.3 11495.9 15288.8 20209.3
Effective tax rate 30.64% 29.21% 30.30% 33.00% 33.00% 33.00%
PAT 19729.7 21383.0 26277.2 23340.3 31041.0 41030.9
Cash Flow (INR mn) FY15 FY16 FY17 FY18E FY19E FY20E
PAT 19729.7 21383.0 26277.2 23340.3 31041.0 41030.9
Depreciation & Amortization 11331.1 12890.3 12678.7 17608.9 20615.4 21665.4
(Incr)/Decr in Working Capital 90.7 5195.3 4878.3 -4674.9 -7952.2 3042.2
Cash Flow from Operating 40829.3 43306.1 47212.5 48234.2 58010.8 77585.1
(Incr)/ Decr in Gross PP&E -25799.3 -20533.8 -12593.2 -184890.0 -30000.0 -30000.0
Cash Flow from Investing -18797.4 -17323.3 -23635.0 -184890.0 -30000.0 -30000.0
(Decr)/Incr in Debt 10082.5 7069.1 -15337.2 142000.0 -20000.0 -30000.0
Dividend -2460.0 -2461.8 -3084.8 -2800.8 -3724.9 -4923.7
Finance costs -5494.8 -5388.0 -5470.4 -11960.0 -14306.6 -11846.6
Cash Flow from Financing -22667.5 -5822.2 -23826.4 127239.2 -38031.6 -46770.3
Incr/(Decr) in Balance Sheet Cash -635.6 20160.6 -248.9 -9416.6 -10020.7 814.8
Cash at the Start of the Year 2775.0 2166.9 22426.3 22177.4 12760.8 2740.1
Cash at the End of the Year 2139.4 22327.5 22177.4 12760.8 2740.1 3554.9
Source: Company, KRChoksey Research
Source: Company, KRChoksey Research
Source: Company, KRChoksey Research
India Equity Institutional Research II Result Update - Q3FY18 II 19th January, 2018
+91-22-6696 5555 / +91-22-6691 9576www.krchoksey.com
KRChoksey Researchis also available on Bloomberg KRCS<GO>
Thomson Reuters, Factset and Capital IQ
ANALYSTKunal Shah, [email protected], +91-22-6696 5413

UltraTech Cement Ltd.
6Page
Source: Company, KRChoksey Research
Ratio Analysis FY15 FY16 FY17 FY18E FY19E FY20E
EBITDA/ton 887.64 914.49 990.03 994.61 1073.93 1109.97
Volume (mn tons) 46.79 50.08 50.19 58.72 70.07 79.96
Growth (%)
Total Sales 13.12% 5.11% -0.90% 22.72% 22.71% 17.41%
EBITDA 9.81% 10.27% 8.50% 17.54% 28.84% 17.94%
PAT -6.45% 8.38% 22.89% -11.18% 32.99% 32.18%
Profitability (%)
EBITDA Margin 18.11% 19.00% 20.80% 19.92% 20.91% 21.01%
NPM 8.60% 8.87% 11.00% 7.96% 8.63% 9.71%
Return ratios
ROE 10.46% 10.31% 10.98% 8.98% 10.81% 12.69%
ROCE 11.97% 12.17% 13.53% 9.64% 12.29% 14.61%
Per share data
EPS 72.01 78.04 95.90 85.18 113.29 149.75
BPS 688.24 756.79 873.76 948.72 1048.41 1180.19
Valuations (x)
P/E (x) 40.03 41.44 44.19 51.76 38.92 29.44
P/BV (x) 4.19 4.27 4.85 4.65 4.21 3.74
EV/EBITDA (x) 20.14 20.09 22.89 22.87 17.62 14.59
EV/Ton ($) 202.58 210.29 254.91 234.54 232.79 208.94
Net Debt/EBITDA 1.13 0.74 -0.48 2.19 1.56 0.98
Net Debt/Equity 0.25 0.16 -0.10 0.49 0.41 0.27
Interest Coverage 6.20 6.98 7.63 3.91 4.24 6.17
India Equity Institutional Research II Result Update - Q3FY18 II 19th January, 2018
Particulars (in INR) FY15 FY16 FY17 FY18E FY19E FY20E
Realization/ton 4901.9 4813.8 4760.2 4993.2 5134.8 5283.4
COGS cost/ton 760.9 794.9 801.9 785.0 792.9 800.8
Employee cost/ton 260.4 267.9 281.6 312.9 288.5 303.3
Power and fuel cost/ton 1013.7 846.8 782.3 961.5 1076.9 1184.6
Transportation and Handling cost/ton 1154.2 1185.1 1164.6 1194.0 1217.9 1242.2
Other Expenses/ton 825.2 804.6 739.7 745.1 684.8 642.4
EBITDA/ton 887.6 914.5 990.0 994.6 1073.9 1110.0
Source: Company, KRChoksey Research
Operating metrics
+91-22-6696 5555 / +91-22-6691 9576www.krchoksey.com
KRChoksey Researchis also available on Bloomberg KRCS<GO>
Thomson Reuters, Factset and Capital IQ
ANALYSTKunal Shah, [email protected], +91-22-6696 5413
UltraTech Cement Ltd. Rating Legend
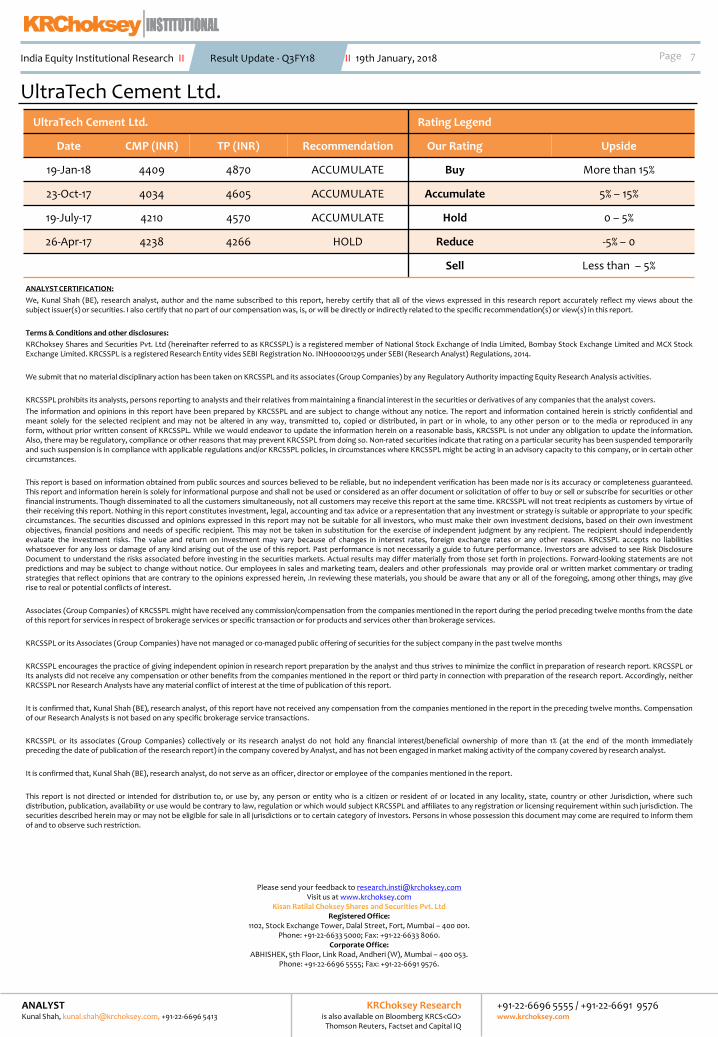
Date CMP (INR) TP (INR) Recommendation Our Rating Upside
19-Jan-18 4409 4870 ACCUMULATE Buy More than 15%
23-Oct-17 4034 4605 ACCUMULATE Accumulate 5% – 15%
19-July-17 4210 4570 ACCUMULATE Hold 0 – 5%
26-Apr-17 4238 4266 HOLD Reduce -5% – 0
Sell Less than – 5%
UltraTech Cement Ltd.
7PageIndia Equity Institutional Research II Result Update - Q3FY18 II 19th January, 2018
+91-22-6696 5555 / +91-22-6691 9576www.krchoksey.com
KRChoksey Researchis also available on Bloomberg KRCS<GO>
Thomson Reuters, Factset and Capital IQ
ANALYST CERTIFICATION:
We, Kunal Shah (BE), research analyst, author and the name subscribed to this report, hereby certify that all of the views expressed in this research report accurately reflect my views about thesubject issuer(s) or securities. I also certify that no part of our compensation was, is, or will be directly or indirectly related to the specific recommendation(s) or view(s) in this report.
Terms & Conditions and other disclosures:
KRChoksey Shares and Securities Pvt. Ltd (hereinafter referred to as KRCSSPL) is a registered member of National Stock Exchange of India Limited, Bombay Stock Exchange Limited and MCX StockExchange Limited. KRCSSPL is a registered Research Entity vides SEBI Registration No. INH000001295 under SEBI (Research Analyst) Regulations, 2014.
We submit that no material disciplinary action has been taken on KRCSSPL and its associates (Group Companies) by any Regulatory Authority impacting Equity Research Analysis activities.
KRCSSPL prohibits its analysts, persons reporting to analysts and their relatives from maintaining a financial interest in the securities or derivatives of any companies that the analyst covers.
The information and opinions in this report have been prepared by KRCSSPL and are subject to change without any notice. The report and information contained herein is strictly confidential andmeant solely for the selected recipient and may not be altered in any way, transmitted to, copied or distributed, in part or in whole, to any other person or to the media or reproduced in anyform, without prior written consent of KRCSSPL. While we would endeavor to update the information herein on a reasonable basis, KRCSSPL is not under any obligation to update the information.Also, there may be regulatory, compliance or other reasons that may prevent KRCSSPL from doing so. Non-rated securities indicate that rating on a particular security has been suspended temporarilyand such suspension is in compliance with applicable regulations and/or KRCSSPL policies, in circumstances where KRCSSPL might be acting in an advisory capacity to this company, or in certain othercircumstances.
This report is based on information obtained from public sources and sources believed to be reliable, but no independent verification has been made nor is its accuracy or completeness guaranteed.This report and information herein is solely for informational purpose and shall not be used or considered as an offer document or solicitation of offer to buy or sell or subscribe for securities or otherfinancial instruments. Though disseminated to all the customers simultaneously, not all customers may receive this report at the same time. KRCSSPL will not treat recipients as customers by virtue oftheir receiving this report. Nothing in this report constitutes investment, legal, accounting and tax advice or a representation that any investment or strategy is suitable or appropriate to your specificcircumstances. The securities discussed and opinions expressed in this report may not be suitable for all investors, who must make their own investment decisions, based on their own investmentobjectives, financial positions and needs of specific recipient. This may not be taken in substitution for the exercise of independent judgment by any recipient. The recipient should independentlyevaluate the investment risks. The value and return on investment may vary because of changes in interest rates, foreign exchange rates or any other reason. KRCSSPL accepts no liabilitieswhatsoever for any loss or damage of any kind arising out of the use of this report. Past performance is not necessarily a guide to future performance. Investors are advised to see Risk DisclosureDocument to understand the risks associated before investing in the securities markets. Actual results may differ materially from those set forth in projections. Forward-looking statements are notpredictions and may be subject to change without notice. Our employees in sales and marketing team, dealers and other professionals may provide oral or written market commentary or tradingstrategies that reflect opinions that are contrary to the opinions expressed herein, .In reviewing these materials, you should be aware that any or all of the foregoing, among other things, may giverise to real or potential conflicts of interest.
Associates (Group Companies) of KRCSSPL might have received any commission/compensation from the companies mentioned in the report during the period preceding twelve months from the dateof this report for services in respect of brokerage services or specific transaction or for products and services other than brokerage services.
KRCSSPL or its Associates (Group Companies) have not managed or co-managed public offering of securities for the subject company in the past twelve months
KRCSSPL encourages the practice of giving independent opinion in research report preparation by the analyst and thus strives to minimize the conflict in preparation of research report. KRCSSPL orits analysts did not receive any compensation or other benefits from the companies mentioned in the report or third party in connection with preparation of the research report. Accordingly, neitherKRCSSPL nor Research Analysts have any material conflict of interest at the time of publication of this report.
It is confirmed that, Kunal Shah (BE), research analyst, of this report have not received any compensation from the companies mentioned in the report in the preceding twelve months. Compensationof our Research Analysts is not based on any specific brokerage service transactions.
KRCSSPL or its associates (Group Companies) collectively or its research analyst do not hold any financial interest/beneficial ownership of more than 1% (at the end of the month immediatelypreceding the date of publication of the research report) in the company covered by Analyst, and has not been engaged in market making activity of the company covered by research analyst.
It is confirmed that, Kunal Shah (BE), research analyst, do not serve as an officer, director or employee of the companies mentioned in the report.
This report is not directed or intended for distribution to, or use by, any person or entity who is a citizen or resident of or located in any locality, state, country or other Jurisdiction, where suchdistribution, publication, availability or use would be contrary to law, regulation or which would subject KRCSSPL and affiliates to any registration or licensing requirement within such jurisdiction. Thesecurities described herein may or may not be eligible for sale in all jurisdictions or to certain category of investors. Persons in whose possession this document may come are required to inform themof and to observe such restriction.
Please send your feedback to [email protected] us at www.krchoksey.com
Kisan Ratilal Choksey Shares and Securities Pvt. LtdRegistered Office:
1102, Stock Exchange Tower, Dalal Street, Fort, Mumbai – 400 001.Phone: +91-22-6633 5000; Fax: +91-22-6633 8060.
Corporate Office: ABHISHEK, 5th Floor, Link Road, Andheri (W), Mumbai – 400 053.
Phone: +91-22-6696 5555; Fax: +91-22-6691 9576.
ANALYSTKunal Shah, [email protected], +91-22-6696 5413