ultrasonography of multifidus muscle morphology and
TRANSCRIPT

1
Ultrasonography of multifidus muscle morphology and function in ice hockey players with and without low back pain
† Maryse Fortin, PhD, CAT(C) 1,2
Amanda Rizk, PhD 1
Stephane Frenette, MRT 1
Mathieu Boily, MD 3 Hassan Rivaz, PhD1,4
1 PERFORM Centre, Concordia University, Montreal, Quebec, Canada
2 Concordia University, Department of Exercise Science, Montreal, Quebec, Canada 3 McGill University Health Center, Department of Diagnostic Radiology, Montreal, Quebec,
Canada 4 Concordia University, Department of Electrical & Computer Engineering, Montreal, Quebec,
Canada
† Corresponding author: Maryse Fortin, PERFORM Centre, Concordia University, 7200 Sherbrooke St W, 2.209, H4B 1R6, email: [email protected], Ph: 514-848-2424, ext. 8642.

2
Structured Abstract:
Objectives: To examine the relationship between lumbar multifidus (LM) morphology, function,
echo-intensity (EI) and body composition among a group of university level ice hockey players
with and without low back pain (LBP).
Design: Cross-sectional study
Setting: University Research Centre
Participants: Thirty-two hockey players (18 females, 14 males) participated in this study.
Main Outcome Measures: Resting LM cross-sectional area (CSA) was assessed bilaterally at
the L5 level in prone and standing using ultrasound imaging. The LM thickness at rest and
during contraction was evaluated in addition to LM EI. Body composition measures were
acquired using dual-energy X-ray absorptiometry (DEXA) and LBP history was acquired using a
self-reported questionnaire.
Results: LM muscle CSA was significantly associated with body composition measurements.
LM EI was strongly associated with total % body fat and significantly greater in females. Resting
LM muscle CSA and thickness (prone) was significantly smaller in players with LBP 4-weeks
prior. LM side-to-side asymmetry (standing) was also significantly greater in players with LBP
3-months prior.

3
Conclusion: The results provide new insights with regards to LM morphology and activation in
ice hockey players and revealed specific deficits in LM morphology in athletes with LBP. LM
morphology was strongly associated with body composition measurements.
Key words: multifidus muscle; low back pain; ice hockey; ultrasound imaging; dual-energy X-
ray absorptiometry

4
Introduction
Elite-level ice hockey players are exposed to high intensity training periods with high loading on
the spine, pelvic region and lower limbs. Low back pain (LBP) is common in ice hockey players
with reported prevalence varying between 55% and 89%,3,12,48 and a 12-month incidence as high
as 85%.12 Spine abnormalities including disc signal reduction, disc height reduction, disc bulging,
disc protrusion, disc extrusion and vertebral body endplate degenerative changes (e.g. modic
changes) have been found to be common in hockey players.3 LBP is often associated with sport-
specific mechanical loads and injury patterns, especially in contact and combat sports, and
athletes participating in sports with high loads on the spine were reported to have a higher
incidence of LBP as compared to other athletes and non-athletes.3,12,57 The most thoroughly
investigated risk factors for the development of LBP in athletes are spinal load, anthropometrics,
age, sex and previous history of LBP.57 However, the influence of these factors on LBP in
athletes remains uncertain. Importantly, LBP has been reported to affect trunk and lower limb
kinematics, which may negatively impact sport performance.38
Biomechanical studies have demonstrated the critical role of the lumbar multifidus (LM) muscle
to provide arthrokinetic control of the vertebral segment and spine stabilization,25,64 as well as
proprioception of the lumbar spine.6 Imaging studies of both athletic and non-athletic
populations with LBP have reported paraspinal muscle degenerative changes and functional
deficits including LM muscle atrophy (decreased cross-sectional area, CSA),4,11,19,22 LM CSA
asymmetry (atrophy ipsilateral to the painful/pathological side),4,28,43,44 increased fatty infiltration,
13,37,47,50 as well as increased or decreased muscular activity.30,58,59 Elite cricketers with LBP were

5
reported to have localized LM muscle atrophy and side-to-side asymmetry.22 Similar findings
have also been reported in professional ballet dancers.17 Decreased size and increased side-to-
side asymmetry of the LM muscle have been found to be important predictors of lower-limb
injuries in elite Australian Football League (AFL) players.21 A recent study also suggested that
runners with LBP have a decreased ability to contract the LM muscle.7 However, other
investigations reported no such LM morphological changes or functional deficits in elite athletes
with LBP.34,49,52 Interestingly, to date very few ultrasound-imaging studies have assessed LM
muscle function in more functional positions, such as standing. Previous reports from non-
athletic populations have reported an increase in LM CSA from prone lying to upright
standing,32,55 suggesting that a more accurate assessment of LM function may be performed
while standing, when LM is contracted in a stabilizing role.55
Preseason-screening assessment of LM muscle characteristics using ultrasound imaging may be
useful for the identification/prevention of athletes at risk of injuries and to monitor
rehabilitation.19,22 LM muscle CSA, thickness during submaximal contraction and at rest, and
echo intensity (EI) in different postures can be conveniently measured with ultrasound to assess
muscle size, function and quality, respectively. EI is measured using the ultrasound brightness
scale, via a gray scale analysis, and may be used as an indicator of muscle quality by estimating
intramuscular fat and connective tissue.2,42 An increase in intramuscular fatty infiltration has
been reported in people with chronic LBP,27,37,47 and such change in muscle quality is
hypothesized to increase the risk of injury and decrease overall muscle functionality.23,31
Previous studies also reported that muscle EI is correlated with muscle strength and
power.8,16,35,36
6
Evidence suggests that age, physical activity level and body composition (e.g. body mass index,
BMI) influence paraspinal muscle morphology and quality.10,14,15,47 BMI is the most commonly
used variable to adjust for inter-subject anthropometric and body composition differences in this
field. However, this measure remains a poor indicator of body composition especially in athletic
populations, due to its inability to differentiate between muscle mass and fat mass. Dual-energy
X-ray absorptiometry (DEXA) is the most accurate method to assess body composition.
However, to our knowledge, there are no studies that have used this technology to examine the
relationship between LM muscle characteristics and body composition. While body composition
is recognized to influence muscle size and quality, the relationship between accurate measures of
body composition, LM muscle characteristics and function in athletes with and without LBP
deserves further attention.
Given the high incidence of LBP in ice hockey and evidence from previous related imaging
studies, it seems imperative to examine LM muscle characteristics in this group of athletes.
Therefore, the primary aim of this study was to examine the relationship between LM muscle
morphology, function (prone and standing), EI and body composition in a cohort of male and
female university level ice hockey players. A secondary aim was to compare LM muscle
characteristics in university level ice hockey players with and without LBP. We hypothesized
that players with LBP would demonstrate reduced LM muscle size and function (contraction)
and greater side-to-side asymmetry.

7
Methods
Participants
Thirty-two ice hockey players (18 females, 14 males) from the Concordia University varsity
team volunteered to participate in this study. Despite the different athletic demands related to
different playing positions (e.g. forward, defense, goalie), all available players were invited to
participate to maximize the sample size. The exclusion criteria were: previous history of severe
trauma or spinal fracture, previous spinal surgery, observable spinal abnormalities and pregnancy.
The study was approved by the Research Ethical Committee of the Institution and the Central
Ethics Committee of Health and Social Services from the Ministry of Quebec. All players
provided informed consent acknowledging that their data would be used for research purpose.
Procedures
During the preseason, each player participated in one testing session lasting approximately 30
minutes. All participants completed a self-administered questionnaire to collect information
regarding players’ demographics and history of LBP. LBP was defined as pain localized between
T12 and the gluteal fold. Players were asked to answer “yes” or “no” to the presence of LBP
during the past 4-weeks (pre-season) or 3-months (off-season) prior to the assessment. Players
who answered “yes” to the presence of LBP completed a Visual Analogue Scale (VAS) to assess
average LBP intensity, and were also asked about pain location (e.g. centered, right side, left
side) and pain duration (in months) for both time points.

8
Ultrasound
Ultrasound B-mode images of LM muscle were acquired using a LOGIQ e ultrasound machine
(GE Heathcare, Milwaukee,WI) with a 5-MHz curvilinear transducer. The imaging parameters
were kept consistent in all acquisitions (frequency: 5MHz, gain: 60, depth: 8.0cm). Previous
studies have established the reliability and validity of ultrasound imaging to assess LM muscle
size and thickness, and determined that this imaging technique was repeatable, reliable and valid
when performed by trained assessors. 29,51
Prone lying measurements
To assess LM muscle size, participants were placed in a prone position, on a therapy table, with a
pillow under their abdomen to minimize lumbar lordosis and instructed to relax the paraspinal
musculature. The spinous process of L5 was palpated and marked on the skin with a pen prior to
imaging. Acoustic coupling gel was applied to the skin and the ultrasound transducer was placed
longitudinally along the midline of the lumbar spine to confirm the location L5. The transducer
was then rotated and placed transversally over the L5 spinous process for imaging. Bilateral
transverse images of LM muscle at L5 were obtained, with the exception of larger muscles,
where the left and right sides were imaged separately (Figure 1). Three images were captured for
the right and left LM muscle. This L5 level was selected based on a previous study reporting that
decreased LM CSA and increased side-to-side asymmetry at this level was a predictor of LBP
and lower-limb injuries in elite AFL players.21
9
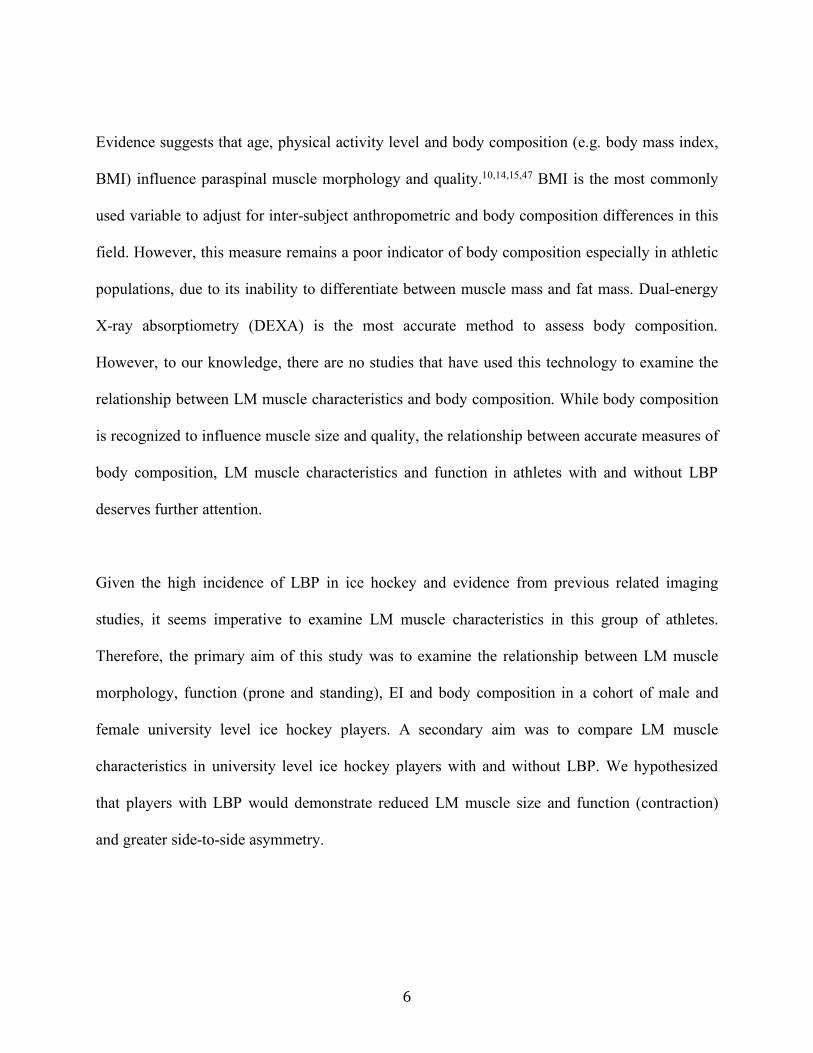
FIGURE 1. A) Bilateral transverse image at L5 vertebral level showing the right and left multifidus and shadow of spinous process of a female hockey player, B) Left side image at L5 vertebral level showing left multifidus muscle and shadow of spinous process of a male hockey player. Due to the larger musculature, the right and left multifidus were imaged separately. C) and D) images are showing the multifidus muscle cross-sectional area (CSA) measurements for the same players presented in images A) and B).
Muscle function was then assessed by obtaining thickness measurements of LM muscle at rest
and during contraction (Figure 2). LM muscle was imaged bilaterally, in the parasagittal section,
allowing for the visualization of the L5/S1 zygapophyseal joints. Participants were instructed to
relax while three images were captured bilaterally. Participants were then instructed to perform a
contralateral arm lift to induce a submaximal contraction 26,29,51 Each participant was given a
handheld weight26 [based on subject body weight: 1) <68.2kg = 0.68kg weight, 2) 68.2-
90.9kg=0.9kg weight, 3) >90.9kg=1.36kg weight] and instructed to raise the loaded arm 5 cm off
the examination table with the shoulder in 120° of abduction and elbow 90° of flexion. The
handed weight was designed to load the LM muscle to approximately 30% of maximal voluntary

10
isometric contraction. Participants were instructed to hold their breath at the end of normal
exhalation (minimize the effect of respiration on thickness measurement) and maintain the
contraction for 3 seconds. Each player had a practice trial, followed by 3 contralateral arm lifts
on each side.
FIGURE 2. Multifidus thickness muscle measurements at rest (left) and during contraction (right) in the prone position at L5-S1 (e.g. left side male hockey player).
Standing measurements
Players were asked to stand barefoot on the floor with their arms relaxed on each side. In order to
achieve a habitual standing posture, participants were instructed to march on the spot for a few
seconds and remain at the position where their feet landed. The same procedure as described
above was conducted to obtain LM size and thickness measurements at rest. To contract the LM
muscle, each participant was asked to perform a contralateral arm lift, with the shoulder placed
in 90° of flexion, elbow in complete extension and the wrist in a neutral position (palm facing
down),55 while holding the previously determined hand weight and asked to maintain the
contraction for 3 seconds. Each player had a practice trial, followed by 3 contralateral arm lifts
on each side.

11
Imaging assessment
Ultrasound images were stored and analyzed offline. LM muscle CSA and thickness
measurements were conducted using OsiriX imaging software (OsiriXLiteVersion 9.0, Geneva,
Switzerland). LM CSA measurements were obtained by tracing the muscle borders on both sides.
The relative % asymmetry in CSA between the right and left side was calculated using the
following formula: [(larger side – smaller side)/larger side x 100]. LM muscle thickness was
assessed using linear measurements from the tip of the L5/S1 zygapophyseal joint to the inside
edge of the superior muscle border, at rest and during contraction in both positions (e.g. prone
and standing). Each measurement was repeated 3 times (on 3 different images) on each side, and
the average value was used in the analyses. LM muscle function and contractile ability in the
prone and standing position was calculated as a percent change using the following formula:
[(thickness contraction – thickness rest)/thickness rest)x100]. LM muscle EI was measured using
grayscale analysis imaging (ImageJ, National Institute of health, USA, Version 1.49) using the
standard histogram function of pixels expressed as value between 0 (black) and 255 (white).2
Enhanced EI is indicative of a greater amount of intramuscular fat and connective tissue. Prior to
EI measurements, each image was calibrated by measuring the number of pixels within a known
distance of 1 cm. EI was determined by tracing a region of interest (ROI) representing the LM
muscle CSA (in the prone position only), avoiding the inclusion of bone or surrounding fascia.
The average value of 3 EI measurements (on 3 different images) on each side was used in the
analyses. All measurements were obtained by an experienced athletic therapist researcher (MF),
with extensive experience in spine imaging analysis, and was also trained by a senior
musculoskeletal ultrasound radiologist (MB) prior to the beginning of this study. At the time of
imaging assessment, the rater was blinded to players’ characteristics and LBP history. The intra-

12
class correlation coefficients (ICC3,1) ranged between 0.96-0.99 with standard error of
measurement (SEM) of 0.04-0.14 cm2 for all prone measurements, and 0.96-0.98 with SEM of
0.06-0.25 for all standing measurements indicating a high level of reliability. The reliability for
the LM EI measurement was 0.99 with a SEM of 1.97.
DEXA
Each player had a full body DEXA scan (Lunear Prodigy Advance, GE) performed by a certified
medical imaging technologist (SF). Prior to imaging, all participants were asked to remove any
metal and were required to wear loose fitting clothing, to avoid interference with the scan. Age,
height, weight and ethnicity were entered in the computer software prior to imaging. Participants
were asked to lie down supine in the center of the scanner with their arms slightly away from the
body, thumbs pointing upwards, with their legs slightly apart and toes pointing upwards. Total
lean mass, total bone mass, total fat mass and total percent body fat were obtained.
Statistical Analysis
Means and standard deviations were calculated for participants’ characteristics, LM
measurements of interest and body composition measurements. Analysis of variance (ANOVA)
was used initially to assess the difference between LM muscle characteristics between male and
female players. Linear regression models and spearman correlation were used to assess the
relationship between LM muscle measurements of interest and body composition measurements.
Analysis of covariance (ANCOVA) was used to examine the difference between LM muscle
measurements between players with and without LBP. Separate analyses were performed for the
presence of LBP at 4-weeks and 3-months prior. The variables “weight” and “height” were
13
entered as covariates in the analyses. All analyses were performed with STATA (version 12.0,
StataCorp, LP, College Station, Texas).
Results:
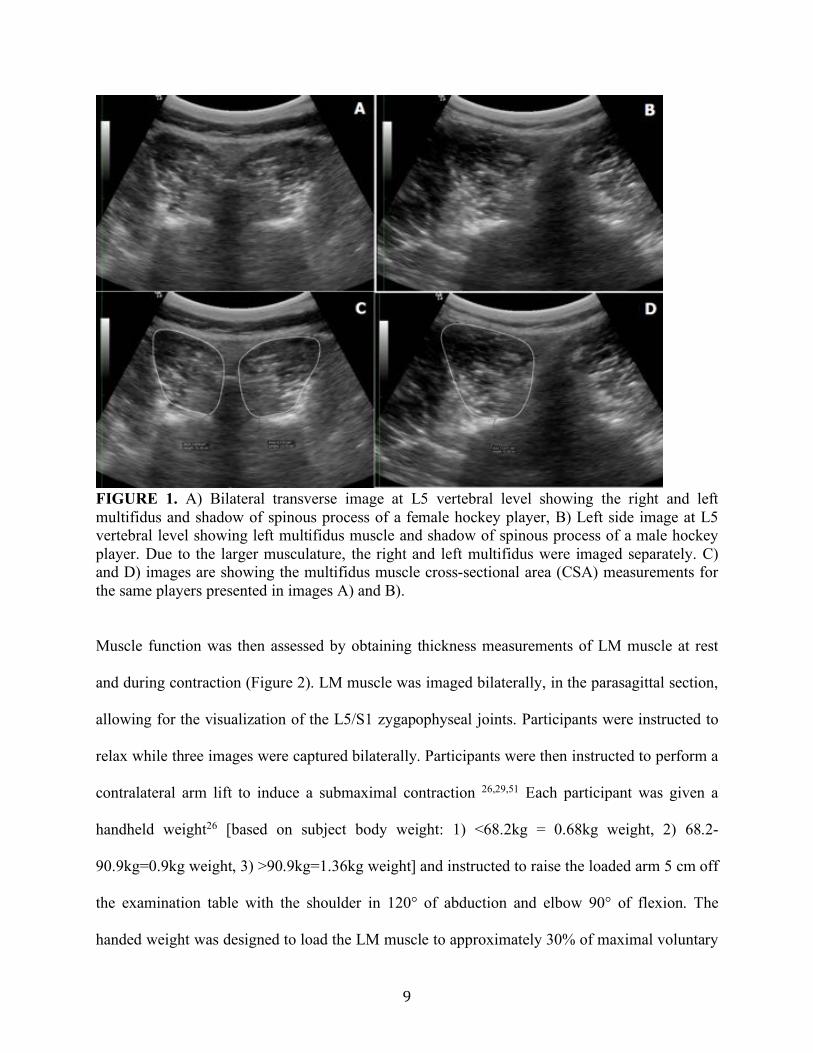
Players’ characteristics are presented in Table 1. The mean ± SD age, height, and weight was
21.4±1.4 years, 173.8±9.1 cm, and 76.0±12kg, respectively. The average number of years
playing hockey was 10.7±4.1, including 1 to 5 years at the university level.
Table 1. Players’ characteristics ((mean±SD) or n) All (n=32) Female (n=18) Male (n=14) Age (yr) 21.4±1.4 21.3±1.8 21.6±0.8 Height (cm) 173.8±9.1 167.7±5.6 181.8±6.2 Weight (kg) 76.0±12.0 67.7± 7.8 86.7±6.8 Total lean mass (kg) 57.3±11.5 48.3±5.5 68.8±48.9 Total bone mass (kg) 3.2± 5.9 2.83±2.9 3.7±5.1 Total Fat mass (kg) 16.1±4.4 17.1± 4.5 14.7±4.1 Total body fat % 22.2±6.1 25.9±4.8 17.5±4.1 BMI 25.0±2.2 24.0±2.0 26.2±1.6 Dominant leg (n) Right 23 13 10 Left 5 4 1 Either 3 0 3 Position (n) Defense 11 5 6 Forward 15 11 4 Centre 2 0 2 Goalie 4 2 2 Hockey competitive level (yr) 10.7±4.1 9.1±3.9 12.4±3.8 Hockey university level (yr) 2.3±1.1 2.5±1.2 1.9±0.9 LBP 4-weeks prior (n) 13 6 7 LBP 3-months prior (n) 13 5 8 LBP last competitive year (n) 6 3 3 LBP location 4-weeks prior (n) Centered 7 3 4 Bilateral 4 2 2 Unilateral 2 1 1 LBP location 3-months prior (n)* Centered 6 3 3

14
Bilateral 4 1 3 Unilateral 1 1 1 VAS LBP (0-10) 4-weeks prior 4.0±1.4 3.8±1.7 4.1±1.2 VAS LBP (0-10) 3-months prior 4.3±1.7 4.2±2.5 4.3±1.3 kg=Kilograms, LBP=low back pain, VAS=visual analogue scale *= One missing data from male group
LM muscle characteristics and body composition
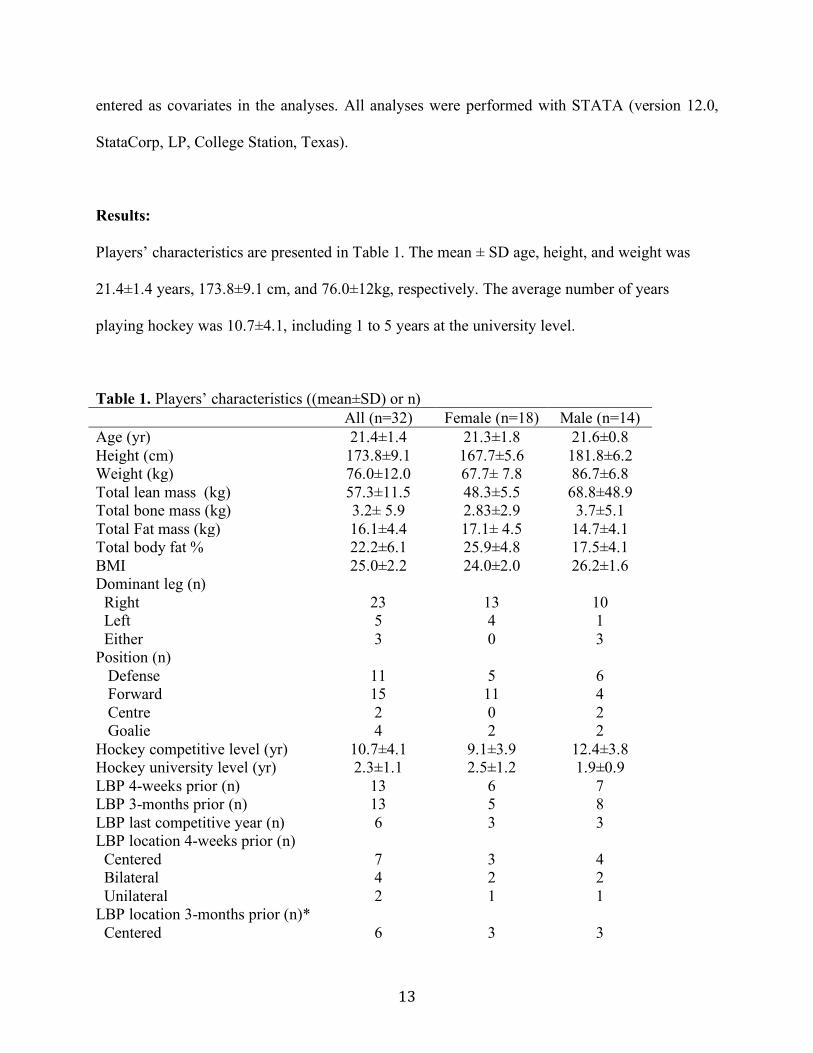
LM muscle CSA, side-to-side asymmetry (right vs. left), EI, thickness at rest and during
contraction, % thickness change during contraction in prone and standing for female and male
players are presented in Table 2. LM CSA in the prone position was significantly larger in male
compared to female players (p=0.03). EI was significantly greater in female athletes compared to
male athletes (p<0.001, rho=0.63). There was no significant difference between male and female
players for LM CSA side-to-side asymmetry, or thickness measurements at rest or during
contraction. LM CSA was significantly associated with height (rho=0.58, p<0.001; rho=0.55,
p=0.001), weight (rho=0.53, p=0.002; rho=0.45, p=0.008), total bone mass (rho=0.48, p=0.005;
rho=0.47, p=0.007) and total lean body mass (rho=0.49, p=0.004; rho=0.49, p=0.004) in prone
and standing, respectively. BMI was not correlated with LM CSA in prone or standing. LM
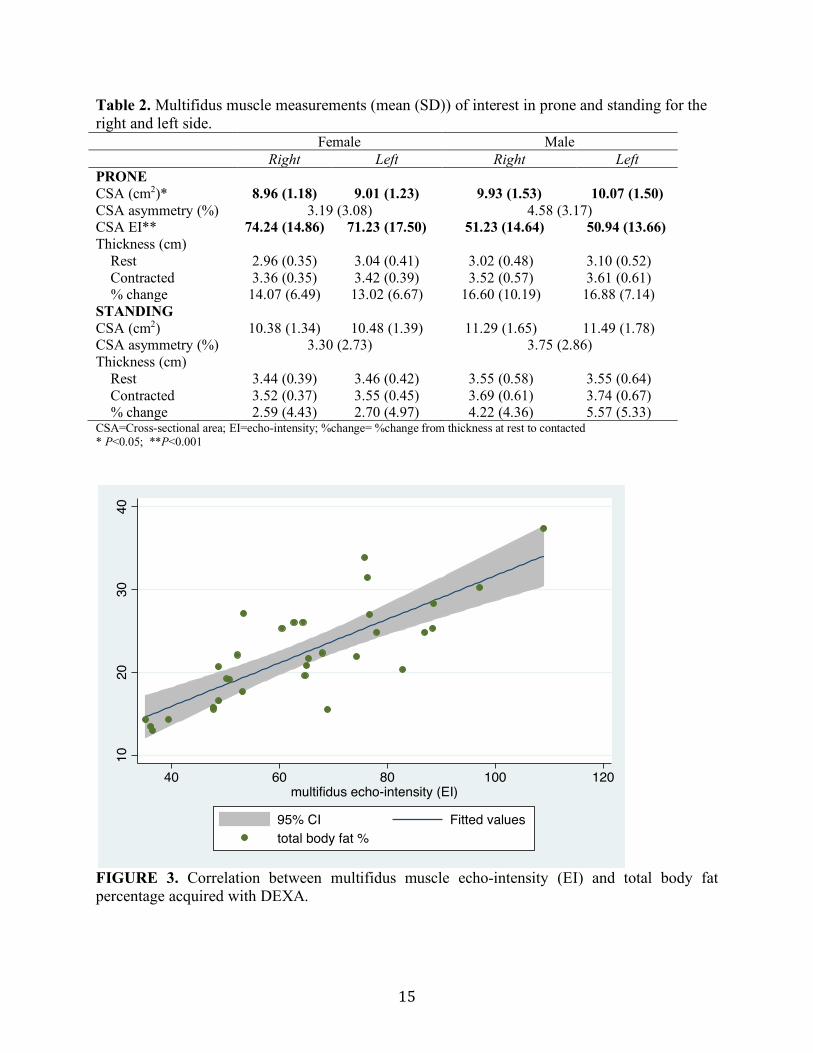
muscle EI was strongly associated with total percentage body fat (rho=0.76, p<0.001, Figure 3),
total lean mass (rho=-0.60, p<0.001) and total fat mass (rho=0.56, p=0.001). BMI was not
associated with LM muscle EI (rho=-0.33, p=0.06). LM muscle EI was not associated with
function (e.g. % thickness change during contraction).
15
Table 2. Multifidus muscle measurements (mean (SD)) of interest in prone and standing for the right and left side. Female Male Right Left Right Left PRONE CSA (cm2)* 8.96 (1.18) 9.01 (1.23) 9.93 (1.53) 10.07 (1.50) CSA asymmetry (%) 3.19 (3.08) 4.58 (3.17) CSA EI** 74.24 (14.86) 71.23 (17.50) 51.23 (14.64) 50.94 (13.66) Thickness (cm) Rest 2.96 (0.35) 3.04 (0.41) 3.02 (0.48) 3.10 (0.52) Contracted 3.36 (0.35) 3.42 (0.39) 3.52 (0.57) 3.61 (0.61) % change 14.07 (6.49) 13.02 (6.67) 16.60 (10.19) 16.88 (7.14) STANDING CSA (cm2) 10.38 (1.34) 10.48 (1.39) 11.29 (1.65) 11.49 (1.78) CSA asymmetry (%) 3.30 (2.73) 3.75 (2.86) Thickness (cm) Rest 3.44 (0.39) 3.46 (0.42) 3.55 (0.58) 3.55 (0.64) Contracted 3.52 (0.37) 3.55 (0.45) 3.69 (0.61) 3.74 (0.67) % change 2.59 (4.43) 2.70 (4.97) 4.22 (4.36) 5.57 (5.33) CSA=Cross-sectional area; EI=echo-intensity; %change= %change from thickness at rest to contacted * P<0.05; **P<0.001
FIGURE 3. Correlation between multifidus muscle echo-intensity (EI) and total body fat percentage acquired with DEXA.
1020
3040
40 60 80 100 120multifidus echo-intensity (EI)
95% CI Fitted valuestotal body fat %

16
LBP Comparisons
LM CSA in the prone position was significantly smaller in players reporting the presence of LBP
4-weeks prior to measurement (F=9.62, p=0.004) (Table 3). Similarly, LM thickness at rest was
significantly smaller in players with LBP 4-weeks prior (F=4.62, p=0.04). LM CSA side-to-side
asymmetry in the standing position was also significantly greater in players who reported LBP
3-months prior (F=4.67, p=0.03) (Table 4). There were no significant differences for LM EI or %
thickness change in prone or standing between players reporting LBP 4-weeks or 3-months prior
to measurement.
Table 3. Adjusted meansa (mean (SE)) of multifidus muscle measurements in prone and standing for players with and without LBP in past 4-weeks. No LBP
(n=19) LBP past 4-week
(n=13) PRONE CSA (cm2) 9.42 (0.23) 8.94 (0.29) CSA asymmetry (%) 3.92 (0.76) 3.61 (0.92) CSA_EIb 61.67 (2.44) 65.60 (2.97) Thickness (cm) Rest 3.15 (0.09) 2.83 (0.11) Contracted 3.58 (0.10) 3.29 (0.13) % change 13.85 (1.59) 16.82 (1.93) STANDING CSA (cm2) 10.78 (0.32) 10.95 (0.39) CSA asymmetry (%) 3.38 (0.65) 3.67 (0.79) Thickness (cm) Rest 3.61 (0.11) 3.32 (0.13) Contracted 3.72 (0.11) 3.46 (0.14) % change 3.32 (0.86) 4.02 (1.05) LBP=low back pain; CSA=Cross-sectional area; EI=echo-intensity; %change= %change from thickness at rest to contacted a Adjusted means for weight and height b Adjusted means for weight, height and total body fat % bold = P<0.05
17
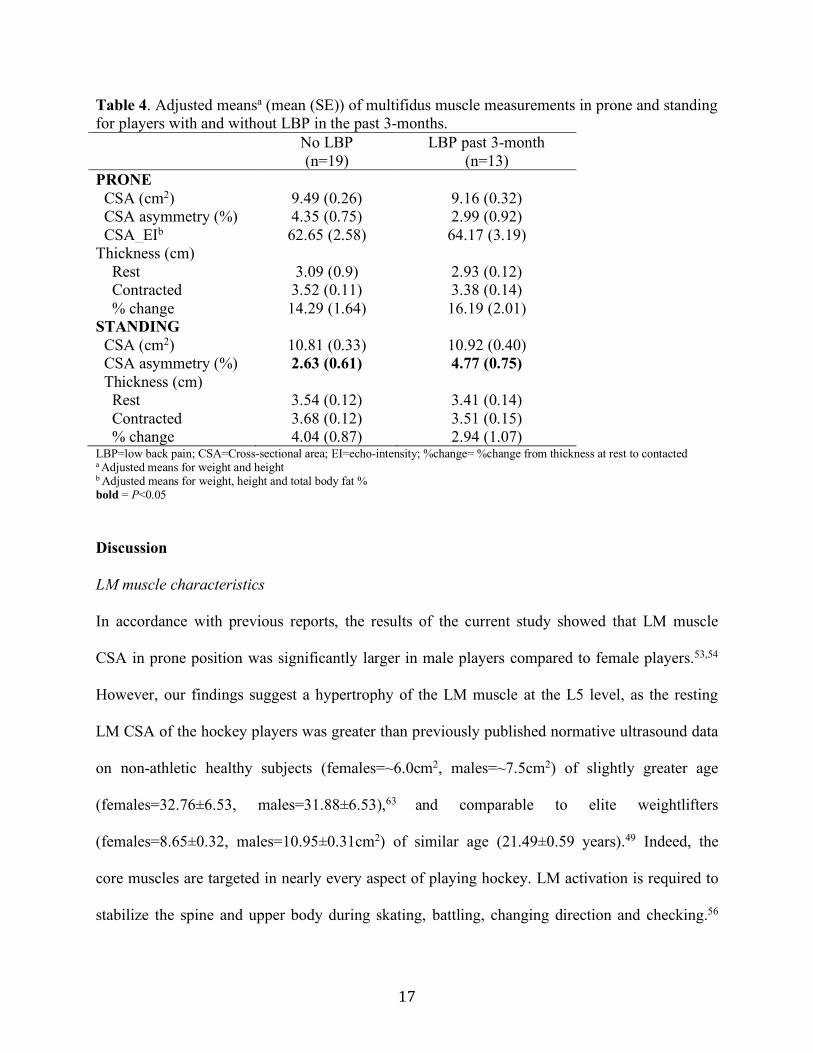
Table 4. Adjusted meansa (mean (SE)) of multifidus muscle measurements in prone and standing for players with and without LBP in the past 3-months. No LBP
(n=19) LBP past 3-month
(n=13) PRONE CSA (cm2) 9.49 (0.26) 9.16 (0.32) CSA asymmetry (%) 4.35 (0.75) 2.99 (0.92) CSA_EIb 62.65 (2.58) 64.17 (3.19) Thickness (cm) Rest 3.09 (0.9) 2.93 (0.12) Contracted 3.52 (0.11) 3.38 (0.14) % change 14.29 (1.64) 16.19 (2.01) STANDING CSA (cm2) 10.81 (0.33) 10.92 (0.40) CSA asymmetry (%) 2.63 (0.61) 4.77 (0.75) Thickness (cm) Rest 3.54 (0.12) 3.41 (0.14) Contracted 3.68 (0.12) 3.51 (0.15) % change 4.04 (0.87) 2.94 (1.07) LBP=low back pain; CSA=Cross-sectional area; EI=echo-intensity; %change= %change from thickness at rest to contacted a Adjusted means for weight and height b Adjusted means for weight, height and total body fat % bold = P<0.05
Discussion
LM muscle characteristics
In accordance with previous reports, the results of the current study showed that LM muscle
CSA in prone position was significantly larger in male players compared to female players.53,54
However, our findings suggest a hypertrophy of the LM muscle at the L5 level, as the resting
LM CSA of the hockey players was greater than previously published normative ultrasound data
on non-athletic healthy subjects (females=~6.0cm2, males=~7.5cm2) of slightly greater age
(females=32.76±6.53, males=31.88±6.53),63 and comparable to elite weightlifters
(females=8.65±0.32, males=10.95±0.31cm2) of similar age (21.49±0.59 years).49 Indeed, the
core muscles are targeted in nearly every aspect of playing hockey. LM activation is required to
stabilize the spine and upper body during skating, battling, changing direction and checking.56

18
Strong LM and core muscles activation is also critical while shooting to generate force and
rotational power.46 Furthermore, hockey players spend most of the game with their hips, knees
and spine flexed. Holding a forward flexed position (in comparison to an upright position)
significantly increases the LM muscular demand, thereby leading to an eccentric contraction.32
As such, the LM hypertrophy observed in our female and male athletes is likely a
response/adaptation to the specific physical demands of the sport.
Despite the asymmetrical nature of hockey, our findings showed no significant side-to-side
asymmetry in LM muscle CSA in male or female players. In fact, LM side-to-side asymmetry in
the prone position was <5%, which corroborates with previous reports in healthy normal
subjects20,54,63 and athletes.22,49 Furthermore, the level of LM CSA side-to-side asymmetry when
assessed in the standing position was similar to prone lying and remained <5%. As the LM
muscle is contracted in a stabilizing role while standing, the CSA significantly increased from
the prone lying to standing position. Accordingly, the % thickness change in standing was
significantly smaller than the prone position, a finding that is consistent with a previous study in
young healthy subjects (mean age of 31.8 years).55 We are unaware of previous work that has
assessed LM characteristics in the standing position in athletes. Though, LM % thickness change
(contraction) in prone position was in accordance with values previously reported in elite
athletes.22
Association between LM characteristics and body composition
As expected, EI was significantly greater in female players as compared to male players,
demonstrating that females naturally a higher level of LM fatty infiltration/connective tissue due

19
to a greater percentage of body fat.9,27,37,47 LM muscle EI was not associated with function
(e.g. % thickness change). Given the intuitive perspective that increased fatty infiltration would
have negative effects on muscle function, this finding was unexpected but in accordance with a
previous study.31 Other measures of LM muscle function (e.g. strength, electrical muscular
activity, endurance) may have shown stronger associations with LM fatty infiltration, as previous
research has reported increased intra-muscular fatty infiltration to be associated with decreased
thigh muscle power and performance.8,61,62 One should keep in mind the unique nature of the LM
muscle, as it has been clinically observed and previously reported that LM fatty infiltration
deposit is not homogeneous and mostly occurs in the deepest portion of the muscle.1,23
Furthermore, differences in muscle activation between the deepest and superficial muscle layers
have also been observed. 33
LM muscle CSA was strongly dependent on hockey players’ weight, height, total lean muscle
mass and total bone mass. BMI was not correlated with LM muscle CSA, although it is the most
commonly used variable to adjust for between-sex and between-subject variability in the field.
One should take into account that BMI is often a poor measure of body composition in athletes,
due to the inability to differentiate between muscle and fat mass. While previous studies of non-
athletic subjects have reported a positive association between BMI and paraspinal muscle fat
content,13,24,41 others reported no such relationship.9,27 LM muscle EI was strongly correlated
with total percentage body fat, total lean mass and total fat mass, confirming that the influence of
body composition on measurements on LM muscle quality (composition) cannot be ignored.
Two previous studies using bioimpedance also reported a correlation between paraspinal muscle
fatty infiltration and general body fat.9,45 However, the accuracy of bioimpedance compared to
20
DEXA for percentage body fat measurement substantially decreases as weight-status increases,60
thus our correlation estimates should be more accurate.
LM muscle characteristics and LBP
In our sample of hockey players, 41% experienced some level of LBP during the preseason.
When assessing LM muscle characteristics according to LBP history, our results revealed that
LM CSA was significantly smaller in players who reported LBP 4-weeks prior to measurement.
Similarly, resting LM CSA in the prone position was also significantly smaller in players with
recent LBP (previous 4-weeks). These findings corroborate with previous studies in athletes,
where professional ballet dancers 17 and soccer players 19 with LBP also showed deficits in
resting LM CSA compared to athletes with no LBP. Other studies, 34,49,52 however, reported no
such association suggesting that some athletic populations may behave differently with regards
to LM muscle size and LBP, possibly due to competing influences including specialized
movements and specific training effects.52 Our findings, along with others,17,22 also indicates that
players reporting the presence of LBP in the previous 3-months had greater LM side-to-side
asymmetry, when assessed in the standing position. Such asymmetry, however, was not observed
when players were measured in the prone position. This discordance between findings in prone
and standing positions suggest that LM muscle likely behave differently while contracted in a
stabilizing role (e.g. standing), which may be a more accurate position for the assessment of LM
function.55 Further studies assessing the association between LM muscle characteristics in
functional positions (such as standing) and LBP are needed to confirm and expand our findings.

21
Similar to previous studies,19,55 our results with regards to LM % thickness change showed that
players with and without LBP were equivalently able to contract the LM muscle in the prone and
standing positions. However, there was a trend for players with a history of LBP to have a
greater LM contraction (e.g. higher % thickness change), a finding that has also been reported in
previous studies in athletic19 and non-athletic populations.55 Subjects with LBP have been found
to develop movement and motor control impairments, which may be manifested as a lack of
segmental control of the neutral zone.39 Thus, increased LM muscular activation may be
developed as a compensatory mechanism.30 While subjects with LBP have also been reported to
have more LM fatty infiltration,13,37,46,50 this was not the case for our hockey players as LM
muscle EI was comparable between players with and without LBP. This finding, however, is
consistent with previous studies that have compared people with LBP to healthy age- and
activity-matched subjects and found no association between paraspinal muscle fat content and
LBP.5,11 Furthermore, previous studies also showed no association between LBP and fatty
infiltration in young adults.37,40 As the mean age of our hockey players was 21.4±1.4 years, the
young age likely explains the lack of fatty infiltration. In addition, the mean VAS score of
players reporting the presence of LBP varied between 4.0±1.4 and 4.3±1.7, suggesting a
relatively low level of pain and disability.
Ice hockey players require strong, symmetrical and highly reactive core musculature in order to
properly transmit force generated through the kinetic chain. Given that both smaller LM and
greater LM side-to-side asymmetry were associated with the presence of LBP, altered trunk
and/or lower limb movements may be responsible for the LM muscle changes observed in
hockey players with LBP in this study. While specific stabilization exercises were effective to

22
restore LM muscle CSA and decreased LBP symptoms in a group of elite cricketers,22 additional
intervention trials assessing the effects of such exercise programme in different athletic
populations with LBP are needed.
A limitation of this study is the relatively small sample size, though comparable to previous
studies conducted with elite athletes. This might have affected some of the analyses. Additional
investigations with more hockey teams are needed to confirm our results. Our study had a
sufficient number of asymptomatic players, which allowed for a representative comparison
between players with and without LBP. Although the number of players reporting LBP 4-weeks
prior and 3-months prior were equal (n=13), the players included in each LBP group (e.g. 4-
weeks and 3-months) differed slightly.
Conclusion:
This study provides new insights on LM muscle morphology and activation during movement in
prone and standing positions in hockey players, and their associations with body composition
and LBP. Our results suggest a hypertrophy of the LM muscle, which is likely due to the high
demands of the sport on the back musculature. DEXA body composition measurements were
significantly associated with LM morphology, suggesting that the influence of body composition
on LM muscle quality cannot be ignored. While LM muscle function (e.g. contraction) was not
associated with EI or LBP, hockey players with LBP showed specific deficits in resting LM CSA
and thickness in the prone position, as well as greater LM side-to-side asymmetry in standing
when compared to players without LBP. Preseason screening assessment of the LM muscle may
be useful in injury prevention programs, which could help decrease the high prevalence of LBP

23
in this athletic population. Additional studies in athletes are needed to confirm these results, and
allow for the investigation of further aspects of LM muscle function and neuromuscular motor
control.

24
References:
1. Abbott R, Pedler A, Sterling M, et al. The geography of fatty infiltrates within the
cervical multifidus and semispinalis cervicis in individuals with chronic whiplash-
associated disorders. J Orthop Sports Phys Ther 2015;45(4):281-288. doi:
10.2519/jospt.2015.5719.
2. Arts IMP, Pillen S, Schelhaas HJ, Overeem S, Zwarts MJ. Normal values for
quantitative muscle ultrasonography in adults. Muscle Nerve. 2010;41(1):32-41.
doi: 10.1002/mus.21458.
3. Baranto A, Hellstrom M, Cederlund CG, Sward L. Back pain and MRI changes in
the thoraco-lumbar spine of top athletes in four different sports: A 15-year follow-
up study. Knee Surg Sports Traumatol Arthrosc. 2009;17(9):1125-1134. doi:
10.1007/s00167-009-0767-3.
4. Barker KL, Shamley DR, Jackson D. Changes in the cross-sectional area of
multifidus and psoas in patients with unilateral back pain: The relationship to pain
and disability. Spine. 2004;29(22):E515-E519.
5. Beneck GJ, Kulig K. Multifidus atrophy is localized and bilateral in active
persons with chronic unilateral low back pain. Arch Phys Med Rehabil
2012;93(2):300-306. doi: 10.1016/j.apmr.2011.09.017.
6. Brumagne S, Cordo P, Lysens R, Verschueren S, Swinnen S. The role of
paraspinal muscle spindles in lumbosacral position sense in individuals with and
without low back pain. Spine. 2000;25(8):989-994.

25
7. Cai C, Kong, PW Low back and lower-limb muscle performance in male and
female recreational runners with chronic low back pain. J Orthop Sports Phys
Ther. 2015;45(6):436-443. doi: 10.2519/jospt.2015.5460.
8. Cadore EL, Izquierdo M, Conceição M, et al. Echo intensity is associated with
skeletal muscle power and cardiovascular performance in elderly men. Exp
Gerontolol. 2012;47(6):473-478. doi: 10.1016/j.exger.2012.04.002.
9. Crawford RJ, Filli L, Elliott JM, et al. Age- and level-dependence of fatty
infiltration in lumbar paravertebral muscles of healthy volunteers. AJNR Am J
Neuroradiol. 2016;37(4):742-748. doi: 10.3174/ajnr.A4596.
10. Crawford RJ, Volken T, Valentin S, Melloh M, Elliott JM. Rate of lumbar
paravertebral muscle fat infiltration versus spinal degeneration in asymptomatic
populations: an age-aggregated cross-sectional simulation study. Scoliosis Spinal
Disord. 2016;11:21. doi: 10.1186/s13013-016-0080-0
11. Danneels LA, Vanderstraeten GG, Cambier DC, Witvrouw EE, De Cuyper HJ.
CT imaging of trunk muscles in chronic low back pain patients and healthy
control subjects. Eur Spine J. 2000:9(4);266-272.
12. Fett D, Trompeter K, Platen P. Back pain in elite sports: A cross-sectional study
on 1114 athletes. PLoS ONE. 2017;12(6):e30180130. doi:
10.1371/journal.pone.0180130.
13. Fortin M, Gibbons LE, Videman T, Battié MC. Do variations in paraspinal
muscle morphology and composition predict low back pain in men? Scand J Med
Sci Sports. 2015;25(6):880-887. doi: 10.1111/sms.12301.

26
14. Fortin M, Videman T, Gibbons LE, Battié MC. Paraspinal muscle morphology
and composition: A 15-yr longitudinal magnetic resonance imaging study. Med
Sci Sports Exerc. 2014;46(5). doi: 10.1249/MSS.0000000000000179.
15. Fortin M, Yuan Y, Battié MC. Factors associated with paraspinal muscle
asymmetry in size and composition in a general population sample of men. Phys
Ther 2013;93(11):1540-1550. doi: 10.2522/ptj.20130051.
16. Fukumoto Y, Ikezoe T, Yamada Y et al. Skeletal muscle quality assessed from
echo intensity is associated with muscle strength of middle-aged and elderly
persons. Eur J Appl Physiol 2012;112:1519–1525. doi: 10.1007/s00421-011-
2099-5.
17. Gildea JE, Hides JA, Hodges PW. Size and symmetry of trunk muscles in ballet
dancers with and without low back pain. J Orthop Sports Phys Ther.
2013;43(8):525-533. doi: 10.2519/jospt.2013.4523.
18. Hides J, Gilmore C, Stanton W, Bohlscheid E. Multifidus size and symmetry
among chronic LBP and healthy asymptomatic subjects. Man Ther
2008;13(1):43-49.
19. Hides JA, Oostenbroek T, Franettovich Smith MM, Mendis MD. The effect of
low back pain on trunk muscle size/function and hip strength in elite football
(soccer) players. J Sports Sci 2016;34(24):2303-2311.
20. Hides JA, Richardson CA, Jull GA. Magnetic resonance imaging and
ultrasonography of the lumbar multifidus muscle: Comparison of two different
modalities. Spine. 1995;20(1):54-58.
27
21. Hides JA, Stanton WR, Mendis MD, Franettovich Smith MM, Sexton MJ. Small
multifidus muscle size predicts football injuries. Orthop J Sports Med 2014;2(6):
2325967114537588. doi: 10.1177/2325967114537588.
22. Hides J, Stanton W, McMahon S, Sims K, Richardson C. Effect of stabilization
training on multifidus muscle cross-sectional area among young elite cricketers
with low back pain. J Orthop Sports Phys Ther 2008;38(3):101-108. doi:
10.2519/jospt.2008.2658.
23. Hildebrandt M, Fankhauserm G, Meichtry A, Luomajoki H. Correlation between
lumbar dysfunction and fat infiltration in lumbar multifidus muscles in patients
with low back pain. BMC Musculoskelet Disord. 2017;18(1):12. doi:
10.1186/s12891-016-1376-1.
24. Kalichman L, Hodges P, Li L, Guermazi A, Hunter DJ. Changes in paraspinal
muscles and their association with low back pain and spinal degeneration: CT
study. Eur Spine J 2010:19(7);1136-1144. doi: 10.1007/s00586-009-1257-5
25. Kay AG. An extensive literature review of the lumbar multifidus: Biomechanics.
J Man Manipul Ther 2001;9(1):17-39. doi:10.1179/jmt/2001.9.1.17
26. Kiesel KB, Uhl TL, Underwood FB, Rodd DW, Nitz AJ. Measurement of lumbar
multifidus muscle contraction with rehabilitative ultrasound imaging. Man Ther.
2007;12(2):161-166.
27. Kjaer P, Bendix T, Sorensen JS, Korsholm L, Leboeuf-Yde C. Are MRI-defined
fat infiltrations in the multifidus muscles associated with low back pain? BMC
Med. 2007;5:2.
28
28. Kulig K, Scheid AR, Beauregard R, Popovich JM Jr, Beneck GJ, Colletti PM.
Multifidus morphology in persons scheduled for single-level lumbar
microdiscectomy: Qualitative and quantitative assessment with anatomical
correlates. Am J Phys Med Rehabil. 2009;88(5):355-361.
29. Larivière C, Gagnon D, De Oliveira E Jr, Henry SM, Mecheri H, Dumas J.
Ultrasound measures of the lumbar multifidus: Effect of task and transducer
position on reliability. PM R. 2013;5(8):678-687. doi:
10.1016/j.pmrj.2013.03.010.
30. Larivière C, Gagnon D, Loisel P. The comparison of trunk muscles EMG
activation between subjects with and without chronic low back pain during
flexion-extension and lateral bending tasks. J Electromyogr Kinesiol
2000;10(2):79-91.
31. Le Cara EC, Marcus RL, Dempsey AR, Hoffman MD, Hebert JJ. Morphology
versus function: The relationship between lumbar multifidus intramuscular
adipose tissue and muscle function among patients with low back pain. Arch Phys
Med Rehabil 2014;95(10):1846-1852. doi: 10.1016/j.apmr.2014.04.019.
32. Lee S, Chan CK, Lam T, et al. Relationship between low back pain and lumbar
multifidus size at different postures. Spine. 2006;31(19):2258-2262.
33. MacDonald D, Moseley GL, Hodges PW. Why do some patients keep hurting
their back? Evidence of ongoing back muscle dysfunction during remission from
recurrent back pain. Pain. 2009;142(3):183-188. doi: 10.1016/j.pain.2008.12.002.
34. McGregor AH, Anderton L, Gedroyc WM. The trunk muscles of elite oarsmen.
Br J Sports Med 2002;36(3):214-217.
29
35. Mangine GT, Fukuda DH, LaMonica MB, Gonzalez AM, Wells AJ, Townsend
JR, et al. Influence of gender and muscle architecture asymmetry on jump and
sprint performance. J Sports Sci Med 2014; 13:904–911. �
36. Mangine GT, Fukuda DH, Townsend JR, Wells AJ, Gonzalez AM, Jajtner AR, et
al. Sprinting performance on the Woodway Curve 3.0(TM) is related to muscle
architecture. Eur J Sport Sci 2015;15: 606–614. �doi:
10.1080/17461391.2014.969322.
37. Mengiardi B, Schmid MR, Boos N, et al. Fat content of lumbar paraspinal
muscles in patients with chronic low back pain and in asymptomatic volunteers:
Quantification with MR spectroscopy. Radiology. 2006;240(3):786-792.
38. Muller R, Ertelt T, Blickhan R. Low back pain affects trunk as well as lower limb
movements during walking and running. J Biomech 2015;48(6):1009-1114. doi:
10.1016/j.jbiomech.2015.01.042.
39. O'Sullivan P. Diagnosis and classification of chronic low back pain disorders:
Maladaptive movement and motor control impairments as underlying mechanism.
Man Ther 2005;10(4):242-255.
40. Paalanne N, Niinimäki J, Karppinen J, et al. Assessment of association between
low back pain and paraspinal muscle atrophy using opposed-phase magnetic
resonance imaging: A population-based study among young adults. Spine.
2011;36(23):1961-1968. doi: 10.1097/BRS.0b013e3181fef890.
41. Parkkola R, Rytokoski U, Kormano M. Magnetic resonance imaging of the discs
and trunk muscles in patients with chronic low back pain and healthy control
subjects. Spine. 1993;18(7):830-836.

30
42. Pillen S, Tak RO, Zwarts MJ, et al. Skeletal muscle ultrasound: Correlation
between fibrous tissue and echo intensity. Ultrasound Med Biol. 2009;35(3):443-
446. doi: 10.1016/j.ultrasmedbio.2008.09.016.
43. Ploumis A, Michailidis N, Christodoulou P, Kalaitzoglou I, Gouvas G, Beris A.
Ipsilateral atrophy of paraspinal and psoas muscle in unilateral back pain patients
with monosegmental degenerative disc disease. Br J Radiol 2011;84(1004): 709-
713. doi: 10.1259/bjr/58136533.
44. Ranger TA, Cicuttini FM, Jensen TS, et al. Are the size and composition of the
paraspinal muscles associated with low back pain? A systematic review. Spine J
2017;17(11):1729-1748. doi: 10.1016/j.spinee.2017.07.002.
45. Ropponen A, Videman T, Battié MC. The reliability of paraspinal muscles
composition measurements using routine spine MRI and their association with
back function. Man Ther 2008;13(4), 349-356.
46. Rourk ZT. (2016) The relationship between core stability and a hockey specific
sport performance in elite vs. non-elite hockey athletes. Retrieved from the
University of Minnesota Digital Conservancy, http:hdl.handle.net/11299/185551.
47. Sasaki T, Yoshimura N, Hashizume H, et al. MRI-defined paraspinal muscle
morphology in japanese population: The wakayama spine study. PLoS ONE.
2007;12(11):e0187765. doi: 10.1371/journal.pone.0187765
48. Selanne H, Ryba TV, Siekkinen K, et al. The prevalence of musculoskeletal pain
and use of painkillers among adolescent male ice hockey players in Finland.
Health Psycholand Behav Med 2014;2(1):448-454.

31
49. Sitilertpisan P, Hides J, Stanton W, Paungmali A, Pirunsan U. Multifidus muscle
size and symmetry among elite weightlifters. Phys Ther Sport 2012;13(1):11-15.
doi: 10.1016/j.ptsp.2011.04.005.
50. Shahidi B, Hubbard JC, Gibbons MC, et al. Lumbar multifidus muscle
degenerates in individuals with chronic degenerative lumbar spine pathology. J
Orthop Res 2017;35(12):2700-2706. doi: 10.1002/jor.23597
51. Skeie EJ, Borge JA, Leboeuf-Yde C, Bolton J, Wedderkopp N. Reliability of
diagnostic ultrasound in measuring the multifidus muscle. Chiropr Man Therap
2015;23:15. doi: 10.1186/s12998-015-0059-6.
52. Smyers EA, Myrer JW, Eggett DL, Mitchell UH, Johnson AW. Multifidus muscle
size and symmetry in ballroom dancers with and without low back pain. Int J
Sports Med 2018;39(8):630-635.
53. Stokes M, Hides J, Elliott J, Kiesel K, Hodges P. Rehabilitative ultrasound
imaging of the posterior paraspinal muscles. J Orthop Sports Phys Ther
2007;37(10):581-595.
54. Stokes M, Rankin G, Newham DJ. Ultrasound imaging of lumbar multifidus
muscle: Normal reference ranges for measurements and practical guidance on the
technique. Man Ther 2005;10(2):116-126.
55. Sweeney N, O'Sullivan C, Kelly G. Multifidus muscle size and percentage
thickness changes among patients with unilateral chronic low back pain (CLBP)
and healthy controls in prone and standing. Man Ther 2014;19(5):433-439. doi:
10.1016/j.math.2014.04.009
56. Terry M, Goodman P. (2019) Hockey Anatomy. Champaign, IL: Human Kinetics.
32
57. Trompeter K, Fett D, Platen P. Prevalence of back pain in sports: A systematic
review of the literature. Sports Med 2017;47(6):1183-1207. doi: 10.1007/s40279-
016-0645-3.
58. van Dieën JH, Cholewicki J, Radebold A. Trunk muscle recruitment patterns in
patients with low back pain enhance the stability of the lumbar spine. Spine
2003;28(8), 834-841.
59. van Dieën JH, Selen LP, Cholewicki J. Trunk muscle activation in low-back pain
patients, an analysis of the literature. J Electromyogr Kinesiol 2003;13(4):333-
351.
60. van Rassel CR, Bewski NA, O'loughlin EK et al. Validity of electrical impedance
myography to estimate percent body fat: comparison to bio-electrical impedance
and dual-energy x-ray absorptiometry. J Sports Med Phys Fitness 2018;. doi:
10.23736/S0022-4707.18.08505-5. [Epub ahead of print]
61. Visser M, Goodpaster BH, Kritchevsky SB, et al. Muscle mass, muscle strength,
and muscle fat infiltration as predictors of incident mobility limitations in well-
functioning older persons. J Gerontol A Biol Sci Med Sci 2005;60(3):324-333.
62. Visser M, Kritchevsky SB, Goodpaster BH, et al. Leg muscle mass and
composition in relation to lower extremity performance in men and women aged
70 to 79: The health, aging and body composition study. J Am Geriatr Soc
2002;50(5):897-904.
63. Watson T, McPherson S, Starr K. The association of nutritional status and gender
with cross-sectional area of the multifidus muscle in establishing normative data.
J Man Manip Ther 2008;16(4):E93-98.

33
64. Wilke H, Wolf S, Claes LE, Arand M, Wiesend A. Stability increase of the
lumbar spine with different muscle groups: A biomechanical in vitro study. Spine.
1995;20(2):192-198.