ultrasonics as a method of as a method of bird control ... 4.1 efficacy testing of an ultrasonic...
TRANSCRIPT
WL-TR-92-3033 AD-A25 2 395ULTRASONICS AS A METHOD OFBIRD CONTROL
David M. HamershockAircrew Protection BranchVehicle Subsystems DivisionFlight Dynamics DirectorateWright LaboratoryWright-Patterson Air Force Base, Ohio 45433-6553
April 1992
Final Report for Period September 1991 - January 1992
DTICS [LECTE iJULO 7,1992,
Approved for public release; distribution is unlimited.
92-17462
FLIGHT DYNAMICS DIRECTORATEWRIGHT LABORATORYAIR FORCE SYSTEMS COMMANDWRIGHT-PATTERSON AIR FORCE BASE, OHIO 45433-6553

NOTICE
When Government drawings, specifications, or other data areused for any purpose other than in connection with a definitelyGovernment-related procurement, the United States Government incursno responsibility or any obligation whatsoever. The fact that thegovernment may have formulated or in any way supplied the saiddrawings, specifications, or other data, is not to be regarded byimplication, or otherwise in any manner construed, as licensing theholder, or any other person or corporation; or as conveying anyrights or permission to manufacture, use, or sell any patentedinvention that may in any way be related thereto.
This report is releasable to the National TechnicalInformation Service (NTIS). At NTIS, it will be available to thegeneral public, including foreign nations.
This technical report has been reviewed and is approved forpublication.
DAVID W. IAMERSHOCK,-2LT, USAF RALP$J. SPEELMAN, ChiefAircraft Flight Hazard Analyst Aircrew Protection Branch
FOR THE COMMANDER
RICHARD E. COLCLtGH .ChiefVehicle Subsystems Division
If your address has changed, if you wish to be removed fromour mailing list, or if the addressee is no longer employed by yourorganization please notify WL/FIVR, WPAFB, OH 45433-6553 to helpus maintain a current mailing list.
Copies of this report should not be returned unless return isrequired by security considerations, contractual obligations, ornotice on a specific document.

Form AppWovedREPORT DOCUMENTATION PAGE OMB No. 0704-0188
Puolic reporting burden for this oliection f rnformaton s .Timateo to ierage I hour per esporse. including the time for re ,iewing instructions. searchi ig existing data sources.gathering and raintAiling the data needed, and compIinrg andr rivoi the oliection of information Send comments reharding this burden estimate or any other aspect of thiscollection Of ritormation. ncludirg sugg estions for reduciny this ourir to ashington Heajouarters Services, Directorate or information Operations dno Reports, 1215 JeffersonDavis Highway, Suite 1204. Arlington. vA 22202-4302, ano to the Off, e )t Management and Budget. Paperwork Reduction Project (0704-0188). Washington, DC 20503
1. AGENCY USE ONLY (Leave blank) 2. REPORT DATE 3. REPORT TYPE AND DATES COVEREDI April 1992 FINAL: Sep 91 - Jan 92
4. TITLE AND SUBTITLE S. FUNDING NUMBERS
Ultrasonics as a Method of Bird Control PE-64212F
PR-1926TA-01
6. AUTHOR(S) WU-10
David M. Hamershock (513-255-6524)
7. PERFORMING ORGANIZATION NAME(S) AND ADDRESS(ES) 8. PERFORMING ORGANIZATION
REPORT NUMBER
Flight Dynamics Directorate (WL/FIVR)Wright LaboratoryWright-Patterson AFB OH 45433 WL-TR-92-3033
9. SPONSORING/ MONITORING AGENCY NAME(S) AND ADDRESS(ES) 10. SPONSORING/ MONITORINGAGENCY REPORT NUMBER
11. SUPPLEMENTARY NOTES
12a. DISTRIBUTION / AVAILABILITY STATEMENT 12b. DISTRIBUTION CODE
Approved for public release; distribution is unlimited.
13. ABSTRACT (Maximum 200 words)
The potential users of ultrasonic bird repelling devices (UBRDs) are many and
include: all branches of the military, airfield managers, biologists, pest
control/maintenance employees, government agencies (the Federal AviationAdministration, the US Department of Agriculture), agri-/aquaculturalists,aircraft manufacturers, and homeowners. A literature search conducted to findreports addressing the efficacy of UBRDs revealed several substantial efforts.This report compiles and presents the results of the literature search. Avian
hearing physiology, ultrasonic sound characteristics, and the physical effectsof ultrasonics on biological systems are addressed.
j14. SUBJECT TERMS 15. NUMBER OF PAGESSUltrasonics, Bird, Aircraft, Bird Strike, Collision Avoidance, 49
Bird Hearing, Bird Control, Ultrasonic Effects, Ultrasonic 16.PRICECODE
Research
17. SECURITY CLASSIFICATION 18. SECURITY CLASSIFICATION 19. SECURITY CLASSIFICATION 20. LIMITATION OF ABSTRACTOF REPORT OF THIS PAGE OF ABSTRACT
Unclassified Unclassified Unclassified Unlim:tei
NSN 7540-01.280-5500 Standard rorm 298 ,Rev 2 1
298-102
FOREWORD
This report was prepared by the Aircrew Protection Branch,
Vehicle Subsystems Division, Flight Dynamics Directorate, Wright
Laboratory, Wright-Patterson Air Force Base, Ohio. The effort
documented herein was performed in-house in support of the USAF
Windshield Systems Program Office, USAF Bird/Aircraft Strike
Hazard (BASH) Team, and other potential users of an effective
device for bird control. The report was written from September
to December 1991, by Lt David M. Hamershock, Aircraft Flight
Hazard Analyst, Windshield Systems Program Office.
A goal - che two organizations mentioned above is to find
solutions to reduce the potential for costly aircraft
birdstrikes. One approach to resolve the aircraft birdstrike
problem is to use ultrasonic sound to repel birds from the
aircraft flight path. A literature search accomplished to find
reports addressing the efficacy of ultrasonic bird repelling
devices (UBRDs) revealed that several substantial efforts have
been completed and that it would be of value to potential users
to consolidate the results. This report compiles and presents
the results of the literature search.
Aooeslon FporNTIS GRA&I
DTIC TAB 0Unannounced 0
Justification
ByDist___rlbutlo*/Availability Codes
Avalfazad/or
Not/ Speolal

Table of Contents
SECTION PAGE
1 Introduction ................................. 1
2 Ultrasonic Characteristics ................. 5
3 Bird Hearing Characteristics ............... 7
4 Experimental Summaries ...................... 12
4.1 Efficacy Testing of an UltrasonicBird Repelling Device ................ 12
4.2 Ineffectiveness of a Sonic Devicefor Deterring Starlings ................ 20
4.3 Effect of an Ultrasonic, Visual,and Sonic Devices on Pigeon Numbersin a Vacant Building ................. 27
5 Other Studies on Ultrasonics ............... 32
6 Conclusions .................................. 36
7 Recommendations ............................. 38
8 References ................................... 39
iv

List of Illustrations
FIGURE PAGE
1 Percentages of All US Air Force Aircraft 3Birdstrikes, by Phase of Flight Within theAirfield Environment and by Altitude(0 to 1000 ft AGL), from 1 Jan 85 to 30 Sep 91.
2 Ultrasonic Device Sound Output, Loud Pitch 14C-Mode; an Average of 100 Pulses were Measuredat 0.6 m.
3 Ultrasonic Device Sound Output, High Pitch 14C-Mode; an Average of 100 Pulses were Measuredat 0.6 m.
4 Study Plot for Starling Experiment with a Sonic 21Scarecrow, Canberra, Australia, 1987.
5 Sound Spectrogram of the Glide-tone Section (A) 24and the Pulsed Section (B) of the Signal Emittedby a Hi-tec Electronic Scarecrow in the LowerFrequency Ranges.
v

List of Tables
TABLE PAGE
1 Sonic Reception Range of Various Birds .......... 9
2 Average Feeding Time in Seconds by Species andTreatment Based on Approximately 100Observations Per Species Per Treatment .......... 16
3 Average Sunflower Seed Consumption (in ml) PerDay by Treatment .................................. 16
4 Average Number of Birds Arriving at the TestSite Per 10-min Interval ......................... 17
5 Numbers of Starlings and Remaining Apples andSlices of Bread, Averaged for Days and Fields,in an Experiment to Test the Effectiveness ofa Sonic Deterrent Device in Canberra,Australia, 1987 .. ................................. 25
Sound Level Responses From an Ultrason UET-360Taken with a B&K Sound Level Meter at 3 mBefore, During, and After an EvaluationConducted at Sandusky, Ohio, in October andNovember 1986 ..................................... 30
7 Mean Number of Pigeons Counted Leaving PowerHouse-i During Ultrason UET-360 Evaluation ...... 30
8 Researchers, Ultrasonic Frequencies, Birds, andResults of Experiments Testing the Performanceof Ultrasonic Bird Repelling Devices ............ 33
vi

List of Symbols, Abbreviations, and Acronyms
BASH Bird Aircraft Strike HazardC CelsiusF FahrenheitF F-factorMHz MegahertzHz HertzP ProbabilityUBRD Ultrasonic Bird Repelling DeviceUSAF Unites States Air ForceW Wattscm Centimeterscps Cycles Per Second (cps = Hz)dB Decibelsdf Degrees of Freedomkg KilogramskHz Kilohertzm Metersmin Minutess Seconds> More Than< Less Than
vii

SECTION 1
INTRODUCTION
A goal of the USAF Windshield Systems Program Office and the
United States Air Force (USAF) Bird Aircraft Strike Hazard (BASH)
Team is to find methods of reducing the potential for aircraft
birdstrikes. One technique used to resolve the aircraft
birdstrike problem is to use ultrasonic sound to repel birds from
the aircraft flight path. A literature accomplished to find
reports addressing the efficacy of ultrasonic bird repelling
devices (UBRDs) revealed that substantial efforts have been
completed and that it would be of value to potential users to
combine the results.
The objective of this report is to assist potential users of
UBRDs by providing a principal source of information addressing
their efficacy. Potential users of an effective UBRD are many
and include: all branches of the military, airfield managers,
biologists, pest control/maintenance employees, government
agencies (the Federal Aviation Administration, the US Department
of Agriculture), agri-/aquaculturalists, aircraft manufacturers,
and homeowners.
The USAF, one potential user of an effective UBRD, could
repel birds from the airfield environment, preventing hazards to
aircraft and saving millions of dollars per year. Inhibiting
birds from nesting and roosting around static aircraft, aircraft
hangars and facilities where they cause disturbing noise,
maintenance, corrosion and health problems also can result in
1

saving the USAF money. Since 1987, the USAF has lost six lives,
and averaged a loss of $65 million for 3500 aircraft birdstrikes
each year (Ron Merritt, USAF BASH Team). Of reported USAF
aircraft birdstrikes 60.3% occur in the airfield environment
(Fred Samec, USAF BASH Team [Figure 1]); therefore, finding a
method that w:.ll lower or evacuate bird populations from the
airfield environment is desirable to the USAF.
USAF safety, pest control, base operations, and airfield
maintenance personnel often seek methods of repulsing birds from
presenting problems to aircraft, airfields, and base facilities.
The use of ultrasonics was identified as a possible means of
keeping birds away from base facilities or warning them of the
approach of an aircraft. If UBRDs can control birds, then US Air
Force base bird control and aircraft birdstrike problems could be
reduced throuqh their applications.
UBRD manufacturers characterize their products as a
"scientifically sound, humane, inexpensive, and easy to operate"
(Bomford and O'Brien 1990) means of deterring birds from
inhabiting areas desirable to them. Some UBRD manufacturers also
maintain that their mechanisms create unbearable physical stress
to a birds' entire body, thereby forcing the bird to flee from
the treated area. From medical research, we know something about
the possible damaging effects of ultrasonic sound on living
organisms at the cellular and tissue levels (Gordon 1967a), but
the actual behavioral effects to birds are unknown except for
claims advertised by UBRD manufacturers. Bird-X Inc. (730 West Lake
2

I-L
LV L
LL.
LLCJ
07
L- CI
cIz
0..- C '
04>Lco CL
0 C
U >%f co Lo
30

Street, Chicago, Illinois 60606) advertisements claim that their
UBRDs emit sounds that are: "Physically harmless, but birds
can't stand them . . ., modulations birds can't get used to,
annoying, [butj can't injure birds . . ., [and] pitched exactly
where they provide intense discomfort to most types of roosting
birds."
It was the intent of this effort to establish a validated
basis for accepting the manufacturers' assertions. The search
for background material resulted in identifying a substantial
diversity of investigations that makes further research at this
time of questionable value.
4

SECTION 2
ULTRASONIC CHARACTERISTICS
Any sounds over 20,000 Hertz (Hz) or cycles per second (cps)
are designated ultrasonic. Bird sensitivities range from 0.05-
29,000 Hz depending upon the species. Human (Homo sapien)
sensitivity to sound is normally 16-24000 Hz (Brand and Kellogg
1939; Kreithen and Quine 1979; Schwartzkopff 1955a). Ultrasonic
sounds, travel at 340 m/s at mean sea level, 150C (590F), and a
density of 1.23 kg/m3 (Kuethe and Chow 1986; Blitz 1967). Under
the right conditions there is the potential for UBRDs to repulse
birds, given the known damaging effects that ultrasonics can
incur.
Ultrasonic sound can create heat, chemical effects,
radiation pressure, and nerve disruption within living cells and
tissues. Collectively, these effects can cause lethal cell
damages. Heat can be produced by ultrasound when it is of high
frequency (approaching 1 MHz) and is focused. The heat can reach
an intensity that can cause damage to cell components resulting
in cell dissolution (Gordon 1967a).
Radiation pressure effects cause "streaming" (rapid fluid
movement) within cells that in turn has a part in cell necrosis.
Cell necrosis (destruction) can occur because of the rupturing of
mitochondria (organelles within the cell responsible for
converting energy to a form more usable to the cell) caused by
ultrasonic irradiation during electron microscopy. The
mitochondria break up, releasing molecules lethal to other
5

components of the cell.
Chemicals effect biological entities when combined with
ultrasonic irradiation by chemical reaction rates being
accelerated to a point where the cell is chemically suffocated
and is damaged (Gordon 1967a). Mutations to bird embryos have
resulted from ultrasonic treatment to eggs during incubation
(Gordon 1967b).
The greatest effects of ultrasonic sounds are on nerve
tissues, since nerve impulses can be blocked along nerve fibers.
Permanent damage can result, causing loss of function of the
parts of the organism for which the nerves have control. These
effects occur in living tissues when ultrasound is applied at
frequencies of 1-3 MHz from highly directional sources at
extremely close distances (Gordon 1967a).
Ultrasound at levels above 140 dB has many effects upon
humans. A loss of hearing sensitivity (temporary or permanent),
pain, and sickness can result from conctant or periodic
exposure(s) (Beuter and Weiss 1986). We can infer that birds
also have a threshold of intensity they can withstand before
similar physical effects occur.
6

SECTION 3
BIRD HEARING CHARACTERISTICS
Birds have an extraordinary sensitivity to sound. They have
evolved with superior hearing ability to adapt to the higher
levels of performance necessary to communicate, hunt, and
navigate while in flight. Bird hearing requirements include
excellent absolute hearing sensitivity, frequency perception, and
time perception (Thorpe 1961). Optimum hearing performance for
most bird species is achieved between 1,000 and 4000 Hz (Table
1). Upper limit hearing sensitivity can approach 30,000 Hz in
some species (Meyer 1986). Most bird species do not exhibit
significant hearing capabilities within the ultrasonic range
(Schwartzkopff 1968).
In most cases, birds have greater hearing ability than
humans. Birds can discriminate sonic frequency changes 10 times
faster than man (Pumphrey 1961) and some (song birds) can produce
and discern two modulated sounds or "notes" simultaneously. To
the human ear these modulations sound like one note (Greenewalt
1968). Dooling and Searcy (1985) found that Budgerigars
(Melopsittacus undulatus) have greater ability than humans to
determine changes in frequencies. As occurs in humans, European
Starling, House Sparrow (Passer domesticus), and Rock Dove/Pigeon
(Columba livia) sound sensitivities decrease as they approach
their upper frequency limit (Brand and Kellogg 1939).
Pigeons have exceptional low-frequency (infrasound)
perception. Frequencies as low as 0.05 Hz have been discerned by
7

pigeons in a sound-isolated chamber. Doppler shift studies by
Quine and Kreithen (1981) showed that Pigeons could detect a 1%
frequency shift at 20 Hz and a 7% shift at 1 Hz. Infrasounds are
produced by natural events such as thunderstorms, earthquakes,
auroras, ocean waves, and mountain ranges; therefore, Pigeons may
use these infrasound abilities to aide in navigation and weather
perception (Kreithen and Quine 1979).
8

Table 1. Sonic reception range of various birds.
Lower Most Upperlimit sensitive limit
Species (Hz) (Hz) (Hz) Reference
Mallard 300 2000- 8000 TrainerAnas platyrhynchos 3000 (1946)
Canvasback 190 5200 MeyerAythya valisineria (1986)
Rock Dove/Pigeon 12000 WassiljewColumba livia (1933)
50 1800- 11500 Wever & Bray2400 (1936)
200 7500 Brand & Kell-ogg (1939)
300 1000- 5800 Trainer2000 (1946)
300 1000- 5500 Heise4000 (1953)
5600 Stebbins(1970)
7300 Harrison & Fu-rumoto (1971)
5600 Heinz, et al(1977)
0.05 Kreithen &Quine (1979)
5 8000 Beuter &Weiss (1986)
Turkey 6600 Maiorana & Sc-Meleagris gallopavo hleidt (1972)
Barn Owl 12500 KonishiTyto alba (1973)
Long-eared Owl 100 6000 18000 SchwartzkopffAsio atus (1955a)
Great Horned Owl 60 7000 MeyerBubo virginianus (1986)
7000 Trainer (1946)
Eagle Owl 60 1000 8000 TrainerBubo bubo (1946)
Greenfinch 20000 GranitChloris chloris (1941)
European Robin 21000 GranitErithacus rubecula (1941)
9

Table 1. sonic reception range of various birds (continued).
Low. Most Upperlrn, sensitive limit
Species (Hz) (Hz) (Hz) Reference
American Crow 300 1000- 8000 TrainerCorvus 2000 (1946)bra chyrhyn chos
American Kestrel 300 2000 10000 TrainerFalco sparverius (1946)
____ _______ 7400 Dooling (1982)
Chaffinch 200 3200 29000 SchwartzkopffFringilla coelebs ___ _________ (1955a)
Ring-billed Gull 100 500- 3000 SchwartzkopffLarus delawaren 800 (1973)
Red Crossbill 20000 KnechtLoxia curvirostra ____ (1940)
Budgerigar 40 2000 14000 KnechtMellopsittacus (1940)undulatus 1800- 10000 Dooling & Sau-
3800 nders (1975)
Horned Lark 350 7600 MeyerEremophila alpestris ___ _________ (1986)
House Finch 7200 Dooling, etCarpadacus mexicanus al. (1978)
House Sparrow 675 11500 Brand & Kell-Passer domesticus ogg (1939)
18000 Granit(1941)
675 18000 Summners-Smith____ ___ ____ ___ ____ _______ ___ (1963)
Brown-headed Cowbird 9700 Heinz, et al.Molothrus ater ____ (1977)
Red-winged Blackbird 9600 Heinz, et al.Agelalus phoniceus _ ____ ____ (1977)
Field Sparrow 11000 Dooling, etSpizella pusilla _ ____ ____al. (1977)
Ring-necked Pheasant 250 10500 MeyerPhasianus coichicus _______ (1986)
Black-billed Magpie 100 800- 21000 SchwartzkopffPica pica ___ 1600 (1955a)
Snow Bunting 400 7200 MeyerP1 ectrophenax (1986)nivalis ____________
10

Table 1. Sonic reception range of various birds (continued).
Low. Most Upperlrn. sensitive limit
Species (Hz) (Hz) (Hz) Reference
Bullfinch 21000 GranitPyr-rhula pyrrhula (1941)
100 3200 Schwartzkopff(1949)
200 3200 25000 Schwartzkopff____ ____ ____ ___ ____ _ _____(1952)
Canary 1100 10000 MeyerSerinus canaria (1986)
250 2800 9600 Dooling,____ ____ ____ ____ __ _ ___et al. (1971)
Cape Penguin 100 600- 15000 Meyer (1c_86)Spheniscus demersus 4000
Tawny Owl 100 3000- 21000 SchwartzkopffStrix aluco 6000 ____ (1955a)
Gull 50 12000 Beuter &(Species unknown) ___ _________ Weiss (1986)
Blue Jay 7800 Cohen, et al.Cyanocitta cristata _______ (1978)
European Starling 700 15000 Brand & Kell-Sturnus vulgaris ogg (1939)
2000 Trainer(1946)
____8700 Dooling (1982)
11A

SECTION 4
EXPERIMENTAL SUMMARIES
4.1 EXPERIMENTAL SUMMARY 1 1
Efficacy Testing of an Ultrasonic Bird Repeller
Richard E. Griffiths (1987)
MATERIALS AND METHODS
Phase 1. Selected two areas with high levels of bird
activity. Baited one area and observed it until bird feeding
levels off. Recorded number of birds, species composition, and
duration of visits for 5 days. Actuated the ultrasonic device,
and recorded bird data until their behavior stabilized. Repeated
for the second area, without the ultrasonic device, to provide a
control. A decrease in recorded activities suggested repellency.
No change suggested ineffectiveness. A change in, followed by a
return to, normal behavior signified habituation.
Phase 2. Repeated Phase 1, except used two other study
sites and used the ultrasonic device before baiting.
Phase 3. Repeated Phase 1, except used two other study
sites and moved the ultrasonic device from the treatment to the
control site after a sufficient amount of time.
A 10-minute sampling interval was chosen. Observations were
randomly accomplished during daylight hours. Feeding time was
measured by timing randomly selected individual birds from the
time they arrived at the test site to the time they departed.
12

Sunflower seeds were inserted into cylindrical plastic bird
feeders as bait. The feeders were 6 cm in diameter, 40 cm long,
and hung from tree limbs approximately 2 m above the ground.
Seed consumption was determined by measuring the height of the
seeds remaining in the feeders at dusk each day and subtracting
their volume from the total capacity of the feeder.
The UBRD used, manufactured by Bird-X, Inc. (730 West Lake
Street, Chicago, IL), could produce a complex mixture of sonic
and ultrasonic sounds. It was a small (8 x 8 x 12 cm) aluminum
box with a pulsed output in three ranges: 5 to 50 kHz (low
pitch), 1 to 50 kHz (loud pitch), and 20 to 50 kHz (high pitch).
It had an average peak output of 112 dB measured at 0.3 m. It
also had settings for what the manufacturer called a "high rate
modulation frequency" (mode) at 0 Hz (A), 1 kHz (B), and 4 kHz
(C) for a total of nine possible sound outputs. Graphic
representations of the principal sound outputs tested (high
pitch-C mode and loud pitch-C mode) as measured by a model 660B
Nicolet analyzer are shown (Figs. 2 and 3). The manufacturer's
instructions claimed effective outdoor coverage within an area 30
m long and 22 m wide.
Phase 1 test sites were baited in mid-October 1985.
In mid-November the ultrasonic device was activated, the high
pitch-C mode tested first and the loud pitch-C mode second.
The ultrasonic device was placed 9 m from the feeders.
At the Phase 2 test sites, the ultrasonic device was
activated in early October 1985. The feeders were baited 2 weeks
13

later The ultrasonic device was placed 3 m from the feeder.
Phase 1 type tests (bait before ultrasonics added) were completed
;10 I RI
LOUD pitch
C mode
Vv! I
0 25 KHZ 5 <HZ
Fig. 2. Ultrasonic device sound output, loud pitch C-mode; anaverage of 100 pulses were measured at 0.6 m.
I AR
HIGH pitch
C mod*
soI0 2S KHZ SO KHZ
Fig. 3. Ultrasonic device sound output, high pitch C-mode; an
average of 100 pulses were measured at 0.6 m.
14
in January and February 1986 at this site. The treated and
controlled site observations were made alternately.
Phases 1 and 2 were both conducted in forest-edge
habitat in northeastern Maryland. Both phases did not consider
the occurrence of individual birds leaving and returning the test
areas during observation periods.
Phase 3 testing was completed using high, low, and loud
pitches in the A, B, and C modes at a southeastern Virginia
warehouse site in June 1985. House Sparrows (Passer domesticus)
were tested that were perching on electrical wires before
entering the warehouse. No baiting was executed.
RESULTS
Species recorded feeding at the Phase 1 and 2 test sites
included the House Finch (Carpodacus mexicanus), Dark-eyed Junco
(Junco hyemalis), White-breasted Nuthatch (Sitta carolinensis),
Tufted Titmouse (Parus bicolor), Black-capped Chickadee (Parus
atricapillus), and Blue Jay (Cyanocitta cristata).
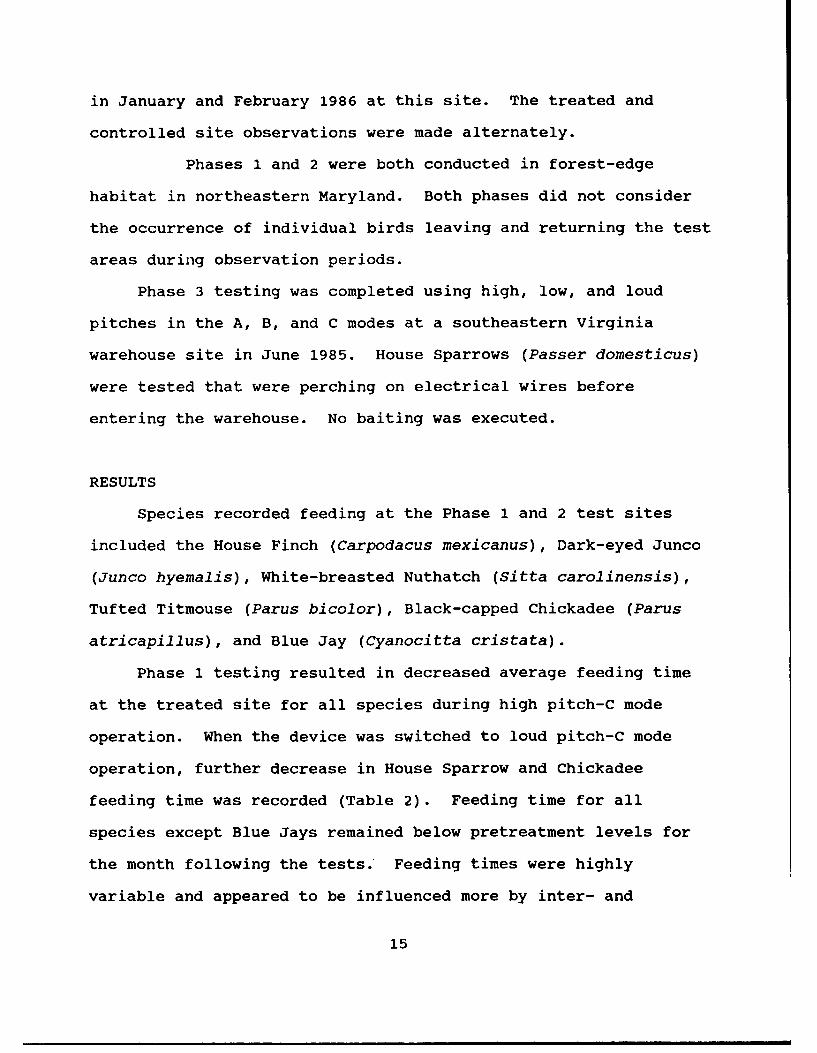
Phase 1 testing resulted in decreased average feeding time
at the treated site for all species during high pitch-C mode
operation. When the device was switched to loud pitch-C mode
operation, further decrease in House Sparrow and Chickadee
feeding time was recorded (Table 2). Feeding time for all
species except Blue Jays remained below pretreatment levels for
the month following the tests. Feeding times were highly
variable and appeared to be influenced more by inter- and
15

intraspecies conflicts than by the ultrasonic device. Food
consumption was not affected by either treatment (P = 0.356
[Table 3]), and the number of birds visiting the site increased
(P = 0.042 [Table 4]). Control site measurements remained
constant. Effects of weather changes were constant at both
treatment and control sites.
Table 2. Average feeding time in seconds by species andtreatment based on approximately 100 observations per species pertreatment.
TreatmentPre- High Loud Post- Control
treatment C C treatmentSpecies (Nov) (Dec 1-10) (Dec 12-25) (Jan) (Nov-Jan)
H. Finch 50 40 23 12 31
Junco 112 48 i1l 45 28
Chickadee 4 3 2 3 12
Nuthatch 16 5 10 2 21
Blue Jay 7 3 4 10 8
Table 3. Average sunflower seed consumption (in ml) per day bytreatment.
TreatmentPretreatment High C Loud C Posttreatment
Location (Nov) (Dec 1-10) (Dec 12-25) (Jan)
Test 1872 1954 2098 1230Site
Control 1015 1260 1153 1276Site _ IIIIj
16

Table 4. Average number of birds arriving at the test site perlO-min interval.
TreatmentPost- High Loud Post- Control
Principal treatment C C treatmentSpecies (Nov) (Dec 1-10) (Dec 12-25) (Jan) (Nov-Jan)
H. Finch 61.6 69.9 91.5 54.0 12.8
Junco 5.6 6.4 5.1 10.2 3.8
Chickadee 3.2 3.3 3.6 2.2 7.9
Nuthatch 0.1 0.8 2.3 2.3 1.9
Blue Jay 0.3 1.4 2.6 6.3 17.6
All *Species 70 82 105 79 48* Principal and occasional species.
Phase 2 activity and seed consumption levels were initially
lowered after high pitch-C mode treatment commenced, however, the
discrepancies disappeared over time. The mixed sonic-ultrasonic
mode (P = 0.014) resulted in less bird visitation than the all
ultrasonic mode (P = 0.037). The ultrasonic device was not moved
during testing. The same birds had access to both the treated
and control sites. Phase 3 testing resulted in no differences in
House Sparrow activity. Observed head movements indicated that
they could perceive the low and loud pitches. Some House
Sparrows even approached the device (from the side, not in front
of the output speaker) to investigate it.
17

DISCUSSION AND CONCLUSIONS
Of all the sites and sonic combinations tested, the bird
visitation rate was markedly affected only during the sonic-
ultrasonic paired treatment. Neither the ultrasonic mode (above
20,000 Hz) or the ultrasonic/audible mode (1 to 50,000 Hz)
significantly affected any of the species studied. The results
indicate that the ultrasonic device would not work to keep the
studied bird species away from an area attractive to them.
Activation of the ultrasonic device prior to the baiting of
the feeder resulted in initial deterrence; however, once bait was
available bird activity escalated. When control and test sites
were interchanged the activity/seed consumption level remained
constant.
Recording the duration of feeding efforts was obscured by
the occurrence of inter- and intraspecies interaction. Blue Jays
frightened away all other birds, and sizable concentrations of
finches deterred chickadees. House Finch feeding times inversely
affected visitation rates. The decline of feeding time in
January could have been caused, in part, by increased Blue Jay
presence.
The use of time lapse photography would be useful for future
experiments of this type. Greater accuracy, less required labor
and fewer necessary funds would result.
It is doubtful that the tested device or other devices with
like sound output can deter the studied bird species from
inhabiting attractive areas. Unless further tests provide more
18

favorable bird repelling results, the tested ultrasonic device is
not recommendable (Griffiths 1987).
19

4.2 EXPERIMENTAL SUMMARY # 2
INEFFECTIVENESS OF A SONIC DEVICE FOR DETERRING STARLINGS
MARY BOMFORD (1990)
MATERIALS AND METHODS
A small test area, without obstacles, was selected to
provide an area without sound shadows. A 150-m-circular area
within a grassy field in Canberra, Australia was utilized. A 7-
m-high blind was at the midpoint (Fig. 4). The circle was
divided by ribbons on pegs into 12 (30 degree) segments.
Alternate divisions and a concentric inner circle (50-m radius
from the midpoint) were selected as buffer zones. All the test
area was either flat or gently sloping, therefore, easily visible
from the blind. The grass was mowed upon commencement of the
experiment (10 Apr 87).
Treated, buffer, and untreated (control) divisions were
alternated around the circle. The ultrasonic device speakers
were placed at the inner margins of the three treated divisions.
Each division was divided into two parts: 50 m to 112 m and 112
m to 150 m (from the midpoint). These two subdivisions had areas
of 2630 and 2607 (square meters), respectively.
The (Model 825) Hi-tec Electronic Scarecrow (Hi-tec Control
Syst. Propriety Ltd., Australia) was erected by a company
representative on 30 Apr 87. The scarecrow consisted of a
control unit with a programmable timer to which a number of
20

E0)
00
w) Z- 0 CZ )L~ -~
0)
E.
~C
0cl '0)=
$l X C
21-

remote speaker units were connected. The individual speaker
units had 5 vertically mounted transducer heads producing the
ultrasonic sound. Power was provided by a 12-volt long storage
battery recharged by 2 (42 W) solar panels. Each speaker unit,
held 1 m above the ground by a steel post, was focused toward the
perimeter, along the central axes of each treated division.
Barriers 2 m high, 0.4 m thick, and 5 m long made out of hay-
bales were constructed behind and beside each speaker to restrict
the ultrasonic sound dispersal to only the desired divisions.
According to the manufacturer, each speaker will protect 4
hectares (nearly 8 times the area of one division). The
automatic timer was set to operate the control unit from 0600 to
1800 each day. The sonic output of each speaker was measured
using a sonograph (Kay digital sonograph 7800, Pine Brook, New
Jersey).
Feeding quadrats (4 square meters each), with fruit and
stale bread (bait) dispersed within, were 30 m from the inner
margin of each subdivision. Bait placement from 13-23 Apr 87
served to interest European Starlings into the study area and to
practice counting them. From 24 Apr-17 May 87, at 0900 each day,
fresh bait consisting of 10 slices of white bread and 10 red
apples (halved) were placed within each quadrat. At 1600 each
day, bait remaining within each quadrat was collected and
quantified to the nearest half (slice of bread or apple).
Individual starlings were counted, from the blind, using 10
x 40 binoculars. Large groups were approximated by "10, 20, or
22

50." Starting 24 Sep 87, counts were taken each day from 1500-
1600. Each division was enumerated at 1 minute intervals;
therefore, the 12 divisions were counted 60 times within the
hour. On 6 May 87 the scarecrow was turned on and the counting
continued through 17 May 87.
Three response variables were measured: Starling numbers,
remaining apples, and remaining bread. The data was analyzed by
a three factor analysis of variance including scarecrow (with and
without divisions), distance (near and far divisions), and period
(pretreatment and treatment) as factors. Before analysis, the
data was averaged for the pretreatment and treatment periods.
Plots of residuals for the three response variables (compared to
an ordered distribution generated by the "GLIM" statistical
package [Payne 1986]) were found to be normally distributed.
RESULTS
The ultrasonic signal emitted from each speaker was highly
directional in the vertical plane, encompass the entire 32 kHz
range of the sonograph (a substantial amount of it above 16 kHz,
the usual upper auditory limit for starlings [Schwartzkopff
1955a, Frings and Cook 1964, Spear 1966]), and consist of a
complex 6 second glide tone followed by 10 seconds of pulsed
bands at several frequencies (Fig. 5). The glide/pulse sequence
repeated continuously with frequency and pattern varying slightly
each time.
Microphone readings taken in front of a speaker found the
23

A. a
6
CY - -? o
0 ".
Time (sec) 0.0 0.5 1.0 1.5 2.0 2.5
10
0 . *.oE. .V - ... *. - -.......
I , I I
TImg (See) 00 025 05 075 10 1 25
Fig. 5. Sound spectrogram of the glide-tone section (A) andpulsed section (B) of the signal emitted by a Hi-tec ElectronicScarecrow in the lower frequency ranges. Note that the timescale differs for the two records.
discharged sound to average 91 dB at 10 m, 76 dB at 30 m, and <71
dB at 50 m (by the 50 m point ambient sounds coming from a road
and a research station 600 m away proved more intense).
Starlings feeding when the scarecrow was first operated did
not appear startled, alarmed, or more alert. None of the birds
evacuated immediately from the treated divisions. Within 5
minutes a flock of >500 starlings alighted and began feeding in
front of a speaker. During the treatment period, starlings often
24

alighted within 1 or 2 m of the speakers to feed. In comparison,
when a helicopter, or bird of prey flew over, or a person
approached, the birds would take off, delivering audible
alarm calls.
Starling numbers increased over the course of the experiment
(Table 5) and were highest while the treatment period was being
conducted (F = 6.40; 1,16 df; P = 0.022). During the treatment
period, no significant differences in numbers between near and
Table 5. Numbers of starlings and remaining apples and slices ofbread, averaged for days and fields, in an experiment to test theeffectiveness of a sonic deterrent device in Canberra, Australia,1987.
Number of Number of Number ofstarlings apples bread slices
Treatment (n = 3) x SE x SE x SE
Treated segmentsPretreatmentperiod
Near fields 793 195.5 7.5 0.23 3.3 0.40Far fields 1307 368.9 6.2 0.93 2.8 0.93
Treatmentperiod
Near fields 1705 147.8 2.9 0.74 1.7 0.47Far fields 1586 218.2 2.7 0.54 1.3 0.64
Untreated segmentsPretreatmentperiod
Near fields 997 119.0 6.2 0.66 3.0 0.39Far fields 1001 292.9 6.4 0.87 2.8 0.35
Treatmentperiod
Near fields 1638 321.5 2.6 0.54 1.2 0.42Far fields 1197 360.6 3.0 0.86 1.6 0.72
25

far divisions (F = 0.0005; 1,16 df; P = 0.98) or treated and
untreated divisions (F = 0.63; 1,16 df; P = 0.44) occurred.
Other bird species occasioned all divisions and sometimes
took bread: Australian Magpies (Gymnorhina tibicen), Australian
Ravens (Corvus coronoides), and White-winged Choughs (Corocorax
melanorhamphus). The number of non-starlings inside the test
boundaries never exceeded 10 individuals, and was usually <5,
compared to an average of 256 starlings; therefore, feeding by
other species should not have biased food removal assessments.
Fewer bread slices (F = 13.72; 1,16 df; P = 0.002) and
apples (F = 55.31; 1,16 df; P < 0.001) remained during the
treatment period than during the pretreatment period. During the
treatment period, no significant differences (P > 0.59) in food
amounts remaining between near and far divisions or treated and
untreated divisions occurred.
CONCLUSIONS
The Hi-tec Electronic Scarecrow had no effect on the number
of and the quantity of food eaten by starlings visiting the three
treated divisions. In the treatment period, starling numbers
were 57% higher than the pretreatment period. Flocks of
starlings flew through treated divisions to feeding quadrats
without apparent hesitation or avoidance behavior (Bomford 1990).
26
4.3 EXPERIMENTAL SUMMARY 1 3
EFFECT OF ULTRASONIC, VISUAL, AND SONIC DEVICES ON PIGEON NUMBERSIN A VACANT BUILDING
PAUL P. WORONECKI (1988)
MATERIALS AND METHODS
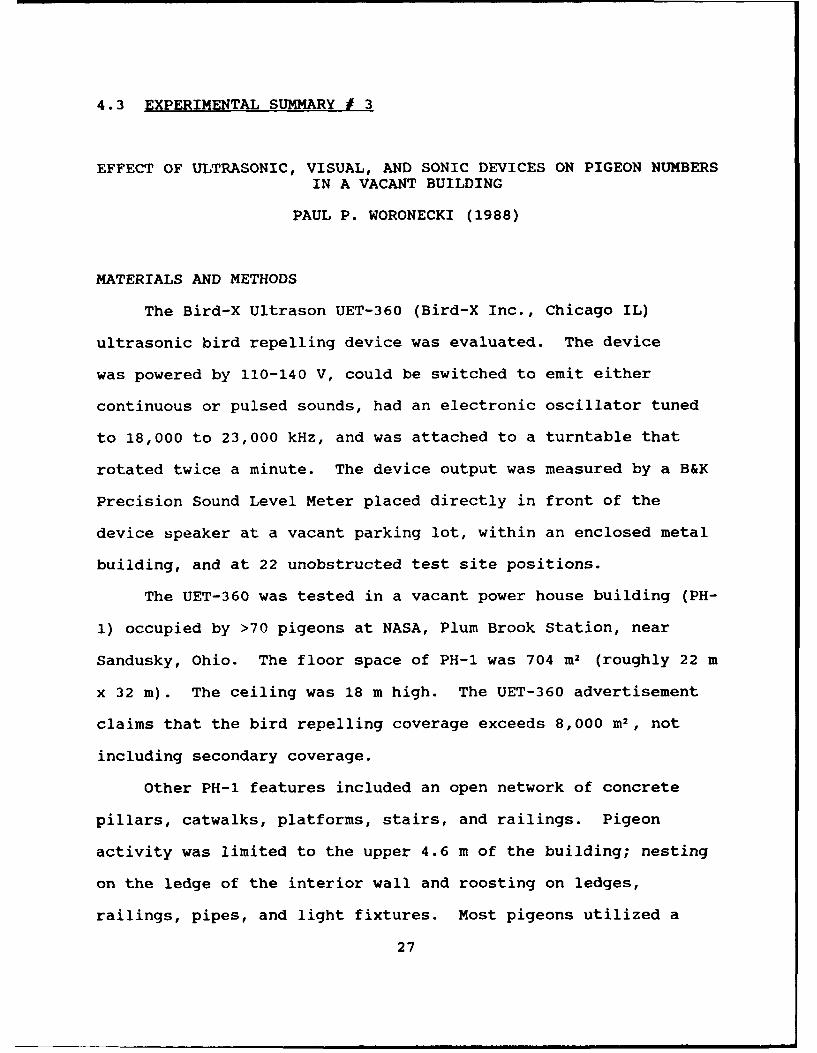
The Bird-X Ultrason UET-360 (Bird-X Inc., Chicago IL)
ultrasonic bird repelling device was evaluated. The device
was powered by 110-140 V, could be switched to emit either
continuous or pulsed sounds, had an electronic oscillator tuned
to 18,000 to 23,000 kHz, and was attached to a turntable that
rotated twice a minute. The device output was measured by a B&K
Precision Sound Level Meter placed directly in front of the
device speaker at a vacant parking lot, within an enclosed metal
building, and at 22 unobstructed test site positions.
The UET-360 was tested in a vacant power house building (PH-
1) occupied by >70 pigeons at NASA, Plum Brook Station, near
Sandusky, Ohio. The floor space of PH-I was 704 m2 (roughly 22 m
x 32 m). The ceiling was 18 m high. The UET-360 advertisement
claims that the bird repelling coverage exceeds 8,000 M 2 , not
including secondary coverage.
Other PH-i features included an open network of concrete
pillars, catwalks, platforms, stairs, and railings. Pigeon
activity was limited to the upper 4.6 m of the building; nesting
on the ledge of the interior wall and roosting on ledges,
railings, pipes, and light fixtures. Most pigeons utilized a
27

broken window at the southwest corner as an entrance and exit,
which provided for a simple and accurate census.
The UET-360 was suspended by chains and cable 4.6 m from the
ceiling. The device was 7.3 m from (and at the same elevation
as) the ledge utilized for nesting, and 11.9, 7.3, and 18.6 m
from the walls.
Testing was accomplished 8 Oct-26 Nov 86. The number of
pigeons inhabiting PH-l was counted by one person approaching the
building's southwest corner (starting 46 m away). Birds leaving
from and perched/nested inside the buil~ing were counted as the
counter approached and entered the building. Nesting activity
was also noted. These counts were made between 0730 and 1000 at
least three times a week. Additional inspections were made at
times other than scheduled to make note of any behavioral or
activity changes resulting from the device.
The UET-360 was installed according to manufacturers
instructions, therefore, all nests (including eggs, nestlings,
and non-flying young) were removed before testing. The device
was operated continuously for 20 days (20 Oct-7 Nov 86); 10 days
pulsed output and 10 days continuous output. Sound output was
measured again. The device was then switched off and pigeon
numbers continued to be recorded for 10 more days.
RESULTS
The continuous output was 19.2 kHz, with a slight amplitude
modulation at 120 Hz. The device emitted 79 pulses per minute
28

during the pulsed output at frequencies of 20-26 kHz. Sound
level measurements taken at a distance of 3 m before, during, and
after the experiment yielded similar results. The impulse sound
levels were approximately 5 dB lower. The peak sound level
measurements, taken at 22 locations inside PH-I at distances of 3
to 28 m, varied from 73-98 dB. Levels in the area of pigeon
roosting and nesting activity ranged from 73-98 dB for the pulsed
output and 84-98 dB for the continuous output. In areas of PH-I
where the device was not visible, background levels from 70-73 dB
were recorded. Sound pressure wave measurements revealed that
the ultrasonic signals wcre easily shadowed by objects and that
there were areas wjtr n PH-I where the pigeons could easily elude
the sounds.
A 10-day pretreatment period (8-17 Oct 91) of counts
resulted in an average of 64 pigeons per observation (Table 7).
An 11-day pretreatment period (18-28 Oct 91) testing the impact
of nest removal and UET-360 presence (without being turned on)
upon the PH-I pigeon population, resulting in an average of 66
pigeons per observation.
UET-360 output in the "continuous" mode began on 29 Oct 91
at 0940 and lasted until 7 Nov 91. After the device was turned
on (from a switch outside the building) 10 pigeons left the
building within the first 15 minutes. An average of 75 pigeons
were present per observation.
The "pulsed" mode, was tested from 8-17 Nov 91. No change
in pigeon presence was noticed as there was an average of 73
29

Table 6. Sound level responses from an Ultrason UET-360 takenwith a B&K Sound Level Meter at 3 m before, during, and after anevaluation conducted at Sandusky, Ohio, in October and November1986.
Sound level (decibels)Continuous Pulsed
Location Impulse Peak Impulse Peak
DWRC 95 101 96 101(parkinglot) _
Sandusky 100 101(metalbuilding)
Sandusky 96 98(PowerHouse-l)
Table 7. Mean number of pigeons counted leaving Power House-iduring Ultrason UET-360 evaluation.
Dates Treatment Number of PiQeons No. of
Period x SD Range Observ.
8-17 Oct Pretreatment 64 8.2 52-73 5
18-28 Oct (b) Pretreatment 66 21.0 31-89 7
29 Oct-7 Nov Ultrasonic- 75 15.1 48-92 6Continuous
8-17 Nov Ultrasonic- 73 15.3 55-93 5Pulsed
18-26 Nov Posttreatment 71 16.7 51-93 7
pigeons per observation. Four nests had been reconstructedduring
the treatment periods, 7.3-20.4 m from the UET-360. Eggs were
fuund in the 4 nests when checked on 11 Nov 91 and by 17 Nov a
30

total of 8 eggs were being incubated.
During a 10-day posttreatment period, from 18-26 Nov 91, an
average of 71 pigeons were observed. Two eggs had hatched by 26
Nov 91.
DISCUSSION AND CONCLUSIONS
The Ultrason UET-360 invoked neither an initial fright
response, nor any reduction in pigeon numbers during the two 10-
day treatment periods. Pigeons fabricated nests, laid eggs, and
incubated eggs 7.3-20.4 m from the device.
A sonic device, the Deva-Megastrcos !I, and a visual device,
the Deva-Spinning Eyes (both manufactured by Brakam Miller,
Saltney Engineering Limited) both had some effect on pigeon
numbers when tested within PH-I. The sonic device reduced
numbers for 2 of 10 days, whereas the spinning eyes had repelling
effects for only the first of 10 days.
The UET-360 failed to reduce the population, alter the
behavior, and stop the nesting activity of pigeons within a
vacant building. This study demonstrates that ultrasonic devices
are ineffective in reducing pigeon populations (Woronecki 1988).
31

SECTION 5
OTHER STUDIES ON ULTRASONICS
Meylan (1978) conducted an "ultrasonic" experiment resulting
in high levels of bird repelling success. From mid-August to
mid-September 1977, Meylan tested an ultrasonic device in a
sunflower field in Switzerland. Damage to the crop was 40% less
than normal during device operation. House Sparrows and Tree
Sparrows (Passer montanus) disappeared completely. Greenfinches
(Cardeulis cardeulis) visited the crop singly and only for short
time intervals during device operation. After the device was
turned off the greenfinches again fed "gregariously," and within
a few days the crop was heavily damaged. The sound produced by
the device consisted of 1 second pulses at 16,776 Hz (Table 8).
This frequency level is approximately 3300 Hz below the
"ultrasonic" range (Griffiths 1987). Meylan includes no
description of his materials and methods to give greater
credibility to his experiment. Important factors such as
weather, migration, and other available food sources were not
included.
Fitzwater (1970) described his experiences using ultrasonic
bird repelling devices as "discouraging." He found that
ultrasonic devices are expensive to purchase and operate, produce
"sound shadows" (leaving areas untreated), and produce sounds
that decrease rapidly in magnitude once they leave the source.
Martin and Martin (1984) researched the effects of
ultrasound upon cormorants, gulls, and pigeons. The tested birds
32

Table 8. Researchers, ultrasonic frequencies, birds, and resultsof experiments testing the performance of ultrasonic birdrepelling devices.
FrequencyResearcher (kHz) Bird(s) Tested Results
Beuter & 20-50 Gull No effect.Weiss European(1986) Starling
Bomford 20-32 European No effect.(1990) Starling
Fitzwater Discouraging expense,(1970) treatment area, range,
and performance.
Griffiths 20-50 House Finch No effect, except for(1987) Dark-eyed Junco small effect during
White-breasted ultrasonic/sonic test.NuthatchTufted TitmouseBlue Jay
Kerns 20-26 Cliff Swallow No effect.(1985)
Martin & Cormorant 5% reduction in birdMartin Gull presence.(1984) Pigeon (Rock
dove)
Meylan 16.8** House Sparrow House and Tree Sparrow(1978) Tree Sparrow populations reduced
Greenfinch 100%. Greenfinchesreduced significantly.
Theissen, 20 Peking Duck No effect.et al.(1957)
Woronecki 20-26 Pigeon (Rock No effect.(1988) _ Dove) II
** Not considered an ultrasonic frequency.
were using shipyard pier towers for roosting at night. The fecal
remains left by the birds created a slippery hazard for dock
33

employees and cleaning problems because of the sun baking them
upon metal surfaces (of ships . . .). The ultrasonic devices
were placed on top of pier towers and operated for 16 days
straight. In comparison to a preultrasound measurement of birds
present, there was only a 5% drop in birds present.
Beuter and Weiss (1986) tested UBRDs on gulls (Laridae) at a
municipal purification plant. The UBRD emitted ultrasonic
frequencies of 20-50 kHz at intensities of up to 135 dB. There
was no indication that the gulls could either hear or be repelled
by the device. They did find that an efficient sound signal to
scare the gulls had a frequency span of 2-7 kHz, frequency
modulation of 0.5-20 Hz, duration of 20 s and minimum intensity
of 60 dB. European Starlings also could be repelled by utilizing
these signals.
Theissen, et al. (1957) studied the effects of UBRDs on the
feeding of Peking Ducks (selectively bred Mallards [Anas
platyrhynchos]). After testing the feeding behaviors of 30 ducks
within a pen, it was concluded that the ducks "do not respond to
20000 Hz sounds at intensities up to 130 dB."
Evaluation of the effectiveness of the "Ultrason ET" UBRD on
Cliff Swallows (Hirundo pyrrhonota) was accomplished by Kerns
(1985). The device lacked significant effect to controlling
Cliff Swallow population size or behavior.
A pair of rotating 21000 Hz UBRDs was reported to have
eliminated pigeons from roosting sites at a building in Florida;
however, after a period of four months, habituation had occurred
34

and the pigeons would perch atop the UBRDs without apparent
discomfort (Dubco 1984 and Dugger 1984).
35

SECTION 6
CONCLUSIONS
No UBRD experiments, to present, have resulted in a bird
population reduction greater than 5%. The one experiment that
had significant effect utilized a sub-ultrasonic frequency of
16776 Hz. Of the bird species that have had their hearing levels
studied, most (26 of 33) do not have the capability of hearing
ultrasonic sound (Table 1).
A bird cannot be physically stressed by an UBRD unless it
can focus a frequency approaching/above 1 MHz to a birds' body or
deliver a sound intensity of over 140 dB at the location of the
birds' ear. The physical effects of UBRDs are minimized by the
intensity, proximity, and focusing required to cause such
effects. Of the UBRDs that have been tested, the maximum levels
of emitted sounds recorded include a frequency of 50 kHz and an
intensity of 135 dB.
UBRDs (as with most bird control devices) lose their
effectiveness over time because birds habituate (get used) to the
presence of their repelling qualities. Any sound which scares
birds away is often effective only for a limited time, depending
upon the resolve of the bird species being treated. Birds will
continue to inhabit busy, noisy, turbulent airfield environments
as long as the benefits of available resources outweigh the
stress, unpredictability, and threat of physical harm caused by a
sonic repelling device.
The results of the research efforts referenced in the report
36
make it difficult to conclude that the claims made by UBRD
manufacturers are valid. One possibility for these results is
that the tested UBRDs have been designed and advertised by the
manufacturers to repel birds that cannot hear ultrasonic sound
(Rock Doves, European Starlings, gulls, etc.). Since it is
possible for some bird species to hear ultrasonic sound
(Chaffinches, Bullfinches, Tawny Owls, etc.), it can be
theoretically assumed that these species may be able to be
repelled by an UBRD designed specifically for the control of
them. Research focusing on bird species with known ultrasonic
hearing capabilities may provide data that may improve UBRD
performance to the point where an UBRD can selectively repel
these species of birds (Table 1).
This compilation of tests of UBRD performance should enable
potential users to make improved decisions on the role of UBRDs
in managing their bird control problems. The alternate "active"
bird control methods sanctioned by USAF Regulation 127-15 (The
Bird Aircraft Strike Hazard [BASH] Reduction Program) are:
pyrotechnics, bioacoustics, distress tapes, depredation, propane
cannons, scarecrows, bird models, remote-control airplanes, and
falconry. While delivering effective performances, these control
techniques all have limitations, difficulties, and inefficiencies
that result in the continuation of the aircraft birdstrike
problem and other bird related problems.
37

SECTION 7
RECOMMENDATIONS
The information available addressing the frequency
perception ability of most bird species is incomplete and often
repetitive. As of now only 33 of 9000 (both figures approximate)
bird species have been tested to determine their hearing
frequency limits, leaving a substantial amount of information yet
to be recorded (Welty and Baptista 1986). Research accomplished
to record the frequency sensitivities of many untested bird
species should be continued. Emphasis should be placed on
investigating a broad spectrum of bird classifications. These
records would provide UBRD researchers and manufacturers with a
more complete basis on which to hypothesize whether an UBRD will
render an effective treatment. The compilation of new and
existing bird frequency perception information into a single
source would be useful for future bird/ultrasonic research
efforts.
The need to find an ultimately effective, affordable, easy
to use and easy to maintain bird repelling method makes future
research into possible bird control solutions a necessity.
Effective bird control methods need to be capable of fulfilling
the needs of the many possible applications: aircraft,
airfields, farmlands, buildings, hangars, docks, ships, signs, or
any other locations where roosting or flying birds may cause
problems.
38

SECTION 8
REFERENCES
Beuter, K. J. and R. Weiss. 1986. Properties of the auditorysystems in birds and the effectiveness of acoustic scaringsignals. Meet. Bird Strike Comm. Eur. 8:60-73.
Blitz, J. 1967. The properties of ultrasound waves. Pages 1-26in Brown, B. and D. Gordon, eds. Ultrasound techniques inbiology and medicine. Charles C. Thomas Publisher,Springfield, Illinois.
Bomford, M. 1990. Ineffectiveness of a sonic device fordeterring starlings. Wildl. Soc. Bull. 18:151-156.
-L.mford, M. and P. H. O'Brien. 1990. Sonic deterrents in animaldamage control: a review of device tests and effectiveness.Wildl. Soc. Bull. 18:411-422.
Brand, A. R. and P. P. Kellogg. 1939. Auditory responses ofstarlings, english sparrows, and domestic pigeons. WilsonBulletin 51(l):38-41.
Cohen, S. M., W. C. Stebbins, and D. B. Moody. 1978. Auditorythresholds of the blue jay. Auk 95:563-568.
Dooling, R. J. 1980. Behavior and psychophysics of hearing inbirds. Pages 261-288 in Comparative studies of hearing invertebrates. Springer-Verlag, New York.
Duoling, R. J. 1982. Auditory perception in birds. Pages 95-130 in Kroodsma, D. E. and E. H. Miller, eds. Acousticcommunication in birds, Vol. 1. Academic Press, New York.
Dooling, R. J., and J. C. Saunders. 1975. Hearing in theparakeet (Melopsittacus undulatus): absolute thresholds,critical ratios, frequency differentiation limens, andvocalizations. J. Comp. and Physiol. Psych. 88(1):1-20.
Dooling, R. J., and M. H. Searcy. 1985. Nonsimultaneousauditory masking in the budgerigar (Melopsittacusundulatus). J. Comp. Psych. 99(2):226-230.
Dooling, R. J., R. J. Mulligan, and J. D. Miller. 1971.Auditory sensitivity and song spectrum of the common canary(Serinus canarius). J. Acoust. Soc. Am. 50:700-709.
Dooling, R. J., S. Peters, and M. H. Searcy. 1979. Auditorysensitivity and vocalizations of the field sparrow (Spizellapusilla). Bull. Psychonomic Soc. 14:106-108.
Dooling, R. J., S. R. Zoloth, and J. R. Baylis. 1978. Auditorysensitivity, equal loudness, temporal resolving power andvocalizations in the house finch (Carpodacus mexicanus). J.Comp. Physiol. Psych. 92:867-876.
Dubco, T. 1984. Shriek devices test tough courthouse pigeons.The Miami News (12 Nov.).
Dugger, C. W. 1984. Noise routs courthouse pigeons. The MiamiHerald (15 Nov.).
Fitzwater, W. D. 1970. Sonic systems for controlling birddepredations. Proc. 5th Bird Cont. Sem. 5:110-119.
Frings, H. and B. Cook. 1964. The upper frequency limits ofhearing in the European starling. Condor 66:56-60.
39

Gordon, D. 1967a. Biological effects below cavitation level.Pages 154-158 in Brown, B. and D. Gordon, eds. Ultrasoundtechniques in biology and medicine. Charles C. ThomasPublisher, Springfield, Illinois.
Gordon, D. 1967b. Mutations and ultrasound. Pages 220-246 inBrown, B. and D. Gordon, eds. Ultrasound techniques inbiology and medicine. Charles C. Thomas Publisher,Springfield, Illinois.
Granit, 0. 1941. Beitrage zur Kenntnis des Gehorsinnes derVogel. Ornis Fennica 18:49-71.
Greenewalt, C. H. 1968. Bird song: acoustics and physiology.Smithsonian Institution Press, Washington, D. C.
Griffiths, R. E. 1987. Efficacy testing of an ultrasonic birdrepeller. Pages 53-63 in S. A. Schumake and R. W. Bullard,eds. Vertebrate pest control and management materials: 5thvolume. ASTM Spec. Tech. Publ. 974, Philadelphia, Pa.
Harrison, J. B. and L. Furumoto. 1971. Pigeon audiograms:comparison of evoked potentials and behavioral thresholds inindividual birds. J. Aud. Res. 11:33-42.
Heinz, R. D., J. M. Sinnott, and M. B. Sachs. 1977. Auditorysensitivity of the red-winged blackbird (Agelaiusphoeniceus) and brown-headed cowbird (Molothrus ater). J.Comp. Physiol. Psych. 91:1365-1376.
Heise, G. A. 1953. Auditory thresholds in the pigeon. Am. J.Psychol. 66:1-19.
Kerns, J. D. 1985. Evaluation of the effectiveness of the"Ultrason ET" ultrasonic device as a means of cliff swallowcontrol. Natural Resources Report No. 85-2. FortWainwright, Alaska.
Knecht, S. 1940. Uber den Gehorsinn und die Musikalitat derVogel. Zeitschr. vergl. Physiol. 27:169-232.
Konishi, M. 1973. How the barn owl tracks its prey. Am. Sci.61:414-424.
Kreithen, M. L. and D. B. Quine. 1979. Infrasound detection bythe homing pigeon: a behavioral audiogram. J. Comp.Physiol. 129:1-4.
Kuethe, A. M. and C. Y. Chow. 1986. Foundations ofaerodynamics/bases of aerodynamic design, 4th edition. JohnWiley & Sons, New York. 555 pp.
Maiorana, V. A. and W. M. Schleidt. 1972. The auditorysensitivity of the turkey. J. Aud. Res. 12:203-207.
Martin, L. R. and P. C. Martin. 1984. Research indicatespropane cannons can move birds. Pest Control 52(4):52.
Meyer, D. B. 1986. The avian ear and hearing. Pages 48-59 in P.D. Sturkie, ed. Avian physiology: 4th edition. Springer-Verlag, New York.
Meylan, A. 1978. Granivorous birds in sunflower crops. Proc.Vertbr. Pest Conf. 8:73-77.
Payne, C. D. 1986. GLIM system users' guide release 3.77.Numerical Algorithms Group Ltd., Oxford, U.K. 183 pp.
40

Pumphrey, R. J. 1961. Sensory organs: hearing. Pages 69-86 inMarshall, A. J. ed. Biology and comparative anatomy ofbirds. Academic Press, New York.
Quine, D. B. and M. L. Kreithen. 1981. Frequency shiftdiscrimination: can homing pigeons locate infrasounds byDoppler shifts? J. Comp. Physiol. 141:153-155.
Schwartzkopff, J. 1949. Uber Sitz und Leistung von Gehor undVibrationssinn bei Vogeln. Zeitschr. vergl. Physiol.31:527-608.
Schwartzkopff, J. 1952. Untersuchungen uber die Arbeitweise desMittlohres und das Richtungshoren der Singvogel unterVerwendung von Cochlea-Potentialen. Zeitschr. vergl.Physiol. 34:46-68.
Schwartzkopff, J. 1955a. On the hearing of birds. Auk 72:340-347.
Schwartzkopff, J. 1955b. Schallsinnesorgan bei Vogeln. In ActaXI congressus internationalis ornithologici. BerhauserVerlag, Basel and Stuttgart.
Schwartzkopff, J. 1968. Structure and function of the ear andthe auditory brain areas in birds. Pages 41-59 in DeReuck,A. V. S. and J. Knight, eds. Hearing mechanisms invertebrates. Little, Brown, Boston, Massachusetts.
Schwartzkopff, J. 1973. Mechanoreception. In Farner, D. S., J.R. King, and K. C. Parkes, eds. Avian biology, Vol. 3.Academic Press, New York.
Spear, P. J. 1966. Bird control methods and devices; commentsof the National Pest Control Association. Proc. BirdControl Semin. 3:134-146.
Stebbins, W. C. 1970. Studies of hearing and hearing loss inthe monkey. Pages 41-66 in Stebbins, W. C., ed. Animalpsychophysics: the design and conduct of sensoryexperiments. Appleton, Century, Crofts, New York.
Summers-Smith, D. 1963. The house sparrow. Collins, London.251 pp.
Thiessen, G. J., E. A. G. Shaw, R. D. Harris, J. B. Gollop, andH. R. Webster. 1957. Acoustic irritation threshold ofpeking ducks and other domestic and wild fowls. J. Acoust.Soc. Am. 29:1301.
Theissen, G. J. and E. A. G. Shaw. 1957. Acoustic irritationthreshold of ringbilled gulls. J. Acoust. Soc. Am. 29:1307.
Thorpe, W. H. 1961. Bird song: the biology of vocalcommunication and expression in birds. Cambridge monographsin experimental biology, No. 12. Cambridge UniversityPress, London and New York.
Trainer, J. E. 1946. The auditory acuity of certain birds. Ph.D. Thesis, Cornell Univ., Ithaca, NY.
Wassiljew, P. 1933. Uber das Unterscheidungsvermogen der Vogelfur die hohen Tone. Zeitschr. vergl. Physiol. 19:424-438.
Welty, C. W. and L. Baptista. 1988. The life of birds, 4th ed.Saunders College Publishing, New York. 581 pp.
41

Wever, E. G. and C. W. Bray. 1936. Hearing in the pigeon asstudied by the electrical responses of the middle ear. J.Comp. Psych. 22:353-363.
Woronecki, P. P. 1988. Effect of ultrasonic, visual, and sonicdevices on pigeon numbers devices on pigeon numbers in avacant building. Proc. Vertebr. Pest Conf. 13:266-272.
ACKNOWLEDGEMENTS
Thank you: Ralph Speelman, Duncan Dversdall, Russ Urzi, RonMerritt, Bob Dogan, David Rubin, Fred Samec, Jeff Short, TomSeamans, Paul Woronecki and Jeannie Stewart.
42
I 1;-S. GOVE.NME4T PRINTING CFFICE: 109 - 648-12'62d62