ultrafiltration performance of efom and nom under different mwco membranes: comparison with...
TRANSCRIPT

Desalination 344 (2014) 129–136
Contents lists available at ScienceDirect
Desalination
j ourna l homepage: www.e lsev ie r .com/ locate /desa l
Ultrafiltration performance of EfOM and NOM under different MWCOmembranes: Comparison with fluorescence spectroscopy and gelfiltration chromatography
GuoJin⁎, LiuHong, LiuJianhong, WangLiyingSchool of Environment and Energy Engineering, Beijing University of Technology, 100124, Beijing, China
H I G H L I G H T S
• Polysaccharides, proteins and colloids in EfOM could be easily removed by UF.• HS in NOM were more easily removed with the decreasing of membrane's MWCO.• HS were the main potential foulants during UF membrane processing of surface water.• Polysaccharides, proteins, colloids and HS in EfOM were the potential foulants.
⁎ Corresponding author.E-mail address: [email protected] (J. Guo).
http://dx.doi.org/10.1016/j.desal.2014.03.0060011-9164/© 2014 Elsevier B.V. All rights reserved.
a b s t r a c t
a r t i c l e i n f oArticle history:Received 24 October 2013Received in revised form 14 February 2014Accepted 4 March 2014Available online xxxx
Keywords:UltrafiltrationMembrane foulingEfOMNOMGFCEEM
Ultrafiltration performance of wastewater effluent organic matter (EfOM) and background natural organicmatter (NOM) under different molecular weight cutoff (MWCO) membranes was investigated. Permeates ofEfOM and NOM from ultrafiltration were systematically compared by using fluorescence spectroscopy and gelfiltration chromatography. The results revealed that anthropogenic polysaccharide- and protein-like substancesincluding polysaccharides, proteins, and colloids in EfOM were mainly removed by ultrafiltration with the 100kDa membrane, which accounts for a large proportion of the total DOC in EfOM. With the decreasing of themembrane's MWCO, the humic substances in NOM were more easily removed compared with that in EfOM.The polysaccharides associated with the colloidal fraction, as well as the humic substances were speculated asthe main potential foulants for UF membranes processing wastewater EfOM. As for NOM, humic substanceswere regarded as the main potential foulants. The fouling mechanism (cake filtrations or pore blocking) ofEfOM or NOM in the ultrafiltration process was related with the MWCO of the membrane and the molecularsize of the main foulants.
© 2014 Elsevier B.V. All rights reserved.
1. Introduction
Wastewater effluent organic matter (EfOM) is composed of solublemicrobial products (SMP), background natural organic matter (NOM)originating from drinking water, and disinfection by-products (DBPs)generated during the disinfection processes of water and wastewatertreatment, along with natural and synthetic trace chemicals (SOC) [1].SMP are generated during biological treatment by bacteria as a resultof substrate metabolism and biomass decay [2], which are a factorthat causes membrane fouling [3] as well as a precursor to producenitrogenous DBPs [4]. NOM is a complexmixture of organic compoundspresent in all freshwater, particularly surfacewaters,which consists of arange of different compounds, from largely aliphatic to highly coloredaromatics [5]. The amount and characteristics of NOM depend on
climate, geology and topography [6,7]. Traditional drinking watertreatment plants remove some NOM from the source water and theremaining recalcitrant material is conveyed into wastewater. As aresult, bulk organic matter in wastewater effluent-derived surfacewater consists of both allochthonous NOM and anthropogenic EfOMcharacteristics [8].
Several investigations differentiated the EfOM from NOMwith vari-ous characterization methods [8–10]. These characterization methodsincluded total or dissolved organic carbon analyzing (TOC or DOC),ultraviolet spectrum (UV254, SUVA), fluorescence spectroscopy and gelpermeation chromatography, as well as fractionating bulk organic mat-ter to dissolved organic subcomponents with varying compositions andfunctional properties. Fluorescence spectroscopy is a simple and sensi-tive technique to obtain the structural information of aqueous dissolvedorganic materials (DOM) at relatively low concentrations (b20 mg/LTOC) [11–13]. 3D fluorescence excitation–emission matrix (EEM) waswidely used in the study of structural information of multi-component

Bulk 100000Da 30000Da 10000Da 5000Da 3000Da 1000Da
20
30
40
50
60
70
80
90
100
Res
idua
l DO
C /
%
NOM EfOM
Fig. 1. Residual DOC of NOM and EfOM after ultrafiltration with series of theMWCO membrane.
130 J. Guo et al. / Desalination 344 (2014) 129–136
humic solutes, which related to the position, shift, and intensity offluorescence peaks [11,12,14–17]. High performance gel permeationchromatography (HPGPC) was also used to characterize DOMbased on differential permeation of molecules. HPGPC-UVA [18],HPGPC-on-line specific Ex/Em fluorescence [19], HPGPC-on-line 3DEEM fluorescence [20] as well as HPGPC-online TOC detection sys-tems [21] had been developed to analyze the chemical qualitativeand structural features in addition to molecular size. Besides that,based on the XAD resin fractionation methods put forward in 1981[22,23], XAD fractionationmethods were adopted bymany researchersto characterize the subcomponents of DOM [24–28].
Recently, with the wide application of ultrafiltration technology inwater and wastewater field, operational problems that are relatedwith NOM or EfOM during ultrafiltration treatment are attractingmore and more attention. NOM or EfOM was considered as the majorfoulants thatwill cause organic foulingduring surfacewater purificationand wastewater reclamation [29–32]. Compared with NOM, EfOM wasrelatively slightly studied. Although the characteristics of EfOM andNOM overlap extensively, diverse ultrafiltration performance was ex-pected owing to their dissimilar origin and characteristics. Especially,there might exist different fouling potentials relating with surfacewater purification or wastewater reclamation, as the major foulants inEfOM and NOM were quite different. However, the difference betweenNOMand EfOMduringultrafiltration progresswas rarely paid attention.In this study, the ultrafiltration performance of EfOM and NOM underdifferent molecular weight cutoff (MWCO) membranes is investigated.To characterize and compare the major foulants, permeates of EfOMand NOM from ultrafiltration are systematically compared by usingfluorescence spectroscopy and GPC. Then, the difference with respectto removal efficiency and fouling potential in UF process betweenNOM and EfOM is further analyzed.
2. Materials and methods
2.1. Isolation of NOM and EfOM
Raw water collected from River Songhua (located in the north-eastpart of China) was passed through a 0.45 micron filter and a cationexchange resin sequentially to remove the suspended particles, anddivalent and trivalent cations in water. Then the filtered, cation-exchanged sample was flowed into the RO system. The concentratedNOM was stored in the dark at 4 °C before use. Effluent sample wascollected from XiaoHongMen WWTPs that incorporated the activatedsludge treatment process. Water samples for this study werecollected at a secondary settling tank and filtered immediately througha 0.45 micron cellulose filter. Then the collected EfOMwas stored in thedark at 4 °C. DOC concentration of EfOM was around 12 mg/L. Beforethe ultrafiltration experiment, the concentrated NOM was diluted toaround 8 mg/L (the typical DOC of its source water).
2.2. Ultrafiltration experiment
All ultrafiltration experiments were performed under room temper-ature (22 ± 1 °C). A 50 mL ultrafiltration stirred cell (8050 stirred cell,Millipore, USA) with a series of membranes (Ultracel PL 1 kDa, 3 kDa,5 kDa, 10 kDa, 30 kDa, 100 kDa, Millipore, USA) was used. Beforeultrafiltration, the membranes were floated with skin side down in abeaker of Milli-Q water (with resistance of 18.2 MΩ·cm) for at least 1h with three water changes before use. The operating pressure of thestirred cell was controlled at 0.1 MPa with N2. Preparatory experimentproved that the remaining residues on themembrane could be removedby passing 50 mL of Milli-Q water through the membrane. During theultrafiltration experiment, the first 10 mL and the last 10 mL of each fil-trate of NOM or EfOM were discarded, then the residual 30 mL perme-ates were analyzed with a DOC analyzer, GPC and EEM.
2.3. DOC
A total organic carbon analyzer (Multi N/C 3000, analytik-jena,Germany) was used to determine the DOC. The non-purgeable organiccarbon (NPOC) testing method was selected, which involved purgingan acidified sample with carbon-free air prior to measurement. Thenthe total carbon in the sample was combusted into carbon dioxide andmonitored by an NDIR detector. The total carbon standard substance,using the potassium hydrogen phthalate, was stored at 4 °C for nolonger than 1 month.
2.4. Gel filtration chromatography
The permeate samples of EfOM and NOM from a series of ultrafil-tration membranes were analyzed with high performance liquidchromatography–gel filtration chromatography (HPGFC) with anultraviolet (UV) detector. HPGFC comprised a high pressure liquidchromatography pump (Waters 1525), a dual λ absorbance detector(Waters 2487), amanual sampler equippedwith a 20 μL sample loop,and a Waters Protein-pak 125 column. Sodium polystyrene sulfonates(PSS, Fluka) with molecular weights of 210, 1400, 3400, 13,000, and32,000 Da were used as the standards. The mobile phase was Milli-Qwater buffered with phosphate (0.0024 M NaH2PO4 + 0.0016 MNa2HPO4) to pH 6.8 and 0.025 M Na2SO4 was added to reach a totalionic strength of 0.1 M. The sample volume was 20 μL and the flowrate was controlled at 0.7 mL min−1. The sample that flowed out ofthe protein-pak column was detected by UV absorption at 254 nmand 280 nm (indicative of the aromaticity of compounds).
2.5. EEM
All EEM spectra were measured by a 1-cm cuvette using lumines-cence spectrometry (F-7000, Hitachi). EEM spectra were collectedwith subsequent scanning emission spectra from 300 to 550 nm at1.0 nm increments by varying the excitation wavelength from 200 to400 nm at 5 nm increments. Excitation and emission slits were main-tained at 5 nm and the scanning speed was set at 1200 nm/min forall the measurements. The X-axis represents the emission spectrafrom 300 to 550 nm, whereas the Y-axis is the excitation wavelengthfrom 200 to 400 nm. The spectrum ofMilli-Qwater was recorded as theblank. The result is a three-dimension spectrum in which fluorescenceintensity is represented as a function of excitation and emissionwavelengths.

131J. Guo et al. / Desalination 344 (2014) 129–136
3. Results and discussion
3.1. Ultrafiltration removal of EfOM and NOM
Residual DOC of NOM and EfOM after ultrafiltration with a seriesofMWCOmembraneswas demonstrated in Fig. 1. As shown, after ultra-filtration with the 100 kDa membrane, residual DOC of NOM accountsfor 97%, only a slight removal was obtained. Residual DOC of NOM fur-ther decreased to 95% after ultrafiltration with the30 kDa membrane.Compared with NOM, the residual DOC of EfOM was around 83% afterultrafiltration with the 100 kDa membrane, the reduction was 17%,and almost no further decrease of DOCwas observed after ultrafiltrationwith the 30 kDa membrane compared with that of the 100 kDa mem-brane. With the decrease of MWCO, reduction of DOC was 45% whenNOM was ultrafiltrated with the 10 kDa membrane, and the residualDOC further decreased to 30% after ultrafiltration by the 5 kDa mem-brane. As for EfOM, reduction of DOC was 33% after ultrafiltration withthe 10 kDa membrane, and 55% residual DOC was obtained after ultra-filtration with the 5 kDa membrane. With the further decrease ofMWCO, for both NOM and EfOM, their residual DOC slightly loweredafter ultrafiltration with 3 kDa or 1 kDa membranes. The reduction ofDOC was 75% when NOM was ultrafiltrated with MWCO of 1 kDamembrane, while only 45% DOC was removed for EfOM. It reveals thatthe DOC reduction of NOM could be increased with the decrease ofthe membrane's MWCO. As for EfOM, although a large proportion ofDOC can be removed with 100 kDa membrane, the DOC reductiononly slightly improved with the decrease of the membrane's MWCO.
3.2. Permeates of EfOM and NOM after ultrafiltration: comparison with gelfiltration chromatography
Gel filtration chromatography of bulk EfOM, bulk NOM, and perme-ates of both EfOM and NOM after ultrafiltration with a series of MWCOmembranes was shown in Fig. 2. As reported, themolecular weight dis-tribution of DOM in sewage effluent can be divided into three parts [33]:MW N 10,000 Da, which represents the SMP or EPS such as polysaccha-rides and proteins; MW in the range of 500–3000 Da, which representsthe refractory organicmaterials, such as the humic substances; andMWb 200 Da, which represents the low molecular weight organic com-pounds, such as glucose and acetate. From Fig. 2a, it is seen that bulkEfOM demonstrated a distribution in the range of 100 Da b MWb 5000 Da and MW N 10,000 Da. Although, the UV detector adoptedin this study has limitation in detecting lowUV absorbance compounds,such as polysaccharides. A relatively weaker UV peak at MW of around30,000 Da could still be found in the chromatography of EfOM. It re-vealed that low molecular weight organic acid, humic substances aswell as the anthropogenic polysaccharides or proteins all presented inEfOM. Imai et al. [25] had reported that the GPC UV chromatograms ofEfOM showed a broad, monomodal distribution with several subpeaksin the range of 500–3000 Da. The slight difference among researchersmight originate from the difference of wastewater source and gelchromatography column. As shown in Fig. 2b, the GPC chromatogramof bulk NOM demonstrated a broad, monomodal distribution in therange of 500 Da b MW b 10 k Da with several subpeaks. No UV absor-bance atMW N 10 kDawas observed. The results proved to some extentthat humic substances constitute the major organic fractions in NOM.
After ultrafiltration treatment, permeates of EfOM and NOM fromthe 1, 3, 5, 10, 30, and 100 kDa membranes were analyzed with gelpermeation chromatography. As shown in Fig. 2a, the UV peak atMW N 10 kDa in the bulk EfOM was removed especially by the100 kDa membrane. It was speculated that the relatively smaller peakat around 30 k Da (which demonstrate SMP or EPS, such as anthropo-genic polysaccharides and proteins) can be removed by the 100 kDaultrafiltration membrane. Laabs et al. [31] also reported that thesubstances eluting in the PS peak (organic colloids, polysaccharides,and proteins) could be retained completely by 100 kDa UF membranes
and partly by MF membranes, which are responsible for membranefouling. As for NOM, no prominent decrease of UV intensity was ob-served after ultrafiltration by 100 kDa or even 30 kDa membrane.From Fig. 2a, we can see that UV peaks in the range of 1 kDa b MWb 10 kDa of EfOM which demonstrated that humic substances wereslightly decreased after being ultrafiltrated with 10 kDa or 5 kDamembranes. Compared with EfOM, as shown in Fig. 2b, peaks ofNOM in this range were especially decreased after ultrafiltration by10 kDa membrane, and more prominent decrease was observedafter ultrafiltration by 5 kDa membrane and even lower MWCOmembrane. As for organic matters withMW b 1 kDa, the lowmolecularweight organic acids, whether it is NOM or EfOM, almost no decreasecan be observed even after ultrafiltration by 1 kDa membrane. Fromthe above results, it was speculated that the anthropogenic polysaccha-rides or proteins in EfOMweremainly removed by 100 kDamembrane.Humic substances in EfOMwere slightly removed during the ultrafiltra-tion process. Compared with EfOM, UV intensity of NOM was moreeasily decreased by ultrafiltration. The humic substances in NOM wereprominently removed after ultrafiltration by 5 kDa–3 kDa membrane.
3.3. Permeates of EfOM and NOM after ultrafiltration: comparison withfluorescence EEM spectroscopy
By using fluorescence EEM spectroscopy, bulk EfOM, bulk NOM, andpermeates of both EfOM and NOM after ultrafiltration with a series ofMWCO membranes were further analyzed. Table 1 summarized thecommonly reported fluorescence peaks observed in freshwater andraw sewage aquatic samples. As shown, peak A and peak C are relatedto humic-like substances, peak B is related to tyrosine-like substances,peak T is related to tryptophan-like substances and peak M is relatedto marine humic substances associating with algae activity.
The fluorescence EEM of bulk NOM and EfOM was presented inFig. 3. As shown, NOM isolated from surface water is rich in humic-likefluorescence correlating with peak A and peak C, while a 10 nm–20 nmshift to a shorter excitation wavelength can be observed. Besides,a weaker tryptophan-like fluorescence (peak T2) can be also found. Asthat stated by Henderson et al. [34], peak A and peak C were normallyregarded as the predominate fluorescence for clean reservoirs andrivers. Nam and Amy [10] also reported that EEMs of allochthonousNOM show the most intense peak A at Ex/Em of 280 nm/460 nm, thesecond intense peak C at Ex/Em of 320 nm/450 nm, but no distinctpeak in the protein-like region. Only autochthonous NOM (SMP, algalorganic matter (AOM)) showed clear protein-like peaks with highfluorescence intensities [10]. It proved the fact that the surface waterwe used to isolate NOM was influenced by the drainage of wastewaterto some degree. As a result, there existed certain autochthonoussubstances originating from sewage effluent. Compared with NOM,the fluorescence EEM of EfOM is rich in tryptophan-like fluorescence(peak T1), a 20 nm–30 nm shift to a longer emission wavelength canbe observed. Besides, relatively weaker peaks A and C which reflectedthe humic-like fluorescence could be observed. That is similar to theresult of Nam and Amy [10]. Through the comparison between EfOMand NOM, clear protein like peaks using fluorescence EEM was amajor feature of EfOM distinguishing it from NOM [10,34].
After ultrafiltration treatment, permeates of EfOM and NOM fromthe 1, 3, 5, 10, 30, and 100 kDa membranes were analyzed withfluorescence EEM. The corresponding intensities and positions ofthe EEM peak maxima were given in Table 2. Corresponding to it,the percentage variation of fluorescence intensity was further dem-onstrated in Fig. 4. As shown in Fig. 4, with the decrease of MWCO,the intensity of tryptophan-like fluorescence (peak T1) in EfOMdecreased by only 18% even after ultrafiltration by the 1 kDa mem-brane. However, the intensity of peak T1 decreased by 5% just afterultrafiltration with the 100 kDa membrane, which accounts forabout 30% of the total removal. It revealed that the 100 kDa mem-brane removed a large proportion of tryptophan-like substances in

b) NOM
10 100 1000 10000 100000 1000000
0.0000
0.0005
10 100 1000 10000 100000 1000000
0.0000
0.000510 100 1000 10000 100000 1000000
0.0000
0.000510 100 1000 10000 100000 1000000
0.0000
0.0005
0.001010 100 1000 10000 100000 1000000
0.000
0.001
0.00210 100 1000 10000 100000 1000000
0.000
0.001
0.002
10 100 1000 10000 100000 1000000
0.000
0.001
0.002
molecular weight (Da)
UV254
, UV280NOM
100kDa
30kDa
10kDa
5kDa
3kDa
1kDa
LMW organic materials Humic substances Soluble microbial products
a) EfOM
10 100 1000 10000 100000 1000000
0.000
0.001
0.00210 100 1000 10000 100000 1000000
0.000
0.001
0.00210 100 1000 10000 100000 1000000
0.000
0.001
0.00210 100 1000 10000 100000 1000000
0.000
0.001
0.00210 100 1000 10000 100000 1000000
0.000
0.001
0.00210 100 1000 10000 100000 1000000
0.000
0.001
0.00210 100 1000 10000 100000 1000000
0.000
0.001
0.002
1kDa
Molecular weight (Da)
3kDa
5kDa
10kDa
30kDa
100kDa UV254
UV280
EfOM
LMW organic materials Humic substances Soluble microbial products
Fig. 2. GFC of the permeates of EfOM and NOM after ultrafiltration.
132J.G
uoetal./D
esalination344
(2014)129
–136
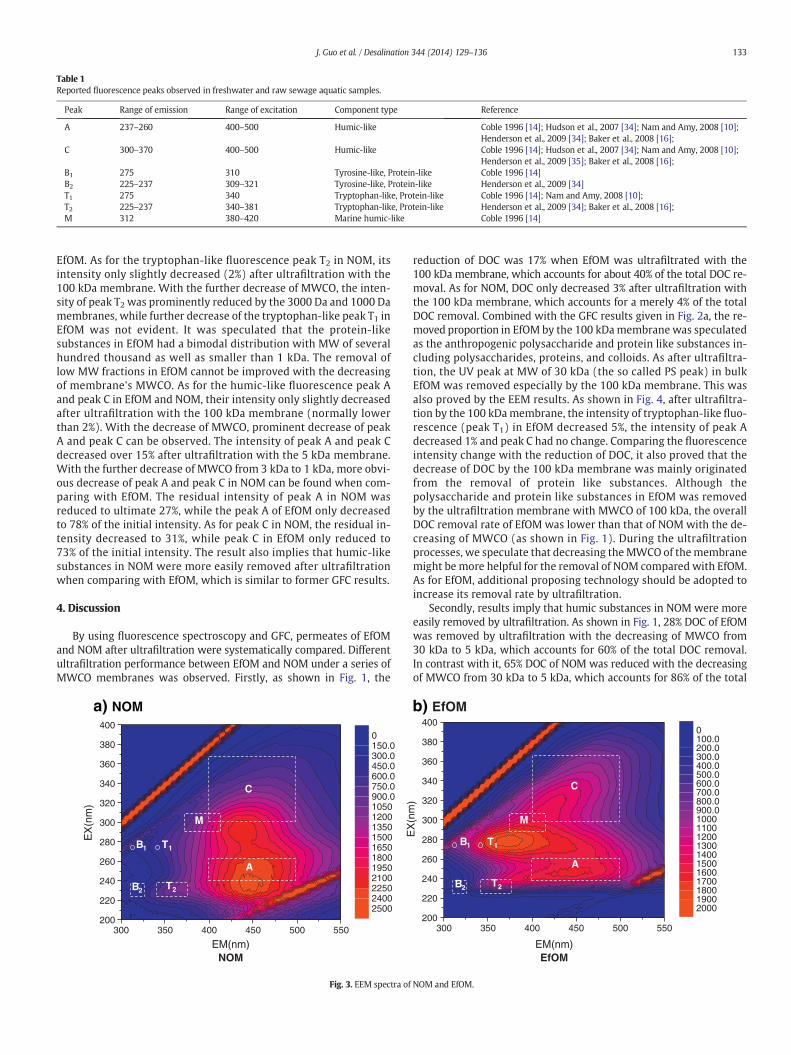
Table 1Reported fluorescence peaks observed in freshwater and raw sewage aquatic samples.
Peak Range of emission Range of excitation Component type Reference
A 237–260 400–500 Humic-like Coble 1996 [14]; Hudson et al., 2007 [34]; Nam and Amy, 2008 [10];Henderson et al., 2009 [34]; Baker et al., 2008 [16];
C 300–370 400–500 Humic-like Coble 1996 [14]; Hudson et al., 2007 [34]; Nam and Amy, 2008 [10];Henderson et al., 2009 [35]; Baker et al., 2008 [16];
B1 275 310 Tyrosine-like, Protein-like Coble 1996 [14]B2 225–237 309–321 Tyrosine-like, Protein-like Henderson et al., 2009 [34]T1 275 340 Tryptophan-like, Protein-like Coble 1996 [14]; Nam and Amy, 2008 [10];T2 225–237 340–381 Tryptophan-like, Protein-like Henderson et al., 2009 [34]; Baker et al., 2008 [16];M 312 380–420 Marine humic-like Coble 1996 [14]
133J. Guo et al. / Desalination 344 (2014) 129–136
EfOM. As for the tryptophan-like fluorescence peak T2 in NOM, itsintensity only slightly decreased (2%) after ultrafiltration with the100 kDa membrane. With the further decrease of MWCO, the inten-sity of peak T2 was prominently reduced by the 3000 Da and 1000 Damembranes, while further decrease of the tryptophan-like peak T1 inEfOM was not evident. It was speculated that the protein-likesubstances in EfOM had a bimodal distribution with MW of severalhundred thousand as well as smaller than 1 kDa. The removal oflow MW fractions in EfOM cannot be improved with the decreasingof membrane's MWCO. As for the humic-like fluorescence peak Aand peak C in EfOM and NOM, their intensity only slightly decreasedafter ultrafiltration with the 100 kDa membrane (normally lowerthan 2%). With the decrease of MWCO, prominent decrease of peakA and peak C can be observed. The intensity of peak A and peak Cdecreased over 15% after ultrafiltration with the 5 kDa membrane.With the further decrease of MWCO from 3 kDa to 1 kDa, more obvi-ous decrease of peak A and peak C in NOM can be found when com-paring with EfOM. The residual intensity of peak A in NOM wasreduced to ultimate 27%, while the peak A of EfOM only decreasedto 78% of the initial intensity. As for peak C in NOM, the residual in-tensity decreased to 31%, while peak C in EfOM only reduced to73% of the initial intensity. The result also implies that humic-likesubstances in NOM were more easily removed after ultrafiltrationwhen comparing with EfOM, which is similar to former GFC results.
4. Discussion
By using fluorescence spectroscopy and GFC, permeates of EfOMand NOM after ultrafiltration were systematically compared. Differentultrafiltration performance between EfOM and NOM under a series ofMWCO membranes was observed. Firstly, as shown in Fig. 1, the
300 350 400 450 500 550200
220
240
260
280
300
320
340
360
380
400
NOMEM(nm)
EX
(nm
)
0150.0300.0450.0600.0750.0900.010501200135015001650180019502100225024002500
T1
T2
B1
B2
A
C
M
a) NOM
Fig. 3. EEM spectra of
reduction of DOC was 17% when EfOM was ultrafiltrated with the100 kDa membrane, which accounts for about 40% of the total DOC re-moval. As for NOM, DOC only decreased 3% after ultrafiltration withthe 100 kDa membrane, which accounts for a merely 4% of the totalDOC removal. Combined with the GFC results given in Fig. 2a, the re-moved proportion in EfOM by the 100 kDamembrane was speculatedas the anthropogenic polysaccharide and protein like substances in-cluding polysaccharides, proteins, and colloids. As after ultrafiltra-tion, the UV peak at MW of 30 kDa (the so called PS peak) in bulkEfOM was removed especially by the 100 kDa membrane. This wasalso proved by the EEM results. As shown in Fig. 4, after ultrafiltra-tion by the 100 kDamembrane, the intensity of tryptophan-like fluo-rescence (peak T1) in EfOM decreased 5%, the intensity of peak Adecreased 1% and peak C had no change. Comparing the fluorescenceintensity change with the reduction of DOC, it also proved that thedecrease of DOC by the 100 kDa membrane was mainly originatedfrom the removal of protein like substances. Although thepolysaccharide and protein like substances in EfOM was removedby the ultrafiltration membrane with MWCO of 100 kDa, the overallDOC removal rate of EfOM was lower than that of NOM with the de-creasing of MWCO (as shown in Fig. 1). During the ultrafiltrationprocesses, we speculate that decreasing the MWCO of themembranemight be more helpful for the removal of NOM compared with EfOM.As for EfOM, additional proposing technology should be adopted toincrease its removal rate by ultrafiltration.
Secondly, results imply that humic substances in NOM were moreeasily removed by ultrafiltration. As shown in Fig. 1, 28% DOC of EfOMwas removed by ultrafiltration with the decreasing of MWCO from30 kDa to 5 kDa, which accounts for 60% of the total DOC removal.In contrast with it, 65% DOC of NOM was reduced with the decreasingof MWCO from 30 kDa to 5 kDa, which accounts for 86% of the total
300 350 400 450 500 550200
220
240
260
280
300
320
340
360
380
400
EM(nm)
EX
(nm
)
0100.0200.0300.0400.0500.0600.0700.0800.0900.010001100120013001400150016001700180019002000
EfOM
T1
T2
B1
B2
A
C
M
b) EfOM
NOM and EfOM.

Table 2Intensities and position of EEM peak maxima of NOM and EfOM after ultrafiltration.
MW cutoff PeakT1 PeakT2 Peak A Peak C
Ex/Em Int. Ex/Em Int. Ex/Em Int. Ex/Em Int.
NOM Raw 225.0/352.0 1068 235.0/423.0 2489 290/408 2253100,000 Da 225.0/352.0 1048 235.0/415.0 2452 290.0/408.0 220330,000 Da 225.0/352.0 1020 235.0/414.0 2412 290.0/408.0 213210,000 Da 225.0/352.0 985.1 235.0/418.0 2249 290.0/404.0 20255000 Da 225.0/352.0 940.1 230.0/417.0 2204 290.0/411.0 19673000 Da 225.0/352.0 863.2 230.0/410.0 1565 290.0/402.0 14151000 Da 225.0/339.0 554.4 230.0/409.0 680 290.0/408.0 693.6
EfOM Raw 280.0/356.0 2145 245.0/414.0 1829 310.0/396.0 1557100,000 Da 280.0/365.0 2040 245.0/413.0 1809 315.0/402.0 155230,000 Da 280.0/361.0 2020 245.0/405.0 1786 320.0/405.0 152510,000 Da 280.0/361.0 1979 245.0/411.0 1675 315.0/399.0 14565000 Da 275.0/358.0 1906 245.0/420.0 1674 315.0/399.0 13863000 Da 280.0/362.0 1837 245.0/412.0 1593 315.0/399.0 13091000 Da 280.0/358.0 1766 245.0/410.0 1418 315.0/399.0 1136
134 J. Guo et al. / Desalination 344 (2014) 129–136
DOC removal. No more prominent decease of DOC was found with thefurther decreasing of MWCO from 5 kDa to 1 kDa. As shown in Fig. 2,peaks in the range of 1 kDa b MW b 10 kDa of EfOM demonstratedthat humic substances were slightly decreased by ultrafiltration withthe decreasing of MWCO from 30 kDa to 5 kDa, while peaks in NOMwhich represent humic substances were especially decreased afterultrafiltratedwith the 10 kDamembrane, andmore prominent decreasewas observed after ultrafiltration by the 5 kDa membrane. No furtherobvious GFC change was observed with the decreasing of MWCO from5 kDa to 1 kDa. Comparedwith EEM results in Fig. 4, with the decreasingof MWCO from 30 kDa to 1 kDa, the humic-like peak A and peak C inEfOM only changed little when compared with that in NOM. A promi-nent decrease in NOM can be observed especially after ultrafiltrationwith MWCO lower than 3 kDa. In this case, why are the humic sub-stances in NOM easier to remove by ultrafiltration? To explore thisquestion, the hydrophobic acid fractions (HOA), which are normallyregarded as humic acid, were further isolated from NOM and EfOMwith XAD resin. The GPC and EEM characteristics of humic substanceswere demonstrated in Fig. 5.
As shown in Fig. 5a and b, the GFC results revealed that HOA in NOMhave larger molecular size with MW of 2000 Da, while MW of HOA inEfOM mainly distributed at 1900 Da, 1700 Da and 1000 Da. The largerMW of HOA in NOM was more easily excluded by ultrafiltration com-pared with that in EfOM. It is normally regarded that the humic sub-stances in EfOM originated from NOM. Traditional drinking watertreatment plants remove someNOMfromsourcewater and the remain-ing recalcitrant material is conveyed into wastewater. Compared withthe low MW organic fractions, the high MW organic substances were
100000Da 30000Da 10000Da 5000Da 3000Da 1000Da0
25
50
75
100
Inte
nsity
dec
reas
e / %
MWCO of UF membrane
Peak T1, EfOM
Peak AEfOM
Peak CEfOM
Peak T2, NOM
Peak ANOM
Peak CNOM
Fig. 4. Fluorescence intensity decrease of NOM and EfOM after ultrafiltration.
more easily removed during the traditional drinking water treatmentprocess. As a result, the residual recalcitrant substances drained toEfOMhad lowerMW.Of course, it should be pointed out that the surfacewater we use to isolate NOM is not the receiving water body of theWWTP's discharge. On the other hand, the recalcitrant substances thathave a similar characteristic with humic substances were accumulatedduring the wastewater biological treatment process. It was expectedto have a relatively lower MW compared with allochthonous humicsubstances. As that shown in Fig. 5c and d, the EEM of HOA-NOMshowed the intense peak A at Ex/Em of 235 nm/430 nm that demon-strated the presence of humic-like substances. HOA of EfOM showedthe most intense peak A at Ex/Em of 240 nm/430 nm and a secondintense peak at Ex/Em of 275 nm/450 nm as well. The peak at Ex/Emof 275 nm/450 nm had a 10 nm–20 nm shift to a higher excitationwavelength comparing with peak A. The multi-adsorption of fluo-rescence in HOA of EfOM implies the complicated origin of humicsubstances in EfOM.
Finally, substances that are retained by themembrane can potential-ly contribute to the membrane fouling. Our results revealed that humicsubstances were the main potential foulants during UF membrane pro-cessing surface water. The polysaccharide- and protein like substances(polysaccharides, proteins, and colloids) in EfOM, with a larger MW,was easier to be removed by UF membranes, and were speculated asthemain potential foulants for UFmembranes processing sewage efflu-ent. Filloux et al. (2012) reported that biopolymers, normally regardedas polysaccharide-like and protein-like substances, contributed to a sig-nificant proportion of low-pressure membrane flux decline [32]. Zhengand Jekel (2009) also stated that biopolymers cover membrane poresfirstly and lead to a steep flux decline during the filtration process[35]. With sufficient biopolymers to membrane surface, a gel layer canthen form on the surface and cover the whole membrane area [35].Although the fouling caused by biopolymers was important, the humicsubstances in EfOM should not be ignored as other potential foulants.As our results also revealed that humic substances in EfOM can also beremoved with the decreasing of membrane's MWCO. As for the foulingmechanism during UF processing surface water and sewage effluent,it is speculated relating with the MWCO of membrane as well as themolecular size of the potential foulants.When the pore size of themem-brane is large enough that cannot exclude the foulants in EfOM or NOM,the fouling mechanism is supposed to be pore blockage and/or poreconstriction (adsorption). It is expected to be a more severe foulingthat might cause irreversible fouling. Study had found that fouling ismore severe in the more porous high MWCO membranes than in theless porous low MWCO membranes [29]. The more severe flux declinein a porous membrane is due to the greater flow resistance imposedby adsorption of pollutants within pores than the resistance inducedby cake build-up [29]. When the MWCO of the membrane is lowerthan the size of foulants, a cake/gel layer caused by exclusion of foulants

300 320 340 360 380 400 420 440 460 480 500 520 540200
220
240
260
280
300
320
340
360
380
400
EM(nm)
EX
(nm
)
0100.0200.0300.0400.0500.0600.0700.0800.0900.010001100120013001400150016001700180019002000
c)
10 100 1000 10000 100000 1000000
0.000
0.002
0.004
0.006
10 100 1000 10000 100000 1000000
0.000
0.001
0.002
0.003
0.004
Molecular weight (Da)
UV254
UV280
a)
Molecular weight (Da)
1000Da
1900Da
2000Da
1700Da
300 320 340 360 380 400 420 440 460 480 500 520 540200
220
240
260
280
300
320
340
360
380
400
EM(nm)
EX
(nm
)
090.00180.0270.0360.0450.0540.0630.0720.0810.0900.0990.0108011701260135014401530162017101800
d)b)
Fig. 5. GFC and EEM characteristics of humic substances in EfOM and NOM.
135J. Guo et al. / Desalination 344 (2014) 129–136
on the surface of themembrane was formed, and cake filtration is spec-ulated to be the fouling mechanism. Laabs et al. (2006) speculated thatcake filtration was the predominant fouling mechanism for EfOM [31].Jarusutthirak and Amy also stated that the SMP fouling of UF mem-branes was associated with formation of a cake/gel layer due to size(steric) exclusion. This cake/gel layer, considered as a secondary mem-brane, acts as an effective secondary filtration layer for organic com-pounds. Then, a higher percent removal of organic compounds wasachieved, as greater flux decline was exhibited [3]. From our results,however, it is still difficult to draw the conclusion that cake layer forma-tion caused by biopolymers is the major fouling mechanism of EfOM,although the polysaccharide- and protein like substances can be easilyremoved compared with other foulants (humic substances). The ultra-filtration experiment in this study was not a long-term operationalprocess, and no sufficient biopolymers settled onto membrane surfaceto prove the presence of a gel layer. Besides, comparing with actualultrafiltration process, the dead-end ultrafiltration-processing mode inthis study was operated under constant pressure. Consequently, theresultswe obtained still have some limitations, and further investigationis needed.
5. Conclusions
1) Compared with NOM, a large proportion of DOC in EfOM couldbe removed by ultrafiltration with the 100 kDa membrane.GPC as well as EEM results all demonstrated that the removed
fractions in EfOM were anthropogenic polysaccharide- andprotein like substances including polysaccharides, proteins, andcolloids. With the decreasing of membrane's MWCO, the humicsubstances in NOM were more easily removed comparing withEfOM.
2) The overall DOC removal rate of EfOM was lower than that of NOMwith the decreasing of MWCO. During the ultrafiltration processes,it was speculated that decreasing the MWCO of the membranemight be more helpful for the removal of NOM compared withEfOM. As for EfOM, additional proposing technology should beadopted to increase its removal rate by ultrafiltration.
3) Humic substances were the main potential foulants during UFmembrane processing surfacewater. The polysaccharides associatedwith the colloidal fraction, as well as the humic substances werespeculated as themain potential foulants for UFmembrane process-ing wastewater EfOM. The fouling mechanism (cake filtrations orpore blocking) of EfOM or NOM in the ultrafiltration process wasrelated with the MWCO of the membrane and the molecular sizeof the main foulants.
Acknowledgment
The authors wish to acknowledge the fund support by the BeijingMunicipal Commission of Education (project KM201310005011).

136 J. Guo et al. / Desalination 344 (2014) 129–136
References
[1] H.K. Shon, S. Vigneswaran, S.A. Snyder, Effluentorganicmatter (EfOM) inwastewater:constituents, effects, and treatment, Crit. Rev. Environ. Sci. Technol. 36 (2006)327–374.
[2] D.J. Barker, D.C. Stuckey, A reviewof solublemicrobial products (SMP) inwastewatertreatment systems, Water Res. 33 (1999) 3063–3082.
[3] C. Jarusutthirak, G. Amy, Role of soluble microbial products (SMP) in membranefouling and flux decline, Environ. Sci. Technol. 40 (2006) 969–974.
[4] E. Pehlivanoglu-Mantas, D.L. Sedlak, Measurement of dissolved organic nitrogenforms in wastewater effluents: concentrations, size distribution and NDMAformation potential, Water Res. 42 (2008) 3890–3898.
[5] A. Matilainen, E.T. Gjessing, T. Lahtinen, L. Hed, A. Bhatnagar, M. Sillanpää, An over-view of the methods used in the characterisation of natural organic matter (NOM)in relation to drinking water treatment, Chemosphere 83 (2011) 1431–1442.
[6] R. Fabris, C.W.K. Chow, M. Drikas, B. Eikebrokk, Comparison of NOM character in se-lected Australian and Norwegian drinkingwaters,Water Res. 42 (2008) 4188–4196.
[7] Q. Wei, C. Feng, D. Wang, B. Shi, L. Zhang, Q. Wei, H. Tang, Seasonal variations ofchemical and physical characteristics of dissolved organic matter and trihalometh-ane precursors in a reservoir: a case study, J. Hazard. Mater. 150 (2008) 257–264.
[8] S.K. Maeng, S.K. Sharma, A. Magic-Knezev, G. Amy, Fate of effluent organic matter(EfOM) and natural organic matter (NOM) through riverbank filtration, Water Sci.Technol. 57 (2008) 1999–2007.
[9] T. Sirivedhin, K.A. Gray, Part I. Identifying anthropogenic markers in surface watersinfluenced by treated effluents: a tool in potable water reuse, Water Res. 39 (2005)1154–1164.
[10] S.N. Nam, G. Amy, Differentiation of wastewater effluent organic matter (EfOM)from natural organic matter (NOM) using multiple analytical techniques, WaterSci. Technol. 57 (2008) 1009–1015.
[11] J.J. Mobed, S.L. Hemmingsen, J.L. Autry, L.B. McGown, Fluorescence characterizationof IHSS humic substances: total luminescence spectra with absorbance correction,Environ. Sci. Technol. 30 (1996) 3061–3065.
[12] J. Chen, E.J. LeBoeuf, S. Dai, B. Gu, Fluorescence spectroscopic studies of naturalorganic matter fractions, Chemosphere 50 (2003) 639–647.
[13] J. Świetlik, E. Sikorska, Application of fluorescence spectroscopy in the studies ofnatural organic matter fractions reactivity with chlorine dioxide and ozone, WaterRes. 38 (2004) 3791–3799.
[14] P.G. Coble, Characterization of marine and terrestrial DOM in seawater usingexcitation–emission matrix spectroscopy, Mar. Chem. 51 (1996) 325–346.
[15] D.M. McKnight, E.W. Boyer, P.K. Westerhoff, P.T. Doran, T. Kulbe, D.T. Andersen,Spectrofluorometric characterization of dissolved organic matter for indication ofprecursor organic material and aromaticity, Limnol. Oceanogr. 46 (2001) 38–48.
[16] A. Baker, E. Tipping, S.A. Thacker, D. Gondar, Relating dissolved organic matterfluorescence and functional properties, Chemosphere 73 (2008) 1765–1772.
[17] R. Liu, J.R. Lead, A. Baker, Fluorescence characterization of cross flow ultrafiltrationderived freshwater colloidal and dissolved organic matter, Chemosphere 68(2007) 1304–1311.
[18] Q. Zhou, S.E. Cabaniss, P.A. Maurice, Considerations in the use of high-pressure sizeexclusion chromatography (HPSEC) for determining molecular weights of aquatichumic substances, Water Res. 34 (2000) 3505–3514.
[19] N. Park, B. Kwon, S.D. Kim, J.W. Cho, Characterizations of the colloidal and microbialorganic matters with respect to membrane foulants, J. Membr. Sci. 275 (2006)29–36.
[20] F.C. Wu, R.D. Evans, P.J. Dillon, Separation and characterization of NOM by high-performance liquid chromatography and on-line three-dimensional excitationemission matrix fluorescence detection, Environ. Sci. Technol. 37 (2003)3687–3693.
[21] N. Her, G. Amy, D. Foss, J. Cho, Y. Yoon, P. Kosenka, Optimization of method fordetecting and characterizing NOM by HPLC-size exclusion chromatography withUV and on-line DOC detection, Environ. Sci. Technol. 36 (2002) 1069–1076.
[22] E.M. Thurman, R.L. Malcolm, Preparative isolation of aquatic humic substances,Environ. Sci. Technol. 15 (1981) 463–466.
[23] J.A. Leenher, Comprehensive approach to preparative isolation and fractionation ofdissolved organic carbon from natural waters and wastewaters, Environ. Sci.Technol. 15 (1981) 578–587.
[24] J. Świetlik, A. Dabrowska, U. Raczyk-Stanislawiak, J. Nawrocki, Reactivity of naturalorganic matter fractions with chlorine dioxide and ozone, Water Res. 38 (2004)547–558.
[25] A. Imai, T. Fukushima, K. Matsushige, Characterization of dissolved organic matter ineffluents from wastewater treatment plants, Water Res. 36 (2002) 859–870.
[26] J. Guo, J. Ma, AFM study on the sorbed NOM and its fractions isolated from RiverSonghua, Water Res. 40 (2006) 1975–1984.
[27] T. Zhang, J. Lu, J. Ma, Z. Qiang, Fluorescence spectroscopic characterization of DOMfractions isolated from a filtered river water after ozonation and catalytic ozonation,Chemosphere 71 (2008) 911–921.
[28] H. Zhang, J.H. Qu, H.J. Liu, X. Zhao, Characterization of isolated fractions of dissolvedorganic matter from sewage treatment plant and the related disinfection by-products formation potential, J. Hazard. Mater. 164 (2009) 1433–1438.
[29] I. Sutzkover-Gutman, D. Hasson, R. Semiat, Humic substances fouling in ultrafiltra-tion processes, Desalination 261 (2010) 218–231.
[30] W. Gao, H. Liang, J. Ma, M. Han, Z.L. Chen, Z.S. Han, G.B. Li, Membrane fouling controlin ultrafiltration technology for drinking water production: a review, Desalination272 (2011) 1–8.
[31] C.N. Laabs, G.L. Amy, M. Jekel, Understanding the size and character of fouling-causing substances from effluent organicmatter (EfOM) in low-pressuremembranefiltration, Environ. Sci. Technol. 40 (2006) 4495–4499.
[32] E. Filloux, H. Gallard, J.P. Croue, Identification of effluent organic matter fractionsresponsible for low-pressure membrane fouling, Water Res. 46 (2012) 5531–5540.
[33] C. Jarusutthirak, G. Amy, Understanding soluble microbial products (SMP) as acomponent of effluent organic matter (EfOM), Water Res. 41 (2007) 2787–2793.
[34] R.K. Henderson, A. Baker, K.R. Murphy, A. Hambly, R.M. Stuetz, S.J. Khan,Fluorescence as a potential monitoring tool for recycled water systems: a review,Water Res. 43 (2009) 863–881.
[35] X. Zheng, M. Ernst, M. Jekel, Identification and quantification of major organicfoulants in treated domestic wastewater affecting filterability in dead-endultrafiltration, Water Res. 43 (2009) 238–244