ultimate guide ebook
TRANSCRIPT

8/15/2019 Ultimate Guide eBook
http://slidepdf.com/reader/full/ultimate-guide-ebook 1/218
Essential checklists
for traders

8/15/2019 Ultimate Guide eBook
http://slidepdf.com/reader/full/ultimate-guide-ebook 2/218

8/15/2019 Ultimate Guide eBook
http://slidepdf.com/reader/full/ultimate-guide-ebook 3/218
How to Get the Most Out of This Book
Thank you for downloading “Ultimate Guide to Trading and Investment” . This book is designedfor beginning, intermediate and advanced traders. The authors in this book are leading experts
in trading Stocks, Options, Futures, Forex and Nadex.
As you read this book, you will be exposed to multiple strategies that have high probabilities ofsuccess and/or high prot. Most of the chapters in this interactive eBook are divided into threesections:
• The Game Plan – An introduction to a charting technique. The strategy is thenthoroughly explained along with illustrations and examples.
• The Movie - A video that completely describes the strategy discussed in the chapter.
• Special Oers – If you really like a strategy, you can follow the presenter and thestrategy. There are thousands of dollars’ worth of trading tools, indicators, training and
mentoring services, books and videos available at steeply discounted prices.
In short, you should have all of the information you need to test and try out many of the newideas and concepts you will learn by reading this book.
Some of the things you will learn in this book are:
• The patterns and habits that are common to all successful traders
• How to eectively use Market Prole for trading Futures
• A simple 1-2-3 strategy for trading Forex currency pairs
• An all-hours Options strategy for Naked Put writing
• A rule-based method for trading with the trend
• How to spot when Big Money is entering the market and how to trade on their side
• And so much more … over 20 contributors with high probability strategies for tradingStocks, Options, Futures, Forex and Nadex.
Limited Edition hardcopy of the Ultimate Guide to Trading & Investment
For the rst time ever, the TradingPub has decided to produce a hardcopy edition of one of itspublications. You can now own a beautifully bound edition of the Ultimate Guide to Tradingand Investment - one of the greatest collections of trading and investment tips, tricks, tactics,
and strategies every collected in one place. And best yet, 100% of prots will be donated tocharities to benet low income children, raise awareness for cancer research, and give back tothe community. Tap this link to learn more about this limited time oer!
Make sure you also subscribe to TradingPub. We provide free eBooks, webinars, on-demandvideos and many other publications for active traders in all of the markets. Our presenters areworld-renowned industry experts and our content is provided free of charge in a relaxed andfriendly setting. Cheers to your trading success!

8/15/2019 Ultimate Guide eBook
http://slidepdf.com/reader/full/ultimate-guide-ebook 4/218
Table of Contents
Successful Traders Handbookby Rick Saddler, Hit & Run Candlesticks
STOCKS
Market Perspectives
FOREX
07
30 Trading Insights to Help You Overcome Your Trading Fears
by Tom Busby, Diversified Trading Institute
17
High Profit Candlestick Signals and Patterns
by Steve Bigalow, Candlestick Forum
28
A Simple Method for Trading with the Trend
by Jeffrey Gibby, MetaStock
39
How To “Buy Low” for Bigger Profits, Less Stress,and More Enjoyable Trading
by Geoff Bysshe, Market Gauge
47
Mastering the Perfect Pullback: Five Steps to Improve Your Trend Tradingby Corey Rosenbloom, Afraid To Trade
60
A Simple 123 Forex Strategy
by Jody Samuels, FX Traders Edge
72
The London Breakout Sessionby Josh Martinez, Market Traders Institute
81
What Is the Best Time to Trade Currencies?
by Ricardo Menjivar, Phoenix Trading Strategies
86

8/15/2019 Ultimate Guide eBook
http://slidepdf.com/reader/full/ultimate-guide-ebook 5/218
OPTIONS
NADEX ®
FUTURES
How to Add Weekly Options to Your Trading Arsenal
by Andrew Keene, Alpha Shark Trading
97
Naked Put-Writing: A Strategy for All-Hours
by Lawrence McMillan, McMillan Asset Management
105
Trading Earnings Straddles
by Kim Klaiman, Steady Options
116
Getting Started with Nadex® Binary Options
by Cam White, TradingPub
127
Using Nadex ® Spreads as the Ultimate Hedge Strategyby Darrell Martin, Apex Investing Institute
137
Creating Nadex® Trading Plans
by Sean Jantz, Binary Trade Group
147
How to Find High Probability Trades Using Nadex® Binary Options
by Mark Hodge, Rockwell Trading
153
How to Use Market Profile to Trade Futuress
by Greg Weitzman, The Trading Zone
163
6 Essential Ingredients for Winning at Stock Index Trading”
by Mohan Wolfe, Day Traders Action
171
Trading On The Side Of Strength
by Peter Davies, Jigsaw Trading
177
If I Had to Choose Only One Trading Indicator
by Mark Helwig, ValueCharts
186
Trading the Trends
by David Katz, Trading Fibz
200

8/15/2019 Ultimate Guide eBook
http://slidepdf.com/reader/full/ultimate-guide-ebook 6/218
ultimate guide to trading and investment
6
Market Perspectives

8/15/2019 Ultimate Guide eBook
http://slidepdf.com/reader/full/ultimate-guide-ebook 7/218
ultimate guide to trading and investment
7
HABITS OF A SUCCESSFUL TRADER
Every trader has bad habits that they would like to change. Some habits are buried deep within anneed to be brought to the surface so they can be identied and changed.
A good way to identify and change habits that are aecting your trading is to look at the habits osuccessful traders. While reading this chapter, do a self analysis of your habits by comparing themagainst the habits of successful traders. As you identify habits that you would like to change, writthem down and describe what action you will take to change these habits. Then take the actions thayou describe.
Have a plan for every trade. This means that you write down your entry, exit and stop loss strategfor every trade. Then execute the trade and stick with the plan. If your trade is based on a dailchart, then follow the daily chart when monitoring your position. On your trade plan write the chafrequency you will use to monitor the position. Some traders may decide to plan and monitor tradeon a daily basis but use a lower time frame chart such as a 60 minute chart to monitor a position thais getting close to an exit area.
Watching intraday charts for trades planned on daily charts can cause you to react emotionally anis one reason traders may close positions too early and not according to plan.
This can have a detrimental eect on prots. Base your trade plan on what you see and not whayou predict. What you see on a chart is fact. What you predict is ction. No one has a crystal ball thaaccurately predictsprice action but we all have charts that give us information that contain the factabout price. One way to test yourself using predictions is to pay attention to your choice of wordsWords like “I think”, “I feel” are most likely predictions.
Know who you are as a trader and be your own trader. Do you have the personality for swing, day olong term trading? Stick with the type of trading that ts with your lifestyle and personality.
Be your own trader and don’t be a follower.
You need to be condent in the trades you execute and this means understanding the trade anbelieving in the trade. Just because someone else takes a trade doesn’t mean it is right for you.
Successful Traders HandbookBy Rick Saddler, Hit and Run Candlesticks

8/15/2019 Ultimate Guide eBook
http://slidepdf.com/reader/full/ultimate-guide-ebook 8/218
ultimate guide to trading and investment
8
Focus on the best trades for you. Study stock charts and identify high probability setups. Start wione or two trade setups, master them and then add more setups.
Have a “Trading Business Plan”. Every successful business owner has a business plan. Sinc
trading is a business, traders should have a business plan. There is a lot of information out there odesigning business plans. A suggestion is to keep it short and simple. A one or two page businesplan is sucient for most traders. You can always add to it as you go along. The point is to have business plan that is convenient and you will use as a reference to certain aspects of your tradingImportant topics to address in the
business plan are
• Describe what kind of trader you are. Are you a day, swing or long term trader.
• What time frames during market hours will you be trading?
•
How much capital do you have for trading and how much of that capital will you
commit to any one trade?
• What trade method and trade setups will you be trading? If you are trading price
patterns, indicate what chart time frame and what patterns you will be trading.
• For each trade setup, describe the entry, exit and stop loss strategy. Include a
description of when you will add to a position, raise your stop and scale out of a
position.
• Under what conditions will you stop trading for the day, week or month. For example,
“You (the trader) will stop trading for the day or week if you have 3 losing trades.”
• What is your trading goal?
• Describe any psychological rituals you will use to stay focused or get focused. Some
traders will use tapping sequences, meditation or other form of behavior modication
technique.

8/15/2019 Ultimate Guide eBook
http://slidepdf.com/reader/full/ultimate-guide-ebook 9/218
ultimate guide to trading and investment
9
Document every trade. Use a spreadsheet/log to document your trades. In addition, you may wanto mark up a stock chart for each trade. On the stock chart, you indicate your entry, target and stoYou can also mark resistance and support areas along with trendlines and other notations to helmanage the trade. Many stock trading programs have an annotation feature that helps you mark u
charts. Save these marked up charts in a le or print them o for review.
Review your trade journal/log and identify areas of improvement. This is one of the best ways to groas a trader. You may want to write a weekly summary of what you will do in the next week to improvyour trading.
Know when to trade and have the discipline not to trade. Trade only when the market gives you cleadirection. If you are confused, have trouble nding trades that meet your rules or do not know what tdo, these are signs that the market may be in a state of ux and not conducive to your style of trading
There are times to stay in cash or just manage the positions you have working. It is okay not to tradevery day. In fact, forcing trades in an undesirable market often leads to losses. Have patience an
wait for your setup!
Accept your losses. No one is right all of the time and trade setups do not always go the way yowant them to. That is why you place stops with every trade entry. A stop is what you plan in advancand are willing to risk for the reward you specied in the trade plan.
Traders that don’t want to accept losses or set stops frequently let their losing trades run. They maeven average down as price is falling only to watch the loss grow. Eventually, these traders are sdevastated nancially and emotionally that many quit trading. Copy the sentence below and post where you will see it.
It is not whether you are right or wrong on a trade it is how much prot you accumulate in you
account!
Take action! You may have the best intentions by developing a plan for every trade and documentinevery trade. The most important thing is to execute the trade according to plan and to review youdocumentation with a critical eye and make changes in your trading behavior that will improve youtrading results. Be honest with yourself when evaluating your performance and take responsibility btaking action to improve that performance.
Have a trading goal. Set a realistic goal so that you have a benchmark for measuring your improvemenand trading success. Some traders establish a daily, weekly or monthly monetary goal. You may alsconsider a daily, weekly, or monthly percentage goal such as 2% return on capital per week. Set thgoal that makes the most sense for you. The point is “set a goal” and keep track of your progress i
meeting this goal.

8/15/2019 Ultimate Guide eBook
http://slidepdf.com/reader/full/ultimate-guide-ebook 10/218
ultimate guide to trading and investment
1
Develop the right attitude about your trading business. What does this mean? Take a proactivapproach to achieve positive results. Actions you can take toward developing the right attitude are
• Identify what you may need help with and “get help”. This can be nding a trading coac
signing up for a webinar, reading written material.
• Persevere! Don’t give up because you make mistakes. Learn from your mistakes by identifyinthem, writing what you will do to correct them and then act on what you write.
• Follow and execute all plans that you make. You constructed these plans for a reason skeep these plans handy so you can refer to them often and take the planned action.
By taking these actions you are being proactive to making the necessary improvements to keep yotrading business moving in a positive direction. There will always be rough times. Successful tradeuse these times as an opportunity to learn and to grow their business.
Thomas Edison once said: "Many of life's failures are people who did not realize how close theyweto success when they gave up."
SUMMARY
• Habits of a successful trader are
• Have a plan for every trade
• Base your trade plan on what you see and not what you predict
• Know who you are as a trader and be your own trader
• Focus on the best trades for you
• Have a Trading Business Plan
• Document every trade
• Review your trade journal/log and identify areas of improvement
• Know when to trade and have the discipline not to trade
• Accept your losses
• Take Action!
• Have a trading goal
• Develop the right attitude about your trading business

8/15/2019 Ultimate Guide eBook
http://slidepdf.com/reader/full/ultimate-guide-ebook 11/218
ultimate guide to trading and investment
1
"The dierence between who you are as a trader
and who you become as a trader is what you do!"
DEVELOPING THE RIGHT MIND SET FOR TRADING
Achieving the right mind set for trading is the result of a long process. It goes hand in hand witdeveloping the skill for trading and building condence in yourself and your trading.
Don’t expect this to happen overnight. The mechanics of trading is a skill that develops over time
Along with that, as your trading skills improve so does your condence. “Condence” is a state omind and what helps traders to execute trades.
Think of it this way, when you don’t have condence you are fearful and hesitant to take action. If yohave condence, you are brave and take prompt action. How do you develop the skill and condencthat relates directly to developing the right mind set for trading?
• SKILL - Education is the foundation in developing trading skills.
• SKILL and CONFIDENCE - Practicing what you learn through education and by applying tha
knowledge to chart reading develops skill in spotting trading opportunities. It also developthe condence to know that these trading opportunities are protable.
• CONFIDENCE - Selecting trading methods and designing trade setups for those methodhelps traders to condently execute trades.
Following this approach to trading leads to achieving the right mindset for trading. In a nutshelSKILL + CONFIDENCE = Right Mindset for Trading. Whether you are new to trading or a skillfutrader who lacks condence, the components described here will help you to develop and maintaithe right mindset for trading.

8/15/2019 Ultimate Guide eBook
http://slidepdf.com/reader/full/ultimate-guide-ebook 12/218
ultimate guide to trading and investment
1
Education
As with any new skill, the foundation is education. Ask yourself “would you start to build a houseyou had no knowledge of construction concepts and applications?” NO! Traders rst learn the basic
such as technical analysis and fundamental analysis.
Read books and attend webinars/workshops. This is really the start of building your knowledgbase so you can later shape your trading style and philosophy. As you mature as a trader, educatiocontinues to play an integral role in your success so you never stop learning.
Stock Chart Reading
This is where you start to apply what you have learned in the education phase. Choose a stoccharting platform, set up your charts using your favorite price display (e.g., candlesticks, bar, lineand technical indicators (e.g., moving averages, MACD, Stochastics).
Then scroll through a series of charts drawing horizontal lines to notate support and resistancdrawing circles around price patterns, drawing trend lines and notating the outcomes of price pattern(e.g., this price pattern price advanced 5% before hitting resistance). Notating the outcomes of pricpatterns will help you to determine which price patterns are most protable.
Reading stock charts is like learning a new language, the more you practice reading the charts, thmore procient you become. This is a very critical step in developing condence in your trading whicleads to being in the right mind set. As you read hundreds and even thousands of charts you artraining your eye to see certain patterns. As you practice reading and ipping through charts, you wbe amazed at how quickly you will be able to spot certain patterns and trade opportunities.
Traders who are procient at reading charts and have a list of protable patterns often use scannin
software to generate lists of stocks with those patterns. These scans are great as a tool to narrowdown the selection of stocks to view. Traders still need to view each stock chart on the list generateby the scan in order to select the stock with the best potential according to their rules.
Trading Methods and Setups
During the beginning phases of your educational journey, you are simply collecting knowledge anexploring many dierent aspects of trading. You might say that you are collecting the ingredientnecessary to develop trading methods and setups. While practicing your chart reading skills you abuilding condence in identifying the chart characteristics you want to focus on.
Trading methods relate to what kind of trading you will focus on and the intricacies of those method
that become part of your library of trade setups. These trade setups supply the framework foexecuting your trades. Building solid trade setups is the key to building your condence as a tradeThe more success you have with these trade setups the less fearful and less hesitant you will be texecute them.
It is essential that you write down every trade setup in terms of your entry, exit and stop loss strateg

8/15/2019 Ultimate Guide eBook
http://slidepdf.com/reader/full/ultimate-guide-ebook 13/218
ultimate guide to trading and investment
1
This way you always know what you are risking on each trade, where you will enter the trade anwhat your potential prot is on that trade. This helps to minimize emotion and maximize disciplinand condence.
To give you an idea of what a trading method is consider that you have decided to trade pricpatterns using candlestick price displays on a daily chart.
Trading price patterns using candlestick price displays on a daily chart is a trading method. Withthis trading method there are various patterns such as the “W” pattern, Head & Shoulders patternand J-Hook pattern.
Let’s say you limit your trading to these 3 patterns because they are easiest for you to spot, understanand through your stock chart research have found themto be protable. The next step is to design trade setup for each of these patterns.
With each trade setup, you describe your entry, exit and stop loss strategy. In addition you add tha
each trade must have a certain risk to reward ratio. For example, every trade must have a 3-1 rewarto risk ratio which means that if my stop represents a $.50 loss, my anticipated reward must be aleast $1.50.
Sample J-Hook Pattern with Trade Setup - Next Page

8/15/2019 Ultimate Guide eBook
http://slidepdf.com/reader/full/ultimate-guide-ebook 14/218
ultimate guide to trading and investment
1
Trade Setup
Entry - Enter on the day of the breakout if the candlestick looks like it will close above the breakoulevel. Another entry is the day after the breakout on an opening price above the breakout level.
Stop - A price below the breakout level. Consider your risk tolerance when setting this
stop. If the stop price is more than you can tolerate, then move to another trade.
Exit - Determine resistance levels and use them as possible exit areas. When price approacheone of these areas, look for candlestick sell signals and then decide if you will take all or part of yoprots. At the very least, raise your stop to protect prots.
Reward to Risk Ratio - The exit for prot must be at least 3 times the stop loss.
Personality Assessment
Traders determine which types of trading are right for them after they are well educated in the typeof trading. Traders who do not want to sit at a computer all day long may choose swing trading olong term trading. Traders who like a lot of action and make decisions quickly and don’t want to hopositions overnight may choose day trading.
Assessing your personality may take some time and many traders try dierent types of trading to sewhat they are best suited for. When starting out, it is best to focus on education, stock chart readinand trading methods/setups using daily charts. Over time it will become clear as to which style trading best suits your personality.
SUMMARYThe Right Mindset for Trading is achieved by developing your trading skills and building yocondence in executing trades. This is a process that involves education, stock chart reading, andesigning trade setups for the trading method you select. The bottom line is SKILL + CONFIDENC= Right Mindset for Trading
SPECIAL OFFER
Get Rick's entire book, SIMPLY CLICK HERE, for a great deal!

8/15/2019 Ultimate Guide eBook
http://slidepdf.com/reader/full/ultimate-guide-ebook 15/218
ultimate guide to trading and investment
1
ABOUT THE AUTHOREight years ago Rick Saddler had a dream to quit his day job and trad
for a living. That is how he came about to start Hit and Run CandlesticksHe felt that he was getting ready to replace his income from the johe had at the time. This, however, didn't happen overnight, as he hastarted trading 1993.
He had a dream to quit his day job and learn to trade the stock market and so his journey begaaround 1989, when he started dabbling in the market.
At the beginning he would make a little money and lose a little money, but the bottom line was thahe was not protable. While he continued to dabble with his trading strategies, it wasn't until May o2002 that he became serious about his future as a trader. He was mentored by Stephen Bigalow ohow to trade with Japanese Candlesticks and his education paid o. Over the course of his tradin
Rick has learned to stay committed to his strategies and trade with easy-to-spot patterns with cleaentry and exit points.
He has now put his ability to recognize the same pattern developing in hundreds of charts and couenter with low risk on a short-term trade, grab any prots and sleep well at night. That is why hstarted his company, so he can help other traders achieve that same consistency

8/15/2019 Ultimate Guide eBook
http://slidepdf.com/reader/full/ultimate-guide-ebook 16/218
ultimate guide to trading and investment
1

8/15/2019 Ultimate Guide eBook
http://slidepdf.com/reader/full/ultimate-guide-ebook 17/218
ultimate guide to trading and investment
1
Experience is a great teacher, and nothing is better than learning from the wisdom of traders whohave been in the trenches for years. Tom Busby started his trading career as a Vice President o
Smith Barney. He is a member of the Chicago Mercantile Exchange, and one of 50 people selecteworldwide for the rst Globex terminals in the late 1990’s.
He is the author of three books, “Winning the Day Trading Game,” , “The Markets Never Sleep” an“Trade to Win” (all available on amazon.com). In 1996, he founded DTI - a brick and mortar tradingeducation business that provides classroom and online training for active traders.
With decades of trading experience, Tom has many insights that he has learned along his journetrading the markets. What follows are 30 of his trading insights. Some of them are historicaobservations of market behavior and some are common sense. When you are nose down tradinthe markets, it can be very helpful to step back and review common-sense trading insights to helpmaintain your focus.
DTI Headquarters in Mobile, AL
30 Trading Insights to Help You
Overcome Your Trading FearsBy Tom Busby, Diversified Trading Institute

8/15/2019 Ultimate Guide eBook
http://slidepdf.com/reader/full/ultimate-guide-ebook 18/218
ultimate guide to trading and investment
1
Insight #1
Record prices on the rst day of the year. This helps you trade the winners.
On the rst day of the year, record the prices of all the markets you trade. Do you know what the pricof gold was at the rst of the year? If you trade gold and you knew that gold was trading at 1200, yowould know today whether to be long or short gold. Having an historical perspective of your favorimarket can help you identify long-term trends and can be an important decision-making tool. Recothe rst day of the year prices of your favorite markets, and display them in a place where you casee them every day.
Insight #2
When prices are trading at their highs, they tend to make higher highs.
When prices are trading at their lows, they tend to make lower lows.
When prices are trading at their highs, they tend to make higher highs. This was the story for the 2quarter of 2014. The S&P 500 made one record high after the next. Be mindful of this insight wheyou see your favorite market as it hits new highs or lows.
Insight #3
The market usually reverses its trend after July 4
If the market has been on an uptrend, it is common for it to reverse its direction after July 4, and threversal usually continues through Labor Day. It doesn’t happen all the time but it happens quifrequently.
Insight #4
When a stock crosses the $100 price, it will typically go to $110. This is also true when stocks cross the $200 line, it will go to $220.

8/15/2019 Ultimate Guide eBook
http://slidepdf.com/reader/full/ultimate-guide-ebook 19/218
ultimate guide to trading and investment
1
This trend happens with surprising frequency. Take a look at any stock that has crossed the $10line. What you will discover is that the stock will reach $110 within a relatively short period of timeThe same phenomenon occurs when stocks cross a major threshold, like the $200 line. This can givyou a trading edge when you see this happening.
Insight #5
The 6:00am CDT price on the Dax futures is the most important pricein the Dax for that day of trading.
It should be used as a pivot to gauge whether the overall market will be up or down for the session.
Take a look at the hourly charts for the Dax. You will notice that the high or low of the day usuallreveals itself at the 6:00am bar. This can give you a very strong advantage when trading the DaxThis information can be especially valuable if you trade Nadex binary options.
Insight #6
Think of trading as a journey. Enjoy the trip and learn continuously from it.
Traders have a tendency to obsess on the trades they are currently making, but it is more importanto take a long-term view and take a look at today’s trading as just part of a long-term journey. Enjothe ride, learn from all of your experiences, and focus at getting better at your craft. Study thmarkets and study yourself.
Insight #7
The market is open 24 hours a day. Learn to take advantage of it.
There are trading opportunities available the entire day. If you become familiar with the AsianEuropean and U.S. markets there are opportunities available to you around the clock. Here’s a chaof the markets:
Trends can follow from Asia to Europe and into the US market, which is divided into a morning anevening session. If you watch trends transition through markets, it can give you a trading edge.

8/15/2019 Ultimate Guide eBook
http://slidepdf.com/reader/full/ultimate-guide-ebook 20/218
ultimate guide to trading and investment
2
Insight #8
Don’t worry about the direction of the market.
Go with the market.
If a stock or market is trending up or down, stay on the side of the trend. If you watch the steady risof Apple (NASDAQ: AAPL) you know it would be absolutely foolish to try to predict a downtrend. Gwith the market when it’s trending and don’t ght it.
Insight #9
Markets respect news. You should too.
There are eight Federal Reserve meetings per year, and you need to have them on your calendaThe rst Friday of every month there is a major news announcement about jobs and unemploymenThat’s 20 major economic news events. The markets are very sensitive to these events, and yoneed to be aware of them.

8/15/2019 Ultimate Guide eBook
http://slidepdf.com/reader/full/ultimate-guide-ebook 21/218
ultimate guide to trading and investment
2
Insight #10
Know when important economic data is being reported.
Then use that information to make money.
Know when economic reports are due to come out. Barrons.com and Investing.com provide valuabcalendars of economic reports with indicators that rank their likely impact on the markets.
Insight #11
Every Wednesday, a Crude Oil report is released at 9:30am CDT There are pre-market trading opportunities in the crude sector
during the morning of the announcement.
Crude oil has a tendency to be very volatile around the release of this report, and there are tradinopportunities in advance of the report and directly after the release of the report.
Insight #12
Crude oil tends to have a negative closeon the last trading day of the month.
Here’s a little-known fact. Production checks for oil producers are paid out based on the closing pricfor oil at the end of the month. This has a tendency to move the market down slightly.
Insight #13
Fed announcements provide opportunities to locate trending opportunities in stocks, futures and options trades
for 3 days after the Fed announcement.
There’s a 48-hour window after a Fed announcement that allows people to have a good trend tradeFind out when the Fed is going to have an announcement, and for the next 3 days afterwards, yocan identify a good trending trade opportunity.

8/15/2019 Ultimate Guide eBook
http://slidepdf.com/reader/full/ultimate-guide-ebook 22/218
ultimate guide to trading and investment
2
Insight #14
The night of the Presidential election oers great trading opportunities after 7:00pm CDT.
If you go back to the year 2000, when the race was really tight between Bush and Gore, the markrallied every time Florida went to Bush, and sold o when Florida went to Gore. There are a lot good trading opportunities on the night of the Presidential election.
Insight #15
The day after Thanksgiving tends to have
one of the largest percentage up days of the year.
If you get up at 6:00 and trade ahead of the markets open, you can make some very good monethe day after Thanksgiving.
Insight #16
Be open-minded, and continue to learn.
There are always new things you can learn about trading, regardless of how long you have been doinit. Maybe it’s the 6:00am Dax rule. Maybe it’s the $100 stock rule. There is a wealth of information othere that can give you a trading edge. Stay open-minded, be nimble and continue to learn.
Insight #17
The week of December 26 – January 1 is thebest trading week of the year.
Most people take o this week, but if you ever want to catch a trend, there is no better week to do

8/15/2019 Ultimate Guide eBook
http://slidepdf.com/reader/full/ultimate-guide-ebook 23/218
ultimate guide to trading and investment
2
Insight #18
When overall market prices have risen2.5 percent during any session,
DO NOT GO SHORT.
If the market goes down less than 2.5 percent it will probably bounce back up. If the market rises 2.percent, do not go short. If the market breaks through 2.5 percent going down, it will probably keegoing down. 2.5 percent is a good band to have around the markets.
Insight #19
Like your stock choices, but don’t marry them.
When they stop paying, it’s time to split-up.
If the markets are having a big up day, and your stock isn’t moving, you might be in a bad relationship
Insight #20
Chicken, sh or steak?
Make a decision and move on.
Don’t beat yourself up second-guessing your decisions. When you made a decision to trade, it wahopefully based on some type of analysis. Remember you are on a journey, and the choice you madtoday could work in your favor even if it is moving against you a little.
Insight #21
If the general market is moving up and your stock is not – you have a problem.
More specically, if the overall market moves up 2 percent, and your stock is moving down – GET OUT.
Your stock should never be moving against the market, especially if the market is rallying.

8/15/2019 Ultimate Guide eBook
http://slidepdf.com/reader/full/ultimate-guide-ebook 24/218
ultimate guide to trading and investment
2
Insight #22
Stocks that have been the most bullish typically fall the fastest in a down-trending market
This is just the way markets seem to behave. Stocks with the greatest bullish momentum also fathe fastest.
Insight #23
Take losses more quickly than prots.
Riding prots long and getting out of losses quick is a major key to successful trading.
Insight #24
Always use a STOP
Trading without setting a stop is the easiest way to wipe out an account. Knowing where to set yostops and managing your risk is critical.
Insight #25
When you hear someone say “You don’t go broke taking prots.” – RUN
That’s exactly how it happens
You don’t take trades to make a small fraction of your potential prots, you take trades to reach a
objective. That’s why it’s important to have a plan when you trade.

8/15/2019 Ultimate Guide eBook
http://slidepdf.com/reader/full/ultimate-guide-ebook 25/218
ultimate guide to trading and investment
2
Insight #26
When entering a position, always knowwhere the exit resides.
This goes back to having a trading plan. Always know what you plan to risk and where your rewardlies. This also means you need to know when to get out of a trade.
Insight #27
Never risk too much in any trade.
No trade is worth potentially losing
more than 10 percent of your account balance.
How big of an account do you need to have to stay within this rule? If you are risking $300 on a tradeyou know you have to have at least a $3,000 account balance.
Insight #28
Learn how to win
from your losing trades.
Analyze your losing trades. Keep a log of them. What went wrong? Often times the answer lies itiming, execution or not following the rules of a trading plan.
Insight #29
Overtrading will make you lose.
Don’t lose.
There are lots of reasons why people overtrade, but it leads to losing money. Quit when you’re aheaand don’t give your prots back. Give yourself some “Time Out” rules. Maybe if you have had 2consecutive losses, it’s time to take a “time out” to prevent revenge trading from creeping in.

8/15/2019 Ultimate Guide eBook
http://slidepdf.com/reader/full/ultimate-guide-ebook 26/218
ultimate guide to trading and investment
2
Insight #30
Some days, your best trading decision may be to stay in bed.
If the markets are not moving according to your trading plaor if you just don’t see the trade, then it’s best not to take the trade.
CONCLUSION
The trading insights outlined in this chapter will help give you a trading edge. While many of thesinsights are common sense, we sometimes lose sight of common sense when we trade the marketTips like the 6:00am rule for trading the Dax, and other historical observations can denitely give yo
an advantage. If you pay attention to these insights, you probably win more trades with condence
THE MOVIE
Tom Busby goes through the 30 Trading Insights, and shares some of his insights in overcomincommon trading fears. He also uses his trading method to demonstrate a live crude oil trade.
SEE FULL VIDEO HERE
SPECIAL OFFER FROM DTI
Get a free PDF and Video report for strategies to help you overcome fear in your tradingSIMPLY CLICK HERE for your copy.
ABOUT THE AUTHORMr. Tom Busby founded DTI Partners, Inc. in 1996 and serves as its ChiExecutive Ocer. Mr. Busby spends his days teaching his students and tradinhis own private account in futures, options and equities. He is a pioneer the trading industry as a world-recognized educator. His career started as
money manager with some of the world's largest wire houses. He is also thauthor of three books, “Winning the Day Trading Game,” “The Markets NeveSleep” and “Trade to Win.” Mr. Busby served as an educator in weekly onlinwebinars for the Chicago Mercantile Exchange, where he has been a memb
since 2002. He also served as a Member of the Chicago Board of Trade, who has also called oBusby to trade live in CBOT sponsored events at some of the largest trade shows in the industry.

8/15/2019 Ultimate Guide eBook
http://slidepdf.com/reader/full/ultimate-guide-ebook 27/218
ultimate guide to trading and investment
2
STOCKS

8/15/2019 Ultimate Guide eBook
http://slidepdf.com/reader/full/ultimate-guide-ebook 28/218
ultimate guide to trading and investment
2
As long as buyers and sellers have been trading the markets, two predominant sentiments have beein play: fear and greed. Centuries ago, Japanese rice traders developed the candlestick method tgraphically depict trader sentiment. It has worked successfully for hundreds of years, and still worktoday. Candlestick analysis can help you make better trading decisions about investor sentiment the markets.
The Japanese rice traders didn’t just become wealthy using candlesticks, they created legendawealth trading a basic commodity. This method works for any trading instrument as long as the bashuman emotions of fear and greed are involved – which pretty much covers every market.
Candlestick analysis prepares you to be ready for big price moves based on historic results of specisignals and patterns. It’s simply a graphic depiction of investor sentiment. The Japanese rice tradegave us not only the benet of knowing what the signals look like, but they also described what thinvestor sentiment was behind each signal There are 50-60 signals to learn, but eight of the mosuccessful candlestick signals will be discussed in this lesson.
The most benecial thing about candlesticks is that they help identify trends.
High Profit Candlestick Signals and PatternsStephen W. Bigalow, Candlestick Forum

8/15/2019 Ultimate Guide eBook
http://slidepdf.com/reader/full/ultimate-guide-ebook 29/218
ultimate guide to trading and investment
2
But rst, to help identify trends, you need a few indicators. Here’s what they are:
• Red Line: 200 day simple moving average (SMA)
•
Blue Line: 50 day simple moving average
• Gray Line: 20 day simple moving average
These indicators are important because every money manager in the world uses these indicators thelp them make decisions when trading their portfolios.
The most important indicator is the T-Line, which is the 8 Exponential Moving Average (EMAThe T-Line has some very simple rules:
• If you see a candlestick BUY signal ABOVE the T-Line, you are in an UPTREND
•
If you see a candlestick SELL signal BELOW the T-Line, you are in a DOWNTREND
Stochastics are used to indicate overbought and oversold conditions. If you see a candlestick BUsignal in an oversold condition, there is a strong probability that you are going to be going into auptrend. Conversely, if you see a candlestick SELL signal in an overbought condition, you are likeheading into a downtrend. The settings that I use for stochastics are 12,3,3. These settings havworked the best for what I do most of the time, which is swing trading.
Summing it up, if you plot the 200, 50, and 20-day Simple Moving Averages, along with the Exponential Moving Average, and stochastics set at 12, 3, 3 – then you are good to go. Let’s sehow these indicators work with candlestick patterns:

8/15/2019 Ultimate Guide eBook
http://slidepdf.com/reader/full/ultimate-guide-ebook 30/218
ultimate guide to trading and investment
3
In this daily chart, the stochastics are in an overbought condition with candlesticks above the T-LinOnce they turn red and break through the T-Line, a downtrend is established until a Morningstapattern at the bottom triggers a reversal to the upside.
The rest of this chapter will be devoted to the top bullish candlestick power signals. If you know theand can identify them you will have a much better handle on identifying trader sentiment.
The Top Eight Bullish Power Signals
1. Your Best Friend
2. Left/Right Combo
3. Series of Doji’s
4. Candlestick Patterns followed by Gap Ups
5. Kicker Signal
6. Bullish Flutter Kicker
7. Steady Eddie Trends
8. Magnitude of a Signal
Your Best Friend

8/15/2019 Ultimate Guide eBook
http://slidepdf.com/reader/full/ultimate-guide-ebook 31/218
ultimate guide to trading and investment
3
A Doji occurs whenever the market opens and closes at the same level during a particular timframe.
• Doji Star: Small price movement.
• Long-legged Doji: If the price movement is huge, but the bar closes where it opened.
• Dragony Doji: Where the price opens and closes at the top of the bar.
• Gravestone Doji: Where the price opens and closes at the bottom of the bar. It got its namfrom Japanese soldiers pressing on in battle only to retreat back to camp.
A derivative of the Doji is the Spinning Top. Spinning Tops are characterized by short candle bodiewith short wicks, similar to the child’s toy. Spinning tops signal indecision between the bulls and thbears in the marketplace. When you see a spinning top or Doji at the top, you want to consider takinprots. If you see them at the bottom, there’s likely to be an uptrend.
A Doji in an oversold area, followed by a gap-up, gives you a very strong probability that yoare about to enter a strong uptrend. The beauty of candlesticks again is that they capture investosentiment. When you are at the bottom of the market in oversold territory, as indicated by stochasticsand a Doji appears, it signals indecision. If it is followed by a strong gap-up, closing above the T-Linethen a strong uptrend is building.

8/15/2019 Ultimate Guide eBook
http://slidepdf.com/reader/full/ultimate-guide-ebook 32/218
ultimate guide to trading and investment
3
One caveat to this strategy is that when the candlesticks start moving well above the T-Line, theare going to want to come back to the T-Line, so you want to be prepared to take prots if necessar
To summarize, here are the optimal criteria for the “Best Friend: scenario:
1. Look for the signals
2. Stochastics oversold
3. Gap-up from the Doji signal. The bigger the Gap-up the stronger the uptrend
4. Close above the T-Line
Note: At the end of this chapter, click on the YouTube presentation of this topic for many morexamples of the “Best Friend” bullish signals in action.
Left/Right Combo

8/15/2019 Ultimate Guide eBook
http://slidepdf.com/reader/full/ultimate-guide-ebook 33/218
ultimate guide to trading and investment
3
The Left/Right Combo is a Doji followed by a bullish engulng signal. The bullish engulng signacompletely encapsulates the previous candle body. Since the Doji body is small, it represents moment of indecision followed by a clear bullish move. The Left/Right Combo is like a boxer settinup a small left jab with a roundhouse right punch. In this example we have a small Doji, followed by
bullish engulng signal and a strong upward move in the stochastics. Notice there is a series of Dojin this chart. If one Doji signals indecision, a series of Dojis indicates greater indecision. If you see strong candlestick buy signal, followed by a series of Dojis and the next bar gaps-up signicantly, strong bullish move is in play, and you want to be buying.
Series of Dojis
Remember that a Doji represents indecision. if you see a series of Dojis it represents greater indecision
When you see a series of Dojis setting up, and stochastics start moving up, with candlesticks closinabove the T-Line, it signals a positive open the following day and trigger to buy.
Bear in mind, you still need to do your due diligence. Make sure to check the pre-market futures thnext day, and make sure there isn’t any economic or geopolitical news that could adversely impayour decision to buy. But if the futures are moving in the same direction as your trend, it’s a signal tproceed and buy.

8/15/2019 Ultimate Guide eBook
http://slidepdf.com/reader/full/ultimate-guide-ebook 34/218
ultimate guide to trading and investment
3
Candlestick Patterns followed by Gap-Ups
Any signal followed by a gap-up is a signal to buy. In this case, we have a hammer signal, followed ba bullish gap up. Once the candles close above the T-Line along with a corresponding upward movin the stochastic, it signals a strong buying trend.
When we see a gap-down in an oversold condition it’s just telling you that most people panic whethe market is at the bottom. How can you tell if the market is at its bottom? With candlestick patternonce you see a gap-down in an oversold condition, start looking for signs of a reversal. It could beDoji, a series of Dojis or a gap-up reversal.
Bullish Kicker Signal
The strongest of all buy signals is the Bullish Kicker Signal. This is when the market is in downtrend, and the following bar opens in a gap-up above the previous day’s high. This pattersignals that investor sentiment has been kicked the other way.

8/15/2019 Ultimate Guide eBook
http://slidepdf.com/reader/full/ultimate-guide-ebook 35/218
ultimate guide to trading and investment
3
In this example, there is a signicant gap-up above the previous day’s downtrend. The gap-up is we
above the T-Line and there’s a strong upward move in the stochastics. This signals a very strongchange in investor sentiment.
Some traders are afraid to buy after a signicant gap-up. They are afraid that they are buying aa high. Remember, if the stochastics are rising and the candlestick is above the T-Line, then theupward trend is likely to continue. Bear in mind that the further the candles drift north of the T-Linethe more likely they are to retrace and come back to it. Bullish kicker Signals don’t require a gap-uas long as it is a signicant move in the opposite direction of a downtrend, and it’s moving above thT-Line with supporting stochastics. As a rule of thumb, the bigger the Bullish Kicker Signal is, thmore signicant the move will be.
Bullish Flutter Kicker
A Bullish Flutter Kicker occurs when the market has a down day followed by an indecisive gap-up. you see a Doji gapping-up over the previous days open, it’s a signal that the market is showing somstrength. If the market moves up the next day over the previous days close and starts moving abovthe T-Line, it’s a signal that investor sentiment is moving the market into an uptrend. If you removthe Doji from the picture, you would have a Bullish Kicker Signal with a strong gap-up.

8/15/2019 Ultimate Guide eBook
http://slidepdf.com/reader/full/ultimate-guide-ebook 36/218
ultimate guide to trading and investment
3
Steady Eddie Trends
When you see a gap up through a resistance, in this case, the 200-day moving average, it signathe start of a “Steady-Eddie” trend, and it’s a great place to be. The candlesticks will ride above thT-Line for an extended period of time signaling multiple opportunities to let prots ride.
You can rest every night knowing that the market will continue to rise until you see a close below thT-Line.
Once again, the further the candlesticks drift above the T-Line, the more likely they are to return
the T-Line. Once the Candlesticks start crossing back below the T-Line is when you need to stathinking about making a course correction
Magnitude of the Signal

8/15/2019 Ultimate Guide eBook
http://slidepdf.com/reader/full/ultimate-guide-ebook 37/218
ultimate guide to trading and investment
3
The larger the signal, especially after a Doji, the more compelling the evidence is that there ia change in investor sentiment. In this example, the candles formed a rounded bottom and brokabove the 50-day moving average resistance level, followed by a very large gap-up above the T-LineOnce a gap-up like this happens, the market will more than likely form a 45-degree “Steady-Eddie
pattern, where the market churns upward above the T-Line.
Whenever you see a large gap in candlestick patterns as shown above, it’s a sign of a strong moveIf you can identify it, your earnings will multiply.
Summary
Candlestick patterns are a historical gauge of investor sentiment. They were developed centurie
ago by Japanese rice traders and they still work today.
If you study these bullish candlestick patterns and can identify them, you will prepared to act odecisive changes in investor sentiment.
You will be in a much better position to enter into an uptrend, set stop/losses and ride your prots tthe upside.
The tools you need are simple and straightforward:
• The T-Line = the 8 Exponential Moving Average (EMA)
•
20, 50 and 200 Day Simple Moving Averages (SMA)
• Stochastic Oscillator (settings are 12,3,3)
Follow the rules in this lesson, and you will trade with better certainty. You will have a better handle on investor sentiment and will know when to enter and exit a trade.

8/15/2019 Ultimate Guide eBook
http://slidepdf.com/reader/full/ultimate-guide-ebook 38/218
ultimate guide to trading and investment
3
THE MOVIEIf you like what you’ve read in this lesson and want more information, then you owe it to yourse
to spend an hour watching this free presentation, courtesy of TradingPub. There are several morexamples of these candlestick patterns in this video that will give you a better understanding hothey work. Watch the Video of this Presentation
THE SPECIAL OFFER As a bonus, Steve is oering a special $12 Candlestick Precision Major Signals Education Packagthat will include:
• Stephen’s Candlestick Precision Major Signals Education Package – comprised of 1
videos that dissect each of the major signals to illustrate where and when they work moseectively in a trend, (a $581 value)
• You will also receive 30 complimentary days in my Candlestick Forum Membership sitgranting you access to a wealth of trading information and training. (a $97 value)
• PLUS, you will receive immediate access to over $335 worth of eBooks, videos and specibonuses when you activate your FREE 30-day membership.
Get the Major Signals Education Package for just $12.00 HERE
ABOUT THE AUTHORStephen W. Bigalow possesses over twenty-ve years of investment experiencincluding eight years as a stockbroker with major Wall Street rms: KiddPeabody & Company, Cowen & Company and Oppenheimer & Company. Thwas followed by fteen years of commodity trading, overlapped with twelvyears of real estate investing.
He holds a business and economics degree from Cornell University, and has lectured at Cornell anat many private educational investment functions over the past twenty years.
Mr. Bigalow has advised professional traders, money managers, mutual funds and hedge funds, anis recognized by many in the trading community as the “professional’s professional.” He is an aliaof the “Market Technicians Association”. (mta.org – A non-prot association of professional technicanalysts) and a member of AAPTA, the American Association of Professional Technical Analyst(aapta.us)

8/15/2019 Ultimate Guide eBook
http://slidepdf.com/reader/full/ultimate-guide-ebook 39/218
ultimate guide to trading and investment
3
"The trend is your friend." "Befriend the trend." "A rising tide lifts all boats." I'm sure many of yohave heard these and other cliché phrases. The truth is that the trend is your friend, until it ends. love trend trading and I've found it to be a lot more consistent than trying to "catch the falling knife.(Excuse me if I borrow another cliché.)
The problem I nd with most traders is the inability to successfully follow the trend and stay with it
There are literally hundreds of indicators available to measure trend. It's very easy for new traderto fall into the "Analysis Paralysis" trap.
For me simplicity is the key to trading. My parameters for a trading system that I am willing to usare quite simple as well:
1. Must be Objective and Rule Based -- Systems and methods that rely on news, earningsor subjective items are disqualied. I will not be making guesses about what eect the newFed Stimulus package is going to have in the market! I am not in the business of trying tmeasure the eect earnings will have on a stock. Having something that is Objective anRule based helps me employ discipline and removes emotions from my trading.
2. Must Employ Solid Money Management -- I remember Robert Deel's saying "You can wi90% of the time and still lose everything." There are old traders and bold traders, but seldomare there bold and old traders. It's important to use solid money management in your tradingHaving dened entries and exits will help you stay disciplined in your trading. It will alsensure you are trading for many years to come.
3. I must be able to understand the system. In the last 18 years, I've seen all types of systemsI've seen and tested systems from very easy to systems that are very hard. I've seen systemthat use simple moving averages and systems that use (literally) rocket science. I've alwayhad better luck with systems that are easier. I'm not making the argument that complicatesystems don't or won't work. In fact, I'm sure they most likely do. My experience has beebetter with systems I understand. I believe this is simply due to the fact that if I understan
a system -- I am more likely to trust it. If I trust it, I am more likely to follow it. It helps mdiscipline and emotional management.
A Simple Method for Trading with the TrendBy Jeffrey Gibby, MetaStock

8/15/2019 Ultimate Guide eBook
http://slidepdf.com/reader/full/ultimate-guide-ebook 40/218
ultimate guide to trading and investment
4
There are, of course, other things to consider in systems. It should make money over a broaspectrum of instruments. The system should be frequent but not too frequent for you. I teacclasses on nding methods that will work with your time and risk tolerances.
One of my favorite systems that meet these criteria is a system built by Rahul Mohindar.
It is a simple trend following system, it employs solid money management, and it is very easy tunderstand and teach.
In case you are not familiar with Rahul Mohindar, he is a market educator in India.
He's a regular contributor to CNBC in India and has trained thousands of traders.
He has been a long standing partner and distributor of MetaStock. Several years ago he was visitinus in our Utah oce and we asked him to show us what he teaches his clients to trade. He taugus this method.
We were impressed. In fact, we set up an agreement with him to give the Rahul Mohindar Oscillator RMO to all our clients for free.
Since then, I’ve been able to use his simple method and have been able to share it with thousandof traders worldwide.
The system is simple and can be boiled down to three steps:
1. Identify the Primary (Long Term) trend.
2. Identify the Short Term Trend.
3. Identify your Entry and Exit triggers and Execute.
Let me walk you through this simple system on a trade example with ApplStarting with step 1

8/15/2019 Ultimate Guide eBook
http://slidepdf.com/reader/full/ultimate-guide-ebook 41/218
ultimate guide to trading and investment
4
Identify the Primary (Long Term) Trend.
The rst indicator we want to look at is the Rahul Mohindar Oscillator (RMO). It is the green indicatoidentied and the Primary trend in the image. This indicator is designed to measure the primary trenin the instrument you are using.
Rahul, in his teaching of this method, is very specic. Size and shape do not matter. The RMO
either Above Zero or Below Zero. If RMO is above zero, then you are in a bullish phase. If it below zero, the instrument you are looking at is in a bearish phase. You will also notice the chart haa Green/Red Ribbon on the bottom of the chart that identies these phases for you. The rules fothese phases are similarly very simple:
Primary Bullish Trend (RMO Above Zero) :
● You are allowed to buy long
● You are not allowed to short
● Not a trigger to enter the security
Primary Bearish Trend (RMO Above Zero) :
● You are allowed to short
● You are not allowed to buy long.
● Not a trigger to enter the security.

8/15/2019 Ultimate Guide eBook
http://slidepdf.com/reader/full/ultimate-guide-ebook 42/218
ultimate guide to trading and investment
4
In both cases, take careful note of the bullet that says "Not a Trigger." You won't place a tradbased on the RMO (or green indicator) alone. At this point we are looking at the trend to decidour bullish/bearish bias. We'll get to trading -- remember there are three steps here. The goal is make sure that we are doing what we can to put the odds in our favor and trade in conjunction wit
the dened trend. Combining multiple trends gives us a better view of the overall trend.
That's it for Step 1. Step 2 is also simple.
Identify the Short Term Trend.
Using the same screenshot from Step 1, focus on the purple indicator identied as short term trenIt is called Swing Trade 2. You'll notice that it is also either above zero or below zero. You'll alsnotice that it tends to be a lot faster to change from being above zero or below zero. This indicatis measuring trend, but it is measuring a shorter term trend. As such, it tends to be faster to react changing market conditions.
The good news -- you read it in exactly the same way. If it is above zero, then the stock is currenshort term Bullish. If it is below--Short Term Bearish. One thing I'd like to point out is that the coloof the bars on this chart match the short term trend. If we are short term Bullish -- the bars on tchart are blue. If we are short term Bearish -- then the bars color red.
Of course, the Rules for this are simple as well.
If our Primary trend and our Short term trend are both Bullish (above zero):
● You are still allowed to buy long
● You are not allowed to Short
● Not a trigger to enter the security.
If our Primary trend and our Short term trend are both Bearish (below zero):
● You are allowed to Short
● You are not allowed to buy long
● Not a trigger to enter the security
If our Primary trend and our Short term trend do not match:
● You are allowed to wait until they do.
● If you really want to make a trade-- the MetaStock Explorer will allow you to scan and nsome better probability trades. Let's follow the rules. "The trend is our friend" after all.

8/15/2019 Ultimate Guide eBook
http://slidepdf.com/reader/full/ultimate-guide-ebook 43/218
ultimate guide to trading and investment
4
Let's move to Step 3.
Identify your Entry and Exit Triggers. Execute.
For step number three we'll focus on the Blue indicator in the image below and its relationship to thSwing Trade number two (Short term trend).
We've talked a lot about the Long Term Trend and the Short Term Trend. If you haven't guessed, thBlue indicator is the Medium term trend and is called Swing Trade 3. With this indicator, we do nocare if it is above or below zero. What we want to look at is the relationship between the Medium
Term trend and the Short Term trend.
What we are looking at is the relationship between the short term trend and the medium term trendIf we see a rise of the short term trend above the long term trend we have a bullish trigger. Rahucalls this a change of momentum or a change of force. It means short term we have more buyerthan we have had and the price is getting more bullish.
If we have a fall of the Short Term trend below the Medium Term trend, we have the opposite. Wwould have a bearish trigger.

8/15/2019 Ultimate Guide eBook
http://slidepdf.com/reader/full/ultimate-guide-ebook 44/218
ultimate guide to trading and investment
4
These are triggers to enter a trade as long as the rest of the critermatch up. Let's go through a few examples:
In this example, I've added a blue vertical line when we had a Bullis
Change of momentum.
We have a bullish trigger. Now we want to make sure that we follothe rst two rules to make sure those match a buy signal.
1) Do we have Bullish Primary Trend? Yes
2) Do we have a Bullish short term trend? Yes
3) Do we have a Trigger? Yes.
Since all of our criteria match, we can now structure a trade.
There are a few rules about execution, but these are very simple follow as well.
We want to identify where we will buy and we want to identify ouinitial stop level. To do this we look at the price of the security.
The line marked A is going to be my entry price. To conrm an entry, I want to wait until the pricof the stocks conrms the move by going above this level. You determine this level just above thhigher of either (1) today's high or (2) yesterday's high. If the price after everything lines up traveabove your entry price, you have a conrmed buy setup. You would want to buy as close to this pricas possible.

8/15/2019 Ultimate Guide eBook
http://slidepdf.com/reader/full/ultimate-guide-ebook 45/218
ultimate guide to trading and investment
4
Line B will be your rst stop. You will identify the rst stop and put it just below the most recent trougin prices. If prices fall below this support you will exit your trade.
I love this method. It allows us to identify our potential risk on a trade before we trade and have
very clear entry and exit strategy. We also know our game plan before we trade and not by makinour decisions in the heat of battle. In this example, we would have bought this security on the gap upWe also caught a very nice move.
There are also some other rules to keep in mind. If we are in a long trade and we get all the rulenecessary for a short trade, we would want to get out of our long trade and setup a trade to thshort side. In my experience most trades with RMO are exited by a stop. Stop management is aimportant part of any strategy and RMO is no exception.
Here's our chart of AAPL again.
This is the same example, hypothetically at the circled area, where we would be in
a long trade that just completed a nice move up. As is natural in stock cycles, the momentum startto expire in the upward move and you get a pullback. This pullback will usually be accompanied by change of momentum or a change of force. This is indicated on the chart by the red sell signal. This not a signal to exit. However, it is notice to start to pay closer attention. If we start to get a sever
pullback we will go into a Bearish cycle and will look to reverse.

8/15/2019 Ultimate Guide eBook
http://slidepdf.com/reader/full/ultimate-guide-ebook 46/218
ultimate guide to trading and investment
4
In this example however, AAPL establishes a new support area and continues on its upward trajector As the momentum shifts back to a bullish phase, we have setup a new support level. Since we hava new support level we would move our stop to lock in prots from this trade:
THE SPECIAL OFFER
We do have some great supporting videos and I'd recommend that you watch our video to heunderstand this simple trading system. Repetition and practice are important. You can view a traininvideo on RMO and even
SIGN UP FOR A COMPLIMENTARY TRIAL OF METASTOCK HERE
I'd recommend with all new methods that you paper trade it until you are comfortable. Then, a
anything else you use with your trading, ease into it with smaller positions until you feel you are readto go full scale.
ABOUT THE AUTHOR
Jerey Gibby has been working for MetaStock for over eighteen years. He currently in charge of new business development and works to create neMetaStock distributors and partners worldwide.
Mr. Gibby works with training companies to help people learn the power
MetaStock. He has spoken to traders from around the world and has trainepeople on how to use the software and trade various markets. Among hareas of responsibilities are the management of new products and servicefor MetaStock and creating strategic partnerships.

8/15/2019 Ultimate Guide eBook
http://slidepdf.com/reader/full/ultimate-guide-ebook 47/218
ultimate guide to trading and investment
4
Bigger Prots Are Easier When Your Trades Are Immediately Protable
Welcome, if you’re a day trader, swing trader or options trader this book is for you because…
You’re about to discover a focused approach to anticipating the markets’ next move, along wittrading tactics that lead to immediate prots and trade entries you can be condent in trading whetheyou are a new trader or have years of experience.
Think about how you feel, and how you tend to trade, when a new trade is substantially protablimmediately after you enter it.
Now contrast that feeling with how you feel, and tend to trade, when the market is about to close anyou’ve been in a trade for a few hours that is trading at a loss.
If you’re like most traders, the immediately protable trade creates a desire to “trade this one rightYour thoughts are on how to make the most of the apparent opportunity. You’re also enjoying trading
The losing trade scenario, on the other hand, is disappointing. You’re more likely to be thinking abouhow to change the trade, rather than condently sticking with your initial plan. This is common eveamong experienced and disciplined traders who know that losses, when managed properly, are noa problem.
Regardless of our trading style or instrument (day trading, swing trading, investing, stocks, ETFsoptions, forex, etc.) I believe that we all enjoy trading more when our trades are immediately protable
More importantly, I also believe that immediate protability makes it easier to be more disciplinedwhich in turn leads to more trading success.
How To “Buy Low” for Bigger Profits, LessStress, and More Enjoyable Trading
By Geoff Bysshe, MarketGauge.com

8/15/2019 Ultimate Guide eBook
http://slidepdf.com/reader/full/ultimate-guide-ebook 48/218
ultimate guide to trading and investment
4
Immediate prots are only one important result of having great entry strategies and tactics
Even more important than immediate prots is having enough condence in your trade to ensure yotrade with discipline. When you have enough condence in your trade, “immediate” prots become
a relative term. This means that even if a trade initially trades at an unrealized loss, you won’t havthat feeling of disappointment.
How To Create The Condence In Your Trade
That Eliminates The Frustrating Feelings Of Unrealized
Losses And Reduces Real Losses!
Successful traders condently believe they are doing the right thing when they take a loss.
Since beginning my trading career in 1990 on the oor of the New York commodities exchanges, anspending years in a multi-billion dollar hedge fund, I’ve worked with hundreds of professional tradeand thousands of active individual investors. In this time I’ve found that condently taking a loss is common theme among successful traders at every level – oor traders, fund managers, and activindividual traders.
One goal of this book is to show you how you can have the condence of a pro in determininand executing on your stop losses, so you can improve your protability. There are several wayto accomplish this level of condence, but this book is narrowly focused on a very specic way o
identifying great trade entries with stops you can have condence in.
A great trade entry is one that has a risk level (a stop loss)and three important qualities:
1. You believe that you should exit the trade when the stop level is hit. This leads toconsistently executing your plan.
2. The potential loss is small relative to the expected return when prot targets are hit. Thisleads to more proftable system.
3. The frequency of getting stopped out is in line with frequency and expected return whenprot targets are hit. This leads to a more predictable equity curve and more confdence intrade execution.
A simple starting point for selecting a stop level that can provide all three of these criticqualities of a great trade entry is to have your stop loss be outside of the current day’s rang

8/15/2019 Ultimate Guide eBook
http://slidepdf.com/reader/full/ultimate-guide-ebook 49/218
ultimate guide to trading and investment
4
The low or high of the day creates an emotionally powerful “line in the sand” that seems to naturalcommand the respect of traders. Think about how you feel when markets make new highs or lows Are you more inclined to pay attention and respect the “trend of the day” at this point?
In my experience of working with successful traders, most traders are more likely to feel condenthat their stop is safe when it’s beyond the current day’s trading range. This alone can improve youtrading because it leads to less second guessing and moving stops prematurely.
Additionally, traders tend to feel more accepting of the fact that their trade is not working and exit thtrade as they planned when it corresponds with a break of the current day’s range. This leads to mordisciplined trading and less second guessing your stops when they are hit.
However, better trading is not simply placing your stop below the low of the day if you’re long, oabove the high of the day if you’re short! You need more of an edge to determine when the high othe low of the day has been put in, and which days you should use this tactic.
In other words, you must identify the RIGHT DAY and TIME to use the day’s range as youstop.
You’re about to discover a reliable way to determine the day’s high or low early in the day. Thcreates powerful opportunities for all trading styles to use these levels for great stops that are quicand easy to identify and, as discussed above… leads to less second guessing.
For example:
If you’re a day trader … when you are able to buy near the low of the day, you’ll nd many opportunitiefor trades that will have very protable reward-to-risk ratios that don’t require the market to do mucmore than simply return to the high of the day!
If you’re a swing trader … you’ll be able to pinpoint the exact days to take very low risk tradethat are more likely to enable you to avoid holding positions overnight that are not yet protable. Iaddition to having more of your rst days in the trade be protable, you’ll be able to identify tradethat have multi-day or more trend potential, creating huge prots relative to your initial stop level.
If you’re an option trader … you’ll be able to identify market turning points for precise timing odirectional option strategies, and enjoy the benets just listed for the day traders and swing traders
Use This Floor Trader’s Secret Charting Tactic To Anticipate The Market’s Highs, Lows,Trends & Reversals
It may seem hard to believe, but this trading tactic can be so simple that I used it to “chart the markewithout a computer! I didn’t have a computer standing on the trading oor in the early 1990’s.
Despite its simplicity, the principle works because it is based on the driving force behind the mosimportant price points of any trading day. That force is human emotion – fear and greed.Remembeyour feeling of excitement when the market in which you hold a position goes racing your way righas the market opens? How about the feeling when the market gaps open in the direction of youposition? Nice way to start the day.

8/15/2019 Ultimate Guide eBook
http://slidepdf.com/reader/full/ultimate-guide-ebook 50/218
ultimate guide to trading and investment
5
And have you also had the frustrating experience of the excitement from a market open in yodirection turn to disappointment as the market suddenly reversed? If you’ve traded for any period time then you’ve certainly felt the anxiety of a protable trade swinging into a losing position in thopening half hour of the trading day.
Fortunes and egos are inated and burst during the opening several minutes in many markets all thtime. Even if you have or don’t have a position in the market, the opening minutes of the trading dacan be an emotional roller coaster. This is exactly why the rst 30 minutes of the trading day turnout to be very statistically reliable in determining the day’s high or low.
In fact, 50% of the time the S&P 500 will make its high or low of the day within the rst 3minutes of the trading day.
I’m using the S&P 500 as the example, but you will nd other markets (stocks, ETFs, and futures) have a similar statistical bias that you can prot from and here’s how…
Stop and think about some of the implications of this data.
● The rst 30 minutes is only 8% of the trading day, yet 50% of the time it determines thday’s high or low. This makes it a very signicant time of the day for anticipating reversaand setting price levels that will likely remain as the high or low for the entire da
● If you are going to set your stop below the low of the day, you give yourself a big statisticedge by waiting for the rst 30 minutes of trading to nish.
Plus, you can make this statistical edge even stronger by combining it with a few simple indicators
We’ve found easy ways to identify market conditions that indicate with 83% accuracy that the high low will be determined in the rst 30 minutes of a particular day. Even more impressive is that whethese same criteria are used, you can determine that the low of the day has been set after the rst 3minutes 62% of the time. These are the best days to use the low of the day in your stop.
The Opening Range Dened
From this point forward in this book I’ll refer to the high and low of the rst 30 minutes of the tradinday as the “Opening Range” or the “O.R.” The Opening Range can be calculated using other timframes as well. Common time frames include 2, 5, and 15 minutes, and even the rst hour.In outrading at MarketGauge we focus on the 2, 5 and 30-minute Opening Ranges. They all serve specipurposes. For example, the 30-minute O.R. is the best place to start for buying against the low of th
day (or selling against the high) for day traders and swing traders.
Of course you’ll use charts on your computer to gure out the day’s Opening Range, but now yocan see how oor traders could use this tactic even without access to a computer. As illustrated iChart 1, the OR high is simply the high for the day after the rst 30 minutes of trading, and the OR the low of the day at that time.

8/15/2019 Ultimate Guide eBook
http://slidepdf.com/reader/full/ultimate-guide-ebook 51/218
ultimate guide to trading and investment
5
Chart 1: O.R. Dened
How To Objectively Evaluate Any Trading Day To Anticipate the Day’s Trend
For Bigger Prots & Avoiding Losses
Every day in the market is dierent. It presents its own trend, opportunity and challenge dependinon your perspective. The direction and magnitude of the market’s moves from day to day can seemrandom to the untrained eye, but the market does follow patterns and leave clues indicating its mos
likely direction.
The Opening Range is a trading tactic that pros have used for decades to read the market’s mood sthey can anticipate and prot from the market’s intra-day moves.
When you “chart the market” or look at it through the lens of the Opening Range, you’ll have aobjective perspective on whether the bulls or bears are in control on any given day. This perspectivbegins with a very powerful understanding that the O.R. high and O.R. low levels will be criticasupport and resistance levels for the rest of the day.
With this understanding of market behavior you can anticipate that these levels will also represenlevels where markets will reverse or accelerate into big moves. If you look at the trading day with th
process you will be on the right side of the biggest market moves, and avoid getting hurt by them.

8/15/2019 Ultimate Guide eBook
http://slidepdf.com/reader/full/ultimate-guide-ebook 52/218
ultimate guide to trading and investment
5
How To Read The Market With The O.R.
To begin using the O.R. to anticipate the market’s next move follow these simple rules.
First, let the market establish its 30-minute O.R. high and low. Even after the Opening Range periokeep a neutral bias while the market trades within its O.R.. As you learn more you’ll know if an O.Rhas a bullish or bearish bias.
Don’t Miss, or Get Hurt By Trend Days
Next, wait for the market to attempt to trend by breaking the O.R. range. A successful breakobeyond the O.R. will indicate a trend day is forming. For example, if the market breaks below its O.Rlow, you should consider it a trend down day unless and until it rallies back over its O.R. low level.
Too many traders lose money in big down days because they don’t have an objective method like thO.R. rules to determine that the market is in a down trend which should not be bought, and in fact,
should be expected to continue lower.
You will NEVER GET CAUGHT IN AMAJOR MARKET DECLINE if you onlyinitiate your long trades above the O.R.low and stop out if a new daily low is hit.Buying markets that are under the O.R. low isequivalent to trying to nd a bottom when thebears are in control.
This is much riskier than nding a bottom whenthe market is in a neutral to bullish mode (i.e.
over the O.R. low).
Additionally, any rally from below the O.R. lowwill have to get through the resistance of theO.R. low (see chart 2).
As you now know, the O.R. low is oftensignicant support until it is broken, and becomes a signicant area of resistance once broken.
As a result, it is very common for rallies during a down trending day to roll over at the O.R. low, anresume the day’s down trend.
Chart 2: Downtrend Day

8/15/2019 Ultimate Guide eBook
http://slidepdf.com/reader/full/ultimate-guide-ebook 53/218
ultimate guide to trading and investment
5
Use Opening Range Reversals To Buy Near The Low, Or Short Near The High
When you combine Opening Range Reversal tactics with the emotional benet, and statistical edg
of placing your stops outside the day’s range as discussed earlier…
You have a very eective approach to entering low risk trades that have a high probability oworking consistently!
An Opening Range Reversal (ORR) describes a condition when the market has reversed againsan O.R. high or low suciently to anticipate that the low or high of the day has been set, and it catherefore be used eectively as a stop for your trade.
The basic ORR trade setup that I’ll cover here occurs when the O.R. low is touched or brokefollowed by a rally back over the O.R. low. As you become more familiar with how markets trade neatheir O.R. lows you’ll discover many protable trading patterns, but to get started you only need to
know one simple pattern.
A Simple Pattern ThatPuts Money In Your Trading Account Quickly
Because It Pinpoints Reversals
This pattern is so eective at spotting intraday reversals thatI use it for more than identifying O.R. Reversals, but rightnow our objective is to understand when to buy marketsnear their low of the day using the ORR and this pattern.
I use 5-minute charts for this pattern.
At MarketGauge we call this pattern the Higher CandleClose (HCC). It occurs when a 5-minute bar closes overthe high of the prior bar.
Yes, the pattern is that simple, and it works extremely well.But the secret to why it works so well is that we’re using itwhen it occurs near the O.R. low!
WARNING: Like most good trading tools, this pattern works well
when used in the right market conditions. If you use this patternrandomly it can be frustrating, and even be as annoying as turning on your car’s windshield wipers when thsun is shining! You must combine it with the O.R. Reversal setup.
Chart 3: Higher Candle Close (HCC)

8/15/2019 Ultimate Guide eBook
http://slidepdf.com/reader/full/ultimate-guide-ebook 54/218
ultimate guide to trading and investment
5
When I share this secret setup I’m often asked…
Does it work on 1-minute charts? (probably because traders are always looking to act quicker, ancut risk tighter).
Well, at MarketGauge we also trade with, and teach how to use 1-minute charts for more advanceO.R. patterns along with price and time conrmation, but we DO NOT use this HCC pattern o1-minute charts.
So, to get started all you need is a 5-minute bar chart or candlestick charts, which you can nd oany charting platform, and the next step - a simple way to identify the best Opening Range to tradwith the HCC.
The Best Opening Range Conditions For Consistent Prots
When you’re looking at an O.R. for a potential trade think of it like nding a place to live. You’ll asyourself 3 basic questions.
1. What does it look like?
2. Where is it located?
3. What’s the price?
A “good looking” O.R. for an ORR trade has a well-dened O.R. low price level. Remembfrom earlier in this book, the O.R. works best when the market is active and emotionally charged wieither fear or greed.
This is demonstrated in the charts by the existence of volatility and/or big volume. Therefore, a wedened O.R. low is one that has multiple 5-minute bar lows near it, or a big range bounce from it, obig volume near the O.R. low level. All of these indicate that traders are reacting to the O.R. low, animply that if the market breaks the O.R. low, and then begins to rally (as dened by the HCC), it time to trade! Chart 3 above is a good example of this.

8/15/2019 Ultimate Guide eBook
http://slidepdf.com/reader/full/ultimate-guide-ebook 55/218
ultimate guide to trading and investment
5
“Good location” for an ORR has two considerations
1. The low of the day should be close to the O.R. low. The reason you want the low of the dayto be relatively close to the O.R. low is because a good ORR trade denes its risk with a stopunder the low of the day, and its entry over the O.R. low.
In an ideal situation the distance from the entry point to the low of the day should be a fractionof the market’s average daily range.
2. The O.R. low and/or the low of the day should be in a good location relative to importandaily chart key reference points. This is very easy criteria to use to lter out the best ORRtrades, and one of the most powerful determinants of the predictable prot potentia
Simply put… The best ORR trades occur in the direction of the daily tren
and at support and resistance levels that can be identied on the daily chartsChart 4: AMZN’s location lined up with support from the prior day and the important keyreference point of the Floor Trader Pivot (not visible on this chart).
“The price” is your entry price and your risk! It doesn’t take long to become good at quicklidentifying good looking Opening Ranges in good locations.
This is a skill and tactic you can apply to almost any market and easily adopt into your existing tradinrules, or simply trade it as described here, which is to apply the HCC pattern to determine the tradentry.

8/15/2019 Ultimate Guide eBook
http://slidepdf.com/reader/full/ultimate-guide-ebook 56/218
ultimate guide to trading and investment
5
The Simple Entry TriggerThat’s Been “Hidden” in Your Charts All Along
As you start looking at the markets using the O.R. along with the HCC pattern in the way I’v
described in this book, you’ll nd that some trades are such obviously great opportunities that youwant to be more aggressive, and get into the trade as quickly as possible.
You’ll also nd trades that look great, but you’d like to have a little more conrmation before enterin(i.e. general market conditions may be bearish)
Now that you know what the HCC pattern is, and where to best apply it, we can focus on the actu“entry price” trigger point for what I’ll describe as the HCC-ORR trade.
There are actually 3 potential trigger points for an entry. They are all slight variations of the sambasic pattern of trading over the prior bar’s high, but they give you the ability to be more aggressivvs. waiting for more conrmation that the market has turned up.
IMPORTANT: For the purposes of this lesson, it is assumed that any entry trigger point describehere is also above the O.R. low.
Maximum Conrmation
The entry trigger with most conrmation, and the one I’d start with, is to wait for the 5-minute bato close over the prior bar’s high, AND then enter when the market trades over the HCC high. Thmeans your entry trigger is actually a trade over the high of the HCC bar.
I will almost always use this trigger if the close of the HCC is not convincingly above the prior bar higor if the high of the HCC bar is very close to the closing price. In these cases you’re not increasin
your risk by very much, yet you’re getting some extra conrmation the price is moving your way.
Chart 5 below shows an example of a big range HCC reversal with conrmation.
Chart 5: A good wide range HCC with conrmation

8/15/2019 Ultimate Guide eBook
http://slidepdf.com/reader/full/ultimate-guide-ebook 57/218
ultimate guide to trading and investment
5
No Conrmation
There are times where you will not want to wait for maximum conrmation described above. In thicase the trigger is simply the close over the prior bar high and the entry is on the open of the followin
bar.
This is can be used for situations where the HCC bar’s close is signicantly above the prior bar’high, and it may even have good volume. In other words, the market has clearly demonstrated reversal.
In fact, sometimes you will get this pattern, and have the opportunity to wait for a pullback in price tthe high of the prior bar to be able to enter a lower price.
However, if you do not have a good demonstration of range expansions and or volume this can brisky. Chart 6 above is an example of a HCC at the ORR that did not conrm and continued lower.
“Jumping The Gun”
As the subtitle “jumping the gun” suggests, this is getting in before the HCC is complete. With somexperience in trading ORR patterns you’ll be able to get away with this, and get in early on sometrades, but be careful. I would prefer to have unusual volume in situations where I use this approach
The trigger when you jump the gun is to enter when the market trades over the prior bar high. Soyou’re not waiting for the close in what you expect to be a HCC bar.
6 Steps To Identifying and ExecutingLow Risk, High Prot Potential ORR Trades With Condence
It’s time to pull everything together, summarize the key steps to initiating an Opening Range Reversatrade.
1. Let the 30-minute O.R. form.
2. Focus rst on the Opening Ranges that are in a good location relative to the daily chart’trend and support levels.
3. Identify the Opening Ranges in a good location that also look good for an ORR trade. Thimeans they have well-dened support at the O.R. low.
4. Use the HCC as your entry trigger.
5. Dene your risk as being under the low of the day. Give the market room to break the low othe day by a small margin and reverse without stopping you out!
6. Set your initial prot targets. If you are a day trader, take at least partial prots near the high othe day, and move your stop to no loss after the market moves in your favor. If you’re a swintrader, you’re initial target may be higher (and your stop may be lower).

8/15/2019 Ultimate Guide eBook
http://slidepdf.com/reader/full/ultimate-guide-ebook 58/218
ultimate guide to trading and investment
5
Identifying Trade Opportunities In SecondsWith This Simple Chart Display
In my charting platform I have a window that shows both the daily chart and a 5-minute candle cha
with volume. As you know the candles on the 5-minute chart are not required, but they make it easito see where a bar closes relative to the prior bar high.
With these two charts in plain view it only takes a few seconds to spot when the O.Rlow lines up with key daily levels, and when a HCC forms.Don’t Sabotage YourseBy Setting Your Trades Up To Fail
You can evaluate every day’s price action with the perspective of the O.R. to anticipate the marketnext move, but the key to proting from it is knowing how to spot high probability setups like the onI’ve revealed in this book.
Remember my analogy from earlier – You don’t use your windshield wipers on a sunny day!
The ORR combined with the HCC entry is an incredibly powerful pattern, but every O.R. low wnot reverse. However, you now know how to select good looking ORR patterns. And you know thathe location of the O.R., in the context of a bullish daily chart, is the easiest way to identify the moreliable and highest potential ORR trades for both the day trader and swing trader.
Be selective! If all the trade ingredients are not there, wait for the next one.
Chart 7: With a daily chart display next to the 5-minute you can see “good location” easily

8/15/2019 Ultimate Guide eBook
http://slidepdf.com/reader/full/ultimate-guide-ebook 59/218
ultimate guide to trading and investment
5
SPECIAL OFFER: LEARN AND EARN MORE!
If you’d like to learn more about trading reversals and trend day patterns that leverage the power othe Opening Range, visit MarketGauge at the special link provided below.
MarketGauge provides free webinars, and more advanced O.R. training that will show you:
✓ How to determine volatility based stops that help to avoid frustrating stop losses
✓ How to prot from big trend day breakouts, andavoid false breakouts
✓ Which indicators dramatically increase the statistical edge of the O.R.
✓ Rules for more precise reversal patterns for quicker entries
✓ Time and price conrmation rules to minimize failed trades
✓ How to trade quicker O.R. time frames toprot from gaps and moves within the rst 30-minutes of the day
✓ And more!
For a limited time, TradingPub members will nd more training and a special oer here:
www.marketgauge.com/orr/tradingpub/
ABOUT THE AUTHOR
Geo Bysshe, co-founder of MarketGauge, began trading in 1990 on the oor of thNY commodities exchanges. He spent several years as an independent oor trade
He left the oor to trade and develop quantitatively based strategies for equities aMillennium Partners, a multi-billion dollar hedge fund in NY. In 1997 he co-foundeMarketGauge.com to provide market analysis and trading tools to professiona
traders.
MarketGauge has since expanded into providing individual active traders and investors with tradinsystems, tools, education and actionable market analysis.

8/15/2019 Ultimate Guide eBook
http://slidepdf.com/reader/full/ultimate-guide-ebook 60/218
ultimate guide to trading and investment
6
Are you lured by the siren song of searching for an elusive trend reversal and ghting the pricaction? It's understandable that many traders want to gratify their ego by pinpointing the exact spthat a trend reverses, but unfortunately many trading accounts have been dashed in the process calling reversals.
Join me for a brief journey as we "go with the ow" with price action as it moves forward in a tren
We'll focus specically on identifying a trend in motion and perfecting a classic trade set-up that wreduce frustration and - hopefully - build up your trading account consistently over time.
Trends - the Foundation of Trading
Technical Analysis and chart-based trading builds on the idea that trends, once established, havgreater odds of continuing than of reversing. It's such a simple principle but so many traders gtrapped in the allure of calling a market top or bottom - a trend reversal - and miss the easier prothat can be made by trading with the trend and not against it.
In Technical Analysis Explained, Martin Pring denes the entirety of technical analysis with this quot
"Technical Analysis is the art of identifying a Trend Reversal at the earliest stage possible and thetrading in the direction of that trend until the weight of the evidence proves that trend has reversed
In this article, we'll focus on the portion of the denition that addresses "trading in the direction that trend" and specically develop a trade set-up you can recognize in any market or timeframYou can use this as a building block to more complex strategies in your trading toolbox, or as standalone set-up.
Two Quick Ways to Identify a Trend in Motion
If our rst goal is to "identify a trend reversal at the earliest stage possible," how exactly do we dthat? Let's build an ocial way to dene a trend in motion.
1. Pure Price Method
The most basic method for identifying an ocial trend is to compare price highs and lows as thedevelop over time. On a price chart, simply draw a line over each swing high in price and also oeach swing low. It can be helpful to draw small green lines over price highs and small red lines ovprice lows so you can compare them easier.
Mastering the Perfect Pullback:Five Steps to Improve Your Trend Trading
By Corey Rosenbloom, AfraidToTrade.com

8/15/2019 Ultimate Guide eBook
http://slidepdf.com/reader/full/ultimate-guide-ebook 61/218
ultimate guide to trading and investment
6
An uptrend is dened as a price movement having BOTH a higher high and a higher low
A downtrend is thus a price movement over time having BOTH a lower low and a lower high
A sideways trend occurs when the swing highs and lows closely overlap prior highs and lows
Many new traders simply "eye-ball" a trend and have no formal way of dening it.
Let's see this on the chart:
Figure 1: CME Group (CME) Identied by Simply Labeling Higher Highs (Green) and Higher Low(Red)
A Trend Reversal - by this denition - would occur when an uptrend develops BOTH a lower low ANDa lower high; by the same logic, a downtrend would reverse ONLY when price then made a highehigh and higher low.
2. Moving Average Crossovers
In addition to drawing your own highs and lows to dene a trend, we can use two moving averageto dene a trend in motion. We'll need a short-term and intermediate term moving average to placon our price chart.
There's no secret formula to which a moving average is the perfect tool to use, though in mexperience I've consistently used the 20 period Exponential Average (which I often color green) anthe 50 period Exponential Average (which I color blue).

8/15/2019 Ultimate Guide eBook
http://slidepdf.com/reader/full/ultimate-guide-ebook 62/218
ultimate guide to trading and investment
6
An uptrend is identied when the 20 period (short-term) moving average is rising steadily above thrising 50 period (intermediate-term) Exponential Moving Average.
A downtrend is identied when the 20 period Exponential Average (EMA) is falling steadily benea
the falling 50 period EMA.
A at or sideways trend occurs when the moving averages repeatedly cross each other as thetake a sideways or horizontal slope. Trend Reversals occur when the moving averages cross eacother, especially after a lengthy uptrend or downtrend.
Here is CME again with the 20 and 50 day Exponential Moving Averages applied:
Figure 2: CME with 20 and 50 day EMAs Applied. Uptrends contain rising moving average an
crossovers reveal likely Trend Reversals
While there are many formal chart-based methods for identifying trends, often these simple methodare easier to identify and can outperform complex methods with many variables.
New traders especially should begin with simpler methods, build success with them, and then onlynecessary move toward more complex methods of trend identication.
Now that We've Identied the Trend... What Do We Do with It?
A main goal of new traders is to identify a trend in motion and then trade in the direction of that trenas long as it lasts. How exactly do we do that?
Just like there are multiple ways to identify a trend in motion, there are even more methods to aligyour trades in the direction of the trend and prot from the trend continuing into the near-term futur
For this article, let's focus on pullback or retracement trades and maximize our eciency with thsimple yet very powerful and consistent foundational set-up.

8/15/2019 Ultimate Guide eBook
http://slidepdf.com/reader/full/ultimate-guide-ebook 63/218
ultimate guide to trading and investment
6
There are three foundational trade set-ups as follows:
Retracement Trades trigger on a pullback in an established uptrend.
Reversal Trades trigger on a breakout or reversal spot from a mature trend that is ending (as a newtrend begins)
Breakout Trades trigger on the breakout beyond a new high or new low, or a clear support/resistanclevel (or from a price pattern). Breakout trades may trigger in the direction of a prevailing trend, oalso against it.
For this article, we will only focus on the Retracement Trade identication and strategy.
The rst step is to identify a trend in motion and thus the second step is to trade in the direction othat trend as it progresses.
Retracement trades attempt to identify a short-term turning point when a counter-trend retracemen(price moving against the trend) ends and a new swing in the direction of the trend develops. Prictends to move in "waves" or swings that are either with the current trend direction (also calle"impulses") or against it ("counter-trend reactions" or "retracements"). The goal is thus to enter aclose as possible at the end of a short-term retracement and join in the direction of the trend wheprice resumes moving in the direction of the trend.
As you can imagine, there are hundreds of ways of accomplishing this goal, and there are just abouas many methods and indicators you can imagine to pinpoint the end of a retracement and thebeginning of a new uptrend price swing. Once again, new traders should start with simple methodand build complexity ONLY if it is necessary (never start with the complex).
Three Simple Tools to Pinpoint the End of a Retracement
1. Hand-Drawn Price Trendline
Let's start with the simplest tool, the hand-drawn (on your computer screen or on a printed charttrendline. The goal when drawing trendlines is to connect as many price swing highs or lows apossible. More is better if possible. By denition, a trendline requires at least two points and thpreference would be to connect three or more swing highs or lows. Extend trendlines into the futurand when price "pulls back" to a trendline, it can be a low-risk spot to enter the market.
2. Moving Averages
They're back! We can use moving averages both to identify a trend in motion and also to enter position into the trend once price "pulls back" or retraces to either our short-term or intermediate termmoving average. Look closely at the chart of CME above to pinpoint each time price touched - otested - the rising 20 or 50 day EMA and then rallied up o this "moving trendline." January 201reminds us that no method is perfect in trading a retracement, but each indicator gives us guidancand clues as to when a retracement may end and price will then swing back in the direction of thetrend.

8/15/2019 Ultimate Guide eBook
http://slidepdf.com/reader/full/ultimate-guide-ebook 64/218
ultimate guide to trading and investment
6
Here's Apple (AAPL) to demonstrate both the Trendline and Moving Average Tactics:
Figure 3: Apple (AAPL) with Hand-Drawn Trendline (Black) which was touched four times ansuccessful Pullbacks (labeled "P") to the rising 20 (green) or 50 (blue) moving average
From April 2014, Apple shares burst into a strong uptrend on the Daily Chart and the series of highhighs and higher lows continued into 2015 without any sign of reversal. After April, price "pulleback" or retraced toward the rising 20 or 50 EMA.
Late 2014 saw a strong resumption of the trend but also a strong retracement against it. Instead "stopping" or reversing up o the moving averages as was the case in 2014, price reversed o thhand-drawn black trendline to resume the strong uptrend in motion. The uptrend never reversed.
3. Flag Patterns
Sometimes the price trend is so strong that we never see a touch of a trendline or moving averageIn these cases, especially on lower timeframes, our only method for entering a strong trend is to dso not at a support (uptrend) or resistance (downtrend) level like a moving average or trendline, bon the breakthrough of a smaller, mini-trendline that we call a "ag" pattern. These would be yoclassic Bull and Bear Flag price patterns.

8/15/2019 Ultimate Guide eBook
http://slidepdf.com/reader/full/ultimate-guide-ebook 65/218
ultimate guide to trading and investment
6
Here's the same chart of Apple, only with the "Flags" highlighted:
Figure 4: Apple (AAPL) with Bull Flag Retracement Patterns Highlighted. Instead of aiming to buat a support level (like a trendline or moving average), the goal becomes to buy shares on a pricbreakout above the smaller 'ag' trendline.
Here's a zoomed-in perspective of the rst two ag patterns in mid-2014:
Figure 5: Apple (AAPL) with zoomed-in perspective of two pro-trend "Flag" retracement price pattern

8/15/2019 Ultimate Guide eBook
http://slidepdf.com/reader/full/ultimate-guide-ebook 66/218
ultimate guide to trading and investment
6
So now we have three simple ways to identify both a counter-trend retracement and when it is liketo end - and thus resume moving in the direction of the uptrend (where we seek to make prot).
Let's create a specic strategy for entering and managing these Pro-Trend Pullback (retracemen
Strategies.
How to Trade a Retracement Play
It's one thing to recognize a retracement as it develops in real-time but we don't make any mone just watching patterns develop.
We need specic parameters for entry, targets, stop-loss placement, and management once wrecognize a set-up in motion.
Fortunately, retracement trades naturally develop these parameters and all we must do is entemanage, and exit as the trend resumes. We need to have a stop-loss strategy also in case the pric
"surprises" us with a trend reversal.
Here are the simple, specic steps to trade a retracement play:
1. IDENTIFY a Mature Uptrend in Motion (using the Price and/or Moving Average Method)
2. MAINTAIN the stock in your watch list UNTIL price retraces lower in an uptrend to a supportlevel (trendline or moving average) in an uptrend or higher to a resistance level (trendline ormoving average) in a downtrend
3. BUY as price touches the moving average or trendline in a prevailing uptrend;SHORT-SELL as price touches the moving average or trendline in a prevailing downtrend
4. PLACE YOUR STOP beyond the trendline or moving average (usually 1% to 2% away fromthe level on a Daily Chart, but this varies depending on your timeframe and the volatility of thestock). Ideally, TRAIL THE STOP under the rising 50 EMA (uptrend) or above the falling 50 EMA(downtrend)
5. TARGET a minimum of a touch of the prior swing high in an uptrend and the touch of the priorswing low in a downtrend (you can choose to exit your full position or exit half the position at theachievement of the minimum goal)
6. HOLD the remaining position until price breaks under a smaller hand-drawn price trendline in auptrend or over a smaller hand-drawn trendline in a downtrend
Make a check-list from these simple rules and use them as guidance for entering and exiting position

8/15/2019 Ultimate Guide eBook
http://slidepdf.com/reader/full/ultimate-guide-ebook 67/218
ultimate guide to trading and investment
6
The chart below reveals four small (yet protable) pro-trend retracement trades in Monster Beverag(MNST) and each trade developed and played out:
Figure 6: Monster Beverage (MNST) with Four Retracement Trades (Trendlines, Moving Averagesand Flags Highlighted) as the Uptrend Continues on the Daily Chart
Here's a nal glance at two simple Retracement Trades in Apple (AAPL):
Figure 7: Apple (AAPL) - two detailed (yet small) pro-trend retracement trades in a strong uptrendThe Yellow Highlight indicates BUYING when price TOUCHES the rising moving average while thGreen Highlight indicates BUYING the "ag" or trendline breakout as price moves up o support. ThTarget is the prior price swing high and the stop is located beneath the moving averages (not exactlunder the averages, as was the case at the end of June)

8/15/2019 Ultimate Guide eBook
http://slidepdf.com/reader/full/ultimate-guide-ebook 68/218
ultimate guide to trading and investment
6
Summing it All Up:
No trading strategy guarantees perfect outcomes. The goal is always to take high probability set-upand craft trades that aim for a higher prot relative to the risk of loss as dened by your stop-loss.
Retracements take advantage of the higher probability of a trend in motion continuing to extenhigher (or lower in the case of a downtrend) and provide a clear, low-risk entry where the stop-losis small relative to the larger target.
If price fails to hold support (or resistance when short-selling into a downtrend), take your stoploss and prepare for the next opportunity. Also, don't keep your stop-loss positioned exactly at threversal point - always locate it just beyond the trendline or moving average.
With experience, you'll be able to recognize trends, pullbacks, and opportunities more eectively ancan add additional parameters that can increase your probability of success or maximize the pro(play for larger targets) relative to the risk. Start simple and grow from a solid foundation.
Taking it One Step Further...
For ambitious traders, the following strategies can help you further master your pullback trades:
• Adding Fibonacci Retracements to pinpoint "hidden" turning points (and to manage stops)
• Incorporating Reversal Candles that develop at trendlines or moving averages
• Stepping inside the price action to a lower timeframe to pinpoint more accurate entries
• Using Oscillators to quantify entries (especially when an oversold buy signal occurs a
support or an overbought sell signal occurs at resistance)
• Incorporating Volume or Market Internals into the chart
Don't start with the complex; instead, build from successful trades you take using the simplermethods described here. You can't improve upon something when you don't have a solidfoundation. The basic strategies here serve as building blocks you can use as a stand-alonestrategy or preferably as a core method to add your own personal improvements as you gainexperience as a trader.

8/15/2019 Ultimate Guide eBook
http://slidepdf.com/reader/full/ultimate-guide-ebook 69/218
ultimate guide to trading and investment
6
SPECIAL OFFER
Download four in-depth lessons on how to apply this simple, eective retracement strategy to your
successful trading activities.
• Lesson 1: Specically, How do Trends Develop and How Do We Identify Them?
• Lesson 2: What Indicators are Best for Trend Trading Tactics?
• Lesson 3: How to Take Advantage of Trends through the Perfect Pullback Strategy
• Lesson 4: When to STOP Trading With the Trend When it is Showing Signs of Reversal
Get the special "Trend Trader Tactics" for only $27.00, simply CLICK HERE!
ABOUT THE AUTHOR
Corey Rosenbloom’s interest in the stock market began as a junior in HigSchool where his team won an investment challenge competition whicdrew him into investing actual money in the market using basic fundamentaanalysis. Later, the Bear Market of the early 2000s would challenge thesassumptions and force him into deeper study of market concepts – “Therhad to be a better way than Buy and Hold strategies”.
He was soon introduced to the concepts of price charting, or more formally known as “Technica Analysis” and the pattern recognition, along with indicator combinations, drew his attention sharplin that direction. As the market began its recovery, he was participating as a momentum intradatrader, which soon gave way to broader swing-trading strategies. He describes one of many “lighbulb” moments when he was introduced to Sector Rotation Concepts which seemed to make thprice charts t into a logical progression of expectations. From there, he deployed options tradinstrategies which gave way to ETF trading, which itself nally gave way to active futures marketrading tactics.
Mr. Rosenbloom holds a bachelor’s degree in both Psychology (cognitive research focus) and PoliticaScience and later received a Master’s Degree in Public Aairs with a Business concentration. He ha
completed Levels I, II, and III of the Market Technician’s Association’s Chartered Market Technicia(CMT) program and is awaiting the ocial charter in early 2009.

8/15/2019 Ultimate Guide eBook
http://slidepdf.com/reader/full/ultimate-guide-ebook 70/218
ultimate guide to trading and investment
7

8/15/2019 Ultimate Guide eBook
http://slidepdf.com/reader/full/ultimate-guide-ebook 71/218
ultimate guide to trading and investment
7
FOREX

8/15/2019 Ultimate Guide eBook
http://slidepdf.com/reader/full/ultimate-guide-ebook 72/218
ultimate guide to trading and investment
7
Hello traders!
Welcome to this mini Forex Foundation course, your roadmap to trading the Forex Markets. Mname is Jody Samuels and my trading career began on Wall Street in the early 80’s. Today I managfxtradersedge.com, a comprehensive website that oers courses and numerous coaching antrading services specializing in Elliott Wave, Fibonacci and Harmonics analysis and trading.
Trading Pub asked me to explain what makes Forex a great market to trade so I thought I woustart with some basic terminology and history, to show you how the market has evolved as one of thfastest growing markets to trade. I will then switch gears completely and talk about a strategy whicis very easy for a new Forex trader to grasp. (It is even good for advanced traders!) The strategy called the 123 continuation and reversal pattern and we will show how to use it during trend and enof trend cycles.
What is Forex?
Foreign Exchange Trading is known as Forex, or by the acronym FX.
Today we are going to talk about the transactions of the foreign exchange market known as the spmarket. This market involves a worldwide electronic network of banks, brokers and other nanciintermediaries.Unlike the stock exchange markets, Forex has no physical location – it’s completeelectronic. This ensures that transactions happen in seconds directly with the market makers. Aprots are settled immediately in cash.
Figure 1: The Forex Spot Market
The Lingo in Forex is about pips and lots. What is a pip? If we look atthe EURUSD at 1.0925, the pip is the last decimal place. When we talkabout a move in the EURUSD of 5 pips, we are referring to a move from1.0925 to 1.0930.
The pip is 1/10,000 of a decimal place. A 100 pip move is from 1.0900to 1.1000. If we look at the USDJPY at 122.50, the pip is also the lastdecimal place. If the USDJPY moves 1 pip in the market, it moves from122.50 to 122.51. The pip is 1/100 of a decimal place.
A SIMPLE 123 FOREX STRATEGYBy Jody Samuels, CEO, FX Trader’s EDGE

8/15/2019 Ultimate Guide eBook
http://slidepdf.com/reader/full/ultimate-guide-ebook 73/218
ultimate guide to trading and investment
7
Nowadays, brokers quote to 5 decimal places in the EURUSD and to 3 decimal places in the USDJPYFor example, the EURUSD would be quoted as 1.09256 and the USDJPY would be quoted a122.508.
Currencies used to only be traded in specic Lot or Unit sizes. If the unit is USD, a standard lot i$100,000. A Mini lot is $10,000. And a Micro lot is $1,000. Today, brokers allow traders to vary theUnit size without sticking to the standard Lot sizes. If you are wondering how a small investor catrade $100,000 without depositing that amount of money, it’s because of Leverage.
The broker where you set up your trading account will require a margin to trade $100,000. Thamargin will vary according to the leverage the broker is willing to oer. At 50:1 leverage, the amounrequired to trade $100,000 is $2,000. The broker “lends” you the rest. Of course, any losses or gainon the position will be added to or deducted from the balance in the account.
Why trade Forex?
The Forex market has evolved faster than any other nancial market in history. According to theBank for International Settlements, the central bank for central banks, average daily turnover on thworld's foreign exchange markets reached almost $1.5 trillion in 1998, increased to $1.9 trillion odaily trading in 2004, and skyrocketed to an unprecedented level of almost $5.3 trillion in 2013.
However, foreign exchange transactions existed a long time before that. Let’s learn a little histortogether.
Between 1876 and 1931 currencies gained a new phase of stability because they were supporteby the price of gold. The Gold Standard replaced the age-old practice in which kings and rulerarbitrarily devalued money and triggered ination.
The Gold Standard was a commitment by participating countries to x the prices of their domesticurrencies in terms of a specied amount of gold.
The Gold Standard prevailed until WWI, was reinstated in 1925, and broke down again in 193following Britain’s departure in the face of massive gold and capital outows.
Beginning in 1944, countries operated under the Bretton Woods Accord. A total of 44 countries mein New Hampshire to design a new economic order.
The Bretton Woods Conference of 1944 established an international xed exchange rate regime iwhich currencies were pegged to the United States dollar, which was based on the gold standard aa xed value of $35 per ounce.
However, heavy American spending on the Vietnam War led to persistent U.S. balance-of-paymentdecits and steadily reduced gold reserves. Finally, on August 15, 1971, President Nixon announcethe suspension of converting dollars into gold, unilaterally devaluing the U.S. dollar and eectivelending the Bretton Woods Accord.

8/15/2019 Ultimate Guide eBook
http://slidepdf.com/reader/full/ultimate-guide-ebook 74/218
ultimate guide to trading and investment
7
After the Bretton Woods Accord, the Smithsonian Agreement was signed in December of 1971. Thagreement was similar to the Bretton Woods Accord, but it allowed for a greater uctuation for foreigcurrencies.
The US trade decit continued to grow, however, and the US dollar needed to be devalued beyonthe parameters established by the Smithsonian Agreement, and this resulted in its collapse in 197
In 1978, the free-oating system was ocially mandated. This had occurred by default becausno new agreements surfaced. At the same time, Europe gained independence from the dollar bcreating the European Monetary System. This lasted until the introduction of the Euro in 1993.
Finally, the rst online trade happened in 1997, which marked the beginning of the retail market.
Who Trades Forex?
An acronym I developed is the Be RICHeR network and this network trades Forex.
Figure 2: Who Trades Forex?
The Banks were involved in the Forex markets at its inception in the 1970’s. The Retail Forex Brokecame on the scene after 1997. Investment Management Firms have foreign exposures from thestock and bond portfolios and they transact with the banks.
Corporations in their daily, monthly and yearly foreign exchange transactions deal with the banks. ThCentral Banks are also key players managing their currency exposures and dealing with investmebanks. Hedge funds manage a variety of asset classes, including currencies, and they transact witBanks.
Finally, we have eRetail, dealing electronically through a trading platforms of retail Forex BrokerWhen you take your rst currency trade, you too will become part of this Be RICHeR NetworWelcome.

8/15/2019 Ultimate Guide eBook
http://slidepdf.com/reader/full/ultimate-guide-ebook 75/218
ultimate guide to trading and investment
7
OVERVIEWTradable Markets on a Forex Platform
In the Forex market, there are a great number of currency pairs to trade, which include the USD pair
and the Crosses. On the majority of Forex trading platforms, one can trade CFD’s as well as currencies A CFD, or contract for dierence, is a product whose price is based on the underlying instrumenand is considered an over-the-counter (OTC) product, which is not traded on any exchange. CFD’include stock indices, metals and energy products. For most brokers, the lists of oered instrumentcontinues to grow. Now, Forex trading platforms are beginning to add CFD’s on stocks and ETFs awell. As retail traders, we have the ability to trade all of these instruments on Forex trading platformsThe number of markets quoted will vary from broker to broker.
Capture the “Flavor of the Day or Week”
Once we understand which markets can be traded on the trading platform, how do we decide whicmarkets are trending? One way to do that, is to look at several markets at once to compare them. I
this example we are looking at the major USD pairs to see if there is a particular trend in these pairsThen we can do the analysis and decide which pairs to trade and when. Scanning charts like this idone to capture the “Flavor of the Day or Week” in order to stay with the trend.
In the example below, all the USD pairs have clean price action and fall within dened channel lines witthe exception of the USDJPY, which is trading sideways and USDCAD, which is tracing out a triangleThe four other pairs – the EURUSD, GBPUSD, AUDUSD and the NZDUSD – are trading nicely within thchannel lines which bodes well for either a trend continuation or a breakout to a new direction. Notice alsthat the weaker currencies are the EUR and the GBP and the stronger currencies are the AUD and the NZD
What do you think the trends are for the EURAUD, EURNZD, GBPAUD and GBPNZD? You wouldbe correct if you thought “trending lower.”In addition to scanning the charts for clean price action,
is necessary to review the news releases to be prepared for events which could move the markets An understanding of the fundamentals is key to relating the price action to the economic backdroaecting the markets.
Figure 3: Scanning the USD Pairs for Opportunities

8/15/2019 Ultimate Guide eBook
http://slidepdf.com/reader/full/ultimate-guide-ebook 76/218
ultimate guide to trading and investment
7
The 123 Pattern as a Reversal Trading Strategy
Now we are going to move into the trading strategy section of this course. The simple trading strategthat I have selected is the 123 strategy for continuation trades and end of trend trades. First we ar
going to look at the 123 pattern as an end of trend, or reversal trading strategy, also called the 12top and bottom pattern.
The 123 top and bottom pattern is a very powerful pattern that signals a trend reversal. It can also bused as a trend continuation, which will be described shortly. First, the reversal pattern.
Scenario 1: In an uptrend, the market hits a new high, labeled point 1. Price then pulls back to short-term support level, labeled point 2. Finally, price moves up to an area between points 1 and labeled point 3. It then reverses down again and begins a trend in the new direction.
Trade Entry: The pattern is complete when the price trades below point 2. At a 123 top, the strategis to sell on a break of point 2. The measuring objective is the distance between point 2 and point
projected below the break at point 2. The stop loss is set just above point 3 but a more conservativstop loss is above the start of this move, at point 1.
This is a choice that the trader must make and only by trading it over and over again will the tradefeel comfortable with the choice of a stop loss.
An optional sell is at point 3, only if point 3 is at the 50% retracement level of the move from 1 to Also watch for reversal candlestick patterns at point 3 to trigger the entry.
Figure 4: 123 Reversal Trade Entry

8/15/2019 Ultimate Guide eBook
http://slidepdf.com/reader/full/ultimate-guide-ebook 77/218
ultimate guide to trading and investment
7
Figure 5 summarizes the 123 top and bottom trade. We just looked at scenario 1 which is the 12top. Now we will discuss the opposite scenario of a 123 bottom.
Scenario 2: At a 123 bottom, the market hits a low at point 1, trades up to point 2, trades back dow
to point 3, and back up through point 2 to begin a new uptrend.
Observations:
I like to see point 3 retrace at least 50% of the move down from point 1 to point 2. I also learnethat if the pattern has between 10 and 20 bars between points 1 and 3, it is more likely to succeedWhat I have to say about that is back test and see for yourself. I take most of my trades based othis pattern alone. It is very powerful. You can also use this pattern on a smaller time frame once thmarket reversal is identied. You will get a closer entry to point 1 and will therefore be able to take larger position, using the same money management rules.
Figure 5: 123 Top and Bottom
Notes
1. The 123 formation is classied as a major reversal pattern and is one of the best indicatoof a trend reversal. They are found on every time frame. The swing or position trader will loofor these patterns on the weekly, daily and 4-hour charts. The day trader will look for 123’on the hourly and 15-minute charts. The momentum trader will trade these patterns on th5-minute, 1-minute and tick time frames.
2. Stop losses for 123 tops should be set above point 1 initially, and positions need to be size
accordingly so as not to exceed the risk limit for the trade. Another option is to place stopabove point 3. However, the odds are increased of being stopped out early. It is better ttake a smaller position and leave the stop above point 1. Stop losses for 123 bottoms are sebelow point 1, or alternatively, below point 3.
3. Optional: On a 123 reversal using any time frame, wait one or two candles for conrmationIdeally price will come back and retest the breakout or breakdown point for a safer entry. Thhelps to avoid whipsaw.

8/15/2019 Ultimate Guide eBook
http://slidepdf.com/reader/full/ultimate-guide-ebook 78/218
ultimate guide to trading and investment
7
At this point in the video we look at more 123 reversal examples using market data.
The 123 Pattern as a Trend Continuation Strategy
We have just completed the section on the 123 reversal pattern as conrmation of the end of thtrend. However, while the end of trend 123 top and bottom is a great entry method for taking reverstrades, most of your trades as swing and day traders will be trying to get into a trend move – gettininto the trend in the middle of it. You may have heard that “the trend is your friend”, so now we wlearn a method to get into a trend move using the 123 trend continuation pattern.
How do you get into the trend in the middle of it? The safest trades you can make are the ones wheyou are trading in the direction of the current trend. In other words, if the trend is up, you should blong – and if the trend is down, you should be short. If you miss the start of the trend, you still neea method to enter a conrmed trend during its progress. I am going to suggest two entry methodusing the 123 pattern for trend continuation called internal 123’s.
Figure 6: 123 Trend Continuation Trade Entry
Method 1:
Draw your 123 points as price moves in the direction of the new trend.Enter on a break of the new
established point 2 with a stop below point 3 if the trend is up, and above point 3 if the trend is dowFollow the market up or down, depending on the trend.
Method 2:
Draw your 123 points.Enter at point 3 with a stop below the new point 1 if the trend is up anabove the new point 1 if the trend is down. Figure 7 illustrates both the 123 reversal and the 12continuation, back to back, on the same market, the 4-hour GBPAUD.

8/15/2019 Ultimate Guide eBook
http://slidepdf.com/reader/full/ultimate-guide-ebook 79/218
ultimate guide to trading and investment
7
Figure 7: 123 Trend Continuation Trade Entry with 123 Reversal
Notes
1. When the “Trend is your friend”, we need to make sure we get into the trend at various poinalong the way. Why? The safest trades are taken in the direction of the current trend. Tradentry is easily done with the internal 123 formation.
2. In a trend, the rst 123 pattern is the reversal pattern that occurs at market tops and bottom
The second and third sets of internal 123’s continue to conrm the uptrend or downtrend.
3. Take note how each point 3 becomes the new point 1 for the next internal 123 pattern. In very strong trend, point 3 will not always retrace to at least the 50% mark, and that’s ok. It more important for that to occur with reversal 123’s. In a strong trend, the retracements cabe as shallow as 23.6% or 38.2%.
4. If you miss the initial reversal 123 pattern, look to get into the subsequent internal 123’Preferred entry is on the break of point 2. However, alternatively, you may enter at point 3 And, wait for the candles to start trending again before entering.
5. Prot taking is recommended along the way for day traders. Position and swing traders ma
hold the positions and trail the stop every time we trigger a new trade. The stop would thebe placed above the new point 1 if in a downtrend or below if in an uptrend, and previoustops would be moved to the new point 1. These positions would be considered “add-ons” foposition and swing traders.
At this point in the video we look at additional 123 continuation examples using market data.

8/15/2019 Ultimate Guide eBook
http://slidepdf.com/reader/full/ultimate-guide-ebook 80/218
ultimate guide to trading and investment
8
CONCLUSIONThe Forex markets oer an opportunity to trade various currency pairs and CFD’s as well. Once
trader understands that all of the markets are related in some way – currencies, commodities anstocks – and that correlations exist between certain markets, the excitement comes in understandinthese relationships in order to conrm market moves day in and day out. Learn the fundamentalscan the markets for the best markets to trade, and select a simple strategy such as the 123 Strategto stay with the trend, or nd the end of the trend for a market reversal.
Jody Samuels covers the 123 pattern over multiple markets. WATCH HER VIDEO HERE!
THE SPECIAL OFFEr
The FX Trader’s EDGE Forex Foundation Course covers A to Z trading basics, including amultitude of trading strategies to use in today’s volatile markets. In this program, we are goingto take you on a journey to further your trading education. That means that we will start with thebasics, cover the intermediate levels, and end with more advanced concepts.
SIMPLY CLICK HERE FOR MORE INFORMATION!
ABOUT THE AUTHOR
Jody Samuels is one of North America’s leading coaches for successful traderand the creator of fxtradersedge.com. Her highly acclaimed new book, ThTraders Pendulum – The 10 Habits of Highly Successful Traders, is describeas the trader’s guide to the business, psychology and hype in trading and is must read for any trader with a passion for a protable trading business. JodSamuels, a professional trader with 15 years’ experience trading currencies wi
a New York international investment bank, successfully made millions of dollars using the provetheories of Elliott Wave analysis. The Elliott Wave Ultimate Course, Jody’s latest accomplishmenillustrates the convergence of Elliott, Fibonacci and Harmonics in a ground breaking program tcombine precise analysis with a simple strategy, and can be accessed on fxtradersedge.com.

8/15/2019 Ultimate Guide eBook
http://slidepdf.com/reader/full/ultimate-guide-ebook 81/218
ultimate guide to trading and investment
8
The FX market forms consistent patterns that often take place at the same time everyday. Betwee2:00 am Eastern time and 5:00 am Eastern time the market has about a 70% chance to form its rshigh or low of the day. This consistent movement forms what we call the London Breakout Strategand can be applied to any of the following pairs: GBP/USD, GBP/CHF, GPB/NZD, GBP/CAD, GPB
JPY and the GPB/AUD.
The second high or low will form anywhere between 8:00 am eastern time and 2:00 pm eastertime, which makes it more dicult to take advantage of seeing it as it is a larger time range. So ware going to focus in on the rst high/low of the day simply because we have a higher percentage owinning.
The distance between the rst low and the high of the day or vice versa is known as the ADT(AveragDaily Trading Range) which can be anywhere between 50 and 200 pips in a single day. With standard position, which is an investment of $2,000 at 50 pips a day, you stand to earn $500 and a200 pips a day you are at $2,000.
The London Breakout SessionBy Joshua Martinez, Market Traders Institute
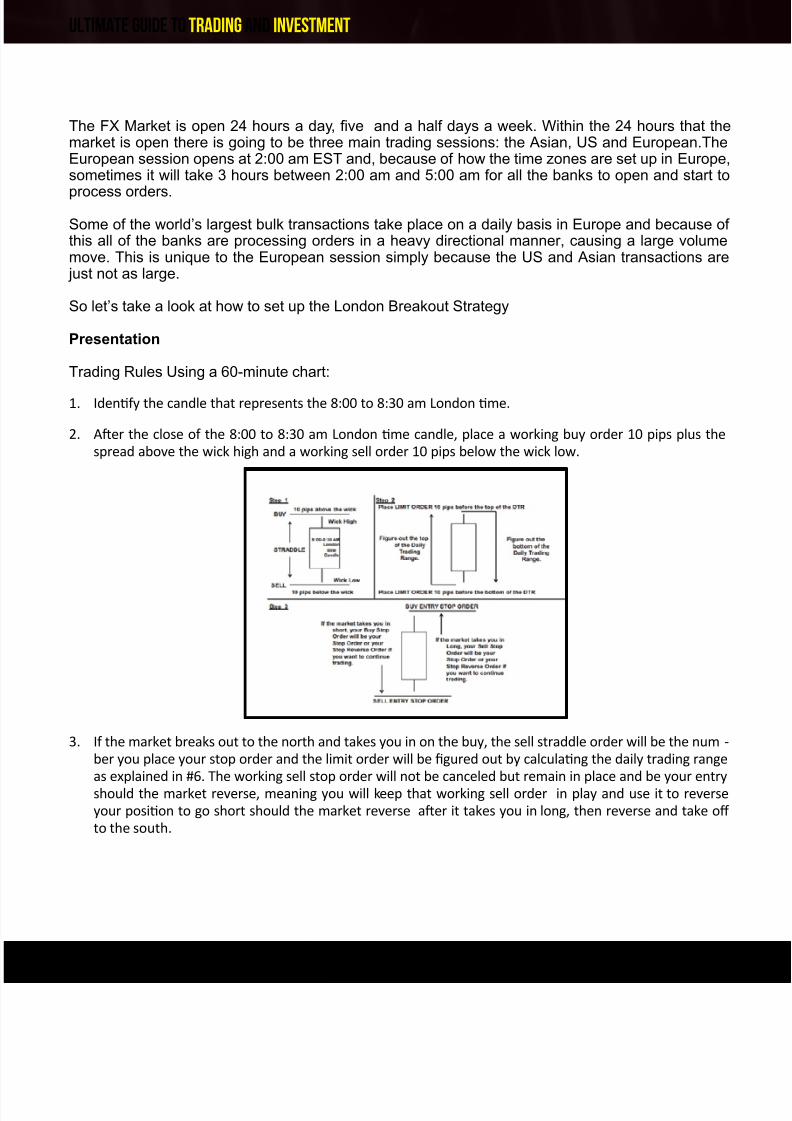
8/15/2019 Ultimate Guide eBook
http://slidepdf.com/reader/full/ultimate-guide-ebook 82/218
ultimate guide to trading and investment
8
The FX Market is open 24 hours a day, ve and a half days a week. Within the 24 hours that thmarket is open there is going to be three main trading sessions: the Asian, US and European.ThEuropean session opens at 2:00 am EST and, because of how the time zones are set up in Europsometimes it will take 3 hours between 2:00 am and 5:00 am for all the banks to open and start
process orders.
Some of the world’s largest bulk transactions take place on a daily basis in Europe and because othis all of the banks are processing orders in a heavy directional manner, causing a large volummove. This is unique to the European session simply because the US and Asian transactions ar just not as large.
So let’s take a look at how to set up the London Breakout Strategy
Presentation
Trading Rules Using a 60-minute chart:
1. Idenfy the candle that represents the 8:00 to 8:30 am London me.
2. Aer the close of the 8:00 to 8:30 am London me candle, place a working buy order 10 pips plus th
spread above the wick high and a working sell order 10 pips below the wick low.
3. If the market breaks out to the north and takes you in on the buy, the sell straddle order will be the num
ber you place your stop order and the limit order will be gured out by calculang the daily trading rang
as explained in #6. The working sell stop order will not be canceled but remain in place and be your ent
should the market reverse, meaning you will keep that working sell order in play and use it to rever
your posion to go short should the market reverse aer it takes you in long, then reverse and take o
to the south.

8/15/2019 Ultimate Guide eBook
http://slidepdf.com/reader/full/ultimate-guide-ebook 83/218
ultimate guide to trading and investment
8
4. If the market breaks out to the south and takes you in on the sell, the buy straddle order will be the num
ber you place your stop order and the limit order will be gured out by calculang the daily trading rang
as explained in #7. The working buy stop order will not be canceled but remain in place and be your entrshould the market reverse; meaning you will keep that working buy order in play and use it to revers
your posion to go long should the marketreverse aer it takes you in short , then reverse and take o t
the north.
5. You will want to trade the daily trading range. Find the average daily trading range over the last month.
6. If it breaks out to the north and takes you in on the buy, nd the low that has been made over the last
2-4 hours and use that as your starng point to nd the esmated high of the daily trading range; and
set yourt limit order 10 pips below that number.
7. If it breaks out to the south and takes you in on the sell, nd the high that has been made over the last
2-4 hours; and use that as your starng point to nd the esmated low of the daily trading range andset your limit order 10 pips above that number.

8/15/2019 Ultimate Guide eBook
http://slidepdf.com/reader/full/ultimate-guide-ebook 84/218
ultimate guide to trading and investment
8
8. If the market stops you out 2 times in a row, you may consider it to be a sideways day and not continueto trade. Should you continue to trade, I recommend you continue to trade in the direction of the 2-hourchart.
CONCLUSION
London Breakout Strategy Checklist: Apply this strategy to the GBP crossovers: GBP/AUD, GBP/CAD, GBCHF, GBP/JPY, GBP/NZD, and the GBP/USD
Pre-Trade Checklist
● Use the 60-minute time frame.
● Identify the candle that represents the 8:00 AM to 9:00 AM London time (3:00 AM to 4:00 AM ET).
● After the close of the 8:00 AM to 9:00 AM London time candle, identify if the candle is in a BUY LOor SELL HIGH price.
If the market is in a sell high price
● Place an ENTRY SELL ORDER -5 pips below the candlestick wick LOW.
● Place a STOP +10 pips ABOVE the candlestick wick HIGH. Your LIMIT will always be at least +50 pifrom your entry SELL PRICE.
If the market is in a buy low price
● Place an ENTRY BUY ORDER +10 pips above the candlestick wick HIGH.
● Place a STOP at the LOW of the candlestick wick LOW. Your LIMIT will always be at least +50 pifrom your entry BUY PRICE.
If by chance the risk is larger than -50 pips, then your reward will match your risk. For example: If risk is -6pips then the reward will be +65 pips.

8/15/2019 Ultimate Guide eBook
http://slidepdf.com/reader/full/ultimate-guide-ebook 85/218
ultimate guide to trading and investment
8
THE MOVIE
SIGN-UP HERE and see a Free Forex Training Video series!
THE SPECIAL OFFER
Take a 30 day test drive with MTI for only $27. SIMPLY CLICK HERE TO REGISTER!
ABOUT THE AUTHOR
Joshua Martinez is Market Traders Institute's product expert and has trainethousands of investors to trade the Forex market. Joshua initially began his tradin
career with a $500 investment which he turned into over $39,000 in prot. He is published author, professional FX analyst and, most importantly, he is a full timtrader.
Joshua is one of MTI’s most followed Forex analysts and is head of MTI’s Analyst on Demand. Hitime is spent training and coordinating its team of analysts as well as monitoring and evaluating thoverall trader experience for quality assurance. You can nd him in the Analyst on Demand charoom sharing his trading insight to MTI Clients.

8/15/2019 Ultimate Guide eBook
http://slidepdf.com/reader/full/ultimate-guide-ebook 86/218
ultimate guide to trading and investment
8
The Importance of Volume and Order Flow Trading
I created my business for the purpose of helping active individual traders to understand the importancof Volume and Order Flow trading. I think that you might nd more in common with me than you thinI say this because I started as a novice retail trader twelve years ago and like yourself have spenyears, months, days, hours and minutes searching for the right strategy that would work for me.
Eight years ago, I decided that I could no longer trade in ignorance and decided that I had to gurout a way to break into the industry and nd out what was happening behind the scenes. Living Los Angeles, California I found it very dicult because the industry leaders in Forex were located the time in New York, Chicago and San Francisco.
All I could nd in Los Angeles were Independent Introducing Brokerage (IIB) rms. These were smaboutique Futures and Forex Firms that referred their clients to large clearing rms. Since I could nrelocate to any other place because I was too old and without experience, I applied to a small IIB aan assistant to get my foot in the door. Since I also had some experience trading Forex, they gavme an opportunity.
For a year and a half I worked there as a Broker’s Assistant learning the business and simultaneousstudying for the Series 3 License. What did I learn working for young brokers was that they wermore ignorant than I was when it came to trading and advising their client’s. Let’s just say that I donwant to name who they are because they don’t matter anymore. However, they were relevant to mgrowth in this industry because if not for them I would have never gotten my foot in the door.
Once I passed my Series 3 exam, I had to move on and was hired by PFGBEST in 2008 as a Futureand Forex Broker.This is where I stayed there until 2011 right before PFGBEST went down due to thCEO’s embezzlement of client funds. Although PFGBEST leaves a bad taste in everyone’s moutit allowed me to work with some of the best software developers the company had in the industry.
A team of innovators that created one of the rst Electronic Communications Networks an (ECN) th
pioneered straight through processing. We were the rst group to bridge multiple bank feeds into onmaster bank feed. Here is where my school of digital manipulation of order ow began.
This is where I learned the protocols that the banks/market makers created and implemented trade against the retail trader. But more importantly, I learned what was happening behind the scenethat a retail trader would only dream of discovering but never gets a chance to see too see.
What Is the Best Time toTrade Currencies?
By Ricardo Menjivar, PhoenixTradingStrategies.com

8/15/2019 Ultimate Guide eBook
http://slidepdf.com/reader/full/ultimate-guide-ebook 87/218
ultimate guide to trading and investment
8
As a broker, it allowed me to work with many educators and traders. I was able to create one othe largest client books in the industry, which consisted of over 1,100 clients. I had clients fromretail traders to professional Commodity Trading Advisors (CTA’s), to Institutional Traders that werProprietary Desk Traders. And because I was able to provide them the technological solution tha
they were looking for, my reputation and business grew exponentially.
This also allowed me to work with software developers and traders that were on the forefront of HigFrequency Trading, which at the time was a fad just like Expert Advisor (EA’s). So my experience aa broker and trader grew to levels of knowledge that few individuals ever get to aspire too. I lived iI learned it, I worked it and I enjoyed it. A true blessing from God. So I believe that what I will sharwith you will change the way you trade forever, because I will change your perspective from lookinat the market from the eyes of a retail trader to an institutional trader. I will let you be the judge of thaas you continue to read.
The Trading Strategy My trading strategy is based on four concepts:
1. Order Flow ( High Frequency Trading)
2. Volume Divergence ( The Foot Print of the Trade)
3. Volume Price Analysis
4. Volume Spread Analysis
It is because I have a more profound understanding of how the banks have designed their strategieunder the umbrella of these four (4) concepts that I have been able to reverse engineer their protocoand create a strategy and suite of indicators that can intercept and interpret their real trades beforanyone is aware of their real plan of action.
I know it sounds arrogant to make a statement like this, but you will discover that what most so-calleexperts and educators teach is outdated and cannot be applied in this new world of digital warfareYou need a guide that truly understands the new order of trading because what is being presenteto the retail trader is incomplete and delayed information. That is why you have not been able tprogress as a trader.
I’ll show you that trading is like a game of cheswhere you must think 4 to 5 steps ahead of youopponent. And this opponent does not care thayou have emotions. This is why you are now tradinagainst robots that are programmed with algorithm
to confuse and out-think you.

8/15/2019 Ultimate Guide eBook
http://slidepdf.com/reader/full/ultimate-guide-ebook 88/218
ultimate guide to trading and investment
8
I have learned to see through the smoke and mirrors and catch them make the mistake of a centurYes, I said mistake of the century. Sometimes you have to know what you are looking for in order tnd the right solution. Now it is at your ngertips and when you see that I have streamlined the tradidentication process so that anyone can learn how to do this. The only thing on your mind will be
where do I sign up.
You see, while everyone is talking about Moving Averages, Stochastics, MACD, RSI, Elliot WaveFibonacci Levels, Regular Volume Indicators, Candle Sticks, Ichimuko Cloud, Pivot Levels, ChaPatterns, etc... They are leading you in the wrong direction. I say this because I have studied thmathematical formulas behind these indicators and now that I know how the banks manipulate thevolume and order ow I can show you how they have counter programmed these indicators. Dondespair. There is always a solution to the problem and an answer to a question.
You will learn that my strategy is dened by 4 algorithms and a systematic ve (5) step process thanyone can learn without having to go through a big learning curve. Trading was hard until now. Noit has become too easy to predict, I don’t care if I miss a trade because there will be another that w
make up for it. And since I have designed the strategy to give me time to determine the best entrdetermine the best stop loss, and even forecast the best exit. Ask yourself. What more can you asfor? I trade with a calm demeanor and my students come the same conclusion. This can’t be theasy. They are right it was never meant to be easy but it has evolved in a strategy that we can truand believe in. So when others began the race with decoding volume it is Phoenix Trading Strategiethat has nished the race and is the winner.
Once you see what I do, you will be inspired to learn to trade without fear and doubt. Yes, fear andoubt? Fear and doubt cloud your decision process because you are unable to analyze the real risof the trade. How can you when you have never had the right guidance or information?
I now look for a specic set up that identies the point of control that the buyers and sellers have chose
in each candle where they prefer to buy and sell. Identify where there is real volume divergencdetermine the real support or resistance level that they are going to use to rebalance their risk anexposure in the market. Isolate the price level that I can use to make my entry into the trade.
Establish my risk because I now know the price level that will not be penetrating as a support oresistance level because the decision has been made by the market makers to take the trade in thopposite direction and nally forecast the exit to maximize the best outcome of the trade.
Identifying the Best Currency Pairs and Time of Day to Trade
I am sure that you are aware that market conditions change and that nding trade opportunities awell. At this particular moment I nd that there are better opportunities to nd trades at the close o
the U.S. Session - 5 pm EST. Why is this?
China has become such a big player that they are aecting the following currency pairs in FX thatsee great opportunity almost every day. Those pairs that I like to trade the most are GPB/AUD, GBPNZD , EUR/AUD, EUR/NZD, NZD/USD, AUD/USD … You will discover that these are great pairto trade because they are at this moment more active than the regular pairs such as the USD/JPYEUR/USD , GBP/USD, USD/CHF etc.

8/15/2019 Ultimate Guide eBook
http://slidepdf.com/reader/full/ultimate-guide-ebook 89/218
ultimate guide to trading and investment
8
I have found that these pairs usually move somewhere between 50 to 100 pips during the Asiasession. But I feel that the Asian session is underrated by many traders because they are lookinfor trades in the wrong pairs when they should be looking at these six (6) pairs. That would exciteveryone’s trading and not require those that live in the U.S. to lose sleep and try and trade durin
the European Session.
I also favor trading the European Session at times because you can nd some good trades witthe EUR/USD , GBP/USD , and USD/JPY that are much more active. Now if you are like me anyou live in Southern California you must value your sleep, so I only trade the European session oWednesday evening into the early morning of Thursday. Yes, once a week. I nd that one cannomake good trading decisions if you have a lack of sleep and are very tired.
I am sure that some of you like trading the U.S. Session but you really can’t nd any good trades athis moment because they have already occurred during the Asian and European Sessions. Now this not to say that this won’t change in a few months.
For the time being I don’t fear trading during the Asian session because others claim that bankand market makers set the trade up for the European session. Which is a lie, that I cannot suppobecause the banks and market makers are always rebalancing their risk in the market and choosthe FX Pairs where they have more exposure to do what I call Currency Portfolio Rebalancing.
Think about it they have exposure than you and I because they are constantly in the market 24/7Remember the retail trader is just in the market from a few minute to a few hours while the bankmaintain their positions and exposure for days weeks and months.
Using Phoenix Power Dots
If you are in love with trading as I am, I think you will appreciate the cutting edge technology brea
through that I bring to the table. I have developed my own proprietary indicators that describthe market from a dierent perspective than you are accustomed to seeing.So have an open minbecause if you were truly interested in learning how decode the banks high frequency order owtrading then you are going to love what I have done.
Let us begin with my pride and joy, a super algorithm that I call the Phoenix Power Dots and you wunderstand why they are so powerful. These Gold dots announce three things.
They establish a new support or resistance levels that form based on the manipulation of order ocaused by high frequency around those price levels that the banks and market makers are doing toset their risk to the downside before driving the trade long as the picture below describes. Upoforming they also announce that volume, momentum and liquidity that will come into the market t
drive the pair.

8/15/2019 Ultimate Guide eBook
http://slidepdf.com/reader/full/ultimate-guide-ebook 90/218
ultimate guide to trading and investment
9
As you can see the Phoenix Power Dots in the picture above show that they established the suppolevel that would give an hour notice before they took the trade long. Can you think of any indicatout there that gives you 30 min to an hour notice before volume, momentum and liquidity come in drive the trade? I can assure you that no such indicator exists, thus making my Phoenix Power D Algorithm unmatched. More importantly, you can see that we would be entering a trade long on th4th or 5th candle because we have an established support level that will not be challenged.
This is because when the Phoenix Power Dots form, the banks/market makers are osetting therisk to the downside. You will discover that the longer they take to rebalance their short positions thbigger the trend of that trade once it begins.
The Trend Dots, and Trend Stop help to keep you in the trade once it begins to trend. The Pivo
outline new support and resistance levels which are price targets as the trade begins to trend. Thnext Algorithm that you are going to see will change the way you look at Order Flow forever if yohave a little understanding of how it works.
You see there are people out there that have complicated indicators to demonstrate their sophisticatiobut in actuality they have the wrong formula. I am not here to correct them, because they have faileand I have succeeded in decoding what is probably the most complicated program that evades eveinstitutional traders. But I am going to put it at your ngertips. So pay attention because you mahave to read this again.
You see all traders want to know, what is the preferred price level in the candle that the buyers prefto bid (buy) at and what is the price level that the sellers prefer to oer (sell) at. It is the one piec
of information that can explain the conspiracy theory of whether the banks communicate amongthemselves.
The new Phoenix Price Identier does exactly that, because now we can forecast when the buyeare in disagreement with the sellers or vice versa and see with clarity that the trade will changdirections within the next two candles.
You see we now have the ability to detect a trade imbalance that you can bank on. You see this

8/15/2019 Ultimate Guide eBook
http://slidepdf.com/reader/full/ultimate-guide-ebook 91/218
ultimate guide to trading and investment
9
the actual Footprint you have been waiting for.
The picture below shows Green and Red Dashes in each candle. That is another super Algorithmthat we created to show that how the buyer and sellers communicate amongst themselves. I’ll give
brief explanation of what happens here in the picture below.
I have numbered a few candles from 1 to 4. Candle No. 4 being the one where the rst Power Doformed. Normally, I look back 2 to 3 candles once a Power Dot has formed. Why because I want tverify that the banks are going to establish a support level because they are planning on taking thtrade long which did happen here.
What you are about to discover will now change the way you look at trading forever. You see how candle No. 4 the Point of Control (Green Dash) for the buyers it at the top of the candle that will giva two (2) candle warning before they take the trade long. You see even though that candle is bearisthe candle is showing an imbalance between buyer and sellers because the buyers are giving thsellers notice that they are not going to allow the trade to go down any further and that they are goin
to increase their order ow to establish a support level and drive the trade long. So what happened the next 3 candles after candle No. 4 … Now here is the tricky part. Can you see the same imbalancin candles No. 3,2, and 1? The answer is yes.
When the sellers took control and started to drive the trade short the buyers were not in agreemenand communicated to the seller that they were going to slow the trade to short side and eventualltake control again to take the trade long. So you see when combining the Phoenix Power Dots witthe Phoenix Price Identier you get the most magical combination. Now this will be better explainein the video so make sure to watch it.
Here comes the 3rd Super Algorithm that we created called the Phoenix Volume Indicator.
What makes this volume indicator dierent than any other out there for Forex traders is that wsynthetically created volume to interpret the High Frequency Order Flow. In the Example beloyou will see what I mean. This is the only volume indicator that give you a visual describing VolumDivergence but also a numerical value of divergence through the high frequency trading in eaccandle. Let’s use candle No.3 .

8/15/2019 Ultimate Guide eBook
http://slidepdf.com/reader/full/ultimate-guide-ebook 92/218
ultimate guide to trading and investment
9
You see the Data Box show the buying volume, selling volume and cumulative volume in Panel 2. Sthe top of the volume bar is represents the maximum buying volume in that bar, the bottom of that brepresents the maximum selling volume and the grey dash represents where that bar settled whicin this case was 32 million negative volume. But that 32 million represents order that did not get lle
by the buyers. Again you will be able to understand it further in the video.
The Fourth Algorithm is called the Phoenix Congestion Zones. What this indicator does is identisupport and resistance levels where Power Dots have formed in the past in dierent time frameThe example below will show blue and light green lines. The Blue Lines represent strong suppolevels in the 30 min time frame and the light green line represents strong support levels in the 60 mtime frame.
Last but not least is the Market Analyzer that makes identifying trades easy as 1,2,3. I have over 2pairs on it and I have programmed it to alert me when there are Phoenix Power Dot formations sthat I can go to those pairs and take my time analyzing whether they are the type of trade setups thI look for.

8/15/2019 Ultimate Guide eBook
http://slidepdf.com/reader/full/ultimate-guide-ebook 93/218
ultimate guide to trading and investment
9
Let’s Take a Look at a Trade Example
Here is an example of a trade set up that I normally look for in the GBP/NZD. You can see in thexample below that we had a Resistance Level Power Dot Formation, You have an imbalance in thcandle giving to two candle warning before going short and you have volume divergence conrmina short trade even further.
SUMMARY
If after you have read this chapter and watched the video. Take the time to look at the GBP/AUD GBP/NZD ,EUR/NZD , EUR/AUD , NZD/USD , AUD/USD at the end of the trading day which is PM EST.
You will conrm for yourself that the banks at this particular moment are trading these pairaggressively when you compare them to other pairs. More importantly is that if you live here in theU.S. you can trade these during the afternoon or early evening and not lose sleep trying to nd atrade during the European Session. I love my sleep, How about you?
Just remember that if you choose to use our cutting edge technology you will be able to pinpointhese trade opportunities every day during the Asian or European Session by just letting the Marke Analyzer alert you so you can go to the charts to analyze whether that is the trade you are waitinfor or if you should wait for it to develop further. At the end you will love what I have to show yobecause the one thing that you have is time. Time to analyze and determine your entry, your stoloss and your take prot target. It just can’t get any simpler than this. Remember that information ithe most valuable commodity a trader can get his hands on. With our suite of indicators traders gethe right information to make great trading decisions.

8/15/2019 Ultimate Guide eBook
http://slidepdf.com/reader/full/ultimate-guide-ebook 94/218
ultimate guide to trading and investment
9
Trading has changed my life for the better. I hope that I have inspired you to shoot for the starand believe that there is someone out there that does care about your success and future. Here Phoenix Trading Strategies we care, that we are willing to educate you and share our wisdom to heyou become that which for too many is but a dream. We don’t want you to dream about it. We wa
you to live and enjoy it. Life is getting harder every day for people, don’t let this opportunity pass yoby that you miss the boat because you procrastinated.
THE MOVIE
“Decoding Market Maker’s Order Flow Footprint”
CLICK HERE to watch Ricardo demonstrate how to collect 400 pips in one night.With PhoenTrading Strategies you are able to put the puzzle of information together. Where before you didneven know where to start. Now you know where to start and nish.
See how Ricardo trades the rate announcements for the Bank of England using
the Phoenix Trading Strategies Indicator, SIMPLY CLICK HERE
THE SPECIAL OFFER
If you wish to learn more about how we trade these markets YOU CAN SIGN UP FOR OUR FREWEBINAR ROOM on Mondays and Fridays from 9:00 am EST to 11:00 am EST. Below is a link fyou to sign up. It will sign you up for our Free Webinar room as well as give you another gift to rea
ABOUT THE AUTHOR
Ricardo Menjivar a licensed Futures and Forex Broker who started trading ove10 years ago as a retail trader like many of you. He decided to become a licenseFutures and Forex Broker in 2008 where he collaborated with a team of softwadevelopers to bring out the rst Electronic Communications Network platform fthe retail FX traders.
As a broker he had the ability to deal with many software developers, CTAProp Desk Traders and Money Managers that were trading the Fore
Markets. That is where he discovered the protocols that the Market Makers / Banks werusing to report their order ow to the Broker Dealers. You will not nd a better individual guide you in this maze of digital warfare. Ricardo chose to create PhoenixTradingStrategiecom in 2014 for the purpose of helping retail traders learn the truth behind the deceit thbanks have created to cheat the retail traders out of their money. He has chosen to share hknowledge to help individuals like you to learn how to correctly analyze and trade these marketsWebsite: www.phoenixtradingstrategies.com

8/15/2019 Ultimate Guide eBook
http://slidepdf.com/reader/full/ultimate-guide-ebook 95/218
ultimate guide to trading and investment
9

8/15/2019 Ultimate Guide eBook
http://slidepdf.com/reader/full/ultimate-guide-ebook 96/218
ultimate guide to trading and investment
9
OPTIONS

8/15/2019 Ultimate Guide eBook
http://slidepdf.com/reader/full/ultimate-guide-ebook 97/218
ultimate guide to trading and investment
9
If you trade stocks, futures or Forex, you should consider adding weekly options to your tradinarsenal. In this chapter you will learn how to trade weekly options using the Ichimoku cloud. We walso focus on four stocks that have weekly options: Apple, Facebook, Tesla and Twitter. Now is onof the best times in history to trade weekly options, and here are a few reasons why:
● Now is the best time in history to trade options. Markets are tighter and more liquid than eve
● There are over 8,700 stocks and 4,200 stocks with options.
● Of the 4,200 stocks with options, 320 stocks are listed with weekly options.
● The CBOE lists weekly options on indices, stocks and ETFs.
● The CBOE publishes a list of all assets with weekly options.
● Gives traders 52 expirations to trade instead of 12.
● Weekly index options account for 11% of all index options volume in 2011 and this number increasing over time.
Weekly options give you the opportunity torake in huge percentage returns in a shortperiod of time.
The CBOE puts out several reports onweekly options and this graphic shows youthe huge increase in the volume of weeklyoptions traded since 2010:
How to Add Weekly Options toYour Trading Arsenal
By Andrew Keene, Founder and CEO, AlphaShark Trading

8/15/2019 Ultimate Guide eBook
http://slidepdf.com/reader/full/ultimate-guide-ebook 98/218
ultimate guide to trading and investment
9
Why should you trade weekly options? The answer is twofold. First, stocks are boring. They mov1-3 percent on a big move and you have to outlay huge amounts of capital to own stocks. Googtrades at $600 per share. If you wanted to buy 100 shares of Google, you would have to lay ou$60,000 dollars.
Since options are leveraged, you can take returns and magnify them. Small moves in stocks calead to huge returns using weekly options. Whether you are a novice or seasoned trader, anyoncan trade weekly options. Green Mountain Coee weekly options had prots that exploded 1,50percent, but the stock moved just 6 percent.
It is very dicult to trade stocks, futures or Forex because you are trading against algorithms. Higfrequency trading and dark pools dominate these spaces, and they are programmed to win. I
t’s like playing chess against a computer, it has been programmed to win, and it’s not likely ththe average chess play can beat the computer. In weekly options, however, there is a “blunmechanism built in.
A trader isn’t always buying calls to get long on a stock. Maybe they are buying the calls to go shoon the stock. The added benet to weekly options is that dark pools do not currently operate in thesmarkets. Another advantage of trading weekly options is that there are multiple dierent ways trade them depending on your trading style and personality.
Let’s take a look at Facebook using a 5-minute chart and the Ichimoku cloud.
The Ichimoku Cloud

8/15/2019 Ultimate Guide eBook
http://slidepdf.com/reader/full/ultimate-guide-ebook 99/218
ultimate guide to trading and investment
9
The Ichimoku cloud is a highly valuable technical indicator because it looks at the past, the presenand the future. It is also free and available on a wide variety of trading platforms. If you’re not familiawith the Ichimoku cloud, here are the basics:
The term Ichimoku means “at rst glance.” At rst glance, is a stock bearish, bullish or neutralWhere is a good entry, and where is a good exit? Let’s take a look at the components that make uthe Ichimoku cloud:
First, let’s look at the tenken-sen (red) line. This line shows the short-term trend and it is calculateas follows:
Tenken-sen line = the highest high + the lowest low over
the last 9 periods divided by 2.
This formula has a Fibonacci retracement built into its calculation. It’s an eective indicator becausit works better than simple moving averages.

8/15/2019 Ultimate Guide eBook
http://slidepdf.com/reader/full/ultimate-guide-ebook 100/218
ultimate guide to trading and investment
10
The Kinjun-sen line (green) shows the longer-term trend. The calculations for this line is:
Kinjun-sen line= the highest high + the lowest low over the last 26 periods divided by 2.
So the tenken-sen and kinjun-sen lines show the short-term and longer-term trends in a market the present time.
The Senkou Span A is the future short-term trend. It forms one of the boundaries of the cloud, and here’s the formula:
Senkou Span A = tenken-sen line + kinjun-sen divided by 2 plotted 26 periods in the future
Senkou Span B is the future long-term trend.

8/15/2019 Ultimate Guide eBook
http://slidepdf.com/reader/full/ultimate-guide-ebook 101/218
ultimate guide to trading and investment
10
It is calculated as follows:
Senkou Span B = (highest high + lowest low) divided by 2, over the past 52 periods, plotte26 periods in the future. If a stock is not making a new high or a new low, then this line is going t
be at.
So we now know the present trend. If you pull up the Ichimoku cloud, you can tell at a glance if thmarket is bullish, bearish or neutral. If it is above the cloud, it’s bullish. If it is below the cloud, it’bearish. If the market is in the cloud, it’s neutral. Now we know how the cloud is constructed for thfuture.
Kumo is the cloud, and it communicates how hard or easy it is to break the trend. Sinceveryone trades dierently, there will be dierent approaches to trading in the cloud. Some peopare breakout traders.
In that case, a thinner cloud is preferable, because there are more entries and traps. Thicker cloudhave less entries, less traps and wider stops. A medium size cloud has not too many traps ancommunicated that a trend is strong.

8/15/2019 Ultimate Guide eBook
http://slidepdf.com/reader/full/ultimate-guide-ebook 102/218
ultimate guide to trading and investment
10
Finally, the Chinkou Span Line is the current closing price, plotted 26 bars back. If you tradedaily chart, it shows you where the price of that stock was a month ago. The Chinkou line gives yoa historical perspective. How is your relationship with this stock versus the last month? Is it better worse?
How to Apply the Ichimoku Cloud in Trading Weekly Options
Now that we know the elements of the cloud let’s apply it to this chart of Tesla. The stock riseabove the cloud, breaking through the short-term (tenken-sen) and long-term (kinjun-sen) movinaverages. The cloud also looks bullish moving forward.
As Tesla breaks the cloud to the upside, you want to plot the ATR, or Average True Range, for TeslWhen the opening bell rings, most institutional traders, mutual funds, hedge funds, etc. have plan whether they are to buy Tesla and accumulate shares or sell Tesla to ooad shares. It is veimportant to know if institutional traders are buying or selling Tesla.

8/15/2019 Ultimate Guide eBook
http://slidepdf.com/reader/full/ultimate-guide-ebook 103/218
ultimate guide to trading and investment
10
The ATR measures how much a stock actually moves from high to low during a trading day.
Tesla has an average daily range of about $7.65. In this example, the low of the day for Tesla i$220.65. If we see the stock breaking to the upside, it is reasonable to expect that Tesla will mov
to $228.30.
So here is the trade:
1. Entry to Open and lled: 40 TSLA weekly 227.5 calls for $0.70
2. Targets: $0.95 and up every $0.25
a. Sold 10 TSLA Calls for $0.95
b. Sold 10 TSLA Calls for $1.10
c. Sold 10 TSLA Calls for $1.35
d. Sold 10 TSLA Calls for $1.60
The 227.5 calls were bought because they realistically reected where the market was going tmove, given the ATR for Tesla and information revealed in the Ichimoku cloud.
All of these targets were hit by the end of the day making this a huge winner. More about the data wkeep on hand to choose this setup will be in the next section.
How to Select a Target on a Trade
TSLA Statistics for YTD at time of this setupTrading Days 229
Up Days 119 51.97%
Down Days 110 48.03%
Average Range 7.65
It is very important to have the right information to make decisions at your ngertips. If you don’t knothe ATR and track record for TSLA over the past year, then you are ying blind. You can manualrecord this information if you follow TSLA daily, or you can subscribe to services that publish thi
data.

8/15/2019 Ultimate Guide eBook
http://slidepdf.com/reader/full/ultimate-guide-ebook 104/218
ultimate guide to trading and investment
10
Conclusion
Trading weekly options can add signicant income. If you become familiar with the Ichimoku clouand you have all of the information you need on the stocks you follow that have weekly options, the
you can ne-tune your portfolio to a handful of stocks that are reliable performers.
• Weekly options oer a trader more expirations than standard options.• Generally speaking, weekly options tend to trade at a lower price than standard
options.
• Weekly options expire on Friday, and they are listed on the previous Thursday.
• Weekly options can experience fast, violent moves in delta.
• Can be used as a vehicle for trading during the day in stocks like FB, TWTR, AAPL anTSLA
THE MOVIE
To watch the video of Andrew discussing the materials shared in his chapter, CLICK HERE
Andrew Keene does an excellent job of explaining why weekly options can be a powerful additionto your trading arsenal. He covers the Ichimoku cloud and it applications for weekly options indepth.
SPECIAL OFFER
Learn how to trade weekly options using the Ichimoku Cloud. CLICK HERE
ABOUT THE AUTHOR
Prior to founding AlphaShark Trading in 2011, Andrew Keene worked as proprietary trader at the Chicago Board Options Exchange.
Keene graduated from Botta Capital’s clerk-to-trade program to becomknown as one of fastest traders to ‘make a market.’ As a market maker htraded options in over 125 stocks, including Apple, General Electric, Gol
man Sachs, and Yahoo.
Keene left Botta Capital to co-found KATL Group, where he was the largest, independent on-the-o Apple trader in the world.

8/15/2019 Ultimate Guide eBook
http://slidepdf.com/reader/full/ultimate-guide-ebook 105/218
ultimate guide to trading and investment
10
The sale of a naked put is often a very attractive strategy that is conservative, can out-perform thmarket, can have a high-win rate, and can be analyzed and sometimes constructed in non-markehours.
In this article, we’re going to look at some of the background on put writing, show a systematic way tselect which puts are best to write, and nally explain how you can implement them into your tradin
arsenal “outside normal hours.”
The methodologies described herein are ones that I have condence in, for they have produceprotable results in actual recommendations and in trading accounts that we manage over timeHowever, there may kbe other protable approaches as well. I am not maintaining that this is thonly way to analyze put writes – only that this is one viable way.
Option Selling is Conservative
The basic concept of option writing is a proven investment technique that is generally considered tbe conservative. It can be implemented as “covered call writing” or, alternatively, “naked put writingwhich is the equivalent strategy to covered call writing. In either case, one is selling a wasting asse
and over time the cumulative eect of this selling will add return to a portfolio, as well as reducing thvolatility of a purely equity portfolio.
People sometimes stay away from uncovered put writing because they hear that it is "too risky" othat it doesn't have a sucient risk-reward. The truth is that put selling, when secured by cash, iactually less risky than owning stock outright and can out-perform the broad market and the coveredwriting index over time.
Covered Writes vs. Naked Put Sales
First of all, it should be understood that the two strategies – naked put writing and covered call writin
– are equivalent.
Two strategies are considered equivalent when their prot graphs have the same shape (Figur1). In this case, both have xed, limited upside prot potential above the striking price of the writteoption, and both have downside risk below the striking price of the written option.
Naked Put-Writing: A Strategy for All-HoursBy Lawrence G. McMillan, McMillan Asset Management

8/15/2019 Ultimate Guide eBook
http://slidepdf.com/reader/full/ultimate-guide-ebook 106/218
ultimate guide to trading and investment
10
FIGURE 1
One very compelling, yet simple argument in favor of naked put writing is this: commission costs alower. A covered write entails two commissions (one for the stock, the other for the written call). naked put requires only one. Furthermore, if the position attains its maximum protability – as wwould hope that it always does – there is another commission to sell the stock when it is called awaThere is no such additional commission for the naked put; it merely expires worthless.
Nowadays, commission costs are small in deeply discounted accounts, but not everyone trades wideep discount brokers. Moreover, even there, it doesn’t hurt to save a few dollars here and thereSo, a naked put sale will have a higher expected return than a covered call write, merely because reduced commission costs.
Another factor in utilizing naked puts is that it is easier to take a (partial) prot if one desires. Thwould normally happen with the stock well above the striking price and with a few days to a few weekremaining before expiration. At that time, the put is (deeply) out of the money and will generally btrading actively, with a fairly tight market. In a covered call write, however, the call would be deepin-the-money.
Such calls have wide markets and virtually no trading volume. Hence, it might be easy to buy baca written put for a nickel or less, to close down a position and eliminate further risk. But at the samtime, it would be almost impossible to remove the deeply in-the-money covered call write for 5 or 1cents over parity.
The same thinking applies to establishing the position, which we normally do with the stock we
above the striking price of the written option. In such cases, the call is in-the-money – often fairdeeply – while the put is out-of-the-money. Thus the put market is often tighter and more liquand might more easily be “middled” (i.e., traded between the bid and ask). Again, this potentiaimproves returns. The above facts regarding naked put writing are generally known to most investorHowever, many are writing in IRA or other retirement accounts, or they just feel more comfortabowning stock, and so they have been doing traditional covered call writing – buying stock and sellincalls against it.

8/15/2019 Ultimate Guide eBook
http://slidepdf.com/reader/full/ultimate-guide-ebook 107/218
ultimate guide to trading and investment
10
But it isn’t necessary, and it certainly isn’t ecient, to do so. A cash-based account (retiremeaccount or merely a cash account) can write naked puts, as long as one has enough cash in thaccount to allow for potential assignment of the written put. Simply stated, one must have casequal to the striking price times the number of puts sold (times $100, of course). Technically, the pu
premium can be applied against that requirement.
Most brokerage rms do allow cash-based naked put writing, however, some may not. Some rmmay require that you obtain “level 2" option approval before doing so, but that is usually a simplmatter of lling out some paperwork. If your brokerage does not allow cash-based putselling, yocan always move the account to one that does, like Interactive Brokers. Once you write a naked puin a cash account, your broker will “set aside” the appropriate amount of cash. You can’t withdrathat cash or use it to buy other securities – even money market funds.
Most put sellers operate in a margin account, however, using some leverage (if they wish). One othe advantages of writing naked puts on margin is that the writer can gain a fair amount of leveragand thus increase returns if he feels comfortable with the risk (as a result, we have long held tha
naked put writing on margin makes covered call writing on margin obsolete). That is not the caswith cash-based naked put writing, though. The returns are more in line with traditional covered cawriting.
In summary, put writing is our strategy of choice over covered call writing in most cases – whethecash-based or on margin. Later, when we discuss index put selling, you will see that there are evegreater advantages to put writing on margin.
Put-Selling Can Outperform the Market
The Chicago Board Option Exchange (CBOE) has created certain benchmark indices so that investor
can compare covered call writing ($BXM), naked put selling ($PUT), and the performance of the S&500 Index ($SPX). Figure 3 compares these indices, with all three aligned on June 1, 1988.
FIGURE 2

8/15/2019 Ultimate Guide eBook
http://slidepdf.com/reader/full/ultimate-guide-ebook 108/218
ultimate guide to trading and investment
10
It is clear from the Figure 2 that naked put writing ($PUT) is the superior performer of these benchmaindices. For this reason, naked put writing is the preferred option-writing strategy that we emploin our newsletter services. Since covered call writing is equivalent to naked put selling – and sincFigure 2 merely shows dollars of prot, not returns – you might think that the covered call writin
graph and the naked put writing graph would be quite similar.
But there is something more to index put writing – especially writing puts on the S&P 500 inde($SPX or SPY, or even e-mini S&P futures): out-of-the-money puts are far more expensive than ouof-the-money calls.
This is called a “volatility skew,” and it has been in eect since the Crash of ‘87. Institutional pbuyers want to own $SPX (and related) puts for portfolio protection, and they don’t seem to carethey constantly pay too much for them. Conversely, other large institutions may be selling coverecalls as protection, thereby depressing the prices of those calls. Some institutions do both – buy thputs and sell the calls (a collar). Thus, the main reason that $PUT outperforms $BXM by so mucin Figure 3 is that the out-of-the-money puts being sold are far more expensive (in terms of implie
volatility) than are any out-of-the-money calls being sold.
We recommend put ratio spreads and weekly option sales in The Daily Strategist newsletter as way to take advantage of this. Moreover, we have put together a complete strategy – called VolatilCapture – that we use in our managed accounts.
In the Volatility Capture Strategy, we blend all aspects together to produce a reduced volatility strategthat can make money in all markets (although it will not keep pace on the upside in a roaring bumarket). The primary focus of the strategy is selling $SPX puts, but there are two forms of protectioin place as well. McMillan Analysis Corp. is registered as both a Registered Investment Advis(RIA) and as a Commodity Trading Advisor (CTA), so we are able to oer the strategy to both nonretirement and retirement accounts.
Our complete track record and other pertinent details are available by request. For preliminainformation and a summary of our track record, visit our money management web site: httpwww.mcmillanasset.com. For more specic information, email us at the following address: [email protected], or call us at 800-768-1541.
Positions Can Be Hedged
One of the main arguments against put-selling is that the draw-downs can be large in severe markdownturns. One way to mitigate these draw-downs would be to hedge the entire put-sale portfoliFor example, one may attempt to oset the market risk that is inherent to option writing by continua
hedging with long positions in dynamic volatility-based call options as we do in our managed account
This is really a topic for another article, but the gist of this protection is to buy out-of-the-money $Vone-month calls and roll them over monthly. Buying longer-term $VIX calls does not work, for onthe front-month contracts come anywhere close to simulating movements in $VIX (and in $SPX).

8/15/2019 Ultimate Guide eBook
http://slidepdf.com/reader/full/ultimate-guide-ebook 109/218
ultimate guide to trading and investment
10
The Odds Can Be in Your Favor
As evidenced by the $PUT Index, nakedput-writing is a conservative strategy that has the potentiato out-perform the broad market over time. When implemented correctly, the strategy can have hig
rates of success and can also be hedged against large stock market-drawdowns. For example, ThDaily Strategist and Option Strategist Newsletters have produced a combined 89.4% and 85.6%winners in their index and equity naked put-selling/covered-writing trades since the newsletter starterecommending them in May of 2007 and April of 2004 respectively. Investors looking for put-sellingtrading ideas and recommendations on a daily or weekly basis may be interested in subscribing tone of those services.
Trading Outside Normal Hours
Naked put-selling is an especially attractive strategy for do-it-yourself investors who do not have timin their day to watch the markets since positions do not need to be monitored closely all day. Putwriters can sit easy so long as the underlying stock remains above the strike price of the option sold
If the stock is above the strike price at expiration, the option simply expires. The option-seller thenrealizes the initial credit and no closing action needs to be taken. If the position needs to be exitedearly, usually due to the fact that the stock has dropped below the strike price of the short option, thposition can be closed out automatically via a contingent stop loss order.
You cannot trade options outside of standard stock market hours; however, depending on youbrokerage, you may be able to place your opening limit order outside the stock market hours. In thicase, your order would simply be placed in a queue for processing once the market opened. If youbroker doesn’t allow you to place an orderk outside market hours, you would only need a couple ominutes during the day to either call your broker or hop on your trading software to place your trade
Another big benet to naked put-selling is that it doesn’t take much analysis to nd good potentia
trading candidates. In fact, as we do for our newsletters, all of the initial analysis can be done at nighwith computer scans and a little bit of discretion. The following section will discuss our approach tnding naked put-sale candidates for our newsletters each night.
Choosing What Put To Sell
For the most part, we choose our put-selling positions for our various publications based on datthat is available on The Strategy Zone, a subscriber area of our web site consisting of various datascans and lists of potential trades compiled by our computer analysis. One could do the same soof analysis yourself, as a subscriber to “the Zone.”
On top of that, our Option Workbench provides additional analytical capability for that data.
Our computers do a lot of option theoretical analysis each night – from computer Greeks to analyzinwhich straddles to buy to graphs of put-call ratios. The Zone was started about 10 years ago, wheI decided to make the outputs of our nightly programs available to anyone who was interested ipaying a modest amount of money to view them. These analyses are still the basis for almost all oour recommendations.

8/15/2019 Ultimate Guide eBook
http://slidepdf.com/reader/full/ultimate-guide-ebook 110/218
ultimate guide to trading and investment
1
Expected Return
Expected return is the crux of most of these analyses. For those of you not familiar with the concepI will briey explain it here.
Expected return is a logical way of analyzing diverse strategies, breaking them down to a singuseful number. Expected return encompasses the volatility of the underlying instrument as a majofactor. However, it is only a theoretical number and is not really a projection of how this individutrade will do. Rather, expected return is the return one could expect to make on a particular tradover a large number of trials.
For example, consider a fair die (i.e., one that is not “loaded”). There is an equal, one-sixth chancthat any number will come up on a particular roll of the die. But does that mean if I roll the die stimes, I will get one once, two once, three once, etc.? No, of course not. But if I roll the fair diemillion times I will likely have rolled very nearly 1 million ones, 1 million twos, etc. We are applyinthis same sort of theory to position analysis in the option market.
My Approach
For naked put selling, the rst thing I look at is the le of the highest potential returns. These ardetermined strictly mathematically, using expected return analysis. This list is going to necessarihave a lot of “dangerous” stocks listed as the best covered writes. Typically, these would be biotecstocks or other event-driven small-cap stocks.
Next, I reduce the size of the list. I have a program that screens out a subset of these, limiting the lito stocks in the S&P 500 Index only. Individual investors might have other ways of screening the lis
If returns at the top of the list are “too good to be true,” then one can assume that either 1) the
is a volatile event on the horizon (meaning the lognormal distribution assumption is wrong), or 2the volatility assumption used in the expected return analysis is wrong. Throw out any such itemThese would likely have annualized expected returns in excess of 100% – an unrealistic number foa naked put write.
However, weekly put sales might sometimes be in that range. Those would have to be looked separately. In general, if the underlying stock is going to report earnings during the week in questiothe put sale should probably be avoided.
At this point, I select all the writes with annualized expected returns higher than 24% (my minimureturn for writing puts on margin), and re-rank them by probability of prot. Once that is done, I selethose with a probability of prot of 90% or higher, and re-rank them by annualized expected return.
other words, I am still interested in high returns, but I want ones with plenty of downside protectionThis screening process knocks out most of the list, usually as much as 90% of the initial put writincandidates.
From there the analysis calls for some research, for at this point it is necessary to look at the individustocks and options to see if there is something unusual or especially risky taking place. Some stockseem to be on the list perennially – Sears (SHLD), for example, perennially has expensive optiondue to its penchant for drastic moves.

8/15/2019 Ultimate Guide eBook
http://slidepdf.com/reader/full/ultimate-guide-ebook 111/218
ultimate guide to trading and investment
1
Another useful piece of information is the Percentile of Implied Volatility. That is listed in the dataand if it is low (below the 50th percentile), then I will likely not write that particular put. Recall thaexpected return needs a volatility estimate – and for these naked put writes we use the currencomposite implied volatility. However, if there is the possibility that volatility could increase a lot (i.e
if the current composite implied volatility is in a fairly low percentile), then there is a danger that actustock movements could be much more volatile than we have projected. Hence, that is not a nakeput that I would want to write.
I also look at the absolute price of the option. I realize that is taken into account in the expectereturn analysis, but I personally do not like writing naked options selling for only 20 cents or sounless it’s on a very low-priced stock. The expiration date of the option is important to me as weI would prefer to write one- or two-month options, because there is less time for something to gwrong. Occasionally, if there is a special situation that I feel is overblown on the downside, I will loointo writing longer-term options but that is fairly rare.
These further restrictions reduce the number of writing candidates down to a fairly manageabl
level. At this point, it is necessary to look at the individual charts of the stocks themselves. Itnot that I am trying to predict the stock price; I really don’t care what it does as long as it doesnplunge. Consequently, I would not be interested in writing a put on a stock, if that stock is in a steedowntrend. More likely, the chart can show where any previous declines have bottomed. I wouprefer to see a support level on the chart, at a price higher than the striking price that I am considerinwriting. This last criterion knocks out a lot of the remaining candidates.
Some may say that the stock chart is irrelevant, if the statistical and other criteria are met. Thatprobably true, but if I have my choice of one that has chart support above the strike and one thadoesn’t, I am going with the one that does every time.
The potential put selling candidates that remain at this point are generally few, and are the bes
writing candidates. But I will always check the news regarding any potential write, just to see there is something that I should know. By “news,” I mean earnings dates, any potential FDA hearindates, ongoing lawsuits, etc. You can easily get a lot of this information by looking up the companon Yahoo Finance or other free nancial news sites.
The reason that this news check is necessary is that these puts are statistically expensive for somreason. I’d like to know what that reason is, if possible. The previous screens will probably havweeded out any FDA hearing candidates, for their puts are so dramatically expensive that they wouhave alarm-raising, overly high expected returns.
But what about earnings? Studies show that the options on most stocks increase in implied volatilitright before the earnings. In general this increase is modest – a 10% rise in implieds, or so. Bu
sometimes the rise is much more dramatic. Those more dramatic situations often show up ovolatility skew lists and are used as dual calendar spreads in earnings-driven strategies. But as faas naked put writing goes, if the expected return on the put is extraordinary, then that is a warninag. If a position meets all of these criteria, we ocially consider it acceptable to establish and marecommend it in a newsletter.

8/15/2019 Ultimate Guide eBook
http://slidepdf.com/reader/full/ultimate-guide-ebook 112/218
ultimate guide to trading and investment
1
I realize that many put sellers (or covered call writers) use a dierent method: they pick a stock the“like” rst, and then try to nd an option to write. By this “fundamental” approach, one is probabwriting an option that has a very low expected return – a la the calls on almost every “dividend stocin the current market. They compensate for this by writing the call out of the money, so that they w
have some prot if the stock rises and gets called away.
To me, that is completely the wrong way to go about it. If you like the stock, why not buy it and bua put, so you have upside prot potential? What is the obsession with writing a covered call? Raththan that “fundamental” or “gut” approach, the use of expected return as a guide to the positiomakes this a “total return” proposition – where we are not overly concerned with (upward) stocmovement, but rather more concerned with the combination of option premium, stock volatility, ratof return, and probability of winning. To me, that is the correct approach.
Selecting Naked Put Writes From OWB
Option workbench makes nding actionable naked put-sale trades that t all of the criteria in maforementioned approach quite easy. Once you are logged into the software, one would rst accesthe “broad” scan of potential candidates by hovering over “Spread Proles” and clicking on NakePuts.
A list of all the naked put writes that have annualized expected returns of greater than 4% will bshown (that 4% threshold would move higher if T-Bills ever yield anything besides 0%!). Using thclosing data from June 17, 2015, there were 14,449 such put writes! Obviously, one has to cut thlist down to a more workable size.
There are a lot of 32 column headings here, and most are statistical in nature. To me, the two moimportant pieces of data are 1) annualized expected return, and 2) downside protection (in term
of probability – not percent of stock price). Both of these are volatility-related, and that is what important in choosing put writes. You want to ensure that you are being compensated adequatefor the volatility of the stock.
If you click on “A Exp Rtn” (which is Annualized Expected Return), the list quickly sorts by that datHowever, in my opinion, it is not a good idea to just sell the put with the highest expected return. Thcomputer calculations make certain assumptions that might not reect the real world.
For example, if there is a large possibility that the stock might gap downwards (an upcoming earningreport, for example), the puts will appear to be overly expensive. Any sort of upcoming news thmight cause the stock to gap will raise the price of the puts. You probably don’t want to write sucputs, even though the computer may “think” they are the best writes to establish.
In order to overcome these frailties, one would use the “Filter Editor” function of OWB. You caconstruct a lter to include or exclude writes that do/don’t meet your individual criteria.

8/15/2019 Ultimate Guide eBook
http://slidepdf.com/reader/full/ultimate-guide-ebook 113/218
ultimate guide to trading and investment
1
Figure 3
If you click on the button (above the data) that says “Prole Filter Editor,” a box will appear. Figur3 shows the box as it appears in my version of OWB. On the left are three lter names: DTO
Noearnings, DTOS w/ earnings, and TOS No Earnings (mine). In the center of Figure 3, the actuaformulae for the lter “TOS No Earnings" are shown.
To apply the formulae, merely click the “Apply” button (lower right of Figure 3). In this case, the lisof 14,449 potential naked put writes shrinks to 64 candidates!
Here are the formulae that appear in Figure 3:
and( InList('S&P 500'), days > 2, days <= 90, aexprtn >= 24%, PrDB>= 90%, PutPrice >=0.25, expdate < nextearnings )
InList (‘S&P 500'): include only stocks that are in the $SPX Index. This way, we are not dealing wit
extremely small stocks that can easily gap by huge amounts on corporate news.
Days>2, days <= 90: include only writes whose expiration date is between 2 and 89 days hence.
Aexprtn >= 24%: only include writes whose annualized expected return is at least 24%
PrDBE >= 90%: only consider stocks that have less than a 10% chance of being below the downsidbreakeven (DBE) point at expiration.
PutPrice >= 0.25: only consider puts that are selling for at least 0.25.
expdate < nextearnings: only consider put sales on stocks that are not going to report earning
while the put sale is in place. Stocks are far too volatile on earnings announcements, and this wavoid the main cause of downside gaps: poor earnings.

8/15/2019 Ultimate Guide eBook
http://slidepdf.com/reader/full/ultimate-guide-ebook 114/218
ultimate guide to trading and investment
1
These criteria produce a strong list of put writing candidates. There will be no earnings announcemento cause downside gaps. There is a 90% chance of making money. Over time, writes such as thesshould produce returns in line with the expected returns – greater than 24%, using this formula.Yocan add many other lters (or delete some of these if you wish). It is easy to do within OWB, and
encourage you to experiment with it.
Once the list has been ltered, there is still work to do. Why are these remaining puts so expensiveOne might have to look at the news for certain stocks to see why. At the current time, health castocks have very expensive options: ET, HUM, THC, for example. Not only are these inated becausof takeover rumors, there is also supposedly some Medicare-related pricing edicts coming soon frothe U.S. Government. Those things could cause downside volatility; however, one may feel there enough downside protection to warrant selling the puts. If that were the case, you would have founyour trade!
Placing Your Trade
After you have found your trade the next step would be to determine how many puts to sell. Generalfor a margin account, most brokerages have a margin requirement of 25% of the strike-price of thshort put you are selling less the premium received for the sale of the put less the out-of-the-moneamount, subject to a 10% minimum. We generally write out-of-the-money puts and set aside enougmargin so that the stock has room to fall to the striking price – the level where we generally would bclosing the position out. This conservative approach decreases the risk of a margin call if the stocmoves against your position.
For example, if you sell a naked put with a strike price of 50 for a credit of 1.00, the margin we wouset aside would be $1,150. The formula below illustrates this:
Strike Price (50) x 25% (0.25) x Shares per Option (100) – Premium Received (100) = Marg
Requirement ($1,150)
For cash accounts, one would have to set aside 100% of the strike price less the put premium. Sofor the prior example, the cash collateral would be $4,900 (50 x 100 – 100).
We generally suggest that one puts no more than 5% of their total portfolio value in any particulaput-sale for margin accounts, and 10% for cash accounts. If you had a $100,000 margin account, yowould want to allocate no more than $5,000 to any particular put sale. Using the prior example, yowould then sell 4 naked puts ($5,000 / $1,150 = 4.35). Cash based accounts would sell 2 contrac(($100,000 x 0.10) / $4,900 = 2.04).
The next step would be determine your stop. Generally, we like to set our stops at the downsid
break-even level at expiration. This level can easily be calculated with the following formula:
Strike Price – Put Premium = Downside Break-Even Level
However, if you cannot watch your position throughout the day, it may make sense to set youintraday stop at the strike price. This means that if the stock trades below the strike price you arshort, the position would be automatically closed. That way, there would be no risk of assignment the stock were below your strike at expiration.

8/15/2019 Ultimate Guide eBook
http://slidepdf.com/reader/full/ultimate-guide-ebook 115/218
ultimate guide to trading and investment
1
Now that you have determined your quantity and stop, the nal steps would be to enter your orde(before the open with your brokerage’s order queue if possible), set your stop (via a contingent stoorder if your brokerage allows) and monitor. Those who cannot generally participate during normamarket hours and whose brokerages don’t allow order queuing and contingent stops, would onl
need a few minutes to initially place the trade. Furthermore, they would only have to monitor thtrade near the market close each day to see if the stock is below their stop. If it were, one woulsimply buy back the put to close the position.
THE MOVIE
Do-It-Yourself with Option Workbench
Those looking to analyze potential naked put-writes themselves, can do so with ease with our OptioWorkBench (OWB) software. This is the overlay service to our Strategy Zone, and it provides thability to sort the reports in various ways. More importantly, it allows one to construct his owanalysis formulae. For information on the various features and capabilities of OWB
WATCH THIS VIDEO HERE!
THE SPECIAL OFFER
Find naked put-sale candidates on your own with a free 30-day trial to Option Workbench. Feel freto use my lter or create one of your own! Scroll to the bottom and select the one month subscriptio($135) and enter the Coupon Code FREEOWB at checkout. No credit card is required. Subscriptiowill not automatically renew upon completion.
FOR MORE INFORMATION AND TO SUBSCRIBE, CLICK HERE!
ABOUT THE AUTHOR
Lawrence G. McMillan is the President of McMillan Asset Management anMcMillan Analysis Corporation, which he founded in 1991. He is perhaps mowell-known as the author of Options As a Strategic Investment, the best-sellinwork on stock and index options strategies. The book – initially publishein 1980 – is currently in its fth edition and is a staple on the desks of manprofessional option traders. His career has taken two simultaneous paths – onas a professional trader and money manager, and the other as an educator an
proponent of using option strategies.
In these capacities, he currently authors and publishes "The Option Strategist," a derivative productnewsletter covering options and futures, now in its 24th year of publication. His rm also edits anpublishes three daily newsletters, as well as option letters for Dow Jones. He has spoken on optiostrategies at many seminars and colloquia, and also occasionally writes for and is quoted in nancipublications regarding option trading. Mr. McMillan is the recipient of the prestigious Sullivan Awarfor 2011, awarded by the Options Industry Council in recognition of his contributions to the OptionIndustry.

8/15/2019 Ultimate Guide eBook
http://slidepdf.com/reader/full/ultimate-guide-ebook 116/218
ultimate guide to trading and investment
1
For those not familiar with the straddle strategy, it is a neutral strategy in options trading that involvethe simultaneous buying of a put and a call on the same underlying, strike and expiration. The tradhas a limited risk (which is the debit paid for the trade) and unlimited prot potential. If you budierent strikes, the trade is called a strangle.
You execute a straddle trade by simultaneously buying the call and the put. You can leg in by buyincalls and puts separately, but it will expose you to directional risk. For example, if both calls and puare worth $5, you can buy a straddle for $10. If you buy the call rst, you become bullish - if the stocmoves down, the calls you own will decrease in value, but the puts will be more expensive to buy.
The Options Guide explains straddle:
Long straddle options are unlimited prot, limited risk options trading strategies that are used whethe options trader thinks that the underlying securities will experience signicant volatility in the neterm.
Maximum loss for long straddles occurs when the underlying stock price on expiration date is tradinat the strike price of the options bought. At this price, both options expire worthless and the optiontrader loses the entire initial debit taken to enter the trade.
INVESTOPEDIA explains straddle:
Straddles are a good strategy to pursue if an investor believes that a stock's price will movsignicantly, but is unsure as to which direction. The stock price must move signicantly if thinvestor is to make a prot. Should only a small movement in price occur in either directiothe investor will experience a loss. As a result, a straddle is extremely risky to perform Additionally, on stocks that are expected to jump, the market tends to price options at a highpremium, which ultimately reduces the expected payo should the stock move signicantl
TRADING EARNINGS STRADDLESBy Kim Klaiman, Steady Options

8/15/2019 Ultimate Guide eBook
http://slidepdf.com/reader/full/ultimate-guide-ebook 117/218
ultimate guide to trading and investment
1
Example
With AAPL currently trading at $130.28, you could buy AAPL straddle by buying 130 put and 130 calThis is what the P/L chart would look like:
How straddles make or lose money
A straddle is a vega positive, gamma positive and theta negative trade.
That means that all other factors equal, the straddle will lose money every day due to the timedecay, and the loss will accelerate as we get closer to expiration. For the straddle to make money,one of two things (or both) has to happen:
1. The stock has to move (no matter which direction).
2. The IV (Implied Volatility) has to increase.
A straddle works based on the premise that both call and put options have unlimited prot potentiabut limited loss. While one leg of the straddle loses up to its limit, the other leg continues to gain aslong as the underlying stock rises, resulting in an overall prot.

8/15/2019 Ultimate Guide eBook
http://slidepdf.com/reader/full/ultimate-guide-ebook 118/218

8/15/2019 Ultimate Guide eBook
http://slidepdf.com/reader/full/ultimate-guide-ebook 119/218
ultimate guide to trading and investment
1
3. Which strikes to buy? If you go far OTM (Out of The Money), you get big gains if the stocmoves before earnings. But if the stock doesn’t move, closer to the money strikes might bea better choice.
Under normal conditions, a straddle or a strangle trade requires a big and quick move in the underlyingIf the move doesn’t happen, the negative theta will kill the trade. In case of the pre-earnings stranglethe negative theta is neutralized, at least partially, by increasing IV.
In some cases, the theta is larger than the IV increase and the trade is a loser. However, the lossein most cases are relatively small. Typical loss is around 7-10%; in some rare cases it might reach20-25%. But the winners far outpace the losers and the strategy is overall protable.
Market environment also plays a role in the strategy performance. The strategy performs the best ia volatile environment when stocks move a lot. If none of the stocks move, most of the trades woul
be around breakeven or small winners. Fortunately, over time, stocks do move. In fact, a big chunof the gains come from stock movement and not IV increases. The IV increase just helps the tradnot to lose in case the stock doesn’t move.
Would you like to rent your options for free?
I would like to explain the "underneath" of this strategy. Let's take a step back. When someone starttrading options, the rst and most simple strategy is just buying calls (if you are bullish) or puts (if yoare bearish). However, when doing that, you must be right three times: on the direction of the movethe size of the move and the timing. Be wrong just in one of them - and you lose money. You will alsnd out very quickly that options are a wasting asset. They lose value every day. If the stock doesnmove, the option is losing value. If it moves but not fast enough, it is losing value as well. It is calle
a negative theta. You can read more about the options Greeks here.
Another factor having a great impact on options value is IV (Implied Volatility). Rising IV will increasthe option value, falling IV will decrease it. For volatile stocks, IV usually becomes extremely inateas the earnings approach and collapses just after the announcement. This is why if you buy calls oputs before earnings and hold them through the announcement, you might still lose money even the stock moves in the right direction.
Having said that, I would like to achieve the following three goals when trading options:
1. Not to bet on the direction of the stock.
2. To minimize the eect of the time decay.
3. To take advantage of the rising IV.
The strategy of buying a strangle (or a straddle) before earnings ts all three parameters. First of alsince I'm buying both calls and puts, I'm not betting on the direction of the stock.

8/15/2019 Ultimate Guide eBook
http://slidepdf.com/reader/full/ultimate-guide-ebook 120/218
ultimate guide to trading and investment
12
Second, I'm holding for a very short period of time, so the impact of the time decay is minimal.
Third, since I'm buying a few days before earnings, the IV in most cases will rise into earningsHowever, I will be selling just before the announcement, so the options will not suer from the I
collapse.
Now, few scenarios are possible.
1. The IV increase is not enough to oset the negative theta and the stock doesn't move. In thcase the trade will probably be a small loser. However, since the theta will be at least partialoset by the rising IV, the loss is likely to be in the 7-10% range. It is very unlikely to lose mothan 10-15% on those trades if held 2-5 days.
2. The IV increase osets the negative theta and the stock doesn't move. In this case, dependinon the size of the IV increase, the gains are likely to be in the 5-20% range. In some rarcases, the IV increase will be dramatic enough to produce 30-40% gains. For example, AAP
strangle could be purchased on Friday before October 2011 earnings and sold the followinMonday for 32% gain.
3. The IV goes up followed by the stock movement. This is where the strategy really shines.could bring few very signicant winners. For example, when Google moved 7% in the rfew day of July 2011, a strangle produced a 178% gain. In the same cycle, Apple's 3% movwas enough to produce a 102% gain. In August 2011 when VIX jumped from 20 to 45 in few days, I had the Disney DIS strangle and few other trades doubled in a matter of two day
This is why I call those trades "renting a strangle/straddle for free" (or almost free). Even under thmost unfavorable conditions, your loss is usually limited to 7-10%. But if you get a decent IV increasand/or a stock movement, the gains could be much higher.
Another big advantage of this strategy is the fact that it is not exposed to the gaps in the stock price- in fact, it benets from them. So you cannot suddenly nd yourself down 30-50%. You can alwaycontrol the losses and limit them.
Selection of strikes and expiration
I would like to start the trade as delta neutral as possible. That usually happens when the stoctrades close to the strike. If the stock starts to move from the strike, I will usually roll the trade to stadelta neutral. To be clear, rolling is not critical - it just helps us to stay delta neutral. In case you dnot roll and the stock continues moving in the same direction, you can actually have higher gains. Bif the stock reverses, you will be in a better position if you rolled.
I usually select expiration at least two weeks from the earnings, to reduce the negative theta. Thfurther the expiration, the more conservative the trade is. Going with closer expiration increases bothe risk (negative theta) and the reward (positive gamma).
If you expect the stock to move, going with closer expiration might be a better trade. Higher positivgamma means higher gains if the stock moves. But if it doesn't, you will need bigger IV spike to osthe negative theta. In a low IV environment, further expiration tends to produce better results.

8/15/2019 Ultimate Guide eBook
http://slidepdf.com/reader/full/ultimate-guide-ebook 121/218
ultimate guide to trading and investment
12
My typical prot target on straddles is 10-15%. I might increase it in more volatile markets. I usuall
don't set a stop loss on a straddle. The reason is that the upcoming earnings will usually set a oounder the price of the straddle. Typically those trades don't lose more than 5-10%. I believe oubiggest loss on a straddle was around 25%, and only a handful of them have lost more than 20%since inception.
The biggest risk of those trades is pre-announcement. If a company pre-announces earnings beforthe planned date, the IV of the options will collapse and the straddle can be a big loser. However, preannouncement usually means that the results will be not as expected, which in most cases causethe stock to move. So most of the time, the loss will not be too high, especially if there is still morthan two weeks to expiration. But this is a risk that needs to be considered. As a rule, I will alwayclose those trades before earnings.
Why I don't hold through earnings
Some people would argue that selling before earnings is premature. Why not tohold through earninghoping for a big move?
The problem is you are not the only one knowing that earnings are coming. Everyone knows thathose stocks move a lot after earnings, and everyone bids those options. Following the laws of suppand demand, those options become very expensive before earnings. The IV (Implied Volatility) jumpto the roof. The next day the IV crashes to the normal levels and the options trade much cheaper.
For example, holding straddles on stocks like AMZN or NFLX could be very protable during somof the last cycles. However, we have to remember that those stocks experienced much larger move
than their average move in the last few cycles. Chances are this is not going to happen every cycleThere is no reliable way to predict those events. The big question is the long term expectancy of thstrategy. It is very important to understand that for the strategy to make money it is not enough for thstock to move. It has to move more than the markets expect. In some cases, even a 15-20% movmight not be enough to generate a prot.
Some people might argue that if the trade is not protable the same day, you can continue holdinor selling only the winning side till the stock moves in the right direction. It can work under certaiconditions. For example, if you followed the specic stock in the last few cycles and noticed sompatterns, such as the stock continuously moving in the same direction for a few days after beating thestimates. Another example is holding the calls when the general market is in uptrend (or downtrenfor the puts). However, it has nothing to do with the original strategy. From the minute you decid
to hold that trade, you are no longer using the original strategy. If the stock didn’t move enougto generate a prot, you must be ready to make a judgment call by selling one side and taking directional bet. This might work for some people, but the pure performance of the strategy can bmeasured only by looking at a one day change of the strangle or the straddle (buying a day beforearnings, selling the next day).
Prot Target and Stop Loss

8/15/2019 Ultimate Guide eBook
http://slidepdf.com/reader/full/ultimate-guide-ebook 122/218
ultimate guide to trading and investment
12
The bottom line:
Over time the options tend to overprice the potential move. Those options experience huge volatilidrop the day after the earnings are announced. In most cases, this drop erases most of the gain
even if the stock had a substantial move.
Je Augen, a successful options trader and author of six books, agrees:
“There are many examples of extraordinary large earnings-related price spikes that are not reectein pre-announcement prices. Unfortunately, there is no reliable method for predicting such an evenThe opposite case is much more common – pre-earnings option prices tend to exaggerate the risby anticipating the largest possible spike.”
It doesn’t necessarily mean that the strategy cannot work and produce great results. However, most cases, you should be prepared to hold beyond the earnings day, in which case the performancwill be impacted by many other factors, such as your trading skills, general market conditions, etc.
Test Case #1
On July 28, 2014 we purchased EXPE 80 straddle expiring in 18 days. We paid $8.45 for the tradThe IV of the options was around 59%.
Two days later, the IV of the options jumped to 73% and we sold the straddle at $9.85, for 16.6%gain. An hour later, IV reached 80%, and the straddle could be sold for 26% gain. The stock itsemoved less than 1%.

8/15/2019 Ultimate Guide eBook
http://slidepdf.com/reader/full/ultimate-guide-ebook 123/218
ultimate guide to trading and investment
12
Test Case #2
On June 24, 2014, we purchased MSFT $42 straddle expiring in August. We were able to roll thstraddle twice, and nally closed it on July 17 for 35.4% gain. In this case, most of the gains cam
from the stock movement.
CONCLUSION
Buying a straddle or a strangle few days before earnings can be a very protable strategy if useproperly. Of course, the devil is in the details. There are many moving parts to this strategy:
1. When to enter?
2. Which stocks to use?
3. How to manage the posion?
4. When to take prots?
And much more. But overall, this strategy has been working very well for us.

8/15/2019 Ultimate Guide eBook
http://slidepdf.com/reader/full/ultimate-guide-ebook 124/218
ultimate guide to trading and investment
12
Here is an example how this strategy performed during the August 2011 crisis:
THE SPECIAL OFFER
If you want to learn how to use the straddle strategy ,and many other protable strategies,
SUBSCRIBE FOR ONE OF THE STEADY OPTIONS STRATEGIES, CLICK HERE!
CLICK HERE TO SEE Steady Options’ full performance!
ABOUT THE AUTHOR
Kim Klaiman is a full time options trader. He is a founder of wwwSteadyOptions.com - options education and trade ideas, earnings tradeand non-directional options strategies. Kim has been trading stocks anoptions for more than 10 years. He likes to trade variety of non-directiontrades with low correlation to limit the total portfolio risk. Kim wrote ov100 articles for Seeking Alpha. He started the SteadyOptions educationforum after numerous requests from his Seeking Alpha readers, to sha
his experience and trading ideas. Kim holds a BSc degree in ComputeScience. He lives in Toronto, Canada.
SteadyOptions.com is a combination of a high quality education and actionable trade ideas. Oustyle is non-directional trading. We aim for steady and consistent gains with a high winning ratand limited risk. Our focus is on trading Earnings-Associated Implied Volatility rise, Iron CondorCalendar spreads, etc. Our performance is based on real lls, not hypothetical performance. Wprovide a full trading plan with complete portfolio approach.

8/15/2019 Ultimate Guide eBook
http://slidepdf.com/reader/full/ultimate-guide-ebook 125/218
ultimate guide to trading and investment
12

8/15/2019 Ultimate Guide eBook
http://slidepdf.com/reader/full/ultimate-guide-ebook 126/218
ultimate guide to trading and investment
12
NADEX®

8/15/2019 Ultimate Guide eBook
http://slidepdf.com/reader/full/ultimate-guide-ebook 127/218
ultimate guide to trading and investment
12
If you trade Stocks, Options, Futures or Forex, every decision starts with your opinion about thdirection of the market you are trading. Is the market on an uptrend, downtrend, or is it tradinsideways? Once you have determined the direction of the market, then you must decide whictrading strategy gives you the best edge.
Is it a trend-following strategy, or is it a scalping/fading strategy for a sideways-moving market
Finally, how do you manage your trade to minimize your risk and maximize your gains? What are thbest entry opportunities? Where do you place your stops and take prot targets?
Trading involves risk, which needs to be carefully managed. If you trade heavily leveraged instrumentlike futures or forex, it is possible to lose substantially more than your initial investment. On Januar15, 2015 the Swiss Franc “ash crash” blew through stops and caused many Forex brokers antraders to incur huge losses. Sudden market moves routinely stop-out trades, which can be a sourcof frustration for many.
If you want the certainty of trading in an environment where your maximum risk and reward arknown in advance, then Nadex binary options and Nadex spreads may be the instrument that is besuited to your trading personality.
What is Nadex?
Nadex is the North American Derivatives Exchange. Based in Chicago, Nadex is a wholly-ownesubsidiary of the IG Group, an international trading company that is headquartered in London anlisted on the FTSE 250 exchange. Here are a few other facts about Nadex:
• Nadex is a US federally regulated exchange – Nadex is subject to strict oversight anregulation by the U.S. Commodity Futures Trading Commission (CFTC).
• All member funds are held in a segregated bank account with a major bankininstitution.
• No Broker Needed – When you place a trade with Nadex, your order is placed directly on thexchange and not through a broker.
• Full transparency on every trade – Nadex does not take positions on any trades, so thehave no vested interest in whether your trade wins or loses. Nadex receives revenues fromcharging a small $.90 cent execution fee and a $.90 cent settlement fee per contract tradedNadex employees are not allowed to trade Nadex.
Getting Started with Nadex® Binary OptionsBy Cam White, TradingPub

8/15/2019 Ultimate Guide eBook
http://slidepdf.com/reader/full/ultimate-guide-ebook 128/218

8/15/2019 Ultimate Guide eBook
http://slidepdf.com/reader/full/ultimate-guide-ebook 129/218
ultimate guide to trading and investment
12
Nadex does not take positions in any of the assets being traded, so you are never trading against th“house.” Rather, Nadex facilitates transactions between your opinion on a proposition, and anothetrader who takes an opposing opinion on the same proposition.
Placing trades on Nadex can be easily broken down into a few simple steps:1. Everything starts with your opinion on the direction of a market. Is it on an uptrend, on a
downtrend, or is it trading sideways?
2. Choose the asset you want to trade:
a. Major Stock Indices (S&P 500, NASDAQ, FTSE, DAX, etc.)
b. Commodities (Crude Oil, Gold, Silver, Natural Gas, Soybeans, etc.)
c. Forex Pairs (GBP/USD, EUR/USD, GBP/JPY, USD/CHF, etc.)
d. Bitcoin and News Events
3. Select your contract expiration timeframe, depending on your trading personality:
a. Weekly Expiration (close of Market on Friday)
b. Daily Expiration (close of Market daily)
c. Intraday Hourly Expiration
d. 20-minute Binary Options (US Indices Only)
e. 5-minute Binary Options (Selected Currency Pairs)
4. Select a Nadex Strike Price, and determine if you are going to BUY or SELL.
a. How many contracts do you plan to trade?
b. What is the price you are willing to pay for each contract?
c. Once you have made your decision, place your order directly on the exchange.
5. Once your trade is accepted, you have two options to manage your trade:
a. Let the trade run until expiration and collect your maximum prot or lose yourmaximum risk.
b. Or you can choose to exit your trade early and lock in prots or minimize losses.

8/15/2019 Ultimate Guide eBook
http://slidepdf.com/reader/full/ultimate-guide-ebook 130/218

8/15/2019 Ultimate Guide eBook
http://slidepdf.com/reader/full/ultimate-guide-ebook 131/218
ultimate guide to trading and investment
13
At a glance, the Order Ticket gives you everything you need to know about this contract. Summingit all up, here’s how you place an order with Nadex:
• Make a decision about the probable direction of a market
• Select the expiration time you want
• Select a Nadex strike price
• Are you BUYING or SELLING this proposition?
• How many contracts?
• At what price?
Let’s take a look at an example of a Nadex trade on the Germany 30 (DAX) Index:
In this example using the Germany 30 (DAX) Index, we are looking at a trading period starting at 7amEST, and expiring at 9am EST.
The market had been on a downtrend going into the 7:00am hour, where a reversal started to occu At 7:25am, the market was at 10734. Where would the market be at the 9:00am expiration?
With 1 ½ hours left in the trade, Nadex oered three nearby strike prices to choose from on the strikprice ladder on the right side of the chart:
• At the Money Trade (<10734) – For this statement to be “TRUE” the market would have
to expire ABOVE 10734 at the 9:00am expiration. The statement is “FALSE” if the marketexpires at or below 10734. Since the market is currently at 10734, buyers and sellers forthis statement are almost evenly split.
o If you place a BUY order on this proposition, then you will incur a $54.50 maximumrisk, in order to make a $45.50 maximum reward.

8/15/2019 Ultimate Guide eBook
http://slidepdf.com/reader/full/ultimate-guide-ebook 132/218
ultimate guide to trading and investment
13
Nadex deducts $54.50 from your account, plus a $.90 cent execution fee.If the market expires above 10734 at 9:00am, you receive a $100 payout, less a$.90 settlement fee. If the market expires at or below 10734 at 9:00 am, you receivea $0 payout.
o If you place a SELL order on this proposition, then you will incur a $52.00 maximumrisk, in order to make a $48.00 maximum reward. Nadex deducts $52.00 from youraccount, plus a $.90 cent execution fee.
If the market expires at or below 10734 at 9:00am, you receive a $100 payout, lessa $.90 settlement fee. If the market expires at or below 10734at 9:00am, you receive a $0 payout.
• In the Money Trade (>10714) – If you are a BUYER, this strike price is in the money, since
the current market at 10734 is already signicantly above that strike price of 10714. Sincethe probability of a successful expiration is much greater at this strike price, you are riskinga maximum of $83.50 to make a maximum of $16.50. Nadex deducts $83.50 from youraccount, plus a $.90 cent execution fee.
If the market expires above 10714 at 9:00am, you receive a $100 payout, less a $.90settlement fee. If the market expires at or below 10714 at 9:00am, you receive a $0 payout.The marketplace of buyers and sellers has determined that there’s an 83.5 percent chancethat this trade will expire above 10714.
If you are a SELLER at this strike price, then you are placing an out of the money trade.Since the probability of a successful expiration is much lower at this strike price, you are
risking a maximum of $23.00 to make a maximum of $77.00. Nadex deducts $23.00 fromyour account, plus a $.90 cent execution fee.
If the market expires at or below 10714 at 9:00am, you receive a $100 payout, less a $.90settlement fee.
If the market expires above 10714 at 9:00am, you receive a $0 payout. The marketplace of buyers and sellers has determined that there’s a 23 percent chance thatthis trade will expire at or below 10714.
• Out of the Money Trade (>10754) – If you are a BUYER, this strike price is out of themoney, since the current market at 10734 is already signicantly below that strike price of
10754. Since the probability of a successful expiration is much lower at this strike price, youare risking a maximum of $25.00 to make a maximum of $75.00. Nadex deducts $25.00from your account, plus a $.90 cent execution fee.
If the market expires above 10754 at 9:00am, you receive a $100 payout, less a $.90settlement fee. If the market expires at or below 10754 at 9:00am, you receive a $0 payout.The marketplace of buyers and sellers has determined that there’s a 25 percent chance thatthis trade will expire above 10754.

8/15/2019 Ultimate Guide eBook
http://slidepdf.com/reader/full/ultimate-guide-ebook 133/218
ultimate guide to trading and investment
13
If you are a SELLER at this strike price, then you are placing an in the money trade. Sincethe probability of a successful expiration is much higher at this strike price, you are risking amaximum of $81.50 to make a maximum of $18.50.
Nadex deducts $81.50 from your account, plus a $.90 cent execution fee. If the marketexpires at or below 10754 at 9:00am, you receive a $100 payout, less a $.90 settlementfee. If the market expires above 10754 at 9:00am, you receive a $0 payout.
The marketplace of buyers and sellers has determined that there’s an 81.5 percent chancethat this trade will expire at or below 10754.
Let’s take a look and see how this trade played out:
At 9:00am, the market expired at 10761.567
• If you placed the At the Money “BUY” order at >10734, your trade would have expired ithe money for a $100 payout and a full prot of $45.50, less a $.90 cent settlement fee, pecontract traded. If you had placed “SELL” order at >10734, you would have received $0 aexpiration.
• If you placed the In the Money “BUY” order at >10714, your trade would have expired in thmoney for a $100 payout and full prot of $16.50, less a $.90 cent settlement fee, per contrac
traded. If you had placed “SELL” order at >10714, you would have received $0 at expiration
• If you placed the Out of the Money “BUY” order at >10754, your trade would have expireout the money and you would have received $0. If you had placed “SELL” order at >10754you would have been in the money, for a $100 payout and a full prot of $18.50, less a $.9cent settlement fee, per contract traded.
Depending on your technical analysis, and your risk/reward preferences, there are many ways t

8/15/2019 Ultimate Guide eBook
http://slidepdf.com/reader/full/ultimate-guide-ebook 134/218
ultimate guide to trading and investment
13
trade with Nadex binary options.
Advantages to trading with Nadex:
•
As long as your trade is active, you cannot be “stopped-out.” The only thing that matteis where the price of the market will be at expiration. If you hold your contract until expiratioyour payout will be either $100 or $0 per contract.
• You always know your maximum risk and maximum reward before you place youtrade. There is no way you can lose more than your original investment in a trade. There ano margin calls with Nadex.
• You are making an “Up” or “Down” decision about the market relative to a strike pricWith Nadex, you are not counting pips. If you win by one pip, you win the full prot at expiratioConversely, if you lose by one pip you forfeit the amount of money you risked in the trade.
•
You can trade multiple markets with Nadex:
o Popular Indices
o Commodities
o Forex Pairs
o Bitcoin and News events
•
If your trade expires out of the money for a loss, you are charged an execution fee, byou are not charged a settlement fee.
• Nadex is a regulated exchange.
o Nadex is headquartered in Chicago, and is regulated by the CFTCAll member fundare held in a segregated account
o Nadex does not take positions in any of the instruments they oer for tradin
• You can open a Nadex trading account for as little as $100
o Unlike other trading accounts that can require initial investments of $5,000, $10,000or $25,000, you can get started trading with Nadex for a fraction of the cost of otherinstruments.

8/15/2019 Ultimate Guide eBook
http://slidepdf.com/reader/full/ultimate-guide-ebook 135/218
ultimate guide to trading and investment
13
• No Broker Required – When you place an order with Nadex, your order placed directly on the exchange. Instead of paying broker commissions, you archarged $.90 cents per contract, per side ($1.80 round trip fees per contract). Thmaximum commission you will ever pay on one trade is $18.00 (10+ contracts
• Nadex is now open in 47 countries – Nadex was previously available only to legal residenof the United States, Canada, Mexico and U.S. Territories.
Opening a Free Nadex Demo Account
It doesn’t get much simpler to open up a 2-week Nadex Demo account, funded with $25,000 in plamoney. Just create a demo name and provide your name, telephone number and email address.
You will have complete access to the entire Nadex Trading Platform for 2 weeks.
Use your favorite trading strategies or the strategies in this book and see if Nadex is right for you.
SIGN UP for a free 2-week Nadex demo account.
If you have already looked at Nadex and want to fund a live account for as little as $100, then you cago to this link to open a funded account- www.TradingPub.com/Nadex Once you have placeyour rst trade, your Nadex demo account will be extended for up to a full year.

8/15/2019 Ultimate Guide eBook
http://slidepdf.com/reader/full/ultimate-guide-ebook 136/218
ultimate guide to trading and investment
13
Free Links to Nadex Resources:
•
The Probability Report- www.TheProbabilityReport.blogspot.com This monthly blonewsletter lists a calendar of free weekly educational webinars hosted by Nadex, along wiarticles and videos explaining how to trade with Nadex. The Probability Report is free anproduced by TradingPub.
• The Inquisitive Trader Blog- www.InquisitiveTrader.blogspot.com
TradingPub’s Cam White takes a look at Nadex trading strategies, and routinely breaks dowNadex trades in his “Trade of the Day” column.
The rest of this book is dedicated to Nadex trading strategies you can test tomorrow. If you haventried Nadex, make sure to load up your FREE DEMO ACCOUNT HERE!
ABOUT THE AUTHOR
Cam White is a Partner Relationship Manager with TradingPub. When he joineTradingPub in June 2014, his rst assignment was to become familiar wiNadex. He downloaded the demo software and dove into the Nadex platform A self-professed “crash test dummy”, Cam tests directional and non-directionstrategies with Nadex Binary Options and Nadex spreads and publishes result
Cam also publishes The Probability Report, a monthly newsletter featurin
Nadex webinars, and contributes articles on Nadex to nancial media outlets

8/15/2019 Ultimate Guide eBook
http://slidepdf.com/reader/full/ultimate-guide-ebook 137/218
ultimate guide to trading and investment
13
If you are a futures or Forex trader, this chapter will show you a strategy to reduce your risk to thCurrent strategy you are trading. Stock traders sometimes buy option puts to hedge their risks, buwhat about Forex traders or futures traders? The strategy in this chapter will discuss using Nadex aa hedge against risk for futures and Forex trades.
In this chapter, you will learn the following concepts:
• The three important things you must know to begin making money in trading.
• How to reduce risk by up to 75% or more while having stop/losses that are up to 400% omore larger than what you use now to decrease the probability of getting stopped out by spike in the market.
• How to get stop/losses for pennies on the dollar with the Whipsaw Elimination Strategy.
• How to hide your stops from the market with the Ultimate Hedge Strategy.
• How to nd the right spreads for your trade.
• How to know how far the market will move today.
But rst, let’s take a look at a fairly typical trade setup:
Using Nadex Spreads as theUltimate Hedge Strategy
By Darrell Martin, Apex Investing

8/15/2019 Ultimate Guide eBook
http://slidepdf.com/reader/full/ultimate-guide-ebook 138/218
ultimate guide to trading and investment
13
The chart above is the GBP/USD, but it could be any market. You plot a trend line and see a bearistrend. You identify a pullback for an entry signal. You exercise caution and set your stop/loss abovthe highest candlestick. Your risk is 65 pips or $650 dollars, so you are prudent in setting your stopsbut there is a greater amount of risk capital in play. And then this happens:
This really hurts. The market starts threatening your stop/loss. What do you do? Move your stopstake the hit? Go long because there is a trend reversal?And the worst part about it is that it is a slowagonizing march toward your stop/loss. So you take the hit, and lose $650. And then the markedecides to slap you in the face.
Your initial instincts were right. The market was in a downtrend, but it decided to spike upward anstop you out before it made its move downward. The net result is that you lost $650 dollars. Thchapter will show you how to prevent this from ever happening in the future. You will learn how tplace the exact same trade, use less money and never get stopped out again. You can combine thstrategy with your current Forex strategy to create a massive stop/loss for a fraction of the cost.

8/15/2019 Ultimate Guide eBook
http://slidepdf.com/reader/full/ultimate-guide-ebook 139/218
ultimate guide to trading and investment
13
To make money in trading, you need to master three things:
1. You need to lean to reduce your risk.
2. You need to increase your leverage.
3. You need more time to be right.
In the trading example above, the trade had $650 dollars of money at risk, and as soon as yomade it, the market spiked and took you out. You were right, but you needed more time to be righTrading futures, options and Forex can be very expensive. Traders can be required to have upwarof $30,000 on hand to fund accounts and have a considerable amount committed to margins. This where Nadex comes in very nicely, as the table below illustrates:
Day trading the EUR/USD (Equalized Size 125,000) and other instruments requires considerablecapital to fund an account, margin requirements are high, and leverage varies. When you look at
the table above, you can easily see a comparison of trading the same instrument across multipletrading platforms. The signicant advantage of Nadex is reduced capital risked, a huge leverageadvantage, and best of all, you can’t get stopped out in a trade.
Other benets of using Nadex as a trading platform are:
• You can’t lose more than you put up in margin. The amount of cash you risk is your margin
• You still get very good leverage.
• You can trade stock indices, popular commodities and Forex pairs.
• Price is driven by the underlying market.
• Every pip is worth $1.00 per spread bought or sold.
• Nadex is an exchange that facilitates transactions between buyers and sellers.
• Nadex is regulated by the CFTC, and does not take a position in any market.
• Nadex is now available in 49 countries! (Previously USA, Canada & Mexico).

8/15/2019 Ultimate Guide eBook
http://slidepdf.com/reader/full/ultimate-guide-ebook 140/218
ultimate guide to trading and investment
14
Let’s talk about some basics to trading Nadex spreads:
• A spread is dened by a oor and a ceiling. In this EUR/USD example, the spread is betwee
1.2400 and 1.2500, which is 100 pips. Each pip is worth $1.00, so the spread is worth $10
• If the price moves above the ceiling or below the oor of the spread, you can’t get stoppeout. Nadex spreads are based on a dened time period that you choose, and the trade active until expiration of the contract.
• Using this example, if you SELL at 1.2490 and the ceiling of the spread is 1.2500, yomaximum risk is 10 pips or $10. Remember, with Nadex, your risk is your margin. If yoplaced the same trade on Spot Fx, your margin would be $250.
• Since the spread is 100 pips and you are risking 10 pips, your maximum prot is 90 pipsthe trade ends at the oor.
• If you BUY the spread at 1.2410, it’s the exact opposite. Your risk is 10 pips from the oor the spread, and your maximum prot is 90 pips above.

8/15/2019 Ultimate Guide eBook
http://slidepdf.com/reader/full/ultimate-guide-ebook 141/218
ultimate guide to trading and investment
14
• You can close the spread any time you want to before expiration to capture prots or limlosses. When the contract expires, remember that you are trading an underlying market, annot physical commodities, for example. Corn will never be delivered to your doorstep if yotrade corn futures on Nadex.
• Your prot is the dierence between your strike price and the price of the market at thexpiration of the contract, or the price of the contract if you close the spread early. If yoBUY this spread at 1.2410 and it settles at 1.2480, then the dierence is 70 pips, and $70 deposited in your account, usually within a matter of seconds.
• There are a wide variety of spreads and timeframes to choose from in Nadex. Choose thspread that works the best with your trading plan and risk/reward tolerance.
Duration and Expiration of Nadex Spreads
Nadex oers a wide variety of spreads, both in terms of markets you can trade (indices, commoditie
Forex) and time intervals:
• Intraday – as little as every 2 hours. Time frames can depend on the markets beintraded. Forex trades are available in the overnight hours when the commodities ansome indices are closed. All times listed on Nadex are Eastern daylight time (EDT
Some spread times can include:
o 8am-10am EDT
o 9am-11am EDT
o 10am-12pm EDT
o 11am-1pm EDT
o 12pm-2pm EDT
o 1pm-3pm EDT
o 2pm-4pm EDT

8/15/2019 Ultimate Guide eBook
http://slidepdf.com/reader/full/ultimate-guide-ebook 142/218
ultimate guide to trading and investment
14
• Expiration and Settlement
o Days of expiration
o Time of settlement (All quoted in Eastern time)
o Spread Range/Width: Distance between the oor & ceiling of the spread
o No. of contracts: Number of spreads per expiration, per range. Foexample, you could have one in the middle, one high and one low
• Trading Hours: Times when new trades can be entered, and when open trades can bclosed before settlement.
•
Commissions: Since you are placing an order on an exchange without a broker, therare no commissions charged. There is an exchange fee of $0.90 cents per $100 contracper side. You are not charged a settlement fee if your contract expires out of the money
If you trade one $100 contract successfully, you are charged a $0.90 to execute a trade and $.0to settle the successful trade for a total of $1.80 in transaction fees. Transaction fees are capped $9.00 per side. If you trade over 10 contracts on a transaction, your transaction fees are cappe

8/15/2019 Ultimate Guide eBook
http://slidepdf.com/reader/full/ultimate-guide-ebook 143/218
ultimate guide to trading and investment
14
The chart above shows the overlap of ve Nadex spreads. The longer you have until expiration, thwider the spread:
• Daily: The yellow background is the Daily Spread between 1.2700 – 1.3300 ($600)
• 8 Hour: The blue spreads are two 8-hour spreads:
o 1.2875 – 1.3125 ($250)
o 1.2750 – 1.3250 ($500)
• 2 Hour: The Orange spreads are two 2-hour periods
o 1.2950 – 1.3050 ($100)
o 1-2900 – 1.3100 ($200)
Nadex oers binary options and spreads on the following markets:
The Whipsaw Elimination Strategy is simply using a Nadex spread. As long as a spread is activewithin a dened time period you can’t get stopped-out.

8/15/2019 Ultimate Guide eBook
http://slidepdf.com/reader/full/ultimate-guide-ebook 144/218
ultimate guide to trading and investment
14
The Ultimate Hedge Strategy
Now that we have a basic understanding of Nadex spreads, we will apply Nadex spreads to help yoget stop/losses for pennies on the dollar. You will also learn:
• How Nadex spreads work
• Nadex spread example
• How to nd the best spreads
• How to know how far the market will move today
Let’s go back to our original example
We identied a trend, placed our trade, set a conservative stop/loss, and got stoppeout on a market spike before the market continued downward. We lost $650Let’s look at the same trade, using an 8 hour Nadex spread:
A Nadex spread was available with a ceiling of 1.5700 and a oor of 1.540 (250 pips). If you se10 contracts at 1.5665 then your maximum risk (and margin) is 35 pips or $350. In the previouexample, our risk was $650, and our margin requirement was $3,138.
In the Nadex spread, we didn’t get stopped out and took a $750 prot within 8 hours. In the previou
example, we got stopped out immediately on a market spike and lost $650. We satised the criterfor making money discussed earlier in this chapter. We risked less money, we had better leveragand we had more time to be right.

8/15/2019 Ultimate Guide eBook
http://slidepdf.com/reader/full/ultimate-guide-ebook 145/218
ultimate guide to trading and investment
14
Here is the side-by-side comparison of trading a Forex spot trade vs. making the same trade witNadex spreads:
Underlying Spot vs. Nadex Spread Example Results
Underlying - Spot Nadex Spread
Risk: $650 Risk: $350
Margin: $3138.00 Margin: $350
Result: Lost $650 Result: Proft $760
Here’s another way to look at the original trade in this chapter. What would happen if we took ouoriginal Spot Forex trade, went short and hedged it with a Nadex spread instead of a stop/loss?
A Nadex spread is available with a oor of 1.5700 and a ceiling of 1.5950 (250 pips). You buy th
spread at 1.5710, which becomes your margin, and you risk $100 instead of $650. When the markespiked, you had a 240 pip Nadex insurance policy protecting your trade. The market continuedownward to your prot target. Your gross prot is $960, less your $100 Nadex spread loss for a neprot of $860.
If you trade Forex or futures, you can trade the way you normally do do, but use Nadex spreads tminimize your risk.
Using the Apex Investing Institute Website to Help You Find the Right Nadex Trade
If you sign up as a member on the Apex Investing Institute website, you will have free access to wealth of information to help you identify the right Nadex spreads and binary options to trade.
They also have tools to help you learn how far the market thinks it will go in any given trading dayThe graphic above is a screenshot of the Apex Nadex “Spread Scanner” utility which will returspreads to you based on the money you are comfortable risking, your expected reward and the timperiod you are looking for. Apex also oers free chat rooms for their members and several servicewhich can be purchased at a reasonable price if you need them.
Conclusion
Nadex spreads are an excellent way to trade with less risk, get better leverage, and they buy yo
the time to be right. Since you are placing your orders directly on an exchange without a broker, yodon’t pay brokerage commissions, just exchange fees. You can’t get stopped out during a trade, anyou have the exibility to exit a trade at any time before contract expiration.
If you trade futures or spot Forex, Nadex spreads allow you to trade the way you normally tradebut they can buy you stop/loss protection for pennies on the dollar. There are no large margirequirements with Nadex. Your risk is your margin.

8/15/2019 Ultimate Guide eBook
http://slidepdf.com/reader/full/ultimate-guide-ebook 146/218
ultimate guide to trading and investment
14
THE MOVIE
WATCH THE VIDEO OF THIS CHAPTER’S PRESENTATION HERE! During the presentatioDarrell Martin does an excellent job of explaining how Nadex spreads work, and how they can b
used as a standalone trading instrument or as a hedge against risk in your current trading strateg
SPECIAL OFFER
Get hundreds of hours of free Nadex Binary and Spread Education! CREATE YOUR FREACCOUNT HERE!
ABOUT THE AUTHOR
Darrell Martin coined the phrase “diagnostic trading.” He denes “diagnosttrading” as looking at how fundamental investors, technical investors, statisticinvestors, and seasonal investors look at the market and then using thknowledge to be one step ahead of the markets. His A.P.E.X. pattern and TrenCatcher system simplies trading entries, stop losses, and take prots to thtick/pip/cent and works on the one thing that moves the markets. For moinformation visit www.apexinvesting.com.

8/15/2019 Ultimate Guide eBook
http://slidepdf.com/reader/full/ultimate-guide-ebook 147/218
ultimate guide to trading and investment
14
My trading background before Nadex was trading traditional options on TD Ameritrade softwareThe main strategy was selling options where prices were NOT going to go in a specic time periodusually 30-50 days out. Although it was a simple strategy, I had to wait a month or two to collect thpremium and to pocket the money.
Then, 2 years ago, I discovered Nadex. I was so excited. I could take my knowledge and insteaof trading 30-50 day contracts, I then could trade 1-24 HOUR (not days) contracts. I took my samemethodology of buying and selling options on the chart where prices were NOT going to go in a washorter time period and made my prots faster!
I won’t lie, when I rst started trading Nadex, it was a lot harder than I thought it was going to beBinary prices move fast and you have to always be ready for a fast move against and learn tmanage risk. I realized too why so many people were losing money (including myself); because theweren't trading with a Plan!
I was tired of losses and knew I needed to treat trading Nadex like a business. I turned my tradin
account into an LLC Entity account and started taking trading seriously and creating Daily TradinPlans for myself.
HOW TO CREATE A NIGHTLY TRADE PLAN
The main markets I trade are Futures instruments, such as US 500Smallcap 2000, Gold and Crude Oil. There is a bigger advantage tFutures because you can use volume and order ow in your analysiswhere as some markets such as Forex you cannot.
In a previous career, I worked in the car business. When I bought ansold cars, one thing I ALWAYS did was I rst would determine the fa
value for the car.
Usually I would consult with Kelley Blue Book to nd out where thrange was for selling and buying that specic vehicle based on thmarketplace. If you’re selling the car, you want to try and sell it at th
top of the range and when buying, you want to try and get the price at the lowest range.
“Creating Nadex® Trading Plans” by Sean Jantz, Binary Trade Group

8/15/2019 Ultimate Guide eBook
http://slidepdf.com/reader/full/ultimate-guide-ebook 148/218
ultimate guide to trading and investment
14
Let's look at the Kelley Blue Book of the car above. If you're selling this car, you want to try and geas close to $16,817 as you can. If you're buying, you're trying to get as close to $13,752 as you canwould want to try and stay away from the "Fair Purchase Price". What if we could see this informatioon a Futures chart?
It's safe to say that 90% of people do this when working a car transaction. You always want to maksure you're getting a good deal. Even when you buy a house, you almost always look at comps oother similar houses.
So it nally hit me that in any other buy/sell transaction out there, almost everybody does researcrst. I have now taken that same philosophy and I "Kelley Blue Book" every night the price of certain Futures market using a free tool called Volume Prole.
Every evening, I "Kelley Blue Book" the price of the instrument I want to the trade the next day. Herean example of US 500 (ES. I rst begin by dening the price range. I want to nd where the "GooDeals" are to be a buyer and a seller:
Next, I draw a rectangle from the top of the Value to the bottom so I can visually see the price rang
for the next trading day:

8/15/2019 Ultimate Guide eBook
http://slidepdf.com/reader/full/ultimate-guide-ebook 149/218
ultimate guide to trading and investment
14
There are 6 ways to prot from the Value Area Box that you can learn in my Education Center, anhere is a visual picture of the rst two:
1. 2.
So, I have now dened where I want to be as a buyer and a seller.
Early in the morning, the price of US 500 was at a point of a "Good Deal" for buyers.
Mid-afternoon, price then retraces up to a point where sellers were on high alert.

8/15/2019 Ultimate Guide eBook
http://slidepdf.com/reader/full/ultimate-guide-ebook 150/218
ultimate guide to trading and investment
15
Here was that day’s US 500 "Trade Plan" video the night before, starting at the 5:40 minute mark.do nightly "Trade Plan" videos just like this to help me and my Binary Trade Group members knowhere the best opportunities are each day. Watch this 3/23/15 Trade Plan here www.TradingPucom/Nadex6. Begin making Trade Plans for yourself on your favorite instruments that you like t
trade to see how much of a dramatic dierence to your success it makes.
UNDERSTANDING INTRADAY MARKET MOVEMENTS
The next element of trading Nadex and Futures that has drastically increased my winning ratio waunderstanding how a typical day works in the stock market and when the best times are for reversaland what type of risk/reward binary to take during which times of the day.
Here is an easy time-based synopsis of the New York Trading session:
9:30am ET- Strong opening and will see heavy volume in one direction or another.
10:10am-11:00am ET -Many stocks reverse their trends. When stocks open up with strong buying (oselling), specialists and market makers were forced to take the other side of the longs (or shorts) ansell short (or long). They have no intention of riding losing positions forever, so they start "droppinthe bid" so they can cover their short (or longs) at a prot.
11:00am-1:00pm ET - "Lunchtime Doldrums". This is when most of the traders in New York go lunch and you will see lower volume during this time. Sometimes you will see range bound tradinor a reversal continuation.
1:30pm-1:45pm ET - Most often the market compresses during lunch and volume picks up after, anthe market then starts to make its next move.
2:15pm-3:00pm ET- Volume should be strong and the trend should continue.
3:30pm-4:00pm – Going into the close you will see heavy volume and big money getting thepositions in or out. Prices will move fast.
High Probability Nadex Trading Strategy – The “Caret” Trade
My favorite trading strategy from using the time based information is the reversal of the market opetrend and using “Lunchtime Doldrums” to my advantage. Here is an example of a high probabilittrading strategy that I use at least 3 out of 5 days a week called “The Caret Trade”:
Many traders avoid trading at lunchtime because there is just not much volume in the marke
With Nadex Binary Options, the lunchtime “Caret” Trade allows you to take advantage of declininlunchtime volume on the S&P 500 Futures market.
Quite often, after a busy morning session, volume on the S&P 500 has a tendency to start declininusually after 10:00am EST. The market, which has been grinding upward, hits resistance, and thestarts forming an upside-down "V" pattern. I call it the "Caret" trade because it resembles the "^symbol above the number 6 on your keyboard.

8/15/2019 Ultimate Guide eBook
http://slidepdf.com/reader/full/ultimate-guide-ebook 151/218
ultimate guide to trading and investment
15
On this day's lunchtime trade, the "Caret" trade was in play. The market started moving upward afte10:00am as volume declined. At noon, the market hit resistance on the Keltner Channel and th
indicators on the Fisher Transformer were lined up overbought. A reversal Star candle signaled potential reversal. Sure enough, it happened:
The market started to reverse with a strong SELL signal on the Fisher transformer. The followingorder was placed:
Trade Details:Contract: US 500 (Mar) >2107.3 (1PM)Expiration: Mon Feb 23 13:00:00 EST 2015
Direction: SELLQuantity: 2Price: 20.00
Two contracts were being sold, with a maximum risk of $160 and a maximum reward of $40 for thideep in the money trade. The trade settled in the money for full prot of $40 at 1:00pm, less $3.60in exchange fees.
8/15/2019 Ultimate Guide eBook
http://slidepdf.com/reader/full/ultimate-guide-ebook 152/218
ultimate guide to trading and investment
15
Here was the video of me trading this strategy live. The more times you see it and do it, this typof trade becomes extremely routine and mechanical. Watch this Live Caret Trade here- wwwTradingPub.com/Nadex7
(This type of trade works the opposite way as well, where price will move down at the open and yowill see a "V" pattern develop.)
CONCLUSION
1. Create "Trading Plans" for your favorite instruments. Never go into a trading day unprepare
2. Trade in areas of the charts where big buyers and sellers are. You can easily nd out with m"Kelley Blue Booking" the price of that instrument every evening.
3. Understand how the New York Stock Exchange works and when the big money is trading annot trading and then utilize specic risk/reward strategies based o of the hour of the day.
4. Trade with a group of like-minded Nadex traders and gain support, condence and knowledg
with Binary Trade Group.
THE SPECIAL OFFER
Binary Trade Group is all about traders helping traders. Trading alongside others and learning froprotable NADEX traders dramatically speeds up the learning curve. BTG aims to keep NADEsimple but eective. Take a FREE sneak peak at BTG! Request to be added to Binary Trade GroupEducation Center, simply go here- www.binarytradegroup.com
THE MOVIE
Watch Sean Jantz's Presentation From Trading Pub's Trade-A-Thon- “How To Prot by Knowin
Where Prices Are NOT Going to Go Using the NADEX Platform”. Sean Jantz talks about Nadex, ancovers how to exploit value areas in the charts to make high probability trades based on areas whethe market is not likely to move. WATCH IT HERE!
ABOUT THE AUTHOR
Sean Jantz, the Founder of Binary Trade Group, is a fairly new, successful tradwho saw the need for more simplication in the marketplace for ordinary peoptrying to bust through into the markets. Sean's journey to protability was llewith courses, books and videos that sounded great, but nothing seemed to maksense, or he just didn't understand how to apply the teachings. Now, he has
knack for simplifying charts and terminology by using layman terms and usinreal world analogies so newer traders can keep up. He likes to say, "If you canexplain it to a 3rd grader, then you can't explain it."

8/15/2019 Ultimate Guide eBook
http://slidepdf.com/reader/full/ultimate-guide-ebook 153/218

8/15/2019 Ultimate Guide eBook
http://slidepdf.com/reader/full/ultimate-guide-ebook 154/218
ultimate guide to trading and investment
15
To better understand the concepts of Trend Days and Triggers let’s look at the chart above. The la
ve bars show a nice downtrend in the E-Mini S&P 500 market. This trend is easy to identify becausthe bars are colored red based on our PowerX Method rules. When MACD, RSI, and Stochastics abearish, we have a Trend Day (red bar).
If the market trades below the low of a Trend Day during the next trading session, we have a Triggeredowntrend. Triggered trends are powerful because there is a higher probability that the trend wcontinue and the market will close lower in a downtrend, or higher in an uptrend. These scenariocreate perfect conditions for high probability binary trades.
Taking things a step further we can take all Triggered uptrend and downtrend days for the year andetermine the probability that the trend will continue (close lower in a downtrend or higher in auptrend).
Here are the yearly probabilities for the core markets we trade (as of December 2015):
E-Mini S&P = 68% probability trend continues
E-Mini DOW = 70% probability trend continues
E-Mini NASDAQ = 72% probability trend continues
Crude Oil = 79% probability trend continues
Gold = 90% probability trend continues
Silver = 90% probability trend continues

8/15/2019 Ultimate Guide eBook
http://slidepdf.com/reader/full/ultimate-guide-ebook 155/218
ultimate guide to trading and investment
15
How to Trade Binary Options using the Power Crossover Method
Once you are familiar with the essential terminology and the PowerX indicators, you can mak
better decisions when trading trading binary options. We can then use PowerX Triggered days anprobabilities to determine:
The market with the best probability.
The direction of the market, based on PowerX Method rules.
The right expiration (dailies).
The best strike price.
o BUY below the previous day’s close for a triggered “uptrend”
o SELL above the previous day’s close for a triggered “downtrend”
The best entry price (BUY/SELL $5 better than the probability).
o Example: If you are buying a US 500 contract with a PowerX uptrend and 70% probabilitthe market will close higher, buy a daily for $60 or less.
Amount Risked: $60 (max)
What Happens if a Trade is Working Against You?
Using this method will help put probabilities in your favor, but sometimes the markets don’t cooperateWith Nadex you can always exit your trade early and buy/sell your contract at current market prices
This might preserve some prots or minimize losses. But keep in mind that the probabilities are baseon end of day data. So there’s nothing wrong with keeping it simple and hold trades to expiration
A Case Study for Using this Strategy
On November 17, 2014, we started a very unique experiment. The goal of the experiment is simple"Can We Make 10% Per Month with Trading - SAFELY and CONSISTENTLY?"
10% per month is quite aggressive. After all, this would yield to 120% per year! And as if this goais not challenging enough, we added some more "restrictions" to this experiment - making it almosimpossible to succeed!
So did we succeed? And if so, how did we do it? Before I show you the results, let me talk a little bmore about the "restrictions" for this experiment

8/15/2019 Ultimate Guide eBook
http://slidepdf.com/reader/full/ultimate-guide-ebook 156/218
ultimate guide to trading and investment
15
• The trading strategy should be easy to understand and easy to use. Even somebody whhas NEVER traded before should be able to understand and execute the trading strategy less than 60 minutes.
•
The trading strategy should work equally well on a $2,000 and a $200,000 account. Itimportant to us that ANYBODY could trade this strategy.
• You should be able to trade the strategy without buying any charting software, indicators, etIt should be possible to trade this strategy with a simple browser , no matter whether yoare on a PC, Mac, tablet or even your phone!
• It should be possible to trade the strategy even if you have a full-time job. Therefore it shoutake less than 5 minutes per day to place the trades and also manage the positions.
Pretty challenging, isn't it? - But we did it! And thus far the results have been impressive!
After spending months testing and trading the strategy on a live account, we narrowed it down to thBEST 6 markets to trade. And on November 17th we started to trade THESE markets on a livaccount. Below is the performance based on a $2,000 account (Keep in mind that you could tradthis strategy with $2,000 or $200,000 – it doesn't matter.)
Here Are the Results (Updated Daily)
The Strategy
Here’s the strategy we used for our experiment. We tried dierent strategies for stocks, optionfutures and even forex markets. But the market that produced the best results was binary option
We have been running a sophisticated algorithm on 5 years of data for 6 dierent markets, anbased on this algorithm we know the probability of a market closing above or below a certain pricThe table below is an example of the trades we want to place, including the probabilities of the trad

8/15/2019 Ultimate Guide eBook
http://slidepdf.com/reader/full/ultimate-guide-ebook 157/218
ultimate guide to trading and investment
15
We update these values every night, and the next morning you just have to wait until a market goeabove or below the "trigger price”, and then you place an order.In order to place an order, simply lointo your trading account using a simple web browser, and that's it.
In this example, a trade in Crude Oil was triggered, and you will receive a text message from us:
Now you just need to log into your account and place the order as specied. It's that easy!
The beauty of this strategy is that we know the probabilities of success based on historical datacollected over the past 5 years. As you can see from above, all of the probabilities listed are abov75 percent!

8/15/2019 Ultimate Guide eBook
http://slidepdf.com/reader/full/ultimate-guide-ebook 158/218
ultimate guide to trading and investment
15
In the REAL LIFE statistics above you can see exactly what OUR winning percentage is. And we'updating the statistic daily, so that you can follow our experiment. Keep in mind that we are jutrading a small $2,000 account, so if you have more money in your account, you would just tradmore contracts! Simple and straightforward.
So let's review the criteria for this strategy (and then I'll show you how YOU can join us in thexperiment, if you want to):
• The trading strategy should be easy to understand and easy to use. Even somebodwho has NEVER traded before should be able to understand and execute the tradinstrategy in less than 60 minutes. I just briey explained it to you in a few minuteso I'm sure you'll fully understand it after 60 minutes.
• The trading strategy should work on a $2,000 account as well as on a $200,000 accoun(you simply trade more contracts!)
•
You should be able to trade the strategy without buying any charting software, indicators, etIt should be possible to trade this strategy with a simple browser , no matter whether yoare on a PC, Mac, tablet or even your phone! All you need is the table with the probabilitieand exact entry signals and you can start trading the strategy right away! When trading binaoptions you only need a browser All you need is the table with the probabilities and exact entsignals and you can start trading the strategy right away! When trading binary options you onneed a browser.
• It should be possible to trade the strategy even if you have a full-time job. Therefore it shouldntake longer than 5 minutes per day to place the trades and manage the positions. You havseen how easy and fast it is to place the orders. And once the order is in the market, therenothing else you need to do. Just wait until the end of the day to see if you are right or wrong.
you are right, the money will be automatically deposited into your account! Easy enough, isn't i
I have been trading for more than 25 years.I don't know about any other way that makes it so easto identify and place the trades, especially not with the accuracy that we're achieving!
I wish Binary Options existed when I started trading! I’m sure I would have achieved my trading goals MUCH QUICKER!

8/15/2019 Ultimate Guide eBook
http://slidepdf.com/reader/full/ultimate-guide-ebook 159/218
ultimate guide to trading and investment
15
CONCLUSION
The PowerX Method puts probabilities in your favor, and makes it easier to identify trending marketsThe rules are simple and straightforward as long as you have an understanding of the key concepts
and your charts are set up to help you make the right decision.
Since binary options boil down to a simple “up” or “down” decision relative to a strike price and dened expiration, this strategy can be quite eective.
THE MOVIE
In this 45-minute video, Mark Hodge will walk you through the basics of trading NADEX binaroptions, along with the step-by-step approach toward using the Power Crossover Method to tradNADEX binary options. CLICK HERE to view the video.
SPECIAL OFFER
So let me show you how YOU can take advantage of a fantastic trading opportunity to trade BinaOptions just like I do. I have decided to make our table with the probabilities available for a limiteamount of traders. As you know, "stock picking services" and other newsletters charge $200 anmore per month!
But the reason I started this experiment and created this strategy in the rst place is because wwanted a solution for EVERYBODY who wants to trade - regardless of experience or accoun
size - and I want YOU to have access to this, too.
We are planning to increase the price of this service to $197 per month, but whenyou join us TODAY, you can join for only $47 per month.
And of course you can cancel anytime, if you don’t want to continue for ANY reason.
• Just click on the SIGN UP NOW button below to join.
• You will then receive an email with a username and a password that allows you to accesthe members area in which you will see the table with detailed trading instructions.
• We will update the table the night before the next trading day, and we will send you anemail as soon as it is updated, so that you don't miss any trades.
• You will also have access to our training videos, in which we explain EXACTLY how totrade this strategy.

8/15/2019 Ultimate Guide eBook
http://slidepdf.com/reader/full/ultimate-guide-ebook 160/218
ultimate guide to trading and investment
16
SPECIAL BONUS
If you decide to join us TODAY, we will upgrade you to our TEXT ALERT SERVICE free of chargWhenever a trade occurs, we are sending you a text message. So you don't have to sit in front o
your computer all day.
You can simply go about your day as usual, and whenever you receive a text message, you log inyour account using a browser - or even your phone - and place the trade. It's that easy! As you casee from the LIVE results above, THIS works!
You are no longer GUESSING, you now trade with the odds in your favor.Imagine using thsimple strategy to nally achieve your trading goals! Instead of spending more time and moneon complicated courses, DVDs, indicators, software packages, you now have a simple strategy
• ... that's easy to execute,
•
…can be traded on a small account,
• … can be traded from ANYWHERE (as long as you have access to a browser),
• … and produces RESULTS!
Even if you just want to follow it on a demo account rst, sign up now and Let's get you started today!
CLICK HERE to get Instant Signals and 5-Year Probabilitiesfor just $47 per month!
ABOUT THE AUTHOR
Mark is the Head Trading Coach at Rockwell Trading. He is co-developer of many Rockwell Trading’s educational resources. With an extensive knowledge of technicanalysis and money management, Mark has been featured by SFO MagazinTechnical Analysis of Stocks & Commodities, AllExperts.com, INO, FXstreeTraders’ Library and other leading publications and websites in the trading industr

8/15/2019 Ultimate Guide eBook
http://slidepdf.com/reader/full/ultimate-guide-ebook 161/218
ultimate guide to trading and investment
16

8/15/2019 Ultimate Guide eBook
http://slidepdf.com/reader/full/ultimate-guide-ebook 162/218
ultimate guide to trading and investment
16
FUTURES

8/15/2019 Ultimate Guide eBook
http://slidepdf.com/reader/full/ultimate-guide-ebook 163/218
ultimate guide to trading and investment
16
If you actively day trade the futures markets, specically the ES, NQ, TF, CL, 6E and other populafutures markets, then this chapter is for you. You will learn about using the TradingZone methowith Market Prole. This chapter will also focus on bridging the mechanics of trading with the humaelements of trading. Most traders get into the technical side of trading without taking into consideratiothat trading is an emotional business.
Trading isn’t for everyone, and every trader develops a trading style that best ts their personalitySome traders are more attuned to day trading short time frames. Others swing trade and let position ride for a few days. Still others have long time horizons. The beauty of trading the marketis that there are strategies tailored for each type of trading personality.
But rst, you need to ask yourself “How much money am I prepared to lose?” What are you prepareto invest in your trading business, and how much are you prepared to lose if things go terribly wrong
Once you have taken personal responsibility for what you invest and what you’re prepared to losethen you can identify what trading style is best suited to your personality.
How to Use Market Profile to Trade FuturesBy Greg Weitzman, TheTradingZone.com

8/15/2019 Ultimate Guide eBook
http://slidepdf.com/reader/full/ultimate-guide-ebook 164/218
ultimate guide to trading and investment
16
The TradingZone System is built on three primary pillars:
•
Market Prole – A tool used to assess the broad market. It’s like a big-picture roadmap. If yoare driving from New York to Chicago, you need to know you are heading west. Where doethe market want to go, and which direction is it going?
• Patterns and Inection Points – There are some places on the charts that are bettopportunities than others. Something has happened in the recent past that’s a better placto take a trade, or something has happened in the recent past where it’s less advantageouto take a trade. Market Prole gives us the direction of the markets. Patterns and InectioPoints give us the best spot on the charts to make a trade.
• Price Action Order Flow – The nal step is to take a look at Price Action Order Flow. Oncwe have determined the direction of the market and where on the charts we need to trad
and we want to go long, are other traders moving in that direction as well?
The fourth pillar is Money Management. The reason why this pillar is separated from the others that the rst three pillars are determined solely by the market. Money management is determined bthe trader, and it goes back to the human element of understanding what type of trader you are, homuch you are prepared to lose and how you manage your money.
200 traders in the same trading room, using the same tools and methodology, will have 200 diereP&L statements. We are all unique in our trading personalities.
A Key Tool for Developing a Positive Trader’s Psychology
In order to trade successfully, you need to learn how to trade consistently. One of the rst thingyou can do is to set a reachable, reasonable daily goal. Let’s say it is $50.Once you reach thgoal, stop trading for the day. Once you have become accustomed to reaching a daily goand stopping, thereby protecting your earnings, it becomes easier and easier to do. As yoaccount balance increases, you can gradually increase your daily goal as you move forwar

8/15/2019 Ultimate Guide eBook
http://slidepdf.com/reader/full/ultimate-guide-ebook 165/218
ultimate guide to trading and investment
16
Market Prole – The First Pillar
Market Prole is the most powerful and the most fun indicator to learn. It was originally developed ithe 1900’s by J. Peter Steidlmayer, a oor trader on the Chicago Board of Trade, who subsequent
licensed the program to the Chicago Board of Trade. Market Prole has been taught by numeroueducators, and some have over-complicated it. In the TradingZone System, Market Prole is essentiabut it is also greatly simplied.
Market Prole organizes one single day’s trading data into a simple distribution curve. On the righyou have the prices that traded throughout the day. The letter blocks are plotted every time a speciprice was traded. The letter blocks move from left to right as time moves forward. During the coursof the day, as all the letter blocks are being plotted on the chart, it builds a distribution curve until onof those rows stands out the furthest.
This row of letter blocks is called the Point of Control (POC). It is the price level traded morfrequently than all of the other price levels. To put it another way, it is the price where most buyerand sellers met to exchange product. It is the center of gravity, or the equilibrium point of the markeIt is the most accepted price on the market.
Once the POC has been determined, the Market Prole calculates one standard deviation on eitheside of the POC, creating the Upper Value Area and the Lower Value Area. All of the data betweethe UVA and LVA comprises 68.3 percent of all of the data for the day.
If you ipped this data on its side, it would look like the bell curves taught in statistics class. What thinformation tells us is that the relevant prices, or the most accepted prices, happened within thes
2 boundaries. The irrelevant prices, which were the prices with less acceptance and less volumeoccurred outside the boundaries.

8/15/2019 Ultimate Guide eBook
http://slidepdf.com/reader/full/ultimate-guide-ebook 166/218
ultimate guide to trading and investment
16
When you superimpose Market Prole on the daily charts, here’s what it looks like:
The chart becomes more visually appealing, and easier to understand. You can clearly see thuptrend with the brackets between the UVA and LVA stacking on top of each other. It’s much bettebut it can be simplied even further.
This becomes even more visually appealing to traders. The Market Prole indicator is nosuperimposed on a candlestick chart regardless of the time frame you are using. If you have visually appealing chart with patterns that are easily recognized, then the probability that you whesitate to make a trade is diminished.
On this chart, the green shaded area is the same as the Market Prole on the smaller chart aboveYou can easily see how the Point of Control drives the market. Above the green shaded area yocan see yesterday’s Point of Control, Upper Value Area and Lower Value Area, so you can compatoday’s price to yesterday’s value. Yesterday’s charts established the value of the market. Has become cheaper or more expensive? This chart lets you know whether you are trading above valubelow value or inside value.

8/15/2019 Ultimate Guide eBook
http://slidepdf.com/reader/full/ultimate-guide-ebook 167/218

8/15/2019 Ultimate Guide eBook
http://slidepdf.com/reader/full/ultimate-guide-ebook 168/218
ultimate guide to trading and investment
16
In this chart the brackets are in line with each other, making this chart value neutral. It’s range-bounso you can look to sell o the upper range and buy o the lower range. So how do you identify a gooentry opportunity?
This is a market that is neutral. It is contained within the upper and lower boundaries, providing aopportunity to buy o the low range and sell o the high range.
Here’s an example of a market that had a number of opportunities. This is more consistent with aactive market. You tend to get 3-5 opportunities in a day. Support was tested twice and the markebounced back o the Upper Value Area.

8/15/2019 Ultimate Guide eBook
http://slidepdf.com/reader/full/ultimate-guide-ebook 169/218

8/15/2019 Ultimate Guide eBook
http://slidepdf.com/reader/full/ultimate-guide-ebook 170/218
ultimate guide to trading and investment
17
Conclusion
Market Prole and the TradingZone System give you the tools you need to make objective anquantiable decisions about determining the direction and structure of the markets.
Market Prole also works on all markets whether you trade the eminis, stocks, commodities, ags oforex. Key benets include:
• Market Prole is Dierent from other Indicators. It determines if the market is long, shotrend or range-bound
• It is Easy to Learn. Your chart isn’t cluttered with useless information
• Works in Any Market. Forex, Futures, Indices, etc.
• Clearly Identies Optimal Trading Price Levels. It makes entries objective and accurate
• Provides Entries as well as Exits. Keeps you in the trade for big moves
• Objective, Accurate and Precise Rules-Based Trading. This is critical because withoutyou are just trading on information and not a methodology
THE VIDEO
WATCH THE VIDEO OF GREG SHARING MORE ABOUT THE MATERIAL PRESENTED IN HICHAPTER – He does an excellent job of explaining how the Market Prole and TheTradingZonSystem work.
There are also numerous other examples of how to spot market direction, entry and exit point
THE SPECIAL OFFER
Get this trading system cheat sheet complimentary eBook. SIMPLY CLICK HERE
ABOUT THE AUTHOR
Greg Weitzman founded the trading educaon rm TheTradingZone.com in 200
TheTradingZone teaches both new and experienced traders how to day trade the e-mistock index futures, based on his own methodology of combining technical indicatorrice levels.Market Prole™ (market prole is a trademark of the CBOT), and Tape reading.

8/15/2019 Ultimate Guide eBook
http://slidepdf.com/reader/full/ultimate-guide-ebook 171/218
ultimate guide to trading and investment
17
After trading the futures markets for 25 years, there are a few things that are certain. Trading futureis a high risk business, and like all trading it will require your full application of skill in the areas oresearch, practice and live “in the trenches” trading to gain experience and realize success.
The rewards can be tremendous if you apply yourself fully to learning the key ingredients describein this chapter. The Trading Strategy, I will be describing in this chapter, is for the US stock index an
primarily uses the mini Nasdaq (NQ) contract.
I nd this to be the best day trading contract for the US stock indexes. This strategy can also be useon the Mini S&P 500, Mini Dow or Mini Russell 2000 as well, with great results.
The 6 essential ingredients to successful futures day trading are:
1) A tested and proven method for day trading on a short term time frame basis.
2) The “High 5” or what is sometimes referred to as “the tape” or “the big board”. These indices arused for reading the surface bias of the market.
3) The Higher Time Frames of the market. To get a "helicopter” view of the market bias above th“High 5” readings.
4) Simple Candlestick reading. I use very simple candlestick reading methods to get instanadditional information as to the direction of the prices.
5) Basic Elliot Wave chart patterns. These patterns occur regularly in day trading and you shoulearn them following the simple approach I use.
6) Fibonacci Retrace map. The Fibonacci readings are very accurate if used correctly and theshould be part of your day trading arsenal.
These are the 6 key ingredients for successful day trading.
This is really all you need to know to be successful, but you will need to gain skill in learning howto work with these elements and incorporate them into your trading. This mastery comes from timin front of your screen and practice, just like a surgeon masters all the surgical tools in front of himduring an operation or airline trac controllers are completely adept at reading all the gauges in fronof them.
6 Essential Ingredients for Winning
at Stock Index Trading By Mohan Wolfe, Day Traders Action

8/15/2019 Ultimate Guide eBook
http://slidepdf.com/reader/full/ultimate-guide-ebook 172/218
ultimate guide to trading and investment
17
You, too should master the simple methods for the 6 key ingredients for successful day trading. Theare not that hard to learn and I will summarize them in this article.
First, here is a 450 tick Boomerang Day Trader chart of the mini Nasdaq (NQ) which shows bo
a winning Sell short trade and a winning Buy trade using Boomerang’s bias indicators and chareadings.
Note the Sell Trade Channel moving down (marked by down arrow) and a pullback to the Signal LinEntry marked by the yellow dot and subsequent lower move in prices. Also, the Buy Trade Chann
moving up and the pullback to the Signal line marked by the Blue dot.
Because of this lower move and then upside reaction, the High 5 readings were most likely moNeutral. The Higher time frames were also leaning more on the Neutral side, which you can alslearn more about on the webinar provided below.
You can see how on the way down during the sell o the Red Boomerang candles which weall solid bodied. The bearish candlesticks are solid bodied. Note, how after the reversal and thBuy signal from Boomerang, the majority of the Green candles were hollow bodied. Hollow bodiecandles are the bullish candles. For simple candlestick reading I only focus on 2 things. I focus othe hollow bodied candles on an up move and if some of the candles are starting to show solid bodieas a possible sign of a reversal. The opposite is true for a down move.
I watch for solid bodied candles moving lower with some intermittent hollow bodied candles showinpossible signs of the move to the downside completing. The only other element I watch for in lookinfor a completion of the move is for a candle to become “engulfed” by the body of the next candle.
The Higher time frames bias reading is a matter of watching the shift rst in the 5 minute chart froBullish to Neutral to Bearish and the follow up with the 13 minute chart following the same patterYou can use an MACD indicator to watch for these shifts and other indicators, such as our BDT bia

8/15/2019 Ultimate Guide eBook
http://slidepdf.com/reader/full/ultimate-guide-ebook 173/218
ultimate guide to trading and investment
17
indicators. Then, when we see the 30 minute chart bias join the one sided bias reading to neutraand then bearish, it is important to trade on that side of the market until the downside gets morexhausted.
If the 60 minute then rolls over to bearish during this time expect a larger scale move. When the 13minute chart rolls to bearish intraday, joining the other already bearish time frames, then we will molikely see a very strong move to the downside.When the market makes a stronger, one sided movin line with the shift in the higher time frames that is when we can begin to start measuring the EllioWaves 1-5 pattern.
On the chart below you can see the Elliot Wave patterns which are based on a Wave 1 directionathrust, a Wave 2 pullback, a Wave 3 continuation thrust and a 4th wave pullback. The general rulis that if Wave 2 is simple then Wave 4 will be complex. If Wave 2 is complex then Wave 4 will bsimple. Then following Wave 4 we have the Wave 5 move, which is often a very strong extendemove which nishes o the directional pattern.
Below is a chart of a common Elliot Wave 1-5 move intraday and subsequent upside reversal aftethe 5th wave lowest move. Note how the patterns all correlate with the description I gave above. Notalso how the Boomerang bias indicators #1 and #2 measure the Elliot Wave patterns.
Elliot Wave theory can be kept simple by using it intraday like I show you here. The E Wave 1-pattern is easier to spot intraday.
It is when you get into multi day or even multi week E Wave patterns that a deeper study of the theoris required. Here is a good place to learn more about the Elliot Wave 1-5 pattern- www.TradingPubcom/Chart3. I follow as one of the key ingredients for successful day trading.
The last Key Ingredient you will want to learn for professional day trading is how to use what I call Fibonacci Retracement map. Fibonacci was a brilliant mathematician from long ago who discoverespecic numerical sequences present in nature itself and with many valuable uses. It was Fibonacwho introduced the Hindu/Arabic numeral system to the west. When we count 1-2-3-4 etc. we cathank Fibonacci for that.

8/15/2019 Ultimate Guide eBook
http://slidepdf.com/reader/full/ultimate-guide-ebook 174/218
ultimate guide to trading and investment
17
I use the Fib retracement map after the market has made a strong intraday move and I want to maout the potential retrace levels using the highly accurate Fibonacci readings. However, please notthat the Fibonacci map is only for purposes of measuring where to exit a clear Boomerang trade ofor support/resistance using the map as a guide.
The Key numbers used with Fibonacci are: Zero…23.6%…38.2%….50%…61.8%…100%. You casee on the chart below how after a strong, early rally as measured from the top of the rally pricepulled back and bounced o of the Key Fibonacci numbers, as shown by the 50% center dot/dashewhite line and the key 38.2% light blue line and 61.8% dark blue line. This can be a very valuabroad map when you are live trading intraday.
“How to trade with the Elliot Wave patterns”
In this section of the chapter I will show you two excellent examples of how to trade using the ElliWave patterns using a plain chart.
I have added to this plain 450 tick chart on the mini Nasdaq (NQ) a 14 period Bollinger Band and10 period simple moving average which is the blue dashed line.
On the charts I have identied the specic Waves 1-2-3-4-5 along with the completion A-B-C patteafter the 5th Wave move. The rule to watch for on the Wave 2 and Wave 4 patterns is as follows:
If Wave 2 is relatively simple then Wave 4 will be complex (and therefore require a bit more patiencin shifting to Wave 5)
If Wave 2 is more of a complex wave then Wave 4 will be simple with Wave 5 coming into play mucquicker.
The above rule, when learning to intraday trade with Elliot Wave, is incredibly valuable, so be sure make a note on your trading desk about this. The Elliot Wave patterns occur over and over in intradatrading of active markets. The patterns will not always complete the full extension of the move, butyou have carefully read the higher time frame charts and they are all one sided then odds are vestrong the pattern will come to full fruition.

8/15/2019 Ultimate Guide eBook
http://slidepdf.com/reader/full/ultimate-guide-ebook 175/218
ultimate guide to trading and investment
17
I highly recommend that you go over 20-50 charts with the same time frame and indicators I showeabove and get really skilled at identifying these patterns. You will be surprised to see how frequentthey occur intraday, giving you the advantage of trading o of them.Once you recognize the E Wavpattern in relation to the Higher Time Frame charts described earlier, you will have an incredibl
advantage in seeing where the market is most likely to go.
Sometimes the pattern will not complete itself and a Wave 4 (or even sometimes an early Wave 3will fail and prices will shift gears.This can be identied when the Bollinger Band level on the Wave or Wave 4 cannot hold the retrace pullback. So always be sure to work a tight stop on the BB pullbacretracement moves.
Here is a classic Elliot Wave intraday pattern on the downside with details describing the move:
Note how on the Wave 2 and Wave 4 reex reversal moves prices ran right to the Bollinger Bandwhile the Blue dashed MA line stayed relatively at on the move. Below is another classic E Wavup pattern:

8/15/2019 Ultimate Guide eBook
http://slidepdf.com/reader/full/ultimate-guide-ebook 176/218
ultimate guide to trading and investment
17
This particular chart is interesting in that it shows the full E Wave pattern completing along with th A-B-C pattern right into the close of the session.Still, because the pattern is so powerful in this casciting a reversal that prices drifted lower into the nal futures close and then lower into the Globesession. Notice throughout these charts also the Candlestick Engulng patterns signaling the en
and start of a new reversal move.
After 25 years of trading I have seen these 6 Essential Ingredients prove to be the most valuabelements of day trading. If you just focus on getting a really tested proven short term time framsystem of day trading and then combine that with the other 5 key ingredients, it will be all you neeto learn. It is not that dicult to learn these ingredients and it will save you many years of going tendless webinars trying to gure out what are the most important things to follow.
If I can be of any assistance in your trading just email me anytime and I will gladly answer anquestions you may have. [email protected]
SPECIAL OFFER
You can nd out more about Mohan’s trading methods and Boomerang Day Trader by visiting hsite - www.BoomerangTrader.com
ABOUT THE AUTHOR
Mohan is a 25 year trading veteran and trading coach for over 14 years in thindustry. He is also the developer of Boomerang Day Trader, which is one o
the top selling day trading software on NinjaTrader. Boomerang is also thrst day trading software to oer a “90% guaranteed winning trade signalscreating an historical precedent in the industry.

8/15/2019 Ultimate Guide eBook
http://slidepdf.com/reader/full/ultimate-guide-ebook 177/218
ultimate guide to trading and investment
17
The Game
It’s natural to approach the markets with a “them vs. me” mentality; to see the market as one thingand yourself as another. The reality is that a “me vs. me” scenario is closer to the truth; the marketare better viewed as a collection of people just like yourself, all trying to squeeze money out of themarkets. In eect, the markets consist of a mass of participants all trying to guess what the mass o
participants will do next.
This could give you a headache just thinking about it.
Of course, not all market activity is speculative. Or rather, not every trade is taken with a view tmaking a prot on that specic trade in that specic market. A trade might be an airline taking ahedge on fuel prices. Other than a massive correction, they won’t care what happens to pricein the short term and they won’t react to short term price uctuations. An arbitrage trade, such aa calendar spread or a NOB spread, also is non-directional for the individual sides the spread isplaced. As long as the spread is widening/narrowing as expected, it doesn’t matter to them if priceare moving up or down.
Some trading is purely speculative. But how much? Well, that depends on the market and it dependon what’s going on that day. There is certainly a lot more speculation in the US Index Futures thanthe US Corn Futures. In markets like the e-Mini S&P 500, the vast majority of trading is speculative
It’s hard to get actual numbers, but my personal estimate is that a minimum of 80-90% of the tradinon the eMini S&P 500 Futures contract is intraday speculation.Each market will dier in this respecand individual days will dier, too. On a day where a government announces it’s going in a newdirection – for example with Quantitative Easing, the amount of longer term speculation will increase
The intraday speculators will be taking a ride with the longer term traders O.R. getting run over bthem because they weren’t informed enough to realize what was going on.
The Market
Some traders like myself play specic markets. Other traders play specic situations (such as stocearnings reports) across multiple markets.Most retail traders lean toward outright trading where yobuy to sell higher later or sell to buy lower later. Situational trading, such as trading stock earningsreports is a popular way to trade. For me, I feel there is too much work to be done in the researchinfor opportunities before the open.
TRADING ON THE SIDE OF STRENGTHBy Pete Davies, Jigsaw Trading

8/15/2019 Ultimate Guide eBook
http://slidepdf.com/reader/full/ultimate-guide-ebook 178/218
ultimate guide to trading and investment
17
I also feel at a disadvantage to people that trade stocks daily that might appear on my radar just couple of times per year. I nd that I spend so much time looking for opportunities; I’m often thewhen the opportunity has passed. Other people thrive in this environment. Specializing in a smanumber of markets is my preference. The decision on which specic markets to trade then come
down to a number of factors:
Is the Market "fair"? We’d be a bit naïve to think that all participants in a market play it straight bwe need to ensure the playing eld is as level as possible so that we stand as good a chance as another speculator. Forex markets are the most fragmented, with exchanges on every street corne Any individual brokerage can quote any price they like, although arbitrage keeps them in line. Stocmarkets are fragmented to a lesser degree and some exchanges are intentionally hidden (DaPools), but overall there’s more transparency than Forex.
Futures markets are traded on a centralized exchange, with all participants able to see the samliquidity and trading activity. This is the most transparent of the markets. Is it rich in informationPrice information is available for all markets. In addition to price changes, many traders asses
changes in volume and liquidity to pre-empt changes in market state. Volume and liquidity informatiois not available for the Forex markets. For stocks it is available (at a cost) with the exception of darpool activity. With Futures, all players can see all of the liquidity, volume and trades. Can I Tradsucient Size? The volatility in the market and the liquidity are key here. If a market only moves ticks a day but you can trade 10,000 contracts, then maybe a tick is all you need. You cannot expeto trap the entire market range each day, so look for a smaller portion of the range and the amouof size you can trade.
You need room to be able to trade now and to scale up. For Forex there is theoretically no limit to thsize you can trade. With stocks it’s down to the individual stock and similarly for Futures, you havto be careful about which one you pick. For my style of trading, Futures markets have a clear edgin terms of centralization and visibility. The eMini S&P 500 is very liquid and you can scale up. Mo
of the trading there is speculative and short term. As a short term trader, I understand my opponenand I can clearly see what they are doing. Armed with that, I am condent that in this market (another Futures markets) I can gauge strength and weakness and look for areas where speculatormay be caught oside.
The Strategy
Short term speculators all have their own ideas about where to get in and where to get out. It’s likeshopping mall full of shoppers; all buying in dierent places. If you mapped out where each shoppin a shopping mall was at any point in time.How would you predict where they would all be in 1minutes time? It’d be impossible… unless you set o the re alarms! Then it’d be fairly predictabl
The markets are the same, people in and out, a directionless herd until there is a trigger that causea directional move that speculators jump on. Often the trigger is a group of traders being stopped oubut the follow through is the herd seeing clear directional movement.
Not only do you then have direction from the herd of new traders perpetuating the move, you also havthe stopped out traders now thinking twice about trading in the opposite direction.The perpetuation a directional move is much easier to predict than the end of a directional move, yet new traders arobsessed with buying the top and the bottom of a move.

8/15/2019 Ultimate Guide eBook
http://slidepdf.com/reader/full/ultimate-guide-ebook 179/218
ultimate guide to trading and investment
17
Buying the low of the day and selling the high of the day. This obsession is what blows peopleaccounts. The trouble is that in some cases, the market is in a range. Then the trade IS to fade thextremes. When the market is in a trend, the trade is to trade with the trend.
So you employ the complete opposite strategy for the 2 basic states of the market.
So we start our strategy with 2 simple rules.
1 – Fade Ranges
2 – Take continuation trades of intraday trends
The Tools
In this article, we will focus on using Swing Charts to dene areas to trade. In my trading, I put heavemphasis on using Order Flow to rene the entry. For most people Order Flow acts as icing on you
trading cake. For now, let’s just focus on getting the cake – implementing a protable trading setuthat can be rened later with a little Order Flow icing.
Image 1 – Swing Chart
Most trading platforms have a swing indicator. The above is a 900 tick chart of the eMini S&P 50March 2015 contract. The image is from February 15th 2015 (this is the chart at the time of me writinthis article). The action to the left of the vertical black line is Friday the 13th's trading.
The swings in this case are colored red and blue. We can also see the number of ticks moved in swing and the total volume in that move.
Red A downswing with more volume than the prior upswing OR an upswing with less volume thathe prior downswing.
Blue An upswing with more volume than the prior downswing OR a downswing with less volume thathe prior upswing.

8/15/2019 Ultimate Guide eBook
http://slidepdf.com/reader/full/ultimate-guide-ebook 180/218
ultimate guide to trading and investment
18
As long as the volume is greater on the moves up, the swings will be blue. Vice versa for reds. Anthat’s all we will use. We are not interested in any indicators, in fact, we are not interested in thindividual price bars at all. Let’s consider those individual bars the points at which our shoppers aall buying in dierent places. We are just interested in the turning points, the points at which the
alarms went o. As mentioned earlier, I tend to stick to few markets. That means I get to know thewell. So I can tell you that the number of contracts in that rst blue swing, 103 thousand contractswell, it’s a lot for that market.
It’s a lot relative to the other moves on that day and it’s a lot relative to moves on any other day, toThis means a lot of people are jumping on that move. Many of them will be short term speculatorsThat means you do NOT want to jump in front of that move and short it. We moved up 25 ticks o103 thousand contracts volume. With any move, people have to actually close the position in ordeto exit. On the way down we had selling. Anyone that is short needs to BUY in order to take protsSo as we move down, we are gathering future buyers.
When we see a big surge like this we can conclude that late shorts got stopped out. We can als
conclude some shorts took prots and took part in the buying. There’s probably some that shorteand didn’t sell yet and are regretting it. So there are people who shorted and lost and others thshorted and took prots. Will they now short again after this move up? Most likely not in the shoterm.
New long positions at this point are pretty happy. So if we look at the balance of future trading in thshort term, it’s imbalanced to the buy side. After the initial push up from the lows, we moved bac9 ticks on just 17 thousand contracts. That’s actually less volume per tick on the way down. Thmight make you think that this is actually weak because of the relatively small number of contractfor each tick down. What’s also interesting is that the pullbacks are of equal size. Both pullbackare 9 ticks. Bear this in mind because it happens a lot, as we move down we’ll have uniform swinsizes and then as we move up, we get the same size swings. We cannot expect the pullbacks to b
EXACTLY the same size. In fact, the more volatile the market is, the more variation we can expecin the swing sizes.
Image 2 – Upswings – 12th February, 2015.

8/15/2019 Ultimate Guide eBook
http://slidepdf.com/reader/full/ultimate-guide-ebook 181/218
ultimate guide to trading and investment
18
In this image, we can see there are 4 ticks variance between the smallest and largest pullbacks othe way up. Compare that to variation to the upside. This is fairly normal. So for trends, we need trecognize them and we also need to be able to recognize choppier, more range-bound markets.
Image 3 – Rangebound start – 12th
February, 2015
We can see the open of the market on the left. We give ourselves and our competitors in the markea ‘mental reset’ each day and in this case, that’s at 9:30AM EST. At the open, we rst give some timto allow the market to show its hand.
We started o with some weak moves to the downside and then we had a move up with volume thawas decent. 63 thousand contracts and 27 ticks. Denitely a move you could jump on to the lonside. The next push up also had good volume but we only gained a few ticks. We didn’t really makany headway. That’s OK but then the next move down was larger than your ‘average’ pullback anhad decent volume. This is indecision.
Right from the open it’s not clear who is in control or which side the volume is on. Buyers did appeato take control with that 63k push up but there was no follow through. It wasn’t until we got that pusup on the right side (167k, 31 contracts) that one side came in with overwhelming volume. Image shows what occurred afterwards. Some ranges are easier to spot than others.
Image 4 – 27th January, 2015 – Rangebound behavior at the open
In this example, we see a very indecisive market, right from the open. Swinging this way and that wawith no real clarity regarding which side the volume O.R. swing size is on. In this example, it’s alsfairly clear where you could fade the trading range. It is also clear how attempting to trade pullbackin the market would be destructive to your account.
In the end, we had a breakdown. As a range develops, we build positions on both sides – long anshort. Eventually, the range breaks and one side loses out. So we get an extended push away fromthe range on good volume. But we also have one side of the market happy and one side licking thewounds. This is important in the short term because it has a psychological impact on the behalf oboth the winners and losers.

8/15/2019 Ultimate Guide eBook
http://slidepdf.com/reader/full/ultimate-guide-ebook 182/218
ultimate guide to trading and investment
18
The Rules
Putting this together requires you to know your market. That’s simple enough in itself because yocan go back over historical charts, look at the swing sizes and what sort of volume tended to mak
your specic market move.
Market Mode
Your rst task is to dene which mode the market is in. Is the market in a range or is it trending? it a range with lower volume moves and no clear advantage on either side? Caution must be takewhen ‘with trend’ moves don’t push price forward a signicant amount.
Range Plays
Once you have established that the market is in a range, look to use the volume prole for the day determine where the most volume sits within the range.
Image 5 – High Volume in an early trading range on 12th February, 2015 (Jigsaw DOM)
The volume prole (total trades at each price) is in the far left column. As you can see we havvolume tapering towards the outside of the range, the high volume area is where the bulk of thpositions are (the yellow box).
In this case, the range on the chart will be 2071.75-2076. Your chances of getting lled on a shotrade at 2076 are extremely low. Look to enter at the extremes of that high volume area.
8/15/2019 Ultimate Guide eBook
http://slidepdf.com/reader/full/ultimate-guide-ebook 183/218
ultimate guide to trading and investment
18
Strategies
1- If the range forms AFTER an intraday trend, there is a good chance price will continue thatrend. So if the market moves down and consolidates, you can sell the top of the range an
scale o some of the position at the bottom of the range and hold the rest for a breakdown.
2- Fade both extremes of the range. This is one of the main ‘bread and butter’ trades for scalpersIt’s moving in and out of the market fairly quickly.
Ranges do not last forever, so it’s essential to exit these range trades quickly if it appears the range ifailing. Order Flow will help to keep you onside with ranges but I would advise also using Order Flowto pre-empt the range failing against you. It is imperative that you exit the market before the otherange traders get stopped out. If you don’t, you get caught on the wrong side of a stop run and thacan put you in ‘catch up’ mode for the rest of the day.
Intraday Trend Plays
Many traders want to buy the low of the day and sell the high of the day. Good luck if you can do thaIf the market is range bound, then of course it is the correct strategy. Intraday trends continue mucmore often than they reverse. Many traders will see a market trend up and then start looking for shorting opportunity, then as soon as it starts trending down they start looking for a long opportunityalways getting stuck on the wrong side of the market.
At Jigsaw, we call these people ‘permafaders.’ To avoid being a permafader, set a bias and stick witit until you get evidence the market has shifted in the opposite direction.
Setting Your Bias
When the market opens, look for a strong swing with good volume. If you don’t get it, wait for it or foa range to develop. If a range develops, look for the breakout with good volume to initiate the trendOnce an intraday trend is established, the next trend will usually establish itself with a countertrenswing with overwhelming volume and a relatively large swing size in the opposite direction. Oncyou have one of these, presume a new trend until proven otherwise. Don’t worry if the market didnpullback yet or if it pulled back 20 times, stay with that trend until you get the volume/size in theopposite direction.
Trend Plays
Once you have your bias, you look for a weak move in the opposite direction, a pullback. It will below in volume and relatively small. From an Order Flow perspective, there will be little interest, low
participation. Often an iceberg order will stop the pullback and often the counter-trend traders wisimply disappear.
All markets are dierent but the eMini S&P 500 will often put in 3-5 tradable intraday trends. Thsecond trend will often have the same size pullbacks as the rst trend. So you may see the rsintraday trend put in 11-14 tick pullbacks and see the same thing as it moves in the opposite directionThat is not magic, just a measure of volatility.

8/15/2019 Ultimate Guide eBook
http://slidepdf.com/reader/full/ultimate-guide-ebook 184/218
ultimate guide to trading and investment
18
Strategies
1- If the average pullback was 10 ticks, look to fade that pullback before the 10 ticks. If thmarket puts in a 10 tick pullback, it may only trade 100 or so contracts at the 10th tick and yo
may be right about the location but you will not get lled on a limit order entry. So enter a ticor 2 ahead of it.
2- Wait for some ‘with trend’ interest. So instead of entering ahead of the estimatepullback, wait for some ‘with trend’ traders to move the market your way a few tick
This gives you additional conrmation that the pullback is over but you do have to be quicit may start to move quickly with trend when the permafaders realize they are going to gstopped out.
I utilize order ow to tell me when a pullback has ended. This is worth looking into and will yield extticks but is not absolutely essential from the start.
Get the overall method right rst. Then rene it with order ow. In terms of exiting a losing tradeas soon as you see evidence of decent volume coming in or the pullback has put in an abnormnumber of ticks move, it’s time to get out.
It’s actually in this area where the Order Flow will help the most because you will SEE the tradecoming in to push against the trend. You can often get out before the price has been adverseimpacted by that Order Flow.
Conclusion
Using swing charts will put you on the right side of the market and give you a heads up as thmarket shifts from trending to consolidating. This is a discretionary trading method, but the number components you are using to make the trading decision is small. There is no ‘analysis paralysis’ her
You are trading based on market participation and your knowledge of how speculative tradeoperate; after all, YOU are a speculative trader .
These methods can also be added to your existing trading techniques, implementing what we havtaught about swing sizes and participation in turns, you can use these techniques to help keep yoonside within your existing trading framework.

8/15/2019 Ultimate Guide eBook
http://slidepdf.com/reader/full/ultimate-guide-ebook 185/218
ultimate guide to trading and investment
18
THE MOVIE
As mentioned, this doesn’t have to be the only tool in your trading toolbox. If you’d like to see howanalyze the market personally using Swing Charts in real time,
TAKE A LOOK AT THE FULL VIDEO SHARED HERE!
In the video, you will see me describing the action as it unfolds looking at the swing charts, correlatemarkets and the market Order Flow.
THE SPECIAL OFFER
For those of you who would like to move their discretionary trading to the next level, utilizinthenumber 1 trading software according to the independent review site Investimonials.com
PLEASE CLICK HERE for more details.
ABOUT THE AUTHOR
Peter Davies entered the world of trading in the mid 2000’s. After becomingdisillusioned with the results attained by fund managers and nancial advi-sors on his own portfolio, Peter gured that even losing money himself wouldbe better than paying someone to lose it for him.
Peter’s initial intent was to focus on investing and, in fact, he still manages h
own long term portfolio. Somewhere along the journey he developed a passiofor day trading. Peter feels most comfortable trading the “here and now” anfeels that he has a better feel for what will happen in the next six minutes thathe next six months.

8/15/2019 Ultimate Guide eBook
http://slidepdf.com/reader/full/ultimate-guide-ebook 186/218
ultimate guide to trading and investment
18
A Trading Challenge
I had a lot of fun with this assignment, so kudos to TradingPub for organizing this eBook! Thexercise forced me to really think about the function of every indicator I use. Now, as I dive into th
fun exercise, I am making the assumption that I am still allowed to use traditional price charts alonwith the one indicator I select.
I personally consider price charts to be an indicator themselves. Many traders choose only to tradwith price charts and nothing else. Unlike these traders, I am absolutely convinced that I can gleamuch more information about a market by displaying my indicators compared to only reading a pricchart. It therefore goes without saying that I am a fan of using indicators to compliment price chartlike the one displayed below of Apple.
OHLC Chart of Apple (Monthly) using Tradestation
Also, let’s not forget that there are many types of price charts. There are OHLC (Open High LoClose) bar charts, Candlestick Charts, Point & Figure Charts, Kagi Charts, Tick Charts, Range BCharts, and Renko Charts, to say a few. With respect to the rules of this assignment, I will utilize boOHLC bar charts along with candlestick charts.
If I Had to Choose Only One
Indicator to Trade WithBy Mark W. Helweg, Value Charts

8/15/2019 Ultimate Guide eBook
http://slidepdf.com/reader/full/ultimate-guide-ebook 187/218
ultimate guide to trading and investment
18
My Background
I was a mechanical engineering major in college. As an engineer, I had to use every advantagecould within the context of the rules established by my professors to pass certain classes. This wa
good practice for my trading career, which also demands that I utilize every edge I can when tradinthe markets. In my senior level Controls class, engineering students were given the ability to write amany formulas on a single “cheat sheet” paper that we could (front and back).
My cheat sheet looked very similar to the one below. It felt like I was writing in size 2 font as I laboreto ll my sheet with as many formulas as possible. In some ways, this assignment is similar to mcheat sheet exercise in college. When limited to the tools (or formulas) you can use, you muschoose wisely.
Example Engineering Cheat Sheet (Source: Google Images)
Needless to say, if I failed to include a key formula on my cheat shee
I would have been in real trouble. I actually had a fellow engineerinclassmate show up to the test not knowing that he could have a cheat sheeas a reference to help him take the test. What a catastrophic oversight!
When the realization hit him that he had no chance of passing the teswithout this vital “encyclopedia of formulas,” his head hit his desk as hresigned to failure. Indeed, he had no chance of passing the test withouthis critical reference tool. Similar to my engineering classes, it is criticathat traders use every edge or advantage they can (within legal limits) ttrade protably in the markets.
This eBook is challenging me to nd that one indicator that would give me the greatest ability to
achieve protability in the markets. It is therefore critical that this one indicator I select communicatas much useful information about what a market as possible.
My experiences from the challenges associated with my engineering background will certainly helme with this indicator exercise. Now, I am admittedly a huge indicator nerd. I have spent the bettepart of the past several decades developing trading indicators and quantitative nancial models fomy personal trading and for hedge funds.
After twenty-ve years of developing and collecting market indicators, it is safe to say that I have large indicator library to choose from. However, trading involves more than just possessing indicatorsWe must understand how indicators t into a plan to trade the markets protably.
How I Approach Trading
I know we live in a world where many investment advisors try to make trading or investing in thmarkets seem mysterious or sophisticated. Many do this so that you will come to believe that yoneed their services. Now, admittedly, trading or investing can be challenging and trading or investincan be sophisticated. But in generally, trading does not have to be complicated.

8/15/2019 Ultimate Guide eBook
http://slidepdf.com/reader/full/ultimate-guide-ebook 188/218
ultimate guide to trading and investment
18
I prefer to approach trading in a very simply way by compartmentalizing the way I approach tradininto three areas. These primary areas are as follows:
1. Forecast
2. Setup
3. Signals
Forecasting relates to longer-term market analysis, involving either technical chart analysis ofundamental analysis.
Setups relate to identifying certain conditions or chart patterns that suggest that there is a higprobability of a market either going up or down in the immediate future.
Signals involve the strategy that a trader employs to determine where to enter a market, where to ex
a market given a protable trade, and where to exit a market given a losing trade (risk managemen
By combining eective forecasting with the ability to identify statistically attractive trade setups, trader can dramatically increase the odds for success. Furthermore, traders tend to have the modiculty with identifying where to enter trades and where to exit trades. The worst thing to do trading is exactly what most traders do, which is let emotions get involved in making trading decision
I am a huge advocate of using rule-based logic to manage trading signals and stop loss placemenlevels. By using rule-based logic, traders can remove “toxic” emotions from their trading and let proveindicators or trading systems guide where to enter and exit markets. I have learned both througpersonal experience and through empirical research that successful trading involves removing thinuence of emotions on making trading decisions.
Emotions such as Greed tend to drive traders to enter markers at overvalued price levels where risis elevated and where prot potential is reduced. Emotions such as fear tend to cause trader to wato get out of long positions when markets are oversold and are likely to bounce back. Greed and fehave no place in successful trading.
Now that you understand how I approach trading, you will better understand my approach to identifyinthe best trading indicator to trade the markets.
The Role of My Indicator
My assignment in this eBook is to select only one trading indicator to trade with. I am to assume th
I am stranded on a desert island with only one trading indicator. Therefore my rst task will be understand and clarify the role of this one special indicator.
In the previous section, I outlined my approach to trading, which involves Forecasts, Setups, anSignals. The rst thing that I must do is determine which of these areas I want my indicator to heme with. Do I want to select an indicator to help me forecast long-term market direction? Do I wamy indicator to help me identify high probability trade setups? Or, do I want my indicator to help midentify trading signals; where to enter and exit trades?

8/15/2019 Ultimate Guide eBook
http://slidepdf.com/reader/full/ultimate-guide-ebook 189/218
ultimate guide to trading and investment
18
The rst thing I must do is to establish what I can reasonably expect my charts to do for my tradingMy indicator needs to compliment my price chart. As it turns out, many of the strategies that I emplofor forecasting prices utilize long-term chart patterns. This means that I can use my price charts ithis area.
Crude Oil Monthly Wedge Pattern using Tradestation
A recent example of forecasting long-term price moves unfolded in the Crude Oil market. For thosof you who have followed my Crude Oil analysis, you know that I have been talking about the facthat Crude Oil has been in a massive pennant pattern on monthly charts (reference the Crude Ochart on previous page).
I have discussed how Crude Oil is likely to experience a massive move in the breakout direction onca breakout from the pennant pattern is conrmed. Just recently, Crude Oil broke out of the bottom o
this massive pennant pattern, which I then predicted would cause Crude Oil to most likely trade dowto $50 per barrel. Crude Oil did end up braking hard to the downside and did achieve its downsidtarget of $50 per barrel.
Because I can eectively use price charts to help with market forecasts, I do not need to select mindicator to ll this role in my trading. I now have to determine if I want my one indicator to ll a rolin nding quality trade setups or for identifying trading signals – where to enter and where to exmarkets. This is where things get a little trickier.
The Three Components of Price Analysis: Cost
Before I continue, it is important that we understand what type of information we want to derive froman indicator. When we think about price analysis for any market, we can organize our price analysiinto three components.

8/15/2019 Ultimate Guide eBook
http://slidepdf.com/reader/full/ultimate-guide-ebook 190/218
ultimate guide to trading and investment
19
They are as follows: Three Components of Price Analysis
The rst component of price analysis relates to Cost (or Price). Becaus
we tend to use price and cost interchangeably, I will use the term “pricto represent “cost.” I am doing this because the investment world refeto cost charts as price charts.
Although price charts are essentially plotting the cost history for security or nancial instrument, cost charts would actually be a moaccurate descriptor of these charts. However, in the spirit of keepinindustry terms consistent with how most of us use them, I will use priccharts to represent cost charts.
Price charts are the most widely used market analysis tool in the investment world. They apowerful tools because they communicate a tremendous amount of information about a market in
condensed picture format.
The saying still holds true that “a picture is worth a thousand words.” Price charts show us whemarkets have been historically and where they are trading now. Price charts communicate shoterm and long-term market trends, historical trading ranges, and support and resistance levels, name a few functions.
Because I am operating under the assumption that I will have access to price charts along witmy one indicator, I have the costs component of my market analysis covered. It is important understand that price charts, or cost charts, are not designed to communicate information abovalue or momentum.
The value and momentum components of price require indicators designed to communicatinformation about value and momentum for a particular market. Traditional price charts were nevdesigned to do this by themselves nor are they capable of doing this eectively.
The Three Components of Price Analysis: Value
Many traders are not accustomed to thinking about Value as part of price chart analysis wheevaluating markets. This is unusual given that value plays such an important when making signicapurchased outside of the markets.
The dierences between non-centralized markets and centralized markets are the primary culprit causing confusion with many traders in this area.

8/15/2019 Ultimate Guide eBook
http://slidepdf.com/reader/full/ultimate-guide-ebook 191/218
ultimate guide to trading and investment
19
Google Chart with ValueCharts® Price Window using Tradestation
Most traders would never purchase a used automobile (free market example) without checkinan industry value reference like Kelley Blue Book or Edmonds. Yet, when it comes to trading thmarkets, traders have historically been completely lost when it comes to value.
This is primarily due to the fact that there has historically been no Blue Book for the markets thaallow traders to check for a value reference. However, this has changed. Now, with the developmeof ValueCharts® (www.ValueCharts.com), traders can see if a market is overvalued, undervalued, otrading at fair value.
Learning to read a ValueCharts® Price Window is fairly simple. Similar to most indicators, ValueCharPrice Windows share the same time axis as traditional charts (see below). Traditional price chartcommunicate information about “Cost” and ValueCharts® Price Windows communicate informatio
about “Value.”
Price Chart over a ValueCharts Price Window

8/15/2019 Ultimate Guide eBook
http://slidepdf.com/reader/full/ultimate-guide-ebook 192/218
ultimate guide to trading and investment
19
ValueCharts® are easy to use. Note that there are a total of ve colored valuation zones in ValueCharts® Price Window.
The green valuation zone represents fair value, the two yellow valuations zones represent moderate
overvalued (top yellow zone) and moderately undervalued (bottom yellow zone), and the two revaluation zones represent signicantly overvalued (top red zone) and signicantly undervalue(bottom red zone). The ve valuation zones are labeled in the following ValueCharts® Price Window
ValueCharts® Price Window with Valuation Zones
It is important to note that some ValueCharts® Price Widows display the valuation zone colors as bsegments instead of color bands like the chart above.
This variation is related to the trading platform graphics capabilities and limitations. Howeveregardless of this settle dierence, the ValueCharts Price Window functions the same across aplatforms.
The Three Components of Price Analysis: Momentum
Momentum indicators have been around for many years. Momentum is thought of as the velocity price for a particular market. There is no need to go into too much detail as most traders are familiwith momentum indicators. The Google chart below displays my favorite momentum indicator, MMomentum (developed by www.ValueCharts.com). Because most momentum indicators tend to bsimilar, I will not spend a lot of time discussing momentum. It is important to note that momentum is
very important component of market analysis. Therefore I always like to have a momentum indicaton my charting screen. However, given the limitation of only being able to select one indicator, I wnot select a stand-alone momentum indicator for this exercise.

8/15/2019 Ultimate Guide eBook
http://slidepdf.com/reader/full/ultimate-guide-ebook 193/218
ultimate guide to trading and investment
19
Google Daily with MQ Momentum using Tradestation.
Choosing My One Indicator (ValueCharts®)
It goes without saying that the one indicator I choose can either give me an edge over other traderor put me at a disadvantage against the market. Therefore I must choose wisely in order to givmyself the greatest edge I can.
I am left with selecting an indicator to either help me nd quality setups or to identify entry and exsignals in the markets. Now, I will be the rst to say that I always trade with more than one indicato
because I have found that I can gain a stronger edge by combining complementary indicators wheanalyzing markets.
After much reection, for the purpose of this assignment, I decided to select an indicator to heme nd quality setups because I can use my experience to leverage price action on bar charts tgenerate entry and exit signals. I thought that I could realize the greatest benet by having a qualitindicator help me nd high probability trade setups.
Getting back to the three components of price discussed in the previous section, I already describehow a traditional price chart would communicate the cost history for a market, so I do not neean indicator to serve this function. For me, it really comes down to deciding between value anmomentum indicators.
What if there was an indicator that could communicate both market valuation for a dened timeframand, at the same time, also communicate momentum information as well? As it so happens, there is aindicator that can communicate market information about both value and momentum. This indicatois called ValueCharts® Price Window. Now, this is not to be confused with other ValueCharts® toolike ValueBarsSM and ValueLevelsSM. The ValueCharts® Price Window is the agship ValueChartsindicator. It is also very easy to read.

8/15/2019 Ultimate Guide eBook
http://slidepdf.com/reader/full/ultimate-guide-ebook 194/218
ultimate guide to trading and investment
19
In order to provide full disclosure, I am the inventor of ValueCharts®. I am not selecting this indicatfor that reason. That would be foolish. I am selecting the ValueCharts® Price Window becauseserves a powerful purpose that other indicators simply cannot serve.
The ValueCharts® Price Window allows me to see, in real-time, the exact valuation zone that market is trading in. This helps me nd high quality trade setups and helps me nd price levels wheI could enter low risk trades and or avoid entering high risk trades. In the next section I will discusseveral ways I use the ValueCharts® Price Window to trade the markets.
Trading with ValueCharts®
I have selected the ValueCharts® Price Window as my single indicator because it communicateinformation about both value and momentum. I will begin discussing a number of powerful setupscan identify with this super indicator.
Bullish Divergence Setup
Google Bullish Divergence Identied with ValueCharts® using Tradestation
In the chart above, we can see that Google has reached a new low at the bar labeled 1a. Theover the course of the next several trading days, Google bounced back before selling o again anreaching a new low at point 2a.
This is where the ValueCharts® Price Window can be extremely powerful. Note at point 2b thValueCharts price bas are higher than the ValueCharts price bars were at point 1b. This is in light prices reaching new lows at point 2a (compared to prices at point 1a).
Notice also (in the chart below), which is now displaying candlestick price bars, that a bullish hammpattern appeared in the white box on the candlestick chart? Even more signicant is the fact that thValueCharts Price Window shows the same price bar to have a lower red bar segment? This bottored bar segment (enclosed in the white box in the chart below in the ValueCharts Price Windosub chart) communicates that this price bar traded within the signicantly undervalued zone, whicrepresented extreme undervalued conditions.

8/15/2019 Ultimate Guide eBook
http://slidepdf.com/reader/full/ultimate-guide-ebook 195/218
ultimate guide to trading and investment
19
Google Daily with ValueCharts® and Bullish Hammer Candlestick Pattern using Tradestation
With the combination of the bullish divergence and the bullish lower red tip price bar in the ValueCharPrice Window (ValueCandles are not covered here, but they are a combination of candlestick patternand ValueCharts®), we can now look to buy Google.
Because the hammer candlestick pattern presented itself, we can now employ a simple yet powerfstrategy of buying the open of the next price bar and placing our sell stop below the low of thhammer candlestick pattern. Reference the chart below for trading strategy entry signal and risstop placement.
Google Daily with ValueCharts® Entry Level and Risk Stop Level using Tradestation
In the chart above, our entry signal would have been at $498.84. We also place our risk sell stop $487.56, risking a little over $10 per share. Now that ValueCharts® has helped us buy Google at very attractive price level, we need to strategize about where to exit this new long position.
Because I do not have use of my traditional indicators like Hedge Fund Trader or Intelligent BreakouI am going to simply move my trailing exit sell stop right below the lowest low of the previous twprice bars.

8/15/2019 Ultimate Guide eBook
http://slidepdf.com/reader/full/ultimate-guide-ebook 196/218
ultimate guide to trading and investment
19
In this case, this would have exited my long position at $529.67 on January 27, 2015 (reference thchart below). This trade generated a little more than $30 per share, which is great. Because I haa bullish candlestick pattern to conrm the timing of my bullish divergence, I strengthened my bullisdivergence setup.
This trade showcases the power of a simple breakout exit strategy in conjunction with a bullish tradsetup. I am not a big fan of trading breakout strategies all of the time when trading markets. Howevewhen used with high probability trade setups, breakout strategies can be extremely eective.
Google Daily with ValueCharts® Trade Entry and Exit using Tradestation
Extreme Value Setups
Sometimes in the context of a longer-term timeframe (weekly or monthly charts), a market trading either the signicantly undervalued zone or the signicantly overvalued zone can represent a gootrade setup.
When looking at Apple during late 2012 through 2013, we can see that the weekly ValueChartsPrice Window registered a number of signicantly undervalued points (red bar segments on thValueCharts® Price Window) that coincided with cycle lows. In fact, these signicantly undervaluebar segments coincided almost exactly with cycle lows (reference the weekly Apple chart below).
Without seeing the value component of Apple by way of the ValueCharts® Price Window, we wounot have detected that Apple was trading at signicantly undervalued during those ve cycle bottomBut because I had ValueCharts® on my chart window directly below my weekly price chart of Appl
I was able to see these extreme value setups in real-time. Again, these signicantly undervalued bsegments proved to be the exact cycle bottoms in Apple.

8/15/2019 Ultimate Guide eBook
http://slidepdf.com/reader/full/ultimate-guide-ebook 197/218
ultimate guide to trading and investment
19
Apple Weekly with ValueCharts® Signicantly Undervalued using Tradestation
Now, when trading longer time frame setups from weekly price charts, I always drill down to a shorte
timeframe to execute my signals. In this case, I use daily price bars to manage my entry and exsignal logic. Similar to the previous example, I use a two bar breakout strategy to both enter and exmy trade.
Apple Weekly Chart with ValueCharts Trade Setup using Tradestation
Using a simple 2 bar breakout in the context of the bullish weekly Apple setup, a buy signal (breakouabove highest highs of previous two bars) was generated at $66.17. Then, after Apple rallied foseveral days, an opposite sell exit signal was generated at $68.94 using a breakout of the two ba
lows. This resulted in hypothetical prots of approximately $2.70 on this trade (reference the chabelow).
There are many more ways we could generate trading signals if we were allowed to have more thaone indicator. However, in this case, using a simple breakout strategy is eective in realizing protof several dollars per share. The trade exampling the chart below utilized the last extreme valusetup (signicantly undervalued setup) occurrence on the Apple chart above to demonstrate how thtype of setup could be traded.

8/15/2019 Ultimate Guide eBook
http://slidepdf.com/reader/full/ultimate-guide-ebook 198/218
ultimate guide to trading and investment
19
Apple Daily with Breakout Trade Entry, Stop, and Exit using Tradestation
This chapter barely scratched the surface about how ValueCharts® can be used to nd higprobability trade setups. There are many, many more examples that could be discussed if we hause of additional powerful indicators.
At a minimum, ValueCharts® is a tool that no trader should be without (in my humble opinion) becausvalue is such an important part of any signicant purchase or sale.Thank you for allowing me tshare several powerful trading examples that showcase one of my favorite indicators, ValueCharts®
Good luck trading!
Mark Helweg
THE MOVIE
See this quick overview of our services here. WATCH THE MOVIE HERE
THE SPECIAL OFFER
For more information about ValueCharts® indicators or how to trade with ValueCharts® sign up fotheir upcoming workshop “Strategies for Maximizing Prots and Minimizing Loss w/ Mark Helweg
GET YOUR SEAT RESERVED HERE

8/15/2019 Ultimate Guide eBook
http://slidepdf.com/reader/full/ultimate-guide-ebook 199/218
ultimate guide to trading and investment
19
ABOUT THE AUTHOR
Mark Helweg began his trading career as a runner on the oor of the ChicagBoard of Trade at the age of 19. When he turned 21, he leased a seat on th
oor of the exchange and traded in the Treasury Bonds pit for a brief timeMr. Helweg then returned to school to complete his degree in mechanicaengineering with a minor in statistics.
While in school, Mr. Helweg developed trading models for a large CommoditTrade Advisor (CTA). In addition, while in school Mr. Helweg also develope
the rst algorithm to model price in terms of objective value known as ValueCharts®.
Over the past 18 years Mr. Helweg has developed quantitative nancial models for several CTAsHonors and awards earned by these CTAs include Top New CTAs Group (Futures Magazine 1998MFA Star Search (2003), and MFA Star Search (2008). Mr. Helweg released his rst book, “DynamiTrading Indicators,” with the John Wiley Marketplace Series.
This book was recognized among the “Best Investment Books of 2002″ by Barron’s magazine. MHelweg was awarded a patent for his ValueCharts® concept with the U.S. Patent and TrademarOce in Dec 2008.
Recently, Mr. Helweg founded a new nancial technology company, MicroQuantSM, that now featurevalue-based market analysis tools on the Bloomberg terminal platform worldwide. Mr. Helwenow speaks around the country about trading technology and technical analysis applied to StocksFOREX, and futures markets.

8/15/2019 Ultimate Guide eBook
http://slidepdf.com/reader/full/ultimate-guide-ebook 200/218
ultimate guide to trading and investment
20
Learning how to trade doesn’t need to cost thousands of dollars
Like you, I’ve read a lot of books. I’ve attended many seminars and workshops. I even went on aexpedition looking for the Holy Grail to trading. It took time, but now I’m at a point where I’m condein my trading and am able to oer you this step-by-step guide.
In this chapter, you will be ready to envision a life where trading can be a reality to make a livinLike you, when I started to trade, I envisioned a life of waking up in the morning, putting in a couptrades and going golng the rest of the day. Far from that reality, but it can oer everything from somsupplemental income to making a living. Perhaps you may even take your earnings from the shoterm and invest for the long term,
Either way, it will take time to be a successful trader. Just because you read this chapter and yolearn to apply it doesn’t make you a successful trader. The TradingFibz website and resourceincluding this e-Chapter is a straight to the point, rudimentary approach to what it takes to becoma trader with minimal indicators and after hours work. This is a guide, and its purpose is to do juthat – guide you.
Pick a method, keep it simple and learn it well. Trade 1 or 2 stocks/futures and learn thepersonalities. My hope is to bring investing knowledge to many more and make it as easy as possibto comprehend. I hope you will nd something in this chapter that is useful and tell a friend or two especially if they are new to investing or trading. It takes time, but with a little help and guidance, yocan do this.
I have had the extraordinary experience of teaching middle and high school students about thstock market, including participating in three years of stock market simulations where applyinthe Fibonacci patterns took 19 awards back to their school. This preceded my three year experiencas a state Stock Market Game Coordinator. I have taught many workshops, spoken to numerouinvesting groups so whether it is adult or students, it’s all about the opportunity of awareness in oneinvestments.
With all this invested time, I am now and still an inspiring day trader as well as value investor. Takinhome $100 a day in the market can be $2,000 extra a month you didn’t have. Sure, I hear of peopmaking $4,000 a day – I also hear of those losing $4,000 a day. The question is not why did you makor lose so much – it’s how did you manage your trade or investment, how “greedy” did you get anlose it, and did you have a stop loss in place?
Trading the TrendsDavid Katz, TradingFibz LLC

8/15/2019 Ultimate Guide eBook
http://slidepdf.com/reader/full/ultimate-guide-ebook 201/218
ultimate guide to trading and investment
20
I don’t lay claim to any NEW Grail of trading. I simply have gathered the tools that work besfor me.
Let me share with you through this e-Chapter, a step-by-step guide without all the theory and hundred
of patterns to learn, a simple and protable way to trade the market.
Successful Trading
Many traders want to be told when to enter trades and when to exit or even shadow trade. As JessLivermore said it best in “Reminiscences of a Stock Operator”: “The average man doesn’t wish to btold that it is a bull or a bear market. What he desires is to be told specifcally which particular stocto buy or sell. He wants to get something for nothing. He does not wish to work. He does not evenwish to have to think.”
Many of the indicators today are written so that a green light means in and red arrow means ouleaving the automation to the machine. Even airplanes today are so automated they almost leav
the ying to a computer. As traders, we may have the automated systems in place, but as “crumtraders” we are at the whim of watching what is in front of us on our screens and making informeddecisions of when to enter and exit. You may be a subscriber to that service, but in the tradinphilosophy of TradingFibz, if you know one thing and know it well, you will prot in the marketMultitasking is not conducive to success in trading the markets. The brain is actually not wired tmultitask while we have convinced ourselves of that. Successful trading is a mindset that if followedcan lead to becoming a master trader.
No one can guarantee your success in trading. Those who follow a detailed plan will have thegreatest chance of making it as a successful trader. Here are some personal lesson and tips that have developed as a trader and gained insight from others.
• Remove emotion from your trading and this will allow you to detach from the fear of losingmoney.
• Execute your trades with discipline each and EVERY time.
• You will fail if you don’t follow your trading plan and trade on gut – oh, the market has got wrong!
• The market doesn’t owe you anything so be patient and you will be rewarded
• Trade less than hitting the button all day. Wait for your setups will make you a more protabltrader. It may take all day for your setup, but follow your rules.
• Everything looks great. The setup is perfect. You enter the trade. It goes the other direction
This will happen – Have a plan and follow it.
• Trade your setups, not the money. You may even want to hide your Prot and Loss tickewhen in the trade.
• You will lose money sometimes so accept small losses. Key is to minimize the risk.
• Blame yourself, not the market – oh this is a big one…who are you mad it? You have completcontrol over how quickly you exit or hold on to your trade. Let’s not forget…how quickly yo

8/15/2019 Ultimate Guide eBook
http://slidepdf.com/reader/full/ultimate-guide-ebook 202/218
ultimate guide to trading and investment
20
cut your losers. In other words, DON’T move your stop.
• Becoming a protable trader day after day, week after week, is the result of many years experience
• If you really like trading, keep working and learning every day from it– it is the extra hourshave put in that has made me a better trader.
• KISS - Keep it simple! I use limited indicators. My screens aren’t overwhelmed with lines aover the place.
• As always…Plan your trade and trade your plan.
• While the setups outlined in this e-Chapter are for the futures, the setup principles can badapted to t all markets.
• Market will always go up and down. While your trading plan may be hoping for up, always bready for the other direction.
•
Trade the trend. The run is longer and the TradingFibz tools will keep you in the trade longe• Previous support lines become new resistance ones and vice versa. Have those lines on yo
chart.
• There will ALWAYS be another trade, remain patient. As Ben says, “New day, Fresh start.”you didn’t get it today, it may be there tomorrow.
• The prepared trader has the greatest chance for success – do you have a trading plan?
• The space to the right is always blank - No one is capable of predicting market moves.
• Always continue to learn, recap, blog. Review your trades of the day
• Don’t chase trades – you walk away and come back and the setup already occurred. Wait fanother setup.
• Don’t let your winning trade turn around on you and become a loser.
• Don’t add to losing trades
• You wrote a trading plan. Just this once you’ll try something dierent. Break your rules. Yowill surely fail
• Take breaks
• Account management – Never add money to the account, Remove prots frequently.
• Trade with the volume. If trading US markets, trade during regular trading hours.
• Read your trading plan every day.

8/15/2019 Ultimate Guide eBook
http://slidepdf.com/reader/full/ultimate-guide-ebook 203/218
ultimate guide to trading and investment
20
The Setup
Original T3 Study Developed by Tim Tillson, the T3 Moving Average is considered superior ttraditional moving averages as it is smoother, more responsive and thus performs better. Th
advantage is that it gets less lag with the price chart and its curve is considerably smoother.
T3 TREND bars set to your period preference. Moving average (set to 5ema) that changes color when in TREND
Looks like a great study to keep you in TREND!
Range Bound Market?Riskier entry but can simply trade o the change in T3 moving average.
Add a second T3 moving average (10ema) and now you have a crossover study
It makes a very strong strategy to keep you in TREND.

8/15/2019 Ultimate Guide eBook
http://slidepdf.com/reader/full/ultimate-guide-ebook 204/218
ultimate guide to trading and investment
20
While there are endless amounts of studies and indicators to add, the more you add, the mocomplex it becomes and less probable that you will enter the trade.
Remember to keep it simple.
With several variations to the core chart, the TradingFibz TREND strategy is all about identifyingthe momentum of the TREND and keeping in the TREND as long as possible with trademanagement tools.
Variations for Chart #1
The standard setup for chart 1 is wherein the core TREND strategy exists. The ability to add a visudimension to your charts is where the exibility exists for you to modify your charts to your liking.
Optional additions you may add to your charts.
1. Color Cloud
2. Crossover Arrows
3. Heikin Ashi Bars/T3 Trend Bars
4. Adjust colors of lines/thickness
5. Add labels

8/15/2019 Ultimate Guide eBook
http://slidepdf.com/reader/full/ultimate-guide-ebook 205/218
ultimate guide to trading and investment
20
6. Adaptability to other trading platforms including setup signals/audio alerts of when the strategy in TREND.
Executing the Trade The TradingFibz mantra is to know 1 thing and know it well.
• I am primarily a futures trader.
• I trade the indices as my primary markets.
• I watch all four major indices closely and comment daily in the live trading room.
• Learning to use this strategy on the futures can be transferred to any other market be intraday or swing trading.
• If futures trading is something you are interested in, there is plenty of good informatio
Caution: Do not attempt to trades this live until youare consistently making a prot.
Entry Options
I use a market order. The trend has been identied, and it’s not as important that I enter on the exaprice when price action closed beyond the 1st bar. It’s that the probability is greatest to continue itrend.
The fewer charts you watch, the more emotion you remove from your trade. I will monitor the TRENbars, 50/144ema and moving averages It’s all about the TREND and what does it take to remain in it

8/15/2019 Ultimate Guide eBook
http://slidepdf.com/reader/full/ultimate-guide-ebook 206/218
ultimate guide to trading and investment
20
Any of the trading platform charts individually may be used as a trading tool. It is the strategy TradingFibz to identify the TREND with the highest probability of success in combination with severcharts together indicating that a TREND move is occurring.
The goal is to remain in the trade as long as the TREND is active. Whether you choose to exit at ticks or 100 ticks, the probability of success was greater when all charts are in unison and you havkept the ticks in your pocket and didn’t give it to the market.
Core Chart Setup
Chart #1: T3 Exponential Moving Averages, 10 Tick Range Chart/Heikin Ashi Candles.
Chart #2: 5/34 Exponential Moving Average, 10 Tick Range Chart.
Chart #3: T3 Exponential Moving Averages, 20 Tick Range Chart/Heiken Ashi Candles.
Chart #4: 50/144 Exponential Moving Averages, Overnight High/Low. 24hr chart. Heikin AsCandles.
Chart #5: Advancers vs. Decliners.
Chart #6: $TICK; NISS-NYSE chart ($TIKRL; NISS - TF for R2K).

8/15/2019 Ultimate Guide eBook
http://slidepdf.com/reader/full/ultimate-guide-ebook 207/218
ultimate guide to trading and investment
20
Criteria to T3 TREND Setup (Tick/Range chart)
• T3_5ema moving average in TREND
o T3 moving average set to a 5ema setting
o Conrm
Color change on moving average
Color change on T3 price bar
o Most riskiest setup – can work in a range bound market

8/15/2019 Ultimate Guide eBook
http://slidepdf.com/reader/full/ultimate-guide-ebook 208/218
ultimate guide to trading and investment
20
Criteria to T3 TREND Setup (Tick/Range chart)
• T3_5/T3_10 ema moving averages CROSSOVER
o T3_5 moving average set to a 5ema setting
o T3_10 moving average set to a 10ema setting
o Conrm
Color change on both moving averages
Color change on T3 price bar
o Less risky setup
Criteria to T3 TREND Setup (Tick/Range chart)
• 5/34 ema moving averages CROSSOVER
o Two moving averages set to 5/34
o Conrm Color change on both moving averages
Color change on T3 price bar
o Least riskiest setup

8/15/2019 Ultimate Guide eBook
http://slidepdf.com/reader/full/ultimate-guide-ebook 209/218
ultimate guide to trading and investment
20
Gold Standard Setup
Essential to entering a technical trade with the highest reward of being in trend While each criteriois independent of one another and can be traded as a system in itself, the TREND strategy has thhighest probability of continuing in TREND with the least amount of risk. Based on the followincombination, patience and discipline is the key to waiting for each setup.
1. T3_5ema in TREND (A)
2. T3_5 and T3_10 Crossover in sync with 5/34ema
Crossover (B)
3. Price action bars in TREND (C)

8/15/2019 Ultimate Guide eBook
http://slidepdf.com/reader/full/ultimate-guide-ebook 210/218
ultimate guide to trading and investment
2
4. Price action on 50/144ema and/or 20 tick range chart in TREND above/below based on TREN
5. $TICK or $TIKRL above/below based on TREND
6. AD line not at any resistance
7. ALL Labels in the GREEN or RED depending on TREND?

8/15/2019 Ultimate Guide eBook
http://slidepdf.com/reader/full/ultimate-guide-ebook 211/218
ultimate guide to trading and investment
2
8. Utilizing the color cloud in the background to keep you in the TREND.
Once steps 1-7 have been identied and you have chosen to enter the trade, option to remain in
the trade using the trade management tools .
Putting it all together
If you have conrmation on all the Charts – what other signicant support and resistance lines arabove or below? This where experience and discipline come into play. Just because I have a crossover, doesn’t mean I will enter the trade.
Things to consider….
• Time of day?
• Economic data coming out?
• Am I in between daily gap and pivot?
• Is the CAM H4 or L4 within 10 ticks of price?• Am I in between the range or outside the range?
• Overnight high or low?
• Price action at the 50 or 144ema?
• $TICK count at?
• Where is price action on the bigger time frame? Daily, Weekly, Monthly.

8/15/2019 Ultimate Guide eBook
http://slidepdf.com/reader/full/ultimate-guide-ebook 212/218
ultimate guide to trading and investment
2
The setup is clear.
You’ve considered all.
You take the trade.
Now it’s all about your trade management.
Trade Management
The high winning % of the TradingFibz T3 Trend Strategy defeats the high risk stop loss
Should I Trade with Targets
One thing you need to always do is not give money back to the market on a winning trade. Thfollowing target and loss management will minimize your risk and maximize your prot. Key is to loin the stop at break even after ticks are in the bank. I tend to trade with two contracts. Never morthan 4. If you use just one contract, use your stop to manage the trade.
Option 1: In and Out strategy
Option 2: Use key levels to remove contracts (Open Ranges, Pivot, Gap, etc.) Once the rst targis HIT, move stop to break even. No loss trade.
Option 3: As long as 5 ema is above the 34 ema, remain in the trade. If the 5ema crosses the 34
remove contracts, manage your stop.
Option 4: Take o ½ contracts when T3_5 crosses T3_10 ema and move stop to breakeven.
Always front run your exit by 1-2 ticks of your target

8/15/2019 Ultimate Guide eBook
http://slidepdf.com/reader/full/ultimate-guide-ebook 213/218
ultimate guide to trading and investment
2
Do you need a stop?
You will have losses in the market. There is simply noway to avoid it. We all come to the trading world with
dierent size accounts. The T3 TREND TradingFibz strategy can be traded with 1 contract or 100 contracts.It’s all about the stop.
First question I am always asked….how big is yourstop? How much can you risk I ask? The bottom line isthat because I identify the trade with the least risk andhighest probability, though every trade carries its owninherent risk, the stop is almost inconsequential as thetrade will most surely put you in the prot and not at aloss. You may consider trading another market if thepotential loss may be too much for your account. Price
action needs room especially in a momentum drive andthat is where the pocket of lifto (or down) o of pricesometimes need that wiggle room to get going. Are youwilling to give it some room of 20-30 ticks just to movein trend?
There are a variety of ways to manage, each with their own level of greater reward. As a tradinroom mentor/author, it is my position to identify the risk of the trade and give you the best probabloutcome. Once in the trade, it is up to you where you want to take your contracts o. However gootrading is always having a stop and that is what the TradingFibz strategy recommends.
Option 1: At the most recent swing size
Option 2: At 1 tick below entry bar
This applies to both initial entries and re-entries on pullbacks.
On trading platforms of the like of Ninja, Sierra, etc. the ability to have your stop moved to breakevecan be automated once you have hit a pre-determined number of ticks away from your entry.
Example : Once price action reaches 5 ticks, stop is moved to breakeven or breakeven +1 to insura no loss trade.

8/15/2019 Ultimate Guide eBook
http://slidepdf.com/reader/full/ultimate-guide-ebook 214/218
ultimate guide to trading and investment
2
Does this work on other charts?
Index Futures – Nasdaq (NQ)
Intraday – 10 Tick Range Chart
Commodities/Futures – Gold (GC)
Intraday – 10 Tick Range Chart

8/15/2019 Ultimate Guide eBook
http://slidepdf.com/reader/full/ultimate-guide-ebook 215/218
ultimate guide to trading and investment
2
Equities - Facebook (FB)
100 tick Range
Equities – Netix (NFLX)
Weekly

8/15/2019 Ultimate Guide eBook
http://slidepdf.com/reader/full/ultimate-guide-ebook 216/218
ultimate guide to trading and investment
2
Forex – EUR/USD
100 tick Range
ETF – Russell – IWM
100 tick Range

8/15/2019 Ultimate Guide eBook
http://slidepdf.com/reader/full/ultimate-guide-ebook 217/218
ultimate guide to trading and investment
2
THE VIDEO
To view in detail a walkthrough of the information presented here in this e-Chapter, please click othe links below.
Click here to view extended presentation with Innity Futures
Click here to view - TradingPub presentation
SPECIAL OFFER
If the information in this e-Chapter has piqued your interest, I invite you to email me and request FREE session in my trading room to see this strategy traded live. [email protected]
I run a live trading room with 25-40 members everyday from open to close with screenshare and charoom. We primarily watch the 4 indices including crude. Trading Room Information
Please feel free to stop by my social media outlets to obtain additional information- TradingFibz.com
ABOUT THE AUTHOR
Greetings. My name is David, founder of TradingFibz, LLC
An educator rst, I understand the patience and time it take
to learn anything new. As an inspiring investor years ago, realized that if I wanted to learn what it took to be an investotrader, it would take time and discipline. I don’t claim to be guru, write articles, conduct free webinar’s and then load uyour inbox, and claim to make thousands a day. What I do –teach in a methodical manner so you get it and can invest otrade with condence.
I have taught many about the world of value investing and along the way picked up some fascinatinmethods for use in the market. By far, I have come to appreciate the order of numbers and thuapplying the Fibonacci patterns to the stock market. Since then, I have adapted this to my owmethod and have learned to be the disciplined trader I am today.

8/15/2019 Ultimate Guide eBook
http://slidepdf.com/reader/full/ultimate-guide-ebook 218/218
ultimate guide to trading and investment