ultimate bending moment of a double span box girder with
TRANSCRIPT

Seediscussions,stats,andauthorprofilesforthispublicationat:https://www.researchgate.net/publication/282326584
Ultimatebendingmomentofadoublespanboxgirderwithnarrowstiffener'spacing
CHAPTER·SEPTEMBER2015
READS
14
2AUTHORS:
JoséManuelGordo
UniversityofLisbon
52PUBLICATIONS399CITATIONS
SEEPROFILE
CarlosGuedesSoares
UniversityofLisbon
1,203PUBLICATIONS10,368CITATIONS
SEEPROFILE
Availablefrom:JoséManuelGordo
Retrievedon:11March2016

355
Towards Green Marine Technology and Transport – Guedes Soares, Dejhalla & Pavleti (Eds)© 2015 Taylor & Francis Group, London, ISBN 978-1-138-02887-6
Ultimate bending moment of a double span box girder with narrow stiffener’ spacing
J.M. Gordo & C. Guedes SoaresCentre for Marine Technology and Ocean Engineering (CENTEC), Instituto Superior Técnico, Universidade de Lisboa, Lisbon, Portugal
ABSTRACT: The results of a four points bending test on a box girder are presented. The experiment is part of series of tests with similar configuration but different thickness and span between frames. The experiment includes initial loading cycles allowing for residual stresses relief. The moment curvature relationship is established for a large range of curvature. The ultimate bending moment of the box is evaluated and compared with the first yield moment and the plastic moment allowing the evaluation of the efficiency of the structure. The influence of the width of plating between stiffeners on the strength of the structure is analyzed by comparison with an experiment on a similar box with larger spacing between stiffeners. The post buckling behavior and collapse mode are characterized. Comparison of the experi-ment with a progressive collapse method is made taking into consideration the effect of residual stresses on the moment curvature relationship of the structure.
of the forces developed in the cross section due to the curvature of the hull girder.
The ultimate moment supported by the hull is achieved after some of the elements have already collapsed, so the knowledge of the shedding pattern after buckling of such elements is of great importance. Usually these methods ignore the interaction between adjacent elements thus the calculated ultimate moment may be considered as an upper limit for the maximum bending moment. The main problem associated with such structures is the nonlinear behaviour of the com-ponents under compression, which is a source of uncertainty on the determination of the ultimate carrying capacity of the structure, especially in a situation of overall bending where some parts are in compression and others in tension.
Because of their nature, these methods require validation by experimental results. However the number of test results available in the open literature is limited. Two box girders representative of bridges were tested by Dowling et al. (1973) and Nishihara (1984) tested seven models of scaled and simpli-fied ship cross sections. An experiment on 1/3 scale model of a frigate was performed by Dow (1991), but this was a transversely framed ship which is not representative of most present day structures.
The predictions of the method of Gordo et al. (1996a) reproduced well these tests results (Gordo & Guedes Soares 1996), but due to the limited extend of the geometries involved it was decided to initiate a series of tests that would consider other geometries,
1 INTRoDUCTIoN
The ultimate bending moment that the transverse section of a ship or a floating production and offloading platform (FPSo) can resist under overall longitudinal bending, is one of the main criteria for design of these structures. The move of the industry towards more accurate predictions of the strength of these structures in overall bending to resist still water and wave induced loads requires accurate and expedite methods to assess the ultimate strength.
Caldwell (1965) was the first who addressed the plastic collapse of a ship hull under overall bending although he did not allow for buckling of plate elements. The first attempt to incorporate the influence of the buckling collapse of some elements of the cross section was due to Smith (1977), who used load shortening curves of individual plate elements to calculate their contribution to the ultimate bending moment of the structure. other methods based on this general idea were developed including the earlier ones of Billingsley (1980), Adamchak (1984) and Gordo et al. (1996a).
This type of progressive collapse methods usually consider that the structural behaviour of the hull girder under bending moment may be rep-resented by the summation of the individual con-tributions of each longitudinal stiffened plate that is part of the cross section. The two main assump-tions are that the net longitudinal force in a cross section is zero and the bending moment resulting from the external loads is equal to the first moment

356
covering a wider range of the different parameters that affect the ultimate carrying capacity of such structures under bending.
In this work the results of a test on a box girder representing the mid-ship region of a ship type structure are presented and analysed. The specimen is subjected to pure bending leading to a mode of collapse in which the upper flange failed under compressive loads.
This experiment belongs to a series of 5 tests on mild steel box girders (Gordo & Guedes Soares 2004; 2015a; 2015b) where different plate’s thickness and frame’s spacing where used for the same trans-verse configuration of the box. This box girder has the same configuration of M3–150 model (Gordo & Guedes Soares 2015a) but with shorter space between stiffeners which leads to a lower plate slenderness keeping the column’s slenderness almost unchanged.
After that the authors have performed tests on high and very high tensile steel box girders (Gordo & Guedes Soares 2009) that allow under-standing the influence of the material properties on the ultimate bending moment supported by this type of structure.
2 ExPERIMENTAl DETAIlS
2.1 Geometry of the specimen
The specimen is a one-meter long box girder supported by two blocks of two meters with much higher rigidity. The connection between them is bolted in order to allow the use of the supports in the future to test other models.
The four points bending test is sketched in Figure 1 and it allows obtaining pure constant bending throughout the whole specimen.
The central block represents the cross section of a rectangular box girder and has the major dimensions of 800 mm wide and 600 mm of depth. The span between the three frames of the specimen (a) is 400 mm allowing 100 mm in each side for redistribution of stresses.
The horizontal top panel has seven longitudinal stiffeners equally spaced (b = 100 mm) and the bottom has three stiffeners spaced by 200 mm. The lateral webs have two stiffeners each, one located
in the middle and the other 100 mm below the top panel, as presented in Figure 2. The plate’s thickness (t) is 3 mm thick and the stiffeners are bars with a thickness of 3 mm and 20 mm of depth. This specimen was designated M3-100.
The welding of the stiffeners to the plating is performed alternately on one side and the other of the rib with a length of 110 mm each segment overlapping at their ends to ensure full support of the stiffener to the plate and vice versa as shown the marks ‘x’ on side panel in Figure 3.
2.2 Material properties
This box girder was built in the structures labo-ratory of IST. The steel used in the manufacture is normal steel for civil engineering and the mate-rial properties were determined by tensile tests on specimens cut in the longitudinal direction of the plating and bar stiffeners in order to coincide with the direction of loading in the experiments.
Figure 2. Cross-section and stiffeners arrangement.
Figure 3. Side panel of box girder M3-100. Details of welding of stiffeners and locations of side strain gauges.Figure 1. layout of the experiment.
357
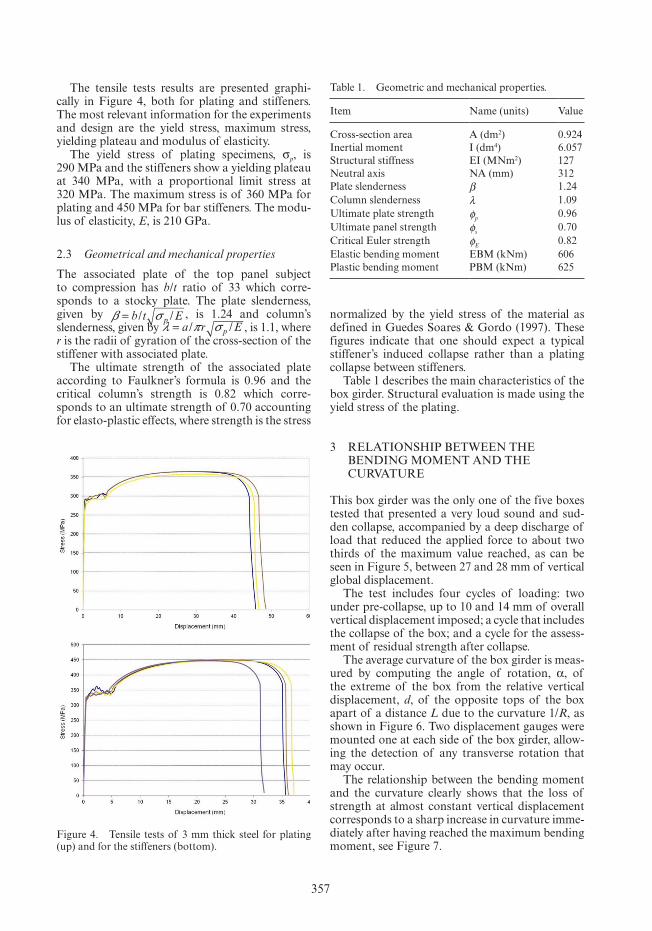
The tensile tests results are presented graphi-cally in Figure 4, both for plating and stiffeners. The most relevant information for the experiments and design are the yield stress, maximum stress, yielding plateau and modulus of elasticity.
The yield stress of plating specimens, σp, is 290 MPa and the stiffeners show a yielding plateau at 340 MPa, with a proportional limit stress at 320 MPa. The maximum stress is of 360 MPa for plating and 450 MPa for bar stiffeners. The modu-lus of elasticity, E, is 210 GPa.
2.3 Geometrical and mechanical properties
The associated plate of the top panel subject to compression has b/t ratio of 33 which corre-sponds to a stocky plate. The plate slenderness, given by β σ= b t Ep/ / , is 1.24 and column’s slenderness, given by λ π σ= a r Ep/ / , is 1.1, where r is the radii of gyration of the cross-section of the stiffener with associated plate.
The ultimate strength of the associated plate according to Faulkner’s formula is 0.96 and the critical column’s strength is 0.82 which corre-sponds to an ultimate strength of 0.70 accounting for elasto-plastic effects, where strength is the stress
normalized by the yield stress of the material as defined in Guedes Soares & Gordo (1997). These figures indicate that one should expect a typical stiffener’s induced collapse rather than a plating collapse between stiffeners.
Table 1 describes the main characteristics of the box girder. Structural evaluation is made using the yield stress of the plating.
3 RElATIoNSHIP BETwEEN THE BENDING MoMENT AND THE CURvATURE
This box girder was the only one of the five boxes tested that presented a very loud sound and sud-den collapse, accompanied by a deep discharge of load that reduced the applied force to about two thirds of the maximum value reached, as can be seen in Figure 5, between 27 and 28 mm of vertical global displacement.
The test includes four cycles of loading: two under pre-collapse, up to 10 and 14 mm of overall vertical displacement imposed; a cycle that includes the collapse of the box; and a cycle for the assess-ment of residual strength after collapse.
The average curvature of the box girder is meas-ured by computing the angle of rotation, α, of the extreme of the box from the relative vertical displacement, d, of the opposite tops of the box apart of a distance L due to the curvature 1/R, as shown in Figure 6. Two displacement gauges were mounted one at each side of the box girder, allow-ing the detection of any transverse rotation that may occur.
The relationship between the bending moment and the curvature clearly shows that the loss of strength at almost constant vertical displacement corresponds to a sharp increase in curvature imme-diately after having reached the maximum bending moment, see Figure 7.
Figure 4. Tensile tests of 3 mm thick steel for plating (up) and for the stiffeners (bottom).
Table 1. Geometric and mechanical properties.
Item Name (units) value
Cross-section area A (dm2) 0.924Inertial moment I (dm4) 6.057Structural stiffness EI (MNm2) 127Neutral axis NA (mm) 312Plate slenderness β 1.24Column slenderness λ 1.09Ultimate plate strength φp 0.96Ultimate panel strength φs 0.70Critical Euler strength φE 0.82Elastic bending moment EBM (kNm) 606Plastic bending moment PBM (kNm) 625

358
very noisy at collapse, accompanying the loss of strength and the sharp increase in curvature. This failure mode is usually associated with changes in the mode of deformation of plate elements or more generally to substantial changes in the deformation of the entire panel in compression, with instanta-neous change to an energetically lower deforma-tion geometry in compression by snap-through.
3.1 Initial cycles of charge
The first cycle of load was applied to a maximum dis-placement of 10.1 mm which corresponds to a bend-ing moment of 96 kNm. The following cycle reached 210 kNm with 14 mm of vertical displacement.
As it can be seen from Figure 8, the first cycle did not dissipate energy or generate any residual curvature after discharge. This is a result of pre-test loading until 150 kNm performed before the complete test was done. The maximum of the 1st cycle is below such value and thus the performance in 1st cycle is completely elastic.
However, during the second cycle, some dis-sipation occurred and the box kept a residual curvature of 0.00013 rad/m. The loading path of the third cycle is parallel to the second one until the 150 kNm (maximum of pre-load) which is the point where the residual stresses relaxation comes in to effect in the second cycle with a slight change in the structural stiffness.
It is also noted that there is no relevant struc-tural hysteresis resulting from the unloading of the 1st cycle and loading of the 2nd, but it becomes important in the following unloading and subse-quent loading on the 3rd cycle. This hysteresis is the energy measured by the area enclosed by the unloading and loading path.
3.2 Cycle of maximum load and residual strength
The maximum bending moment reached amounts to 452 kNm for an absolute global curvature 0.0069 rad/m. In comparative terms, the similar
Figure 5. Relationship between the vertical load and the vertical displacement.
Figure 6. Relation between the radius of curvature and the angle of rotation of the extreme of the box girder (left) and implementation on setup (right).
Figure 8. Moment curvature curve of first two cycles of load.
Before collapse there is a variation in rigidity with the structural tangent modulus decreasing smoothly until it abruptly becomes negative in the point of collapse. Is not noticed in this experiment the existence of plateau on the moment-curvature curve close to collapse where the structural stiff-ness tends to zero, as reported in a slender box girder of the similar geometric shape (Gordo & Guedes Soares 2015b).
Moreover the collapse of this box girder was the only one in the five models tested that was
Figure 7. Relationship between the bending moment and the curvature.
359
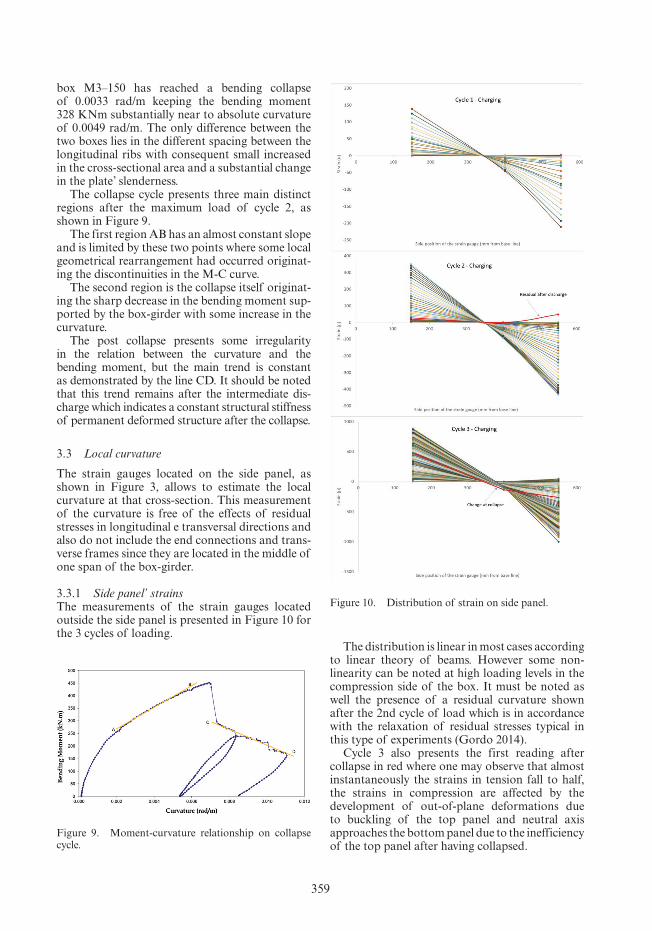
box M3–150 has reached a bending collapse of 0.0033 rad/m keeping the bending moment 328 KNm substantially near to absolute curvature of 0.0049 rad/m. The only difference between the two boxes lies in the different spacing between the longitudinal ribs with consequent small increased in the cross-sectional area and a substantial change in the plate’ slenderness.
The collapse cycle presents three main distinct regions after the maximum load of cycle 2, as shown in Figure 9.
The first region AB has an almost constant slope and is limited by these two points where some local geometrical rearrangement had occurred originat-ing the discontinuities in the M-C curve.
The second region is the collapse itself originat-ing the sharp decrease in the bending moment sup-ported by the box-girder with some increase in the curvature.
The post collapse presents some irregularity in the relation between the curvature and the bending moment, but the main trend is constant as demonstrated by the line CD. It should be noted that this trend remains after the intermediate dis-charge which indicates a constant structural stiffness of permanent deformed structure after the collapse.
3.3 Local curvature
The strain gauges located on the side panel, as shown in Figure 3, allows to estimate the local curvature at that cross-section. This measurement of the curvature is free of the effects of residual stresses in longitudinal e transversal directions and also do not include the end connections and trans-verse frames since they are located in the middle of one span of the box-girder.
3.3.1 Side panel’ strainsThe measurements of the strain gauges located outside the side panel is presented in Figure 10 for the 3 cycles of loading.
The distribution is linear in most cases according to linear theory of beams. However some non-linearity can be noted at high loading levels in the compression side of the box. It must be noted as well the presence of a residual curvature shown after the 2nd cycle of load which is in accordance with the relaxation of residual stresses typical in this type of experiments (Gordo 2014).
Cycle 3 also presents the first reading after collapse in red where one may observe that almost instantaneously the strains in tension fall to half, the strains in compression are affected by the development of out-of-plane deformations due to buckling of the top panel and neutral axis approaches the bottom panel due to the inefficiency of the top panel after having collapsed.
Figure 9. Moment-curvature relationship on collapse cycle.
Figure 10. Distribution of strain on side panel.
360
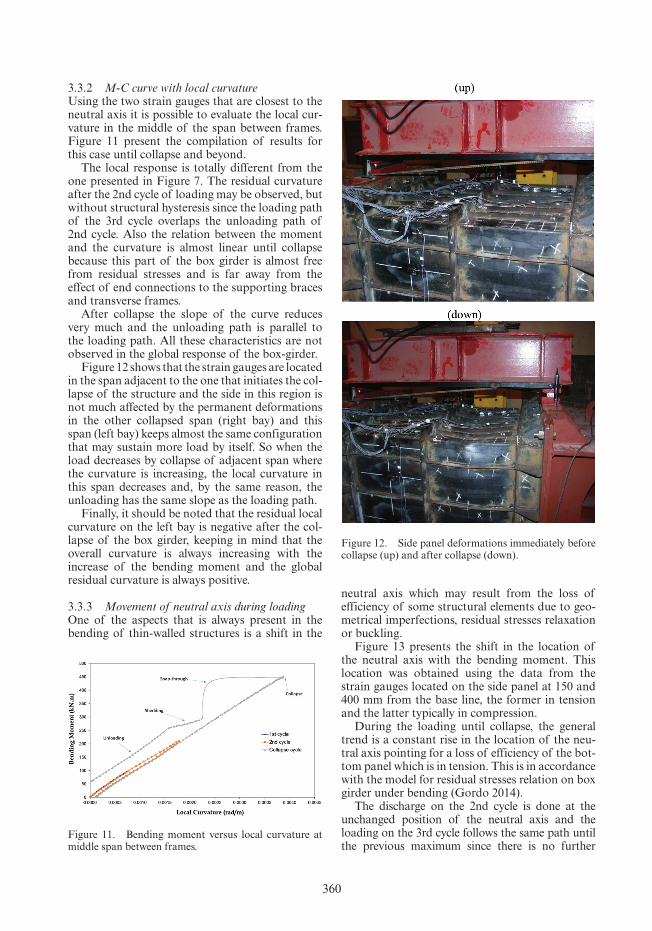
3.3.2 M-C curve with local curvatureUsing the two strain gauges that are closest to the neutral axis it is possible to evaluate the local cur-vature in the middle of the span between frames. Figure 11 present the compilation of results for this case until collapse and beyond.
The local response is totally different from the one presented in Figure 7. The residual curvature after the 2nd cycle of loading may be observed, but without structural hysteresis since the loading path of the 3rd cycle overlaps the unloading path of 2nd cycle. Also the relation between the moment and the curvature is almost linear until collapse because this part of the box girder is almost free from residual stresses and is far away from the effect of end connections to the supporting braces and transverse frames.
After collapse the slope of the curve reduces very much and the unloading path is parallel to the loading path. All these characteristics are not observed in the global response of the box-girder.
Figure 12 shows that the strain gauges are located in the span adjacent to the one that initiates the col-lapse of the structure and the side in this region is not much affected by the permanent deformations in the other collapsed span (right bay) and this span (left bay) keeps almost the same configuration that may sustain more load by itself. So when the load decreases by collapse of adjacent span where the curvature is increasing, the local curvature in this span decreases and, by the same reason, the unloading has the same slope as the loading path.
Finally, it should be noted that the residual local curvature on the left bay is negative after the col-lapse of the box girder, keeping in mind that the overall curvature is always increasing with the increase of the bending moment and the global residual curvature is always positive.
3.3.3 Movement of neutral axis during loadingone of the aspects that is always present in the bending of thin-walled structures is a shift in the
neutral axis which may result from the loss of efficiency of some structural elements due to geo-metrical imperfections, residual stresses relaxation or buckling.
Figure 13 presents the shift in the location of the neutral axis with the bending moment. This location was obtained using the data from the strain gauges located on the side panel at 150 and 400 mm from the base line, the former in tension and the latter typically in compression.
During the loading until collapse, the general trend is a constant rise in the location of the neu-tral axis pointing for a loss of efficiency of the bot-tom panel which is in tension. This is in accordance with the model for residual stresses relation on box girder under bending (Gordo 2014).
The discharge on the 2nd cycle is done at the unchanged position of the neutral axis and the loading on the 3rd cycle follows the same path until the previous maximum since there is no further
Figure 11. Bending moment versus local curvature at middle span between frames.
Figure 12. Side panel deformations immediately before collapse (up) and after collapse (down).

361
plastic effects until that maximum. After that point the neutral axis continues to rise as in the 2nd cycle and the absence of a reversal at high levels of the bending moment indicates that the top panel in com-pression retains its full efficiency until collapse.
The buckling of the top panel reduces very much its ability to sustain load causing an instantaneous movement of the neutral axis towards the bottom. This lack of efficiency increases during the post-col-lapse phase moving the neutral axis further down.
The discharge after collapse causes the neutral axis to move towards the top panel, but the expla-nation is rather complex because it involves several parameters like the specific location of measure-ments in relation to collapsed bay, local deforma-tions in the top panel, interaction between adjacent bays and others.
3.4 Mode of collapse
The collapse was initiated in the right bay by the buckling of stiffened plates associated with the trip-ping of the stiffeners. Immediately before buckling, some deformations were detected on the side panel of this bay towards the stiffeners, which was the first indication of the initiation of global collapse as shown in Figure 12 (up). It is also possible to identify a tendency of the right top panel to deform down-wards and the left one to defect upwards. These deformations defined the final state after collapse.
As the plate slenderness is lower than the column’ slenderness the failure is due to collapse of the stiff-eners, as shown in Figure. The associated plating itself does not present any deformations in relation to the toes deformed surface, i.e., do not showing any buckled shape in this bay. The location of the failure on the stiffeners to the central frame varies from 145 mm in the middle of panel to 175 mm in the outer ones. This means that the effective length of the stiffened plate varies from 290 to 350 mm but the span of the bay is 400 mm. This reduction of
the effective length is due the degree of fixity in the end connections to the supporting members, which increases the critical stress of the panel in compari-son to the simply supported condition.
These deformations on the top panel induce very large and permanent outwards deformations on the top of the side panels as presented in Figure 15.
The downwards collapse of the right bay induces upwards deformations in the left bay by rotation around the central transverse frame. Thus the final permanent deformations on the left panel, as may be observed in Figure 16, are consequence of plasticity in compression on the plating and especially large plastic deformations in tension on the top of the stiffeners due to bending. This permanent elonga-tion of the stiffeners of the left bay seems to be the reason for negative residual curvature in the left bay, already mentioned and plotted in Figure 11.
one other aspect of interest is the fact that the transverse frame did not remain straight during the
Figure 13. location of neutral axis in relation to the base line.
Figure 14. Stiffener’s inducer failure in top panel.
Figure 15. Collapse of box girder in the right bay.

362
collapse and the rotation of the frame in relation to the initial plane of the panel depends on the loca-tion. The part of the frame located in the middle of the panel suffers a larger rotation than the parts close to the side panel. Also the in-plane displace-ment of the toe towards the collapse bay is larger in the middle of the top panel than in the side since side panels give support and restriction to displace-ments and rotations.
These large displacements and rotations point for the development of internal shear stresses in pure bending due to different out-of-deformations in adjacent bays which induce different stiffness of the stiffened plates. Similar effect on beams under bending has already been discussed by Zanic and Kitarovic (2015).
3.5 Structural tangent stiffness in the collapse cycle
Figure 17 presents the variation of the tangent stiffness of the box-girder with the bending moment both using the global and local curvatures.
The stiffness calculated with the local curvature is very close to the elastic stiffness (EI) represented by the horizontal line in black. The tendency of structural stiffness using the global curvature at high levels of loading, represented in red, crosses the elastic stiffness at a null bending moment. It includes all effects of residual stresses in welding both in longitudinal and transverse directions, and geometric imperfections.
4 CoMPARISoN wITH THE APPRoxIMATE METHoD
Figure 18 compares the curve of the final loading cycle with the progressive collapse method predic-tions implemented in the HullCol code (Gordo et al. 1996b) with and without residual stresses. It still shows the moment versus local curvature curve until collapse. This curve follows closely the prediction of the behavior of a box without or with very low lev-els of residual stresses, i.e., η = 0 to 2, where η is the width of the tensile strip of residual stresses pattern to thickness ratio as defined in (Gordo 2014), and it points for a low local curvature at collapse.
Figure 18. Comparison of test and predictive method for moment-curvature relationship with different residual stresses.
Figure 19. variation of ultimate bending moment and correspondent curvature with residual stresses.
Figure 16. Global residual deformations on top panel.
Figure 17. Structural tangent modulus versus bending moment for global and local curvature in the collapse cycle.

363
otherwise, the M-C curve calculated with the global curvature points for high levels of residual stresses. In fact the predictions of the method with high levels of residual stresses have a slope similar to the one of the experimental curve which includes the effect of welding of longitudinal and transverse frames to plating and heavy welding of brackets near the supports. Figure 19 systematize the results of HullCol against the ones of the experiment.
It also shows that the ultimate curvature of the whole welded structure depends very much on the level of residual stresses pointing for a global level of residual stresses of η = 7 while the ultimate bending moment indicates a much low level of residual stresses (η = 2).
5 CoNClUSIoN
The results of a test of a box girder subjected to pure bending are presented. The existence of two adjacent bays showed to be important for the final mode of collapse leading to an ultimate bending moment lower than predicted by the approximate method of progressive collapse analysis.
The final collapse is due to failure of the stiffen-ers in compression on the right bay inducing the opposite deformations on the adjacent bay.
This influence of the adjacent bay originates a failure of the stiffeners that is not located in the middle of the bay but towards the adjacent bay which corresponds to having an effective column’s length lower than the frame’ spacing, which increases the ultimate strength of the top panel and consequently the ultimate bending moment.
Comparison with the predictions of the approx-imate method indicates that the level of residual stresses in the middle of the bays is low, conclusion supported by the variation of ultimate bending moment and corresponding local curvature with the residual stresses level, but the global residual stresses are responsible for the ultimate global curvature and the tendency of the global stiffness of the whole structure.
ACKNowlEGEMENTS
The tests have been financed by the Portuguese Foundation for Science and Technology through its annual funding to the Centre for Marine Tech-nology and ocean Engineering (CENTEC).
REFERENCES
Adamchak, J.C. 1984. “An approximate method for esti-mating the collapse of a ship’s hull in preliminary design” Ship Structures Symposium ‘84. City, 37–61.
Billingsley, D.w. 1980. “Hull girder response to extreme bending moments”5th STAR Symposium. City: SNAME, 51–63.
Caldwell, J.B. 1965. “Ultimate longitudinal strength.” Transactions of RINA, 107, 411–430.
Dow, R. 1991. “Testing and analysis of a 1/3-scale welded steel frigate model”, R.S.D. a. C.S. Smith, (ed.) Advances in Marine Structures 2. City: Elsevier Applied Science, 749–773.
Dowling, P.J., Chatterjee, S., Frieze, P. & Moolani, F.M. 1973. “Experimental and predicted collapse behaviour of rectangular steel box girders”International Confer-ence on Steel Box Girder Bridges. City: london.
Gordo, J.M. 2014. “Residual stresses relaxation of welded structures under alternate loading”, Develop-ments in Maritime Transportation and Exploitation of Sea Resources. 321–328.
Gordo, J.M. & Guedes Soares, C. 1996. “Approxi-mate Method to Evaluate the Hull Girder Collapse Strength.” Marine Structures, 9(1), 449–470.
Gordo, J.M. & Guedes Soares, C. 2004. “Experimental Evaluation of the Ultimate Bending Moment of a Box Girder.” Marine Systems and Offshore Tecnology, 1(1), 33–46.
Gordo, J.M. & Guedes Soares, C. 2009. “Tests on ulti-mate strength of hull box girders made of high tensile steel.” Marine Structures, 22(4), 770–790.
Gordo, J.M. & Guedes Soares, C. 2015a. “Experimental analysis of a box girder with double span subject to pure bending moment”, in C.S.T.A. Guedes Soares, (ed.), Maritime Technology and Engineering. london: Taylor & Francis Group, 399–405.
Gordo, J.M. & Guedes Soares, C. 2015b. “Experimental Evaluation of the Ultimate Bending Moment of a Slender Thin-walled Box Girder.” Journal of Offshore Mechanics and Arctic Engineering, 137(2), 021604.
Gordo, J.M., Guedes Soares, C. & Faulkner, D. 1996a. “Approximate assessment of the ultimate longitudinal strength of the Hull girder.” Journal of Ship Research, 40(1), 60–69.
Gordo, J.M., Soares, C.G. & Faulkner, D. 1996b. “Approximate assessment of the ultimate longitudinal strength of the hull girder.” Journal of Ship Research, 40(1), 60–69.
Guedes Soares, C. & Gordo, J.M. 1997. “Design Meth-ods for Stiffened Plates under Predominantly Uniaxial Compression.” Marine Structures, 10(6), 465–497.
Nishihara, S. 1984. “Ultimate longitudinal strength of mid-ship cross section.” Naval Arch. & Ocean Engng., 22, 200–214.
Smith, C.S. 1977. “Influence of local compressive failure on ultimate longitudinal strength of a ship’s hull”3th Int. Symposium on Practical Design in Shipbuilding. City: Tokyo, 73–79.
Zanic, v. & Kitarovic, S. 2015. “Influence of the shear force and distributed load on the longitudinal ultimate strength”, in G. Soares and T. Santos, (eds.), Maritime Technology and Engineering. london: Taylor & Fran-cis Group, 425–438.