ukcpr discussion paper series · fording, r., soss, j., and schram, s. (2008, november ......
TRANSCRIPT

University of Kentucky Center for
Poverty Research
Discussion Paper SeriesDP 2008-06
UKCPR
University of Kentucky Center for Poverty Research, 302D Mathews Building, Lexington, KY, 40506-0047Phone: 859-257-7641; Fax: 859-257-6959; E-mail: [email protected]
www.ukcpr.org
Distributing discipline: Race, politics, and punishment at the frontlines of welfare reform
Richard C. FordingUniversity of Kentucky
Department of Politial Science
Joe SossUniversity of Minnesota
Humphrey Institute of Public Affairs
Sanford F. SchramBryn Mawr College
Graduate School of Social Work and Social Research
November 2008
Preferred citationFording, R., Soss, J., and Schram, S. (2008, November). Distributing discipline: Race, politics, and pun-ishment at the front lines of welfare reform. University of Kentucky Center for Poverty Research Discussion Paper Series, DP2008-06.
Author correspondence: Richard Fording, [email protected]; Joe Soss, [email protected]; Sanford Schram, [email protected].
ISSN: 1936-9379
EO/AA

Distributing Discipline:
Race, Politics, and Punishment at the Frontlines of Welfare Reform*
Richard C. Fording Department of Political Science
University of Kentucky Lexington, KY 40506-0027
Joe Soss
Humphrey Institute of Public Affairs University of Minnesota 301 19th Avenue South Minneapols, MN 55455
Sanford F. Schram Graduate School of Social Work and Social Research
Bryn Mawr College 300 Airdale Road
Bryn Mawr, PA 19010-1697 [email protected]
* We are grateful to Scott Allard, Maria Cancian, Raymond Duvall, Ken Hoover, Linda Houser, Dana Patton, Mark Peffley, Stephen Pimpare, Frances Fox Piven, Stephen Rathegab Smith, John Tambornino, Pamela Winston, and D. Stephen Voss for providing valuable comments on earlier drafts. This research has been supported by the University of Kentucky Center for Poverty Research (UKCPR), the Institute for Research on Poverty (IRP) at the University of Wisconsin, the Center on Ethnicities, Communities and Social Policy at Bryn Mawr College, and the Annie E. Casey Foundation. We are grateful to representatives of the Florida Department of Children and Families and Workforce Florida, Inc. for the data used in this paper, and to Adam Butz for valuable research assistance. The opinions and conclusions expressed herein are solely those of the authors and should not be construed as representing the opinions or policy of the UKCPR, the IRP, the state of Florida, or any agency of the Federal government.

ABSTRACT
Numerous studies have confirmed that race plays an important role in shaping public preferences
toward both redistribution and punishment. Likewise, studies suggest that punitive policy tools tend to be
adopted by state governments in a pattern that tracks with the racial composition of state populations.
Such evidence testifies to the enduring power of race in American politics, yet it has limited value for
understanding how disciplinary policies get applied to individuals in implementation settings. To
illuminate the relationship between race and the application of punitive policy tools, we analyze sanction
patterns in the TANF program. Drawing on a model of racial classification and policy choice, we test four
hypotheses regarding client race and sanctioning. Our study does not support a simple story in which
racial minorities are always more likely to be targeted for discipline. Rather, we find the impact of race to
be contingent on local politics, administrative decentralization, and other client characteristics.

1
INTRODUCTION
Punishment is a core technology of governance, central to the modern state. It is usually most
visible in criminal justice systems, where authorities penalize violations of law by imposing fines, stays of
imprisonment, and even sentences of death. Yet as a tool of governance, punishment has far broader
application. Across diverse societal domains, disciplinary systems establish behavioral incentives (Ehrlich
1996) and shape the ways individuals understand and regulate their own conduct (Foucault 1979).
In recent years, punishment has taken on greater significance for students of American politics, as
governments at all levels in the United States have come to rely more heavily on punitive tools. This is
evidenced by the increasing harshness of criminal justice policies, and the impact that these policies have
had on the use of imprisonment. This has contributed to a level of mass incarceration that is
unprecedented in American history and unrivaled by other nations (Western 2006). Yet, this custodial
turn has not been isolated to criminal justice policies. Rather, it has coincided with a broader shift toward
paternalist principles in U.S. social policy (Starobin 1998). Policies for low-income populations, in
particular, have been redesigned around the idea that the state has a legitimate interest in ensuring that
socially marginal groups practice appropriate behavior. Today, public aid programs are more directive in
setting behavioral expectations, supervisory in monitoring compliance, and punitive in responding to
infractions (Wacquant 2001).
As disciplinary systems have come to play a more central role in poverty governance, the study of
administrative practice has taken on greater urgency (Mead 2004). Because public benefits are now more
contingent on recipient behavior, policy implementers have had to reorganize their operations around the
tasks of identifying and penalizing rule violators. Indeed, it is inevitably at the frontlines of policy
implementation – in concrete organizations such as courts, schools, prisons and welfare agencies – that
the politics of punishment culminates in actual decisions to impose penalties on some but not others.
To understand discipline as an element of governance, then, political scientists must do more than
explain why mass publics or political jurisdictions vary in the extent to which they embrace punitive
policy designs. We must investigate how such designs are actually put into practice and, in so doing,

2
clarify the social, political, economic, and organizational forces that shape decisions to discipline. It is
here, in the operation of administrative discretion, that the state’s capacity to punish collides with the core
question of distributive politics posed by Harold Lasswell (1936): “who gets what, when, how?”
This article presents an analysis of discipline at the frontlines of welfare reform, focusing on how
patterns of punishment are affected by the interplay of race and politics. In the United States, there is a
long history of social-policy tools being applied to racial groups in unequal ways (Lieberman 1998;
Katznelson 2005). Today, however, the age of Jim Crow is a distant memory; de jure discrimination is
banned; and norms of racial equality are widely embraced (Mendelberg 2001). In this post-civil-rights
context, how and why does race matter for disciplinary action in local welfare offices? Under what
conditions do client racial characteristics become significant influences on decisions to impose penalties?
In recent years, numerous studies have confirmed that racial attitudes remain an important
determinant of public preferences regarding both social programs and systems of punishment (Gilens
1999; Peffley, Hurwitz, and Sniderman 1997). Likewise, studies suggest that punitive policy tools tend to
be adopted in the American states in a pattern that tracks with the racial composition of state populations
(Fellows and Rowe 2004; Hero 1998; Jacobs and Carmichael 2002; Soss et al. 2001). Such evidence
testifies to the enduring power of race in American politics, yet it has limited value for understanding how
disciplinary policies actually get applied to individuals in implementation settings.
To illuminate the relationship between race and the application of punitive policy tools, we
analyze sanction patterns in the Temporary Assistance for Needy Families (TANF) program. When
federal lawmakers passed welfare reform in 1996, they required states to develop procedures for
sanctioning TANF clients. Sanctions are penalties that suspend all or part of a family’s benefits for failing
to comply with a program requirement. Although they have existed as a policy tool in the welfare domain
for many years, they have taken on a more central programmatic role since 1996, as clients have
confronted stricter work obligations, narrower exemption criteria, expanded behavioral requirements, and
stronger penalties for noncompliance (Hasenfeld, Ghose and Larson 2004). Sanctions impose highly
visible, direct material consequences for behavioral infractions. They provide the primary mode of

3
disciplinary action in state TANF programs and, as such, are among the most potent tools that case
managers have for influencing client behaviors and pursuing performance goals.
Prior research has shown that states with higher proportions of nonwhite recipients have been
significantly more likely to adopt the strictest sanction policies under welfare reform (Soss et al. 2001;
Fellowes and Rowe 2004). Government records suggest that such racial dynamics may characterize the
sanction implementation process as well. Using data from the U.S. Government Accountability Office
(GAO), one can examine the relationship between the racial composition of the welfare caseload and
sanction usage in the states that have adopted the strictest sanction policies. Doing so, we find a strong
relationship between the percentage of TANF recipients who are black or Latino and the extent to which
states impose sanctions (see Figure 1). Figure 1 suggests a relationship between race and sanctioning
outcomes, yet these aggregate state-level data are extremely limited. They do not allow us to determine if
states are actually sanctioning black and Latino recipients more often than whites, and they tell us nothing
about how, when, and why client race might matter for the use of penalties under welfare reform. To
pursue such issues, one must examine individual-level data within a research design that maximizes our
ability to understand if and why racial disparities exist in sanction implementation.
[Figure 1]
Drawing on a general model of racial classification and policy choice, we begin our investigation
by developing the logic underlying four hypotheses regarding client race and sanctioning in the TANF
program. We then proceed to test our hypotheses by using two very different, yet complimentary datasets.
We begin with an analysis of longitudinal data on TANF clients from the state of Florida’s Welfare
Transition (WT) program, a welfare-to-work program funded by the TANF block grant. As the
centerpiece of federal welfare reform in 1996, state TANF programs have been at the heart of the recent
turn toward paternalist social policy. The Florida WT program, in turn, has been at the leading edge of
state efforts to use sanctions as a tool to motivate behavioral compliance and change (see Figure 1). We
supplement this analysis with a cross-sectional analysis of TANF sanctioning using a national dataset,
which allows us to provide a partial replication of our results from Florida. Our findings are consistent

4
across both analyses and suggest that race has played an important role in sanction implementation under
welfare reform. However, our results do not support a simple story in which racial minorities are always
more likely to be targeted for discipline. Rather, our findings support a more nuanced account in which
the impact of race is contingent on local politics and administrative decentralization, as well as other
client characteristics.
POLITICS, CHOICE, AND THE IMPLEMENTATION OF TANF SANCTIONS
A variety of studies have used administrative or survey data to analyze the client characteristics
that correlate with a higher likelihood of being sanctioned. Their findings converge on the conclusion that
sanctioned participants tend to resemble long-term welfare participants across a variety of characteristics
such as marital status, age, family size, education level, job experience, and most importantly for our
purposes, race (Wu et al. 2006; Pavetti, Derr and Hesketh 2003; Hasenfeld, Ghose and Larson 2004; Kalil
et al. 2002; Mancuso and Lindler 2001; Koraleck 2000; Westra and Routely 2000;).
The existing literature is creative and sophisticated in its use of econometric methods. Yet it is
also limited by its attention to only one side of a two-sided transaction. With only a few exceptions (e.g.
Keiser, Meuser, and Choi 2004), previous studies have trained their attention on clients and asked, at least
implicitly, “who is likely to get sanctioned?” As a result, these studies largely ignore the fact that welfare
sanctions arise, not just from client characteristics and behaviors, but also from policy choices made by a
series of political actors such as state and local representatives, program directors, supervisors, and case
managers. The rate and incidence of sanctioning depend, at least in part, on the decisions such actors
make as they set policy, organize administrative practice, and apply general rules to specific instances. In
short, research to date has largely failed to address sanctions as tools of governance that may or may not
be deployed depending on what officials choose in particular jurisdictions and cases.
The sanctions deployed at the frontlines of welfare agencies are products of choice at numerous
levels of governance. Under federal welfare reform, states confronted a range of options in designing their
sanction policies. Seventeen adopted “immediate full-family sanctions,” which suspend all benefits for all
members of the TANF family as penalty for the first instance of noncompliance. Fifteen chose “gradual

5
full-family sanctions,” which can eventually rise to a “full-family” impact, but only after a progression of
penalties. The remaining states selected “partial sanctions,” which reduce only a portion – typically the
adult portion – of the family’s benefits (Pavetti, Derr and Hesketh 2003). Studies suggest that these
choices have been quite consequential, and as a result, the decline in the welfare caseload has been as
much as 25 percent greater in states with immediate full-family sanctions, compared to states with the
least punitive sanction policies (Rector and Youseff 1999).
The politics of policy choice is equally crucial at the local level, where a variety of officials hold
responsibility for interpreting state sanction policy and specifying it through rulemaking. Many states
have practiced “second-order devolution” where they devolved primary authority over TANF policy
down to county government officials or regional workforce boards (Gainesborough 2003). In all states,
however, local TANF officials are likely to have substantial discretion over program elements that affect
the rate and incidence of sanctioning. Their local policy choices typically establish the process by which
clients are informed of TANF rules and penalty procedures; the mode of monitoring participation in
required activities; the steps for initiating a sanction, including how and when clients are notified of an
impending sanction and the steps needed to avoid it; and the procedures and requirements for “curing” a
sanction and returning a client to the TANF rolls. Not surprisingly, given the wide scope of this
discretion, field studies find that, even when TANF offices operate under the same state guidelines,
sanction philosophies and practices tend to vary dramatically across local communities (Pavetti et al.
1998).
State and local policy choices combine to create the settings for more proximate decision
processes in the interactions between case managers and clients. As frontline workers, case managers
exercise significant discretion in interpreting program rules and applying penalties (Myers et al. 2006;
Pavetti, Derr and Hesketh 2003: 6). Their decisions can influence sanction patterns in a variety of ways.
From the outset, case managers are responsible for assessing client needs and capabilities. They identify
which clients should be relieved of certain work requirements or told to attend special classes. In doing
so, the case manager establishes particular sanctioning parameters for particular clients. And of course,

6
ultimately, it is the case manager who must decide whether to initiate sanction procedures in response to
an infraction and whether the circumstances of the infraction justify a “good cause” exception to the rules.
In short, sanctions can be understood, not just as events that happen to some clients more than
others (as in most of the current literature), but also as outcomes of governmental decision-making
processes. From this perspective, the analytic focus shifts from an investigation of client characteristics
per se to an investigation of how client characteristics become relevant to administrative decisions and
interact with the environmental forces that systematically shape administrative behavior. In what follows,
we pursue exactly this approach, investigating how client racial characteristics combine with stereotype-
consistent cues and local political environments to influence frontline decisions to impose sanctions.
RACIAL CLASSIFICATION AND THE LOCAL POLITICS OF PUNISHMENT
Our analysis is based on a simple but general model of race and social policy choice called the
Racial Classification Model (RCM). Elaborating on the work of Schneider and Ingram (1993, 1997), the
RCM identifies how and when racial classifications should affect target-group constructions and, hence,
policy design and implementation patterns. The model does not preclude but, crucially, does not assume
the operation of racial animus, racial threat, or racial group loyalty. It is a minimalist cognitive model of
policy decision making that focuses solely on the necessity of social classification and consequences of
group reputation. Here, we apply the model to policy implementation settings by deriving four hypotheses
regarding TANF sanctions. The RCM consists of three basic premises.
1. To be effective in designing policies and applying policy tools to specific target groups, policy actors must rely on salient social classifications and group reputations; without such classifications, they would be unable to bring coherence to a complex social world or determine appropriate action.
2. When racial minorities are salient in a policy context, race will be more likely to provide a salient
basis for social classification of targets and, hence, to signify target differences perceived as relevant to the accomplishment of policy goals.
3. The likelihood of racially patterned policy outcomes will be positively associated with the degree of
policy-relevant contrast in policy actors’ perceptions of racial groups. The degree of contrast, in turn, will be a function of (a) the prevailing cultural stereotypes of racial groups, (b) the extent to which policy actors hold relevant group stereotypes, and (c) the presence or absence of stereotype-consistent cues.

7
The RCM asserts that policy actors try to choose courses of action that they expect to be effective
given what they believe about the specific groups they aim to address. In this process, social group
characteristics can serve as proxies for more detailed information about a policy’s intended target group.
When race is salient to a policy area, as in the case of welfare (Gilens 1999), racial classifications can
serve precisely this function, regardless of whether racial animus is present and regardless of the decision
makers’ own racial identities. In such cases, group reputations can frame interpretations of ambiguous
policy-target behaviors and cue broad assumptions about what kinds of policy actions are likely to be
effective. The effects of such reputations, however, will depend on their specific policy-relevant content
as well as situational factors that may strengthen or weaken their utility as information proxies.
In applying the RCM to TANF sanction decisions, we conceptualize sanctions as tools for
motivating welfare clients, stimulating work effort, and enforcing responsible behavior. Accordingly,
local policy actors should be more likely to organize and implement sanctions in a stringent fashion when
TANF clients are perceived as less motivated and responsible in their own right – i.e., when clients are
perceived as needing a stronger external stimulus to follow program rules and achieve welfare-to-work
goals. In this context, client race should affect sanctioning patterns to the extent that contrasts between
racial-group reputations convey information about motivation, work effort, and personal responsibility.
Combining these assumptions with research on group stereotypes in the United States, we can
derive our first hypothesis from the RCM. Relative to white Americans, black Americans remain strongly
associated with low work effort and motivation, socially irresponsible behavior, and preferences for
welfare reliance (Gilens 1999; Schuman et al. 1997). Stereotypes of Latinos occupy a midpoint, less
negative than blacks but more negative than whites (Fox 2004). Accordingly, the RCM suggests:
(H1) The Simple Disparity Hypothesis: All else equal, TANF officials will be more likely to sanction black clients than white or Latino clients, and more likely to sanction Latino clients than white clients.
Taken in isolation, H1 might be read as predicting that client race will have a significant and
invariant effect in all circumstances. The third premise of the RCM, however, points to a more situational
effect, with the impact of client race depending on both the degree to which policy actors hold relevant

8
group stereotypes and the presence or absence of stereotype-consistent cues. These elements of the RCM
allow us to move beyond simple disparities to specify and test more nuanced hypotheses.
Two individuals who are perceived as members of the same racial group may nevertheless be
associated with quite different group reputations. Research on intersectionality, for example, emphasizes
that the meaning of one category of social identity can be altered when combined with another (e.g., when
woman is combined with black as opposed to white, see Crenshaw 1991; Hancock 2006). Likewise,
social cognition researchers have shown that perceivers tend to distinguish “subtypes” of racial groups
(such as “ghetto blacks” vs. “black businessmen”) and to attribute negative global-group traits to these
subtypes to very different degrees (Richards and Hewstone 2001; Devine and Baker 1991). As a result,
race-of-target effects will often be contingent on additional characteristics that strengthen or weaken the
individual’s connection to the racial group’s prevailing reputation. Eberhardt et al. (2006), for example,
find that black defendants convicted of killing white victims are more likely to receive the death penalty if
they are perceived as having a “stereotypically black appearance.”
Indeed, research suggests that a variety of stereotype-consistent cues can enhance race-based
disadvantages. In some instances, this effect functions to widen already-existing racial disparities. In
others, it creates disparities where none had otherwise existed. The former scenario is well illustrated by
Pager’s (2003) influential field experiment exploring the effects of race and “the mark of a criminal
record” on hiring outcomes. Pager (2003) finds that black job applicants are already disadvantaged
relative to whites in the no-felony condition of her experiment, yet the attribution of a felony conviction
actually reduces black applicants’ job prospects to a greater degree than the prospects of already-
advantaged white applicants. By contrast, the latter scenario is illustrated by a recent study of how racial
cues affect preferences for political candidates. Valentino, Hutchings, and White (2002: 86) find that
When the black racial cues are stereotype-inconsistent, the relationship between racial
attitudes and the vote disappears…. [Likewise] the presence of black images alone… does
not prime negative racial attitudes…. The effect emerges only when the pairing of the
visuals with the narrative subtly reinforces negative stereotypes in the mind of the viewer.

9
Building on this research, the RCM suggests that, regardless of whether simple racial disparities
exist, the presence of a trait that is consistent with minority-group stereotypes should increase the odds of
a sanction more for minority clients than for white clients. In the present analysis, perhaps the most
relevant trait of this sort is long-term welfare usage (Gilens 1999). For several decades now, welfare
“dependency” has been a prominent stereotype associated with poor racial minorities – interpreted in
various quarters as a distinguishing feature of “underclass” culture, a pathology akin to addiction, and a
clear sign of an individual’s unwillingness to work (Schram 1995). To stay on the welfare rolls for a
comparatively long period of time is, in the context of welfare-to-work programs, to mark oneself in a
policy-relevant and racially-inflected way. Accordingly, the RCM suggests:
(H2) The Time-Contingent Disparity Hypothesis: The effects of race on sanctioning will grow stronger, and thus the racial disparities predicted under H1 will grow larger, as TANF participation spells increase in length.
The third premise of the RCM also predicts that the production of racial disparities will be
contingent on the extent to which policy actors hold relevant group stereotypes. When such stereotypes
are viewed with skepticism, racial-group reputations will be perceived as poor proxies for more detailed
information and, hence, as unreliable guides to decisions regarding policy targets. By contrast, when such
stereotypes are accepted as largely valid, differences in group reputation should convey more useful
information and, thus, the likelihood of racially patterned outcomes should increase.
Ideally, one would like to test this component of the RCM by utilizing direct measures of
stereotype acceptance at the individual level. In the absence of such measures, one must seek out a
suitable proxy by asking where in American society one is likely to find greater acceptance of stereotypes
regarding racial-group orientations toward work and welfare. As an empirical matter, one answer to this
question is that such stereotypes are more likely to be found in politically conservative communities than
in politically liberal communities. There is, of course, no logical reason why conservatives should hold
more negative views of racial minorities. Indeed, there are good reasons to distinguish between the two
when trying to explain public opposition to various policies designed to advance egalitarian goals (Sears,
Sidanius, and Bobo 2000). Nevertheless, two basic empirical observations emerge as uncontroversial in

10
the existing literature. First, conservatives are more likely than liberals to oppose welfare and to hold
negative views of welfare recipients (Gilens 1999; Cook and Barrett 1992). Second, conservatives are
more likely than liberals to hold negative stereotypes of African Americans, especially in attributing to
this group a preference for receiving welfare rather than working (Domke 2001; Federico and Sidanius
2002; Gilens 1999; Glaser 1994; Johnson and Marini 1998; Oliver and Mendelberg 2000).
This relationship can be easily documented with recent data from the National Election Study
(NES). In 2004, the NES asked respondents to evaluate the degree to which different racial and ethnic
groups (including blacks, Latinos, and whites) were either “hardworking” or “lazy.” Figure 2 presents the
difference in the average assessment of each group’s perceived “laziness” (on the vertical axis), by
respondents’ liberal-conservative identification (on the horizontal axis), thus allowing a direct
examination of the relationship between ideological orientations and group stereotypes.
[Figure 2]
The results are clear. Conservatives are more likely than liberals or moderates to view blacks and
Latinos as lazy, compared to whites. As a result, the perceived gap between group reputations grows
consistently larger as one shifts from the liberal to the conservative end of the ideological spectrum. One
need not engage the thorny causal questions of why this relationship exists to pursue our present analytic
goals. It suffices to say that there is an empirical basis for assuming that, in more conservative political
environments, one is more likely to find negative views of welfare reliance and acceptance of stereotypes
asserting that racial minorities differ from whites in preferring welfare over work.
Combining this observation with the RCM leads to the expectation that racial disparities in
sanctioning will be larger in more politically conservative communities. A variety of mechanisms may
underlie this relationship. Because case managers tend to be drawn from local communities, one would
expect them to be more conservative (and hence, more likely to perceive racial-group differences in
welfare-work orientations) when their offices are located in more conservative environments. The same
selection dynamics are likely to operate for TANF supervisors, program directors, and governing board

11
members. As a result, racial disparities in sanctioning may arise more often in conservative communities,
not only due to the attitudes of individual case managers, but also due to the possibility that racial
classifications may guide the officials above them who set local operating procedures and manage TANF
implementation. Finally, because welfare agencies are “open systems” that must respond to their political
environments, conservative and liberal communities may produce different patterns of program
implementation because of the ways that racialized understandings inform political pressures, standards
of legitimacy, and agendas for action. For all these reasons, the RCM suggests:
(H3) The Ideology-Contingent Disparity Hypothesis: The effects of race on sanctioning will be stronger, and thus the racial disparities predicted under H1 will be larger, in conservative political environments.
Finally, we offer a fourth hypothesis which predicts that the causal mechanisms assumed by the
RCM will have the strongest effect on implementation outcomes in administrative environments which
offer greater discretion to local decisionmakers and frontline workers. As discussed above, many states
have devolved significant authority in TANF implementation to local governments or regional workforce
boards – a process known as second-order devolution (SOD) (Gainsborough 2003). Under SOD, states
grant administrative authority to local governments just as the federal government grants authority and
responsibility to state governments in designing and implementing TANF (Nathan, 1997; Adkisson,
1998). Although the division of state-local responsibility varies across SOD states, it is generally agreed
that in SOD states, local TANF administrators and frontline staff enjoy greater freedom from state control
and thus have the opportunity to exercise significantly greater discretion in the implementation of TANF
(Fording, Soss and Schram 2007). Therefore, it is likely that the effects of racial classification may be
enhanced in SOD states, and as a result, racial classification may more likely to result in racial disparities
in sanctioning outcomes. This leads to our final hypothesis:
(H4) The Decentralization-Contingent Disparity Hypothesis: The effects of race on sanctioning will be stronger, and thus the racial disparities predicted under H1 will be larger, in states which have chosen to engage in second order devolution. To date, we are aware of only one study that has examined the effects of both race and the
political environment on TANF sanctioning. Keiser, Mueser and Choi (2004) analyze administrative data

12
on sanctioning in Missouri, finding that after one controls for relevant client-level and county-level
factors, blacks are on average 23 percent more likely to be sanctioned than white recipients. Moreover,
the authors find that the magnitude of racial differences varies across seven geographic regions in a
pattern that they interpret as politically meaningful. Yet, as a test of the RCM’s predictions, Keiser,
Meuser, and Choi’s analysis has significant limitations.
Because of small sample sizes, the authors could only examine how racial effects varied across a
small number of geographic groupings (seven), all of which were defined at a high level of aggregation
and some of which were non-contiguous. As a result, they were unable to test whether differences in
racial effects correlated with any direct measure of political ideology (H3). In addition, because Keiser,
Meuser, and Choi relied on binary logit analysis rather than event history analysis, they were unable to
test hypotheses related to spell length (H2) and their analysis of racial disparities offered only a limited
ability to control for differences in at-risk periods across groups (see Wu et al. 2006). Finally, by
examining a single state operating in a centralized administrative environment, not only is their analysis
limited in external validity, it cannot test for differences in racial effects due to variation in administrative
decentralization (H4).
Our analysis follows Keiser, Mueser and Choi (2004) in that we examine the individual and
contextual determinants of sanctioning using administrative data. However, we build on their analysis in
several important ways. First, by examining sanctioning in the state of Florida, where the minority
population is not only sizeable but widely dispersed, we are able to examine racial effects across a large
number of geographic contexts at a lower level of aggregation that is both administratively and politically
meaningful (the county). As a result, we can directly test the interaction of local political ideology and
client racial characteristics. Second, because Florida is a racially diverse state, we are able to examine
disparities in sanctioning across blacks, whites, and Latinos. Third, by modeling sanctions using an event
history design, we are able to control for group differences in at-risk periods and directly test the
hypothesis that racial disparities will grow across the length of the welfare spell. And finally, by
extending our analysis to national data on TANF sanctions, we are not only able to test for the effects of

13
administrative decentralization, but we are able to provide a level of external validity that is absent in
prior studies of sanctioning.
RACE AND SANCTIONING IN THE FLORIDA TANF PROGRAM:
AN ANALYSIS OF ADMINISTRATIVE DATA
We have selected the Florida WT program for our study, not because it is typical of all state
TANF programs, but because it provides close to an ideal setting for analyzing how race and politics
affect local differences in the use of penalties. Since 1996, Florida, as a practitioner of “second-order
devolution,” has constructed one of the most decentralized TANF programs in the country. Frontline
services have been contracted out to public, non-profit, and for-profit providers throughout the state, and
primary authority over the WT program has shifted down to 24 local public/private “Regional Workforce
Boards” (RWBs). These RWBs are responsible for strategic planning, policy development, contracting,
and oversight of local one-stop delivery systems. Several of the regions encompass more than one county;
and the regional boards set policy in a way that allows for county offices to have some discretion in
implementing policies. The regional boards are overseen, not by state agencies, but by a statewide
public/private partnership called Workforce Florida, Inc. (WFI). The Florida Department of Children and
Families (DCF), a conventional state agency, receives the federal TANF block grant and maintains
responsibility for eligibility determination. But otherwise, Florida stands out among American states for
its emphasis on local control and privatization within a work-oriented TANF program (Botsko et al. 2001:
7).
Florida also scores high on factors that raise the importance of sanction decision processes. After
1996, Florida adopted “some of the strictest time limits and work requirements in the nation” and
broadened the pool of clients subject to sanctions by creating “few possibilities for exemptions” (Botsko
et al. 2001: 4). The sanctions themselves also fall at the strong end of the continuum, resulting in an
immediate, full-family loss of TANF benefits and a reduction of Food Stamp benefits to the fullest extent
permitted by federal law (Botsko et al. 2001: 6). Moreover, as we can see in Figure 1, Florida employs
sanctions at an extremely high rate compared to other states with full-family sanctions. Thus, it is not

14
surprising to find that Florida DCF identified sanctions as the most common cause of TANF case closings
in fiscal year 2003, accounting for 31 percent of closings vs. 21 percent for increased earnings.
The selection of Florida also aids our analysis because it offers significant variation on the two
most critical independent variables in our study: race and local political environment. Florida is one of
the most racially diverse states in the country, with sizeable black and Latino populations, and the state’s
TANF population displays even more diversity. Between January 2000 and March 2004, 36.2% of TANF
adults were black, 33.7% were white (non-Latino), and 28.5% were Latino. In addition, Florida is a
politically diverse state, a fact clearly reflected in recent presidential elections. Over the last three
presidential elections, the average Democratic share of the two-party vote across Florida’s 67 counties has
been approximately 44%, with a healthy standard deviation of 9.2%. The most conservative counties have
supported Republicans by a strong majority, with the Republican vote share as high as 75% in some
counties (e.g. Okaloosa, Santa Rosa, Clay). The most liberal counties have likewise supported Democrats
by a significant margin, with Broward and Gadsen counties leading the way (66% and 69% Democratic
vote share, respectively). In combination with Florida’s heavy emphasis on sanctioning and decentralized
approach to welfare provision, this variation in race and ideology provides an ideal setting for a study of
the joint effects of race and ideology on local sanction implementation.
Data and Methods
Our sample consists of individual-level administrative data for all new adult TANF clients who
entered WT during the 24-month period from January 2001 through December 2002,1 supplemented with
contextual data indicating how local implementing environments vary across the state’s 67 counties.
Thus, our entire period of analysis extends from January 2001 (first cohort enters) through November
2003 (12th month of spell for last cohort). We follow each of the 24 cohorts for up to a maximum of 12
consecutive months, ending our observations of the case at the spell’s termination or at the 12-month
mark, whichever comes first. We restrict our attention to the first TANF spell for each individual during
1 We define “new” TANF clients as those clients who have spent at least twelve continuous months without TANF benefits.

15
this period, defined based on continuous months of TANF receipt. As defined, and accounting for a small
percentage of cases for which values on some variables are missing, our total sample size exceeds 74,000
individuals who were subject to over 28,000 sanctions across approximately 200,000 person-month
observations.
As our data consist of variables that are measured at two levels of analysis (individual and
county), we examine the determinants of sanction usage by employing a discrete-time multilevel event
history analysis of the initiation of a sanction (Barber et al. 2000). Our dependent variable is Sanctiontjk -
a dichotomous variable which indicates whether or not client j, residing in county k has been sanctioned
in month t. We estimate our model using the logit link (i.e., as a hierarchical generalized linear model, or
HGLM), and therefore the effects of the independent variables are additive and represent the change in
the log odds of sanction. The independent variables include individual-level measures capturing client
effects, and county-level measures capturing community-context effects.2 The individual-level (level 1)
model is represented below in equation 1.
Sanctiontjk = β0k + β1k Blackj + β2k Latinoj + β3k (Blackj*Month of Spelltj)
+ β4k (Latinoj*Month of Spelltj) + β5k Number of Children(2)j
+ β6k Number of Children(3 or more)j + β7k Age of Youngest Child(3 months-2 yrs.)j
+ β8k Age of Youngest Child(3-4 years)j + β9k Age of Youngest Child(5-11 yrs.)j
+ β10k Age of Youngest Child(12 or more)j + β11k Education(H.S.)j + β12k Education(>H.S.)j
+ β13k Malej + β14k Citizenj + β15k Agej + β16k Single-Parentj + β17k Earned Incomej + β18k Month 2tj
+ β19k Month 3tj + β20k Month 4tj + β21k Month 5tj + β22k Month 6tj + β23k Month 7tj + β24k Month 8tj
+ β25k Month 9tj + β26k Month 10tj + β27k Month 11tj + β28k Month 12tj [1]
An important feature of a multilevel model is that the coefficients for the level 1 variables (the
β’s in equation 1) are permitted to vary across our level 2 units (counties). Based on theoretical
2 We provide detailed variable descriptions, including data sources and descriptive statistics for each variable used in the analyses that follow in an unpublished Appendix, available at www.xxx.xxx.

16
expectations, the county-level variables therefore enter the level 2 model as explanatory variables for
these effects. Our level 2 model is reflected below in equations 2-5 and reflects our theoretical
expectations concerning the effects of county-level variables on the intercept (β0k) of equation 1 (i.e., the
mean rate of sanctioning across counties), and on the slope values for Black and Latino (i.e. β1k and β2k).
β0k = γ00 + γ01Local Conservatismk + γ02Percent Blackk
+ γ03Percent Latinok + γ04Annual Wagek
+ γ05Unemployment Ratek + γ06Poverty Ratek + γ07Populationj + γ08TANF Caseloadj + ε0k [2]
β1k = γ00 + γ01Local Conservatismk + ε1k [3]
β2k = γ00 + γ01Local Conservatismk + ε2k [4]
βpk = γp0 for p = 3-28 [5]
Level 1 Hypotheses
To test the simple disparity hypothesis, we classify clients as belonging to one of three mutually
exclusive racial/ethnic group combinations: black, Latino, and white (non-Latino).3 We then include the
dichotomous variables Black and Latino in our model of sanction initiation, where we expect the
coefficient values in equation 1 will be positive for each of these variables (β1, β2 > 0), and the coefficient
for Black will be larger than the coefficient for Latino (β1 > β2). We test the time-contingent disparity
hypothesis by including two interaction terms in equation 1, Black*Month of Spell and Latino*Month of
Spell, where we expect that the coefficients for these variables will be positive (β3, β4 > 0).
Based on past research on sanctions and welfare implementation, we include a number of other
variables to control for variation in clients’ individual characteristics. These include variables measuring
the client’s sex (Male), citizenship status (Citizen), and age (Age). The age of the youngest child in the
TANF family is measured by a series of categorical variables, as is the number of children in the TANF
family. We include the client’s marital status (Single-Parent), and two indicators of human capital
(Earned Income and Education). All of these variables have been found to be important determinants of
3 We omit a very small percentage (<2%) of cases classified as “other race” by the state.

17
individual sanctioning outcomes in past research (Wu et al. 2006; Hasenfeld, Ghose and Larson 2004;
Kalil et al. 2002; Mancuso and Lindler 2001).
Finally, we include a series of dummy variables for each month of the spell to model the baseline
hazard of sanction. This strategy has the advantage of leaving the shape of the baseline hazard function
unspecified, which in this sense is analogous to the continuous-time formulation of the Cox proportional
hazards model (Beck, Katz and Tucker 1998).
Level 2 Hypotheses
We model the intercept of equation 1 (β0k) as a function of several different features of local
political, economic and social environments. Due to the theoretical importance of local ideology for our
analysis we rely on two alternative measurement strategies. First, for each of Florida’s 67 counties we
coded election results for 18 ideologically-relevant constitutional amendments that appeared on the ballot
throughout the entire state between 1996 and 2004. Based on a factor analysis of support for all 18
amendments, we used factor scores to create an index of county conservatism that runs from 0 (most
liberal county) to 1 (most conservative county). This index is labeled Local Conservatism and serves as
our primary measure of the local political environment in Florida. As an alternative measure, we rely on
the Republican share of the two-party presidential vote, averaged over the last three presidential elections.
Because partisanship tends to be imperfectly related to political ideology (Miller 1999), we believe our
amendment-based measure to be a more valid measure of local ideology. However, as we describe below,
our key results are consistent regardless of the indicator we use, enhancing our confidence in the validity
of our conclusions.4
In addition to local political ideology, we consider one additional dimension of the local political
environment: the local racial context. Previous studies have often found that racial context has a
significant impact on racially relevant policy outcomes, either through the effects of a “racial threat” felt
by the white majority (Key 1949), or the effects of increased minority political power (Keech 1968). 4 The simple correlation between our measure of county conservatism and our measure of the Republican vote share is reasonably strong at .65. Details on the construction of our amendment-based measure of county ideology are provided in our unpublished Appendix.

18
Because there is reason to suspect that either effect might exist (see Keiser, Mueser and Choi 2004), we
test for effects of community racial composition by including the percentage of the county population that
is black and Latino, respectively (Percent Black, Percent Latino).
Several additional measures capture the effects of local labor markets and employment
opportunities, which we expect to affect sanctioning in one of two ways. First, where employment
opportunities are relatively numerous and attractive, TANF clients may be more likely to work enough
hours to avoid falling out of compliance with TANF rules. Alternatively, local labor market conditions
may also influence the sanction decisions of case managers, who may be less inclined to sanction clients
when job opportunities are less numerous or less attractive. To capture such effects, we include the county
unemployment rate (Unemployment Rate), the county poverty rate (Poverty Rate), the level of
urbanization (as measured by county population - Population), and the annual local wage in food
service/drinking establishments (Annual Wage).
We also include a measure of the county TANF Caseload, expressed as a proportion of the
county’s population. As the caseload size increases, we might expect that, all else equal, administrative
pressures to reduce the caseload would result in an increase in sanctioning. Alternatively, as the caseload
size increases, if the number of case managers remains fixed, individual case managers may have less
time to closely monitor TANF clients for violations of rules, thus resulting in a lower rate of sanctioning.
Finally, we test the ideology-contingent disparity hypothesis by including Local Conservatism as
a predictor for the effects of Black (β1k) and Latino (β2k), as reflected in equations 3 and 4. As we expect
racial disparities to increase in conservative counties, we expect Local Conservatism to be positively
related to the effects of Black (β1k) and Latino (β2k), and thus γ11 and γ21 > 0.
Results
Table 1 presents results for two versions of our event history model that differ only in the
measure used to capture local ideological environment. For each version, we report both the coefficient

19
values and the associated odds ratios reflecting the proportional increase in the risk of sanction given a
one-unit increase in the independent variable.
We begin by examining the dynamics of sanctioning across the TANF spell, as reflected by the
effects of the month-of-spell dummies in equation 1 (which collectively reflect the baseline hazard of
sanctioning). For ease of interpretation, we do not report these results in Tables 1 and 2, but instead
present a graphical display in Figure 3. The vertical axis of the figure is the odds ratio of sanction, based
on the coefficient estimates for equation 1. Thus, for each month of the TANF spell reflected on the
horizontal in Figure 3, the associated odds ratio reflects the relative odds of sanction, compared to the
initial odds at month 1, for a client who has been on TANF throughout all of the preceding months, but
has not yet been sanctioned. As can be seen, the risk of sanction steadily decreases throughout the TANF
spell. Indeed, by month 5 of the spell the client’s risk of sanction has decreased by nearly 50% compared
to month 1.
[Figure 3]
Next, we examine the results for our control variables. As expected, we find that sanctions are
significantly related to clients’ individual traits in both specifications of our model. Specifically, TANF
sanctions are significantly more likely to be applied to the small number of men in the program, relative
to the large majority of women. The probability of being sanctioned is also higher for clients who are
younger, who are heads of two-parent families, who have older children, who are citizens, and who
possess less human capital (as measured by education level).
[Table 1]
Moving to our contextual variables, sanctioning appears to be significantly heavier in high-
poverty counties with large populations, yet significantly lower in counties with large TANF caseloads.
We find weaker effects for other aspects of the local economic context: neither unemployment rates nor
local wage levels prove to be consistent predictors. Nor do we find higher levels of minority presence in
the community to affect local sanctioning rates. In sum, these results are largely consistent with the results
of past studies, and therefore give us greater confidence in the results we report below (Wu et al. 2006;

20
Keiser, Mueser and Choi 2004; Hasenfeld, Ghose and Larson 2004; Kalil, Seefeldt and Wang 2002;
Mancuso and Lindler 2001; Westra and Routely 2000;).
Turning to an examination of our primary hypotheses, we begin with the simple disparity
hypothesis predicting that (1) the coefficients for Black and Latino should be positive (reflecting
significant black-white and Latino-white disparities in sanctioning), and (2) the coefficient for Black
should be larger than the coefficient for Latino (due to the presumed larger gap in group reputations
between blacks and whites). As specified, equation 1 models the effects of Black/Latino as interactive,
and therefore conditional on spell duration and the local political environment. To ease interpretation, we
transformed Local Conservatism, Republican Vote Share and Month of Spell by subtracting their means
prior to estimation, so that the coefficients for Black and Latino in Tables 1 and 2 reflect the effects of
race and ethnicity for clients who reside in a politically moderate county, and who are at a typical point in
the TANF spell (month 3). As can be seen from the coefficient estimates in Table 1, we find mixed
support for the simple disparity hypothesis. The coefficients for Black are statistically insignificant in
both specifications, and while the coefficient for Latino is statistically significant, the direction of the
effect is the opposite of what is expected and suggests that Latino clients are sanctioned at a rate that is
lower rate than whites and blacks alike.
By contrast, the results in Tables 1 offer strong support for the time-contingent disparity
hypothesis, as revealed by the significant interactions between race/ethnicity of client and a simple
counter variable (1-12) representing the month of the current TANF spell (Black*Month of Spell,
Latino*Month of Spell). This interaction between race/ethnicity and month of spell is extremely robust
across both specifications of our model and underscores the importance of employing a longitudinal
design, such as event history analysis, to study racial dynamics in TANF sanctioning.
We now turn our attention to the ideology-contingent disparity hypothesis, which predicts that
sanctioning disparities are conditioned by the political environment in which TANF is implemented. Our
test of this hypothesis is based on the estimation of cross-level interactions between the racial/ethnic
status of the client and our measures of local ideology (Local Conservatism in Model 1 and Republican

21
Vote Share in Model 2). The results reported in Table 1 strongly support our hypothesis. The effects of
racial/ethnic status are indeed mediated by the ideological orientation of the local political environment.
Not only is this the case regardless of which measure of local political ideology we use, we also find the
mediating effect of ideological climate to be statistically significant for both black and Latino clients
(although the effect is only weakly significant for Latino clients in Model 1). For both groups (blacks and
Latinos), movement from a liberal local environment to a conservative environment raises the probability
of being sanctioned, not just in absolute terms, but also relative to that of white non-Latinos.5 Given the
complexity of the results presented in Table 1 (due to interactions between race, time and ideology), we
present a series of graphical interpretations of these effects below in Figures 4 and 5.6
In Figure 4 we present three graphs of the predicted probability of sanction for “typical” black
and white clients, for months 3, 6 and 9 of the TANF spell.7 In each graph, the probability of sanction is
plotted against our measure of local conservatism, thus allowing us to see how the risk of sanction varies
across the entire range of local ideological context for both black and white clients. Figure 4 reveals
several interesting features of the relationship between race and sanctioning. We can see that as we move
from month 3 to month 9 in of the TANF spell, the overall risk of sanction decreases for both blacks and
whites (as reflected by the decreasing intercept values of the curves in the graphs). This is expected given
the pattern of the baseline hazard reported in Figure 1. However, this decrease in the rate of sanctioning is
not consistent across racial groups as whites display a significantly greater reduction in the risk of
sanction than blacks as spell duration increases. This pattern is anticipated given the significant
interaction between race and month of spell in our results.
5 One possible explanation for these results is that it is not ideology but rather the size of the minority population that mediates the effect of client race on sanctioning. To explore this possibility, we tested for interactions between racial/ethnic status of client and the black and Latino percentage of the county population (i.e. Black*Black% and Latino*Latino%). Neither term was statistically significant. 6 All illustrations are based on the results from Table 1. Similar patterns are observed when we use Republican Vote Share as our measure of local ideology. 7 We define a “typical” client as a U.S.-born 31 year-old single woman with 2 children (aged 5-12 years), less than 12 years of education an average level of earned income, who resides in an average county (reflecting mean values on all of the contextual variables).

22
[Figure 4]
Figure 4 also allows us to see how black-white disparities in sanctioning vary across the level of
local conservatism. In all three graphs, we see that as we move from the most liberal to the most
conservative environments, the probability of a black client being sanctioned, relative to that of a white
client, increases. However, the pattern of racial disparities changes in a substantively meaningful way as
the spell length increases. For clients in the third month of a TANF spell, we see that in liberal counties,
white clients are significantly more likely to be sanctioned than black clients for a large majority of
clients. Only in the most conservative counties does the predicted probability of sanction for blacks
exceed that of whites. As the length of the spell grows longer, however, black clients become consistently
more likely to experience a sanction than their white counterparts. Indeed, by the 9th month of the spell,
black clients are predicted to be sanctioned more than whites in every county, and at a rate that is
approximately 70% higher than that of whites in the most conservative counties
Figure 5 consists of three identically constructed graphs comparing predicted probabilities for
Latino clients and white clients. As can be seen, we observe several similarities between Figures 4 and 5
in the pattern of racial/ethnic disparities. The risk of sanction for a Latino client, relative to that of a white
client, increases as spell length increases, and as one moves from a liberal to a conservative political
climate. However, the magnitude of these changes in patterns of Latino-white disparities across these two
contexts seems smaller than what we observe for black clients in Figure 4. This is largely consistent with
our theoretical assumptions regarding relatively smaller reputational gaps between Latinos and whites,
(see Figure 2), and in this sense provides additional support for our hypotheses.8
[Figure 5]
8 We have replicated the analyses presented in Table 1 using two alternative estimation techniques used to analyze multilevel data – logistic regression with clustered standard errors (by county), and a 2-stage regression method. These results confirm the interaction between Black Client and Local Conservatism, but unlike the HLM results, also find a significant interaction between Hispanic Client and Local Conservatism. We do not present these results in this paper as we have the most confidence in the HLM results presented in this paper. However, we do provide these results for interested readers in our unpublished appendix to this paper.

23
Extending our Results Using National TANF Data
Thus far, our analysis of Florida TANF clients provides strong support for our racial
classification model of policy choice. Yet, due our examination of a single state, we are unable to test
Hypothesis 4, which predicts that the effects of race/ethnicity will be stronger in states that rely on
second-order devolution in TANF implementation. In addition, there may be reason to doubt the external
validity of our findings from Florida due to our focus on sanctioning patterns a single state. To address
these issues, we now turn to an analysis of sanctioning that incorporates individual-level data from all 50
states, available from the Office of the Assistant Secretary for Planning and Evaluation (ASPE) in the
Department of Health and Human Services.
The ASPE data consists of a series of state samples of TANF families collected by all 50 states
from 1999 through 2005. These data are used by the federal government for annual state performance
evaluations, and consist of two types of samples – active cases and closed cases. In addition to variables
measuring clients’ personal characteristics, the closed case samples also provide information concerning
the reason that the case was closed. Such reasons may include leaving welfare for employment, getting
married, and being sanctioned, among others. We therefore rely on these data from the closed case
samples to construct our dependent variable. Given that we limit the analysis to closed cases, we expect to
find some differences compared to the Florida sample that includes open as well as closed cases. Yet,
there is reason to think that sanction exits in this population are affected as we have hypothesized. For
our analysis, we pool all closed case samples for the entire 1999-2005 period. We restrict our analysis to
all adult TANF recipients who were identified as the head of the household by the state. Using this
definition, and accounting for some missing data, our final dataset consists of approximately 195,000
TANF adults, residing in nearly 2,700 different counties. Unfortunately, these data are purely cross-
sectional in nature, and therefore we cannot exactly replicate our analysis of sanctioning in Florida using
nationally representative data. However, these data do allow us to provide a strong test of the effects of
decentralized administration, as well as a limited replication of our tests of the simple disparity hypothesis
and the ideology-contingent disparity hypothesis.

24
Our dependent variable is Sanction Exitjk - a dichotomous variable which indicates whether or not
client j, residing in county k left TANF due to a sanction. We model the probability of a sanction exit as a
function of both individual level and contextual (county) variables. Therefore, we estimate a (cross-
sectional) multilevel model, using a logit link (as our dependent variable is dichotomous). The individual-
level (level 1) model is represented below in equation 6.
Sanction Exitjk = β0k + β1k Blackj + β2k Latinoj + β3k Number of Children(2)j
+ β4k Number of Children(3 or more)j + β5k Age of Youngest Child(3 months-2 yrs.)j
+ β6k Age of Youngest Child(3-4 years)j + β7k Age of Youngest Child(5-11 yrs.)j
+ β8k Age of Youngest Child(12 or more)j + β9k Education(12 yrs..)j + β10k Education(>12 yrs..)j
+ β11k Malej + β12k Citizenj + β13k Agej + β14k Single-Parentj + β15k Earned Incomej
+ β16k Public Housingj + β17kOASDIj + β18kSSIj + β19k Year2000j + β20k Year2001j
+ β21k Year2002j + β22k Year2003j + β23k Year2004j + β24k Year2005j [6]
The county-level (level 2) model is represented below in equations 7-10.
β0k = γ00 + γ01Republican Vote Sharek + γ02Percent Blackk + γ03Percent Latinok + γ04Per Capita Incomek
+ γ05Unemployment Ratek + ε0k [7]
β1k = γ10 + γ11 Republican Vote Sharek + ε1k [8]
β2k = γ20 + γ21 Republican Vote Sharek + ε2k [9]
βpk = γp0 for p = 3-24 [10]
Level 1 Hypotheses
To test the simple disparity hypothesis, we once again classify clients as black, Latino, and white
(non-Latino) and include the dichotomous variables Black and Latino. We expect the coefficient values
will be positive for each of these variables (β1, β2 > 0), and the coefficient for Black will be larger than the
coefficient for Latino (β1 > β2).
We also include a number of other variables to control for variation in clients’ individual
characteristics. Many of these variables are identical (or very similar) to the variables we included in our

25
analysis of Florida TANF clients. These include variables measuring the client’s gender (Male),
citizenship status (Citizen), age (Age), the age of the youngest child in the TANF family, the number of
children in the TANF family, the client’s marital status (Single-Parent), and two indicators of human
capital (Earned Income and Education). We also take advantage of information in the national TANF
dataset and include three additional indicators of client hardship. These include two dichotomous
variables indicating whether a former TANF client received disability benefits through the Social Security
or Supplemental Security Income programs (OASDI, SSI), and whether a TANF family lived in public
housing (Public Housing). Finally, we include a series of dummy variables for the year that the TANF
sample was collected.
Level 2 Hypotheses
As in our analysis of Florida TANF clients, we model the intercept of equation 6 (β0k) as a
function of local political, economic and social conditions. To measure the local political context in the
national data, we rely on the Republican share of the two-party presidential vote, averaged over the last
three presidential elections (Republican Vote Share). We also control for the local racial context by
including the percentage of the county population that is black and Latino, respectively (Percent Black,
Percent Latino). To capture the effects of local economic conditions, we include the county
unemployment rate (Unemployment Rate) and per capita income (Per Capita Income). Finally, we test the
ideology-contingent disparity hypothesis by including Republican Vote Share as a predictor for the effects
of Black (β1k) and Latino (β2k), as reflected in equations 8 and 9. As we expect racial disparities to be
larger in conservative counties, we expect γ11 and γ21 to be positive.
To test Hypothesis 4 (the Decentralization-Contingent Disparity Hypothesis), we estimate our
model separately for the 36 state governments that administer TANF directly, and the 14 states that have
devolved significant authority in TANF implementation to local governments or regional workforce

26
boards – i.e., states with second-order devolution (SOD) (Gainsborough 2003).9 For reasons outlined
above, we expect that the effects of racial classification may be enhanced in SOD states, and as a result,
racial classification may more likely to result in racial disparities in sanctioning outcomes.
Results
The results of our analyses are presented in Table 2. Once again, we find that sanctions are
significantly related to clients’ individual traits, within both SOD and centralized (i.e. non-SOD) states.
The probability of being sanctioned is higher for clients who are younger, who have older children (SOD
states only), who are citizens, and who possess less human capital (as measured by education level and
earned income). These results are generally consistent across SOD and non-SOD states, and they are
generally consistent with our results from Florida. However, the effects of several variables diverge from
our initial findings from Florida. For example, gender plays no role in sanctioning in SOD states, and in
centralized states it is women, as opposed to men, who are more likely to be sanctioned. In addition, while
being a single parent has no effect on sanctioning in SOD states, we find that single parents are more
likely (rather than less likely) to be sanctioned in centralized states. Finally, we see that clients who
receive disability benefits or live in public housing are significantly more likely to have left TANF due to
a sanction, perhaps reflecting significant employment barriers among these clients.
[Table 2]
Moving to our contextual variables, sanction exits are significantly more likely to occur in
counties with larger black populations, as well as in counties with larger Latino populations (in
centralized states). We find weaker effects for the local economic context, although the unemployment
rate is positively related to sanction exits in centralized states.
We now turn our attention to the tests of the simple disparity and ideology-contingent disparity
hypotheses, and the relative performance of these hypotheses across SOD and centralized administrative
environemnts. As in our initial analysis of TANF sanctioning among Florida clients, we centered
9 These 14 states include Arkansas, California, Colorado, Florida, Maryland, Michigan, Minnesota, New York, North Carolina, Ohio, Tennessee, Texas, Utah and Wisconsin.

27
Republican Vote Share by subtracting its mean so that the coefficients for Black and Latino in Table 3
reflect the effects of race and ethnicity in a typical (i.e., politically moderate) county. As we saw in
Florida, the results for the national data find the effects of race and ethnicity to be insignificant in such a
county, in both SOD and non-SOD states. However, this does not mean to suggest that racial disparities
are entirely absent, as evidenced by the results of our test of the ideology-contingent hypothesis. As in our
Florida analysis, our test of this hypothesis is based on the estimation of cross-level interactions between
the racial/ethnic status of the client and our measure of local ideology (Republican Vote Share). Among
black clients, the effect of racial status is indeed mediated by the ideological orientation of the local
political environment. And consistent with theoretical expectations concerning the nature of the
implementation environment, the effect is limited to SOD states. However, we find no interaction
between ethnicity (Latino) and the local political environment in either sample of states.
In Figure 6, we provide a graphical illustration of the relationship between race and sanctioning in
SOD states which offers a clearer understanding of exactly how this relationship is mediated by local
ideology. Figure 6 presents the predicted probability of a sanction exit for a typical client, by the race of
the client and the local political environment.10 As we saw in Florida (see Figure 4), black clients and
white clients are predicted to be sanctioned at more or less equivalent rates in the most liberal counties.
But as we move to the right along the horizontal axis, we see that racial disparities quickly emerge in the
anticipated direction. Given the consistency of this finding across two very different datasets and research
designs, this result provides important confirmation of the mediating effects of local ideology and
administrative decentralization, and ultimately, our Racial Classification Model of policy choice.
[Figure 6]
CONCLUSION
Poverty governance in the United States has been redefined over the past several decades by a
turn to more custodial and paternalist policy approaches. Today, low-income Americans confront a web
10 We define a “typical” client as a U.S.-born 31 year-old single woman with 2 children (aged 5-12 years), less than 12 years of education an average level of earned income, who resides in an average county (reflecting mean values on all of the contextual variables).
28
of policies that place greater emphasis on behavioral expectations, supervision, and disciplinary action.
Leading scholars have called for greater efforts to theorize this “penalization of poverty” (Wacquant
2001) and for more direct analyses of how paternalist rules and penalties are implemented at the
administrative frontlines (Mead 2004). As students of American politics turn to these crucial tasks, we do
so against a historical backdrop that makes discussion of race and local politics virtually unavoidable.
Behavioral regulation and the maintenance of social order have traditionally been state and local functions
under U.S. federalism (Lowi 1998), and race relations have often stood at the center of the local political
dynamics that have shaped both poor relief and punishment (Lieberman 1998; Zimring 2003).
The contemporary turn toward discipline, of course, occurs in a post-civil-rights era that is distant
from earlier eras in which caste-like race relations drove overt practices of discrimination, exploitation,
and oppression. Yet it remains tempting to fall back on these earlier eras as simplifying templates as we
turn today to the question of how, if at all, race affects the official application of disciplinary policy tools.
As Loic Wacquant (1997) has explained, scholarly analyses of race in the U.S. are frequently held captive
by “the logic of the trial”: actors and institutions are held up to scrutiny and deemed racist or non-racist,
discriminatory or unbiased, prejudiced or not. The effect of race is all encompassing or non-existent.
In this paper, we have sought to replace such simplifying logics with a more subtle and
contingent account of how race matters for the implementation of sanctions under contemporary welfare
reform. The evidence presented here provides striking confirmation that racial classification remains
central to the operation of poverty governance in the United States. Yet our racial classification model of
policy choice suggests, and our empirical results confirm, that racial disparities in treatment arise to a
greater degree in some places than in others, and for some client subgroups more than others. Indeed,
under some conditions specified here, black and Latino welfare recipients emerge as no more likely, or
even less likely, than their white counterparts to be sanctioned. Minority disadvantage arises in the
disciplinary process primarily as a function of community and client characteristics that heighten the
degree of contrast associated with racial-group reputations.

29
In the welfare context, for example, long-term program usage is a discrediting mark that can
associate a recipient with dependency, irresponsibility, and lack of effort. The toll imposed by this
discrediting mark, however, turns out to vary across racial groups in our analysis. As TANF participation
spells grow longer, it is minority, and especially black, clients who become increasingly subject to
penalties. This result is consistent, not only with the RCM, but also with a line of experimental research
suggesting that welfare reliance has different meanings when attached to blacks and whites (Gilens 1999)
and that stigmatizing, stereotype-consistent cues interact with racial status to disadvantage blacks relative
to whites (Pager 2003; Valentino, Hutchings, and White 2002). In the Florida WT program, black-white
disparities increase over the course of the participation spell, suggesting that blacks are disproportionately
tainted by – and ultimately taxed for – the stigma of long-term program usage.
Likewise, we find that racial disparities in sanctioning depend significantly on the local context.
Larger disparities emerge in more ideologically conservative jurisdictions, and within administrative
structures which delegate significant discretion to local decision-makers. Our interpretation of these
results flows, once again, from the basic premises of the RCM. According to this model, racial disparities
in policy treatment should emerge to a greater degree in those times and places where officials are more
likely to hold stereotypes that distinguish racial groups in policy-relevant ways, and where such officials
are afforded a greater opportunity to translate those beliefs into policy outcomes.
In addition to shedding light on when and how race matters for policy choice, these results have
significant implications for the growing body of research on TANF implementation. Econometric
analyses of TANF outcomes, including sanction rates, have generally ignored the political and
organizational context of implementation. Our analysis suggests that such models may be under-specified
in ways that produce a distorted picture of sanctioning processes and outcomes. Equally important, our
analysis suggests a more troubling account of racial disparities than one often finds in many econometric
studies. When prior studies have found racial disparities, it has been quite reasonable to ask whether the
group differences were simply due to unobserved heterogeneity: perhaps the racial disparity only
indicated that minority and white clients with similar demographic profiles actually behaved in different

30
ways. Our study calls attention to a different pattern of results. We have not reported simply that a racial
disparity exists that we cannot explain away based on our collection of demographic controls; we have
found that the extent of racial disparities in sanctioning rises or falls systematically depending on the
political environment. There is, of course, little reason to suspect that black-white or Latino-white
differences in individual behavior would vary across liberal and conservative jurisdictions, or across
administrative structures. Thus, the findings point to a racial effect that seems far harder to dismiss as not
being “really” about race.
Finally, we end with a broader point about the history of welfare provision. Scholars have often
suggested that welfare has followed a “vicious cycle” in which social inequalities have shaped policy
choices that, in turn, have recreated social inequalities (Mettler 1998; Lieberman 1998; Schram 2006).
Negative images of a target group guide policy design and implementation, and policy designs are then
implemented in ways that reinforce negative group outcomes and reputations (Schneider and Ingram
1993; Schram 1995, 2005). The analysis presented here raises the prospect that such dynamics may be at
work today in contemporary welfare reform. Racial politics contributed greatly to federal welfare reform
in 1996 (Gilens 1999; Soss and LeClair 2004), which devolved substantial policy authority to the states.
State policy choices regarding TANF rules and penalties were then significantly influenced by racial
composition (Fellowes and Rowe 2004; Fording 2003; Soss et al. 2001). Nationally, these racialized state
choices resulted in black and Latino families being disproportionately concentrated in the policy regimes
with the toughest rules and sanctions (Soss et al. 2003). And as we have shown, among the states that
adopted the toughest sanctions, racial composition appears to have a significant relationship with the rates
at which sanctions are applied. Moving further downward to the state and local level, our analysis
suggests that race matters in substantial but variable ways for frontline decisions to impose discipline.
Today as in the past, public aid for poor women and children remains entangled with the complex
interplay of race, politics, and local policy control.

31
References
Barber, Jennifer S., Susan A. Murphy, William G. Axinn, and Jerry Maples. 2000. “Discrete-Time
Multilevel Hazard Analysis.” Sociological Methodology 30:201–35.
Beck, Nathaniel, Jonathan Katz and Richard Tucker. 1998. “Taking Time Seriously: Time-
Series{Cross-Section Analysis with a Binary Dependent Variable." American Journal
of Political Science 42(4):1260{1288.
Botsko, Christopher, Kathleen Snyder, and Jacob Leos-Urbel. 2001. Recent Changes in Florida
Welfare and Work, Child Care, and Child Welfare Systems. Washington, DC: Urban Institute.
Cook, Fay Lomax and Edith J. Barrett. 1992. Support for the American Welfare State: The Views of
Congress and the Public. New York: Columbia University Press.
Crenshaw, Kimberle. 1991. “Mapping the Margins: Intersectionality, Identity Politics, and
Violence against Women of Color.” Stanford Law Review 43 (6): 1241-1299.
Devine, Patricia G. and Sarah M. Baker. 1991. “Measurement of Racial Stereotype Subtyping.”
Personality and Social Psychology Bulletin 17: 44-50.
Domke, David. 2001. “Racial Cues and Political Ideology.” Communication Research 28(6): 772-801.
Eberhardt, Jennifer L., Paul G. Davies, Valerie J. Purdie-Vaughns, and Sheri Lynn Johnson. 2006.
“Looking Deathworthy: Perceived Stereotypicality of Black Defendants Predicts Capital
Sentencing Outcomes.” Psychological Science 17(5): 383-86.
Ehrlich, Isaac. 1996. “Crime, Punishment, and the Market for Offenses.” Journal of Economic
Perspectives 10 (1): 43-67.
Federico, Christopher M., and Sidanius, Jim. 2002. “Sophistication and the Antecedents of Whites’ Racial
Policy Attitudes: Racism, Ideology, and Affirmative Action in America.” Public Opinion
Quarterly 66(2): 145-176.
Fellowes, Matthew and Gretchen Rowe. 2004. “Politics and the New American Welfare States.”
American Journal of Political Science 48 (2): 362-73.

32
Fording, Richard C. 2003. “‘Laboratories of Democracy’ or Symbolic Politics? The Racial Origins of
Welfare Reform.” In S.F. Schram, J. Soss, and R.C. Fording, eds., Race and the Politics of
Welfare Reform. Ann Arbor, MI: University of Michigan Press.
Fording, Richard C., Joe Soss and Sanford F. Schram. 2007. “Devolution, Discretion and the Impact of
Local Political Values on TANF Sanctioning.” Social Service Review 81(2):285-316.
Foucault, Michel. 1979. Discipline and Punish: The Birth of the Prison. New York, NY: Vintage Books.
Fox, Cybelle. 2004. “The Changing Color of Welfare? How Whites' Attitudes toward Latinos Influence
Support for Welfare.” American Journal of Sociology 110 (3): 580–625.
Gainsborough, Juliet F. 2003. “To Devolve or Not to Devolve? Welfare Reform in the States.” Policy
Studies Journal 31(4): 603-23.
Gilens, Martin. 1999. Why Americans Hate Welfare: Race, Media, and the Politics of Antipoverty Policy.
Chicago: University of Chicago Press.
Glaser, James M. 1994. “Back to the Black Belt: Racial Environment and White Racial Attitudes
in the South.” Journal of Politics 56 (1): 21-41.
Hancock, Ange-Marie. 2006. The Politics of Disgust. New York: New York University Press.
Hasenfeld, Yeheskel, Toorjo Ghose, and Kadyce Larson. 2004. “The Logic of Sanctioning Welfare
Recipients: An Empirical Assessment.” Social Service Review 78 (2): 304-19.
Hero, Rodney. 1998. Faces of Inequality: Social Diversity in American Politics. New York: Oxford
University Press.
Jacobs, David and Jason T. Carmichael. 2002. “The Political Sociology of the Death Penalty: A Pooled
Time-Series Analysis.” American Sociological Review 67 (1): 109-131.
Johnson, Monica Kirkpatrick, and Margaret Mooney Marini. 1998. “Bridging the Racial Divide in the
United States: The Effect of Gender.” Social Psychology Quarterly 61(3): 247-258.
Kalil, Ariel, Kristin S. Seefeldt, and Hui-chen Wang. 2002. “Sanctions and Material Hardship under
TANF.” Social Service Review 76 (4): 643–62.

33
Katznelson, Ira. 2005. When Affirmative Action Was White: An Untold History of Racial Inequality in
Twentieth-Century America. Reprint Edition. New York: W.W. Norton.
Keech, William R., 1968 [1981]. The Impact of Negro Voting: The Role of the Vote the Quest for
Equality. Chicago: Rand McNally, Westport, CT: Greenwood.
Keiser, Lael R., Peter Meuser, and Seung-Whan Choi. 2004. “Race, Bureaucratic Discretion, and
the Implementation of Welfare Reform.” Journal of Political Science 48 (2): 314-27.
Key, V.O., Jr. 1949. Southern Politics in State and Nation. New York: Knopf.
Lasswell, Harold. 1936. Politics: Who Gets, What, When, How. New York, NY: McGraw-Hill.
Lieberman, Robert. 1998. Shifting the Color Line: Race and the American Welfare State. Cambridge:
Harvard University Press.
Lowi, Theodore J. 1998. “Think Globally, Lose Locally.” Boston Review
http://www.bostonreview.net/BR23.2/lowi.html.
Mancuso, David, and Vanessa L. Lindler. 2001. “Examining the Circumstances of Welfare
Leavers and Sanctioned Families in Sonoma County [CA], Final Report.” Burlingame, CA: The
SPHERE Institute.
Mead, Lawrence M. 2004. Government Matters: Welfare Reform in Wisconsin. Princeton, NJ: Princeton
University Press.
Mendelberg, Tali. 2001. The Race Card: Campaign Strategy, Implicit Messages, and the Norm of
Equality. Princeton, NJ: Princeton University Press.
Mettler, Suzanne. 1998. Dividing Citizens: Gender and Federalism in New Deal Public Policy. Ithaca,
NY: Cornell University Press.
Miller, Warren E. 1999. “Temporal Order and Causal Inference.” Political Analysis 8:119-46.
Oliver, J. Eric, and Tali Mendelberg. 2000. “Reconsidering the Environmental Determinants of White
Racial Attitudes.”American Journal of Political Science, 44(3): pp. 574-589.
Pager, Devah. 2003. “The Mark of a Criminal Record.” American Journal of Sociology 108: 937-75.
Pavetti, LaDonna A., Kathleen A. Maloy, Peter Shin, Julie Darnell, and Lea Scarpulla-Nolan.

34
1998. “A Description and Assessment of State Approaches to Diversion Programs and Activities
under Welfare Reform.” Report prepared for Office of the Assistant Secretary for Planning and
Evaluation, Mathematica Policy Research, Washington, D.C.
Pavetti, LaDonna, Michelle K. Derr, and Heather Hesketh. 2003. “Review of Sanction Policies
and Research Studies: Final Literature Review.” Report prepared for Office of the Assistant
Secretary for Planning and Evaluation, Mathematica Policy Research, Washington, D.C.
Peffley, Mark, Jon Hurwitz, and Paul Sniderman. 1997. “Racial Stereotypes and Whites’ Political Views
of Blacks in the Context of Welfare and Crime.” American Journal of Political Science 41(1):
30-60.
Richards, Zoe and Miles Hewstone. 2001. “Subtyping and Subgrouping: Processes for the Prevention and
Promotion of Stereotype Change.” Personality and Social Psychology Review 5 (1): 52-73.
Schneider, Anne and Helen Ingram. 1993. “Social Construction of Target Populations: Implications for
Politics and Policy.” American Political Science Review 87:334-47.
Schram, Sanford F. 2006. Welfare Discipline: Discourse, Governance and Globalization. Philadelphia:
Temple University Press.
Schram, Sanford F. 1995. Words of Welfare: The Poverty of Social Science and the Social Science of
Poverty. Minneapolis: University of Minnesota Press.
Schram, Sanford F. 2005. “Contextualizing Racial Disparities in American Welfare Reform:
Toward a New Poverty Research.” Perspectives on Politics 3 (2): 253-68.
Schuman, Howard, Charlotte Steeh, Lawrence Bobo, and Maria Krysan. 1997. Racial Attitudes in
America: Trends and Interpretations, rev. ed. Cambridge: Harvard University Press.
Sears, David O. Jim Sidanius, and Lawrence Bobo, ed. 2000. Racialized Politics: The Debate
About Racism in America. Chicago: University of Chicago Press.
Soss, Joe and Danielle LeClair 2004. “Race, Sex, and the Implicit Politics of Welfare Reform.”
Paper presented at the Annual Meeting of the Midwest Political Science Association, April 2004.

35
Soss, Joe, Sanford F. Schram, Thomas Vartanian, and Erin O’Brien. 2001. “Setting the Terms of Relief:
Explaining State Policy Choices in the Devolution Revolution.” American Journal of Political
Science 45 (2): 378-95.
Soss, Joe, Sanford F. Schram, Thomas Vartanian, and Erin O’Brien. 2003. “The Hard Line and the Color
Line: Race, Welfare, and the Roots of Get-Tough Reform.” In S.F. Schram, J. Soss, and R.C.
Fording, eds. Race and the Politics of Welfare Reform. Ann Arbor, MI: University of Michigan
Press. pp.225-53.
Starobin, Paul. 1998. “The Daddy State.” National Journal. March 28: 678-83.
Valentino, Nicholas A., Vincent Hutchings, and Ismail K. White. 2002. “Cues that Matter: How Political
Ads Prime Racial Attitudes During Campaigns.” American Political Science Review. 96: 75-90
Valentino, Nicholas A., and David O Sears. 2005. “Old Times There Are Not Forgotten: Race and
Partisan Realignment in the Contemporary South.” American Journal of Political Science 49 (3):
672.
Wacquant, Loïc. 1997. “For an Analytic of Racial Domination.” Political Power and Social Theory. 11:
221-234.
Wacquant, Loic. 2001. “The Penalisation of Poverty and the Rise of Neo-Liberalism,” European Journal
on Criminal Policy and Research 9 (4): 401-411.
Western, Bruce. 2006. Punishment and Inequality in America. New York, NY: Russell Sage Foundation.
Westra, Karen and John Routely. 2000. “Arizona Cash Assistance Exit Study, First Quarter 1998.
Wu, Chi-Fang, Maria Cancian, Daniel R. Meyer, and Geoffrey Wallace. 2006. “How Do Welfare
Sanctions Work?” Social Work Research 30 (1): 33-51.
Zimring, Franklin E. 2003. The Contradictions of American Capital Punishment. New York, NY: Oxford
University Press.

36
TABLE 1. Discrete-Time Multilevel Event History Models of Sanction Initiation
Model 1 Odds β Ratio
Model 2
Odds β Ratio
Intercept (β0k) Intercept (γ00) -1.198** 0.384 -0.854** 0.426 Local Conservatism (γ01) 0.133 1.142 --- --- Republican Vote Share (γ01) --- --- -0.003 0.997 Black% (γ02) -0.005 0.995 -0.008 0.992 Latino% (γ03) -0.001 0.999 -0.002 0.997 Annual Wage (γ04) -0.038 0.963 -0.036 0.965 Unemployment Rate (γ05) 0.003 1.003 0.006 1.006 Poverty Rate (γ06) 0.040** 1.041 0.040** 1.041 Population (γ07) 0.295** 1.295 0.243** 1.243 TANF Caseload (γ08) -0.227** 0.797 -0.235** 0.791 Race/Ethnicity (reference=white)
Black (β1k) Intercept (γ10) -0.041 0.960 -0.020 0.980 Local Conservatism (γ11) 0.371** 1.449 --- --- Republican Vote Share (γ11) --- --- 0.007** 1.449 Latino (β2k) Intercept (γ20) -0.139** 0.870 -0.101** 0.904 Local Conservatism (γ21) 0.376+ 1.458 --- --- Republican Vote Share (γ21) --- --- 0.010* 1.010 Black * Month of Spell (β3k) Intercept (γ30) 0.065** 1.067 0.065** 1.067 Latino * Month of Spell (β4k) Intercept (γ40) 0.035** 1.035 0.035** 1.035 Number of children (reference = 0 - 1):
Two (β5k) Intercept (γ50) -0.024 0.976 -0.024 0.976 Three or more (β6k) Intercept (γ60) -0.025 0.975 -0.025 0.975 Age of youngest child (reference = 0 – 2 months):
3 months – 2 years (β7k) Intercept (γ70) 0.567** 1.763 0.567** 1.763 3 – 4 years (β8k) Intercept (γ80) 0.656** 1.927 0.656** 1.927 5 – 12 years (β9k) Intercept (γ90) 0.740** 2.097 0.740** 2.097 More than 12 years (β10k) Intercept (γ100) 0.758** 2.134 0.758** 2.134 Education (reference = <H.S.)
H.S. Education (β11k) Intercept (γ110) -0.322** 0.724 -0.323** 0.724 More than H.S. Education (β12k) Intercept (γ120) -0.483** 0.617 -0.483** 0.617 Male (β13k)
Intercept (γ130)
0.190**
1.209
0.190**
1.209
Citizen (β14k) Intercept (γ140) 0.154+ 1.166 0.154+ 1.166 Age (β15k) Intercept (γ150) -0.022** 0.979 -0.022** 0.979 Single-Parent (β16k) Intercept (γ160) -0.200** 0.819 -0.200** 0.819 Wage Income (β17k) Intercept (γ170) -0.007 0.993 -0.007 0.993 Number of Subjects (Level 1) Number of Failures Time at Risk (Person-Months) Number of Counties (Level 2)
74,517 28,307 198,147
66
74,517 28,307
198,147 66
*p<.05, **p<.01, +p<.10 Note: The analysis was conducted using HLM 6 (HLM2 module). The cell entries are binary logit coefficients, with significance levels determined based on robust standard errors. Each model includes dummy variables for the duration of spell (months 1-12). These results are not shown, but are available from the authors upon request.

37
TABLE 2. Multilevel Logistic Regression Models of Sanction Exits, for TANF Clients in SOD and Centralized States
SOD Centralized States States
Intercept (β0k) Intercept (γ00) -7.909** -10.840** Republican Vote% (γ01) 0.032** 0.040** Black% (γ02) 0.021** 0.023** Latino% (γ03) -0.004 0.011** Per Capita Income (γ04) 0.001 -0.000 Unemployment Rate (γ05) 0.016 0.070** Race/Ethnicity (reference=white)
Black (β1k) Intercept (γ10) 0.086 0.113 Republican Vote Share (γ11) 0.010* 0.001 Latino (β2k) Intercept (γ20) -0.020 0.030 Republican Vote Share (γ21) 0.001 0.001 Number of children (reference = 0 - one):
Two (β3k) Intercept (γ30) 0.120** 0.082** Three or more (β4k) Intercept (γ40) 0.240** 0.163** Age of youngest child (reference = 0 – 2 months):
3 months – 2 years (β5k) Intercept (γ50) -0.336** 0.659** 3 – 4 years (β6k) Intercept (γ60) -0.038 0.724** 5 – 12 years (β7k) Intercept (γ70) -0.072 0.720** More than 12 years (β8k) Intercept (γ80) 0.016 0.689** Education (reference = <H.S.)
H.S. Education (β9k) Intercept (γ90) -0.178** 0.252** More than H.S. Education (β10k) Intercept (γ100) -0.432** -0.392** Male (β11k)
Intercept (γ110)
0.035
-0.208**
Citizen (β12k) Intercept (γ120) 0.407** 0.545** Age (β13k) Intercept (γ130) -0.020** -0.020** Single-Parent (β14k) Intercept (γ140) 0.042 0.144** Earned Income (β15k) Intercept (γ150) -0.001** -0.002** Public Housing (β16k) Intercept (γ160) 0.089 0.183** OASDI (β17k) Intercept (γ170) 0.833** 1.061** SSI (β18k) Intercept (γ180) 1.357** 1.268** Number of Clients (Level 1) Number of Counties (Level 2)
44,691 151,457 963 1,708
*p<.05, **p<.01, +p<.10 Note: The analysis was conducted using HLM 6 (HLM2 module). The cell entries are binary logit coefficients, with significance levels determined based on robust standard errors. Each model includes dummy variables for the year the state sample was collected (1999-2006). These results are not shown, but are available from the authors upon request.

38
FIGURE 1. Scatterplot of the Relationship between the Racial/Ethnic Composition of the TANF Caseload and the Work-Related Sanction Rate, FY2002
% o
f TA
NF
Cas
es C
lose
d D
ue to
Wor
k-R
elat
ed S
anct
ion
FLORIDA
HAWAII
IDAHO
IOWA
KANSAS
MARYLAND
MICHIGAN
MISSISSIPPI
NEBRASKA
OKLAHOMA
SOUTH CAROLINA
TENNESSEE
VIRGINIA
WYOMING
b = .19 (t = 3.00) R2 = .43
80 20 40 60% of TANF Caseload Black or Hispanic
0
25
20
15
10
5
0
Note: The sample for this analysis consists of the 14 states which enforced immediate, full-family sanctions in 2002. The horizontal axis is computed as the sum of the percentage of TANF families that are African-American and the percentage that are Hispanic, based on data reported for April, 2002. The vertical axis is the percentage of cases closed due to a work-related sanction during fiscal year 2002. These data are reported in the Sixth Annual Report to Congress, published by the Office of Family Assistance in the Department of Health and Human Services (http://www.acf.hhs.gov/programs/ofa/annualreport6/ar6index.htm).

39
FIGURE 2. Average Gap in Perceived Laziness of Racial Groups, by Ideological Identification of Respondents
Black vs. WhiteHispanic vs. White
Conservative Respondents
Moderate Respondents
Liberal Respondents
Gap
in G
roup
Rep
utat
ions
for L
azin
ess .8
.6
.4
.2
0
Note: The sample for this analysis is taken from 2004 National Election Study and includes respondents of all races. The vertical axis represents the difference in the mean assessment of laziness for each pair of target groups (the mean score for blacks/Hispanics minus the mean score for white), where the laziness scale is coded as follows: 1=hardworking thought 7=lazy.
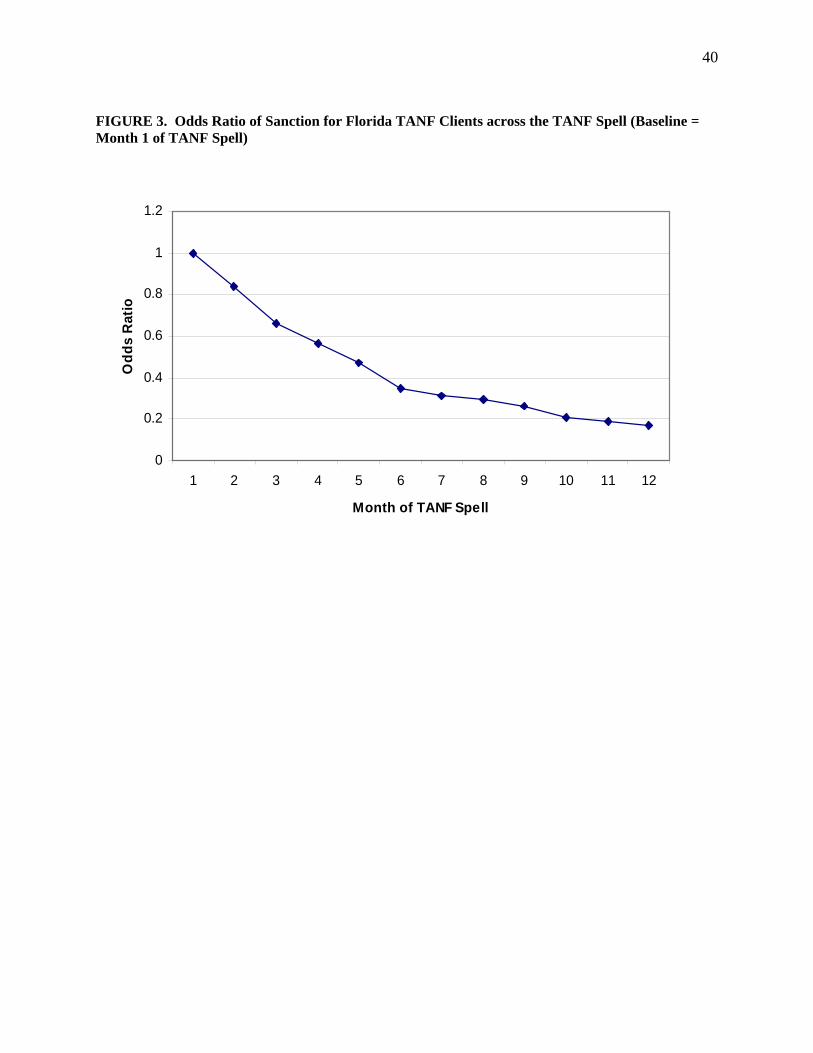
40
FIGURE 3. Odds Ratio of Sanction for Florida TANF Clients across the TANF Spell (Baseline = Month 1 of TANF Spell)
0
0.2
0.4
0.6
0.8
1
1.2
1 2 3 4 5 6 7 8 9 10 11 12
Month of TANF Spell
Odd
s R
atio

41
FIGURE 4. Predicted Probability of Being Sanctioned for Florida TANF Clients, by Race, Local Political Environment and Month of TANF Spell
0
0.050
0.100
0.150
0.200
Month 3 of TANF Spell
0 Local Conservatism
.75 1.00 .25 .50
White Client
Pred
icte
d Pr
obab
ility
of S
anct
ion Black Client
Month 6 of TANF Spell
1.000
0.050
0.100
0.150
0.200
.25 .50 .75
Local Conservatism 0
White ClientBlack Client
Pred
icte
d Pr
obab
ility
of S
anct
ion
Month 9 of TANF Spell
Pred
icte
d Pr
obab
ility
of S
anct
ion
0.200
0.150
0.100
0.050
0 0
.25 Local Conservatism
1.00 .75 .50
White ClientBlack Client

42
FIGURE 5. Predicted Probability of Being Sanctioned for Florida TANF Clients, by Ethnicity, Local Political Environment and Month of TANF Spell
Month 3 of TANF Spell
0 0
.25 .50 .75 1.0
Local Conservatism
0.200
Pred
icte
d Pr
obab
ility
of S
anct
ion White Client
Latino Client
0.150
0.100
0.050
Month 6 of TANF Spell
0 0
0.200
0.150
0.100
0.050
1.0 .75 .50 .25
Pred
icte
d Pr
obab
ility
of S
anct
ion White Client
Latino Client
Local Conservatism
Month 9 of TANF Spell
0 .25
0.150
0.200
0.100
0.050
0 1.0 .50 .75
Local Conservatism
Pred
icte
d Pr
obab
ility
of S
anct
ion White Client
Latino Client

43
FIGURE 6. Predicted Probability of Sanction in Second-Order Devolution States, by Race of Client and Local Political Environment
84.8666.4948.1229.75011.39
0.250
0.188
0.125
0.063
White Client
Prob
abili
ty o
f San
ctio
n Ex
it Black Client
Republican Vote%
Note: Predicted probabilities were calculated based on the results presented in Table 3, for the SOD sample of states.
Unpublished Appendix to
“Distributing Discipline:
Race, Politics, and Punishment at the Frontlines of Welfare Reform”
Richard C. Fording Department of Political Science
University of Kentucky Lexington, KY 40506-0027
Joe Soss
Humphrey Institute of Public Affairs University of Minnesota 301 19th Avenue South Minneapols, MN 55455
Sanford F. Schram Graduate School of Social Work and Social Research
Bryn Mawr College 300 Airdale Road
Bryn Mawr, PA 19010-1697 [email protected]

Table A1. Variable Definitions, Sources, and Descriptive Statistics for Analyses Presented in Table 1
Independent Variables
Definition
Mean
S.D.
Minimum- Maximum
Individual characteristics:
Gender 0 = female, 1 = male .159 .366 0-1 Age Client age (in years) 31.6 9.2 18-72 Marital status
1 = single parent, 0=otherwise, based on no. of adults in family .751 .432 0-1
Number of children (ref. = 0 - 1): Two 1 = 2 children, 0 = otherwise .278 .448 0-1 Three or more 1 = 3 or more, 0 = otherwise .210 .408 0-1 Age of youngest child (ref. = 0 – 2 months): 3 months – 2 years 1 = 3 months – 2 years, 0 = otherwise .356 .479 0-1 3 – 4 years 1 = 3 – 4 years, 0 = otherwise .125 .331 0-1 5 – 12 years 1 = 5 – 12 years, 0 = otherwise .310 .463 0-1 More than 12 years 1 = more than 12 years, 0 = otherwise .110 .312 0-1 Wage income Wage income, from previous quarter, in 1,000s .530 1.489 0-200 Education (ref. = more than 12 years):
Less than H.S. 1= less than 12 years, 0 = otherwise .472 .499 0-1 H.S. 1= 12 years, 0 = otherwise .346 .476 0-1 Race or ethnicity (ref. = white, non-Latino):
Black 1 = black, 0 = otherwise .358 .480 0-1 Latino
1 = Latino, 0 = otherwise .304 .460 0-1
Political environment:
County conservatism index See Appendix B .465 .220 0-1 County black population (%)
Percentage of blacks in county of client in 2000 (County and City Data Books 2003) 16.2 6.9 2.1 – 57.1
County Latino population (%) Percentage of Latinos in county of client in 2000 (County and City Data Books 2003) 22.9 21.7 1.5 – 57.3
Socioeconomic environment: Annual Wage in food service and drinking places
Average annual income in 1997 for employees in NAICS subsector 722, in 1,000s (County and City Data Books 2003)
12.9
1.9
7.8 – 16.7 County unemployment rate (t-1) Unemployment rate in county of client, measured
each month (Florida Research and Economic Database)
5.6
1.7
1.7 – 19.7 County poverty rate County poverty rate for all persons in 2000 (U.S.
Census Bureau Small Area Income and Poverty Estimates)
13.1
3.5
6.9 – 24.2 County TANF caseload (t-1) Number of TANF recipients per 100,000 county
residents (calculated by authors)
2.28
1.17 .142 - 6.907
County population (in millions) Total county population in 2000, in 1000’s (County and City Data Books 2003)
1072
825
7.02 - 2253
Source: Data on client characteristics were provided by the Florida Department of Children and Families.

Table A2. Variable Definitions, Sources, and Descriptive Statistics for Analyses Presented in Table 2 Independent Variables
Definition
Centralized States Mean S.D.
SOD States Mean S.D.
Individual Level Variables Race/Ethnicity (reference=white)
Black 1 = black, 0 = otherwise 0.283 0.450 0.405 0.491 Latino 1 = Latino, 0 = otherwise 0.109 0.312 0.158 0.365 Number of children (reference = 0 - one):
Two 1 = 2 children, 0 = otherwise 0.280 0.449 0.278 0.448 Three or more 1 = 3 or more, 0 = otherwise 0.193 0.395 0.197 0.397 Age of youngest child (reference = 0 – 2 months):
3 months – 2 years 1 = 3 months – 2 years, 0 = otherwise 0.371 0.483 0.377 0.485
3 – 4 years 1 = 3 – 4 years, 0 = otherwise 0.140 0.347 0.144 0.351 5 – 12 years 1 = 5 – 12 years, 0 = otherwise 0.285 0.452 0.281 0.450 More than 12 years 1 = more than 12 years, 0 =
otherwise 0.101 0.302 0.094 0.292 Education (reference = <H.S.)
H.S. Education 1= less than 12 years, 0 = otherwise 0.463 0.499 0.319 0.466 More than H.S. Education 1= 12 years, 0 = otherwise 0.050 0.219 0.041 0.198 Male 0 = female, 1 = male
0.160
0.367
0.234
0.423
Citizen 1 = Citizen, 0 = otherwise 0.956 0.206 0.943 0.232 Age Client age (in years) 31.144 10.223 30.670 8.948 Single-Parent 1 = single parent, 0=otherwise 0.763 0.425 0.755 0.430 Earned Income Amount of earned income in
previous month 278.462 522.513 211.486 447.322 Public Housing 1 = Public housing recipient, 0 =
otherwise 0.077 0.266 0.061 0.239 OASDI 1= Social Security recipient, 0 =
otherwise 0.022 0.145 0.033 0.178 SSI 1 = SSI recipient, 0 = otherwise 0.010 0.100 0.036 0.188 County Level Variables Republican Vote% Percentage of vote for Republican
presidential candidate in general election, 1996 and 2000 44.372 11.765 43.955 13.224
Black% Percentage of blacks in county of client in 2000 (County and City Data Books 2003) 11.658 16.000 16.349 17.606
Latino% Percentage of Latinos in county of client in 2000 (County and City Data Books 2003) 7.174 9.257 11.895 15.738
Per Capita Income County per capita income in 2000 (County and City Data Books 2003) 49.975 18.990 53.966 21.652
Unemployment Rate County unemployment rate in 2000 (County and City Data Books 2003) 4.429 2.413 4.507 2.234
Source: Data on client characteristics are from TANF Administrative Dataset, available from ASPE.
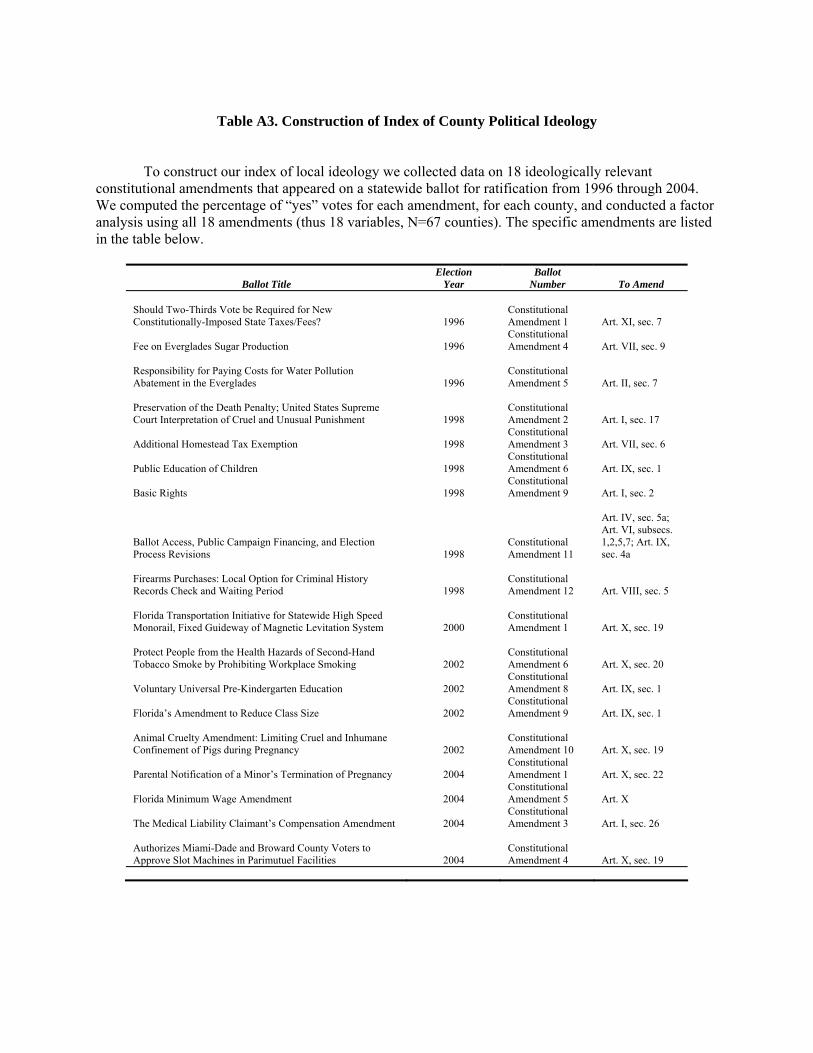
Table A3. Construction of Index of County Political Ideology
To construct our index of local ideology we collected data on 18 ideologically relevant constitutional amendments that appeared on a statewide ballot for ratification from 1996 through 2004. We computed the percentage of “yes” votes for each amendment, for each county, and conducted a factor analysis using all 18 amendments (thus 18 variables, N=67 counties). The specific amendments are listed in the table below.
Ballot Title
Election Year
Ballot Number
To Amend
Should Two-Thirds Vote be Required for New Constitutionally-Imposed State Taxes/Fees?
1996
Constitutional Amendment 1
Art. XI, sec. 7
Fee on Everglades Sugar Production
1996
Constitutional Amendment 4
Art. VII, sec. 9
Responsibility for Paying Costs for Water Pollution Abatement in the Everglades
1996
Constitutional Amendment 5
Art. II, sec. 7
Preservation of the Death Penalty; United States Supreme Court Interpretation of Cruel and Unusual Punishment
1998
Constitutional Amendment 2
Art. I, sec. 17
Additional Homestead Tax Exemption
1998
Constitutional Amendment 3
Art. VII, sec. 6
Public Education of Children
1998
Constitutional Amendment 6
Art. IX, sec. 1
Basic Rights
1998
Constitutional Amendment 9
Art. I, sec. 2
Ballot Access, Public Campaign Financing, and Election Process Revisions
1998
Constitutional Amendment 11
Art. IV, sec. 5a; Art. VI, subsecs. 1,2,5,7; Art. IX, sec. 4a
Firearms Purchases: Local Option for Criminal History Records Check and Waiting Period
1998
Constitutional Amendment 12
Art. VIII, sec. 5
Florida Transportation Initiative for Statewide High Speed Monorail, Fixed Guideway of Magnetic Levitation System
2000
Constitutional Amendment 1
Art. X, sec. 19
Protect People from the Health Hazards of Second-Hand Tobacco Smoke by Prohibiting Workplace Smoking
2002
Constitutional Amendment 6
Art. X, sec. 20
Voluntary Universal Pre-Kindergarten Education
2002
Constitutional Amendment 8
Art. IX, sec. 1
Florida’s Amendment to Reduce Class Size
2002
Constitutional Amendment 9
Art. IX, sec. 1
Animal Cruelty Amendment: Limiting Cruel and Inhumane Confinement of Pigs during Pregnancy
2002
Constitutional Amendment 10
Art. X, sec. 19
Parental Notification of a Minor’s Termination of Pregnancy
2004
Constitutional Amendment 1
Art. X, sec. 22
Florida Minimum Wage Amendment
2004
Constitutional Amendment 5
Art. X
The Medical Liability Claimant’s Compensation Amendment
2004
Constitutional Amendment 3
Art. I, sec. 26
Authorizes Miami-Dade and Broward County Voters to Approve Slot Machines in Parimutuel Facilities
2004
Constitutional Amendment 4
Art. X, sec. 19

Table A4. Discrete-Time Event History Models of Sanction Initiation [Replication of Table 1 Using Logistic Regression with Clustered Standard Errors]
Independent Variables
Model I
Odds Coeff. Ratio
Model II
Odds Coeff. Ratio
Individual Characteristics Male .1898** 1.2090 .1906** 1.2100 Citizen .1535 1.1659 .1535 1.1600 Age -.0129** .9783 -.0219** .9783 Single-Parent -.1965** .8216 -.1946** .8231 Number of children (reference = 0 - one): Two -.0191 .9810 -.0195 .9807 Three or more -.0207 .9795 -.0206 .9796 Age of youngest child (reference = 0 – 2 months): 3 months – 2 years .5679** 1.7646 .5672** 1.7634 3 – 4 years .6529** 1.9212 .6521** 1.9195 5 – 12 years .7379** 2.0914 .7373** 2.0881 More than 12 years .7596** 2.1373 .7586** 2.1353 Wage Income -.0102* .9898 -.0103* .9898 Education (reference = >H.S.) Less than H.S. Education .4764** 1.6103 .4784** 1.6135 H.S. Education .1515** 1.1635 .1526** 1.1649 Race/Ethnicity (reference=white) Black -.0470 .9541 -.0198 .9804 Black * Month of Spell .0663** 1.0685 .0656** 1.0678 Hispanic -.1486** .8618 -.0883 .9154 Hispanic * Month of Spell .0374** 1.0381 .0371** 1.0378 Political Environment
Local Conservatism .2000 1.2214 --- --- Local Conservatism*Black .4761** 1.6098 --- --- Local Conservatism*Hispanic .3716 1.4500 --- --- Republican Vote Share --- --- .0003 1.0003 Republican Vote Share*Black --- --- .0092** 1.0092 Republican Vote Share*Hispanic --- --- .0112** 1.0113 Black% -.0051 .9949 -.0060 .9940 Hispanic% -.0081* .9920 -.0096** .9905 Socio-Economic Environment
Annual Wage - Food Service/Drinking Places -.0402 .9606 -.0451* .9559 Unemployment Rate .0032 1.0032 .0065 1.0066 ∆Unemployment Rate -.0067 .9934 -.0038 .9962 Poverty Rate .0395** 1.0403 .0347* 1.0353 Population .0003** 1.0003 .0003** 1.0003 TANF Caseload -.1785** .8365 -191.0** .8261 Number of Subjects Number of Failures Time at Risk (Person-Months)
74,517 28,307 198,147
74,517 28,307 198,147
*p<.05, **p<.01 Note: Coefficient values are estimated using binary logit, with standard errors adjusted for clustering at the county level. The sample consists of all new adult TANF recipients in Florida who entered TANF from January 2001 through December 2002. Each model includes dummy variables for the duration of spell (months 1-12) and for calendar month (January-December) to capture potential seasonal effects. These results are not shown, but are available from the authors upon request.

FIGURE A1. The Effect of Race on TANF Sanctioning by Local Conservatism (Second-Stage Results from Two-Stage Multilevel Model)
1.5
1
Pro
bit c
oeffi
cien
t val
ues
(from
1st s
tage
regr
essi
ons)
.5
0
-.5
-1
0 . .8 .4 .6 12 County Conservatism (0 = most liberal, 1 = most conservative)
Est'd Probit Coefficient Fitted values
Note: The vertical axis reflects probit coefficient values for the effect of race of client on TANF sanctioning (equivalent to the effect of Black from Table 1), obtained from individual-level (first-stage) probit regressions estimated for 66 Florida counties. The horizontal axis is the county conservatism index. The symbols in the scatterplot are weighted based on the sample sizes from the first-stage probit regressions. The slope of the regression line (b = .38, t = 2.88) was estimated using the weights proposed by Borjas and Sueyoshi (1994).

FIGURE A2. The Effect of Ethnicity (Hispanic) on TANF Sanctioning by District Conservatism (Second-Stage Results from Two-Stage Multilevel Model)
Note: The vertical axis reflects probit coefficient values for the effect of ethnicity of client on TANF sanctioning (equivalent to the effect of Hispanic from Table 1), obtained from individual-level (first-stage) probit regressions estimated for 24 workforce districts. The horizontal axis is the district conservatism index, calculated by averaging county conservatism scores within each district (weighting by county population). The symbols in the scatterplot are weighted based on the sample sizes from the first-stage probit regressions. The slope of the regression line (b = .29, t = 2.08) was estimated using the weights proposed by Borjas and Sueyoshi (1994).
.2
0
Pro
bit c
oeffi
cien
t val
ues
-.8
-.6
-.4
-
(from
1st s
tage
regr
essi
ons)
.2
0 .2 1 .4 .6 .8District Conservatism (0 = most liberal, 1 = most conservative)
Est'd Probit Coefficient Fitted values