uk retail investor roundtable - investors.rbs.com/media/files/r/rbs-ir/archived... · in the uk and...
TRANSCRIPT

UK Retail Investor RoundtableBrian Hartzer, CEO UK Retail & 12 November 2010 UK Retail Executive Committee

2
Important Information
Certain sections in this presentation contain ‘forward-looking statements’ as that term is defined in the United States Private Securities Litigation Reform Act of 1995, such as statements that include the
words ‘expect’, ‘estimate’, ‘project’, ‘anticipate’, ‘believes’, ‘should’, ‘intend’, ‘plan’, ‘probability’, ‘risk’, ‘Value-at-Risk (VaR)’, ‘target’, ‘goal’, ‘objective’, ‘will’, ‘endeavour’, ‘outlook’, ‘optimistic’, ‘prospects’ and
similar expressions or variations on such expressions.
In particular, this document includes forward-looking statements relating, but not limited, to: the Group’s restructuring plans, capitalisation, portfolios, capital ratios, liquidity, risk weighted assets, return on
equity, cost-to-income ratios, leverage and loan-to-deposit ratios, funding and risk profile; the Group’s future financial performance; the level and extent of future impairments and write-downs; the protection
provided by the APS; and the Group’s potential exposures to various types of market risks, such as interest rate risk, foreign exchange rate risk and commodity and equity price risk. Such statements are
subject to risks and uncertainties. For example, certain of the market risk disclosures are dependent on choices about key model characteristics and assumptions and are subject to various limitations. By
their nature, certain of the market risk disclosures are only estimates and, as a result, actual future gains and losses could differ materially from those that have been estimated.
Other factors that could cause actual results to differ materially from those estimated by the forward-looking statements contained in this document include, but are not limited to: general economic conditions
in the UK and in other countries in which the Group has significant business activities or investments, including the United States; developments in the global financial markets, and their impact on the
financial industry in general and on the Group in particular; the full nationalisation of the Group or other resolution procedures under the Banking Act 2009; the monetary and interest rate policies of the Bank
of England, the Board of Governors of the Federal Reserve System and other G7 central banks; inflation; deflation; unanticipated turbulence in interest rates, foreign currency exchange rates, commodity
prices and equity prices; changes in UK and foreign laws, regulations and taxes, including changes in regulatory capital regulations; a change of UK Government or changes to UK Government policy;
changes in the Group’s credit ratings; the Group’s participation in the APS and the effect of such scheme on the Group’s financial and capital position; the conversion of the B Shares in accordance with their
terms; the ability to access the contingent capital arrangements with Her Majesty’s Treasury (“HM Treasury”); limitations on, or additional requirements imposed on, the Group’s activities as a result of HM
Treasury’s investment in the Group; changes in competition and pricing environments; the financial stability of other financial institutions, and the Group’s counterparties and borrowers; the value and
effectiveness of any credit protection purchased by the Group; costs or exposures borne by the Group arising out of the origination or sale of mortgages and mortgages backed securities in the United States;
the extent of future write-downs and impairment charges caused by depressed asset valuations; the ability to achieve revenue benefits and cost savings from the integration of certain of the businesses and
assets of RBS Holdings, N.V. (formerly ABN AMRO); natural and other disasters; the inability to hedge certain risks economically; the ability to access sufficient funding to meet liquidity needs; the ability to
complete restructurings on a timely basis, or at all, including the disposal of certain non-core assets and assets and businesses required as part of the EC State aid approval; the adequacy of loss reserves;
acquisitions or restructurings; technological changes; changes in consumer spending and saving habits; and the success of the Group in managing the risks involved in the foregoing.
The forward-looking statements contained in this presentation speak only as of the date of this presentation, and the Group does not undertake to update any forward-looking statement to reflect events or
circumstances after the date hereof or to reflect the occurrence of unanticipated events.
The information, statements and opinions contained in this presentation do not constitute a public offer under any applicable legislation or an offer to sell or solicitation of an offer to buy any securities or
financial instruments or any advice or recommendation with respect to such securities or other financial instruments.

3
Agenda
UK Retail background & situation assessment
Strategy & Key Initiatives:
- Strategy
- Products
Financial Performance & Outlook
Summary
- Channels

4
Core RBS
Future Group profile; a strong and balanced business
Targeting 2/3 Retail & Commercial, 1/3 GBM1
Geographic split: UK c55%, US c25%, EU 10-15% & RoW 5-10%Leadership positions balancing business cycle, capital and funding intensity
Future business mix
Core RBS Q310 Core revenues by Division
1 Excluding Insurance business
A universal bank anchored in the UK and in Retail & Commercial, diversified by
geography, business mix and risk profile
Global Banking
& Markets
GTS
Retail & Commercial
UK Retail
UK Corporate
Wealth
Ulster Bank
US R&C
Global Corporate
Clients
Financial Institutions
Retail Customers
Deposits
SMEs
Governments
Domestic Corporate
Market Funding
R&C 78%
GBM 22%
Insurance 16%
US R&C 11% Ulster
3%
GTS 10%
Wealth 4%
UK Corporate
14%
UK Retail 20%
5
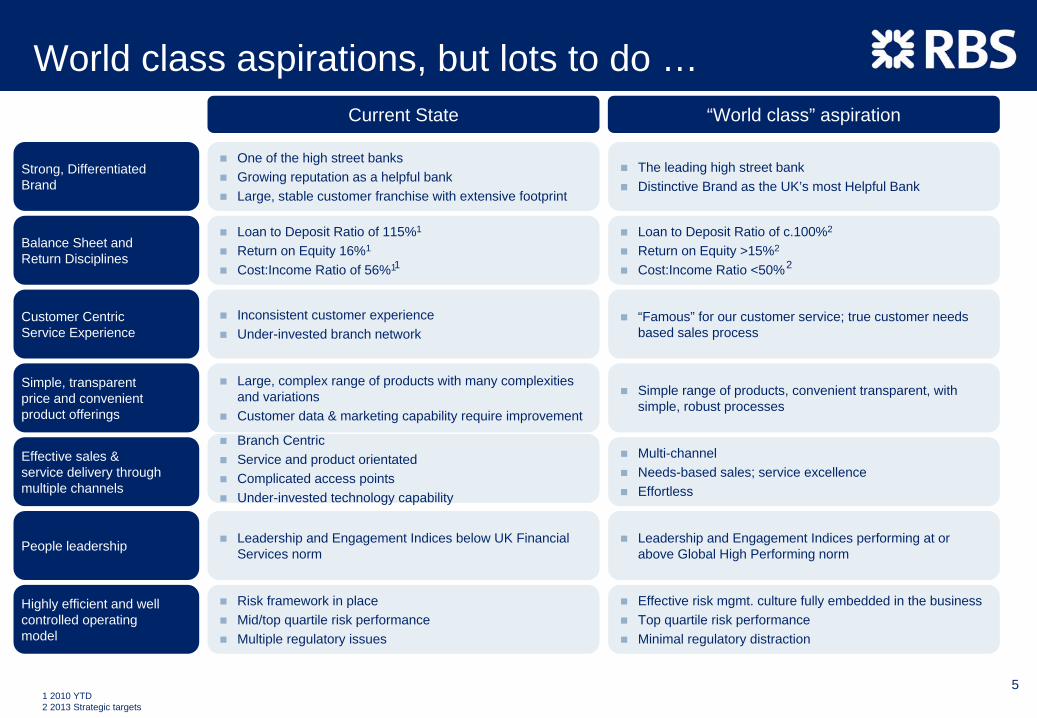
World class aspirations, but lots to do …
Strong, Differentiated Brand
Balance Sheet and Return Disciplines
Customer CentricService Experience
Simple, transparentprice and convenient product offerings
Effective sales &service delivery throughmultiple channels
People leadership
Highly efficient and wellcontrolled operatingmodel
Current State
One of the high street banksGrowing reputation as a helpful bankLarge, stable customer franchise with extensive footprint
Loan to Deposit Ratio of 115%1
Return on Equity 16%1
Cost:Income Ratio of 56%1
Inconsistent customer experienceUnder-invested branch network
Large, complex range of products with many complexities and variationsCustomer data & marketing capability require improvement
Leadership and Engagement Indices below UK Financial Services norm
Risk framework in placeMid/top quartile risk performanceMultiple regulatory issues
Branch CentricService and product orientatedComplicated access pointsUnder-invested technology capability
“World class” aspiration
The leading high street bankDistinctive Brand as the UK’s most Helpful Bank
Loan to Deposit Ratio of c.100%2
Return on Equity >15%2
Cost:Income Ratio <50%
“Famous” for our customer service; true customer needs based sales process
Simple range of products, convenient transparent, with simple, robust processes
Multi-channelNeeds-based sales; service excellenceEffortless
Leadership and Engagement Indices performing at or above Global High Performing norm
Effective risk mgmt. culture fully embedded in the businessTop quartile risk performanceMinimal regulatory distraction
1
1 2010 YTD2 2013 Strategic targets
2
6
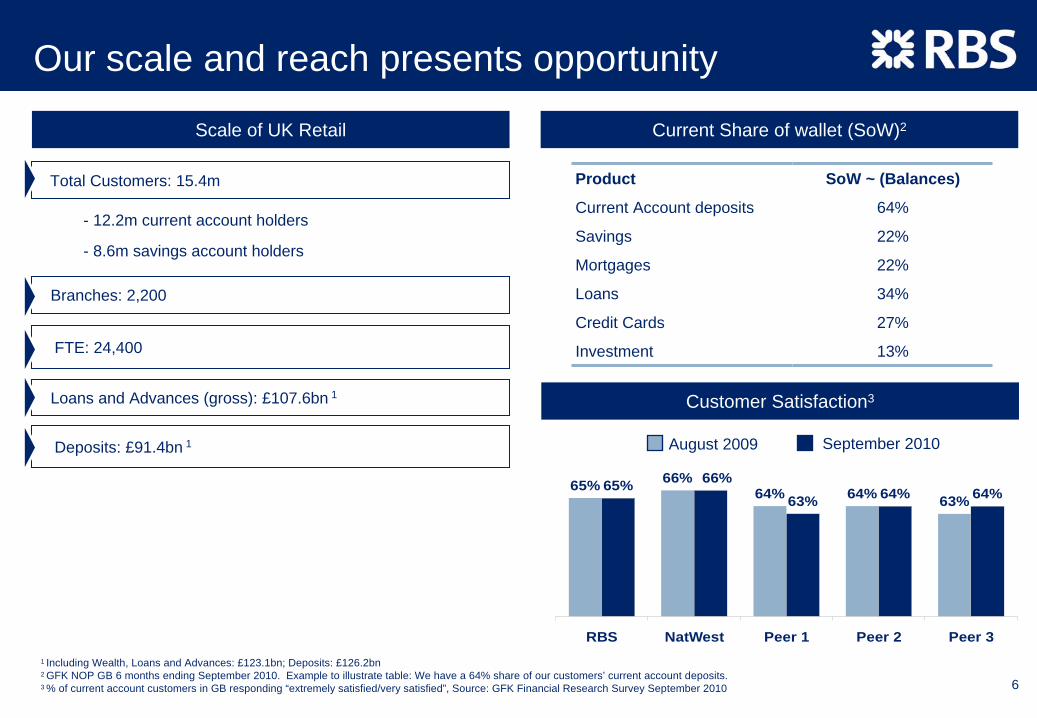
Our scale and reach presents opportunity
1 Including Wealth, Loans and Advances: £123.1bn; Deposits: £126.2bn2 GFK NOP GB 6 months ending September 2010. Example to illustrate table: We have a 64% share of our customers’ current account deposits.3 % of current account customers in GB responding “extremely satisfied/very satisfied”, Source: GFK Financial Research Survey September 2010
Scale of UK Retail
Branches: 2,200
FTE: 24,400
Loans and Advances (gross): £107.6bn 1
Deposits: £91.4bn 1
Current Share of wallet (SoW)2
Product SoW ~ (Balances)
Current Account deposits 64%
Savings 22%
Mortgages 22%
Loans 34%
Credit Cards 27%
Investment 13%
- 12.2m current account holders
Total Customers: 15.4m
- 8.6m savings account holders
65% 66%64% 64% 63%
65%63% 64% 64%
66%
RBS NatWest Peer 1 Peer 2 Peer 3
September 2010August 2009
Customer Satisfaction3
7
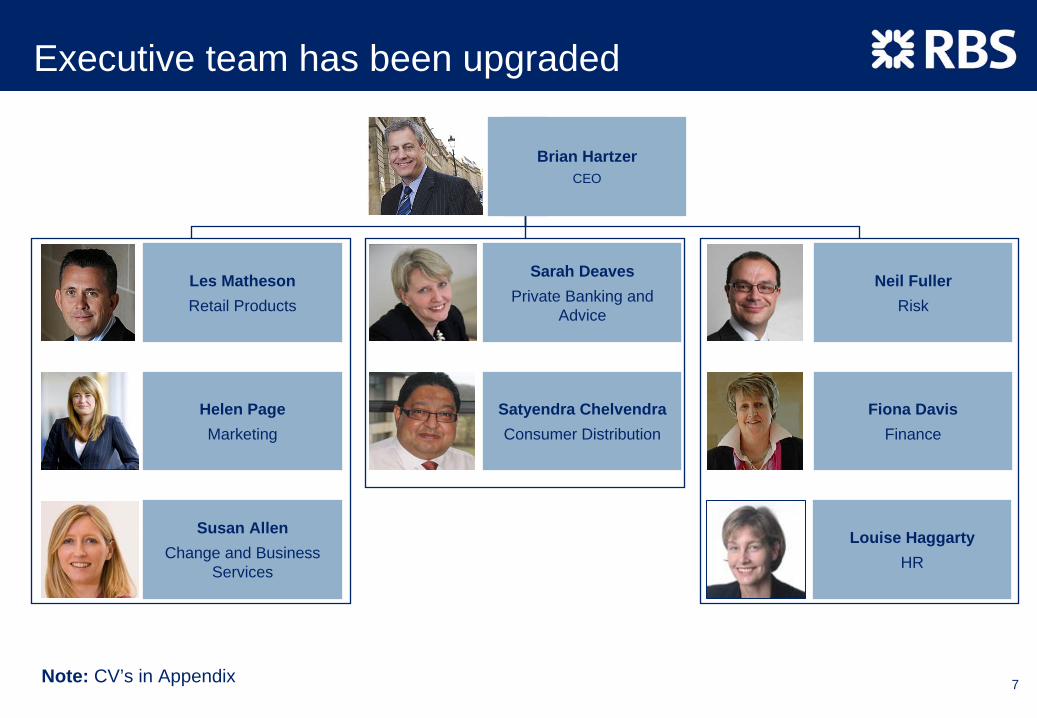
Executive team has been upgraded
Note: CV’s in Appendix
Les MathesonRetail Products
Helen PageMarketing
Susan AllenChange and Business
Services
Sarah DeavesPrivate Banking and
Advice
Satyendra ChelvendraConsumer Distribution
Neil FullerRisk
Fiona DavisFinance
Louise HaggartyHR
Brian HartzerCEO

8
Agenda
UK Retail background & situation assessment
Strategy & Key Initiatives:
- Strategy
- Products
Financial Performance & Outlook
Summary
- Channels
9
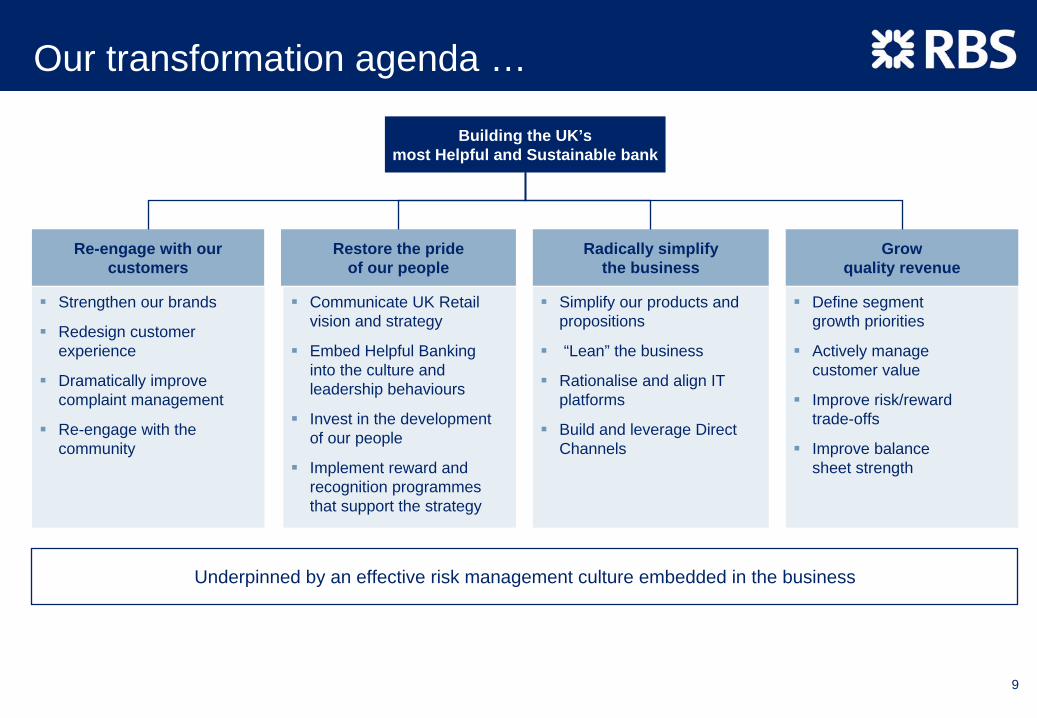
Our transformation agenda …
Building the UK’s most Helpful and Sustainable bank
Underpinned by an effective risk management culture embedded in the business
Re-engage with our customers
Radically simplify the business
Restore the pride of our people
Grow quality revenue
Strengthen our brands
Redesign customer experience
Dramatically improve complaint management
Re-engage with the community
Communicate UK Retail vision and strategy
Embed Helpful Bankinginto the culture and leadership behaviours
Invest in the development of our people
Implement reward and recognition programmesthat support the strategy
Simplify our products and propositions
“Lean” the business
Rationalise and align IT platforms
Build and leverage Direct Channels
Define segmentgrowth priorities
Actively managecustomer value
Improve risk/rewardtrade-offs
Improve balancesheet strength

10
… underpinned by deep customer insight
What Annoys our Customers
Time Money Personal Touch
Queuing
Opening hours
Decision times ‘One rule for them, one rule for us’
Expensive customer service calls
‘Kicking you with fees and charges
when you’re down’
Policies over personal discretion
IVR*/incomprehensible call centre representative
Customers = sets of figures
* IVR: Interactive Voice Response
11
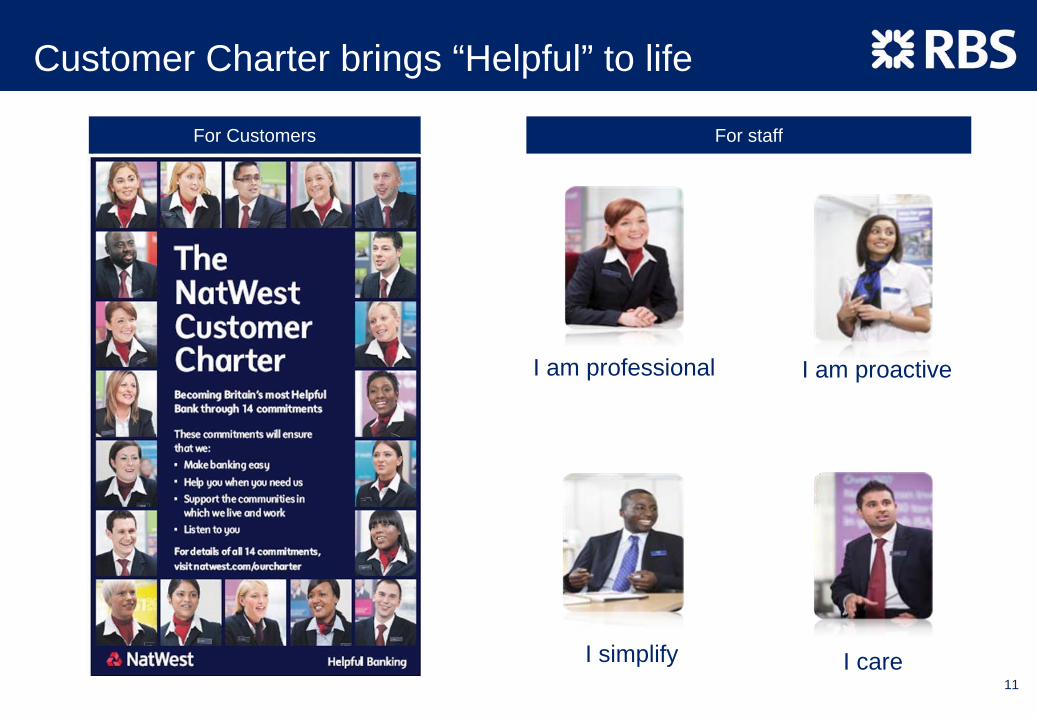
Customer Charter brings “Helpful” to life
I am proactive
I simplify
I am professional
I care
For Customers For staff
12
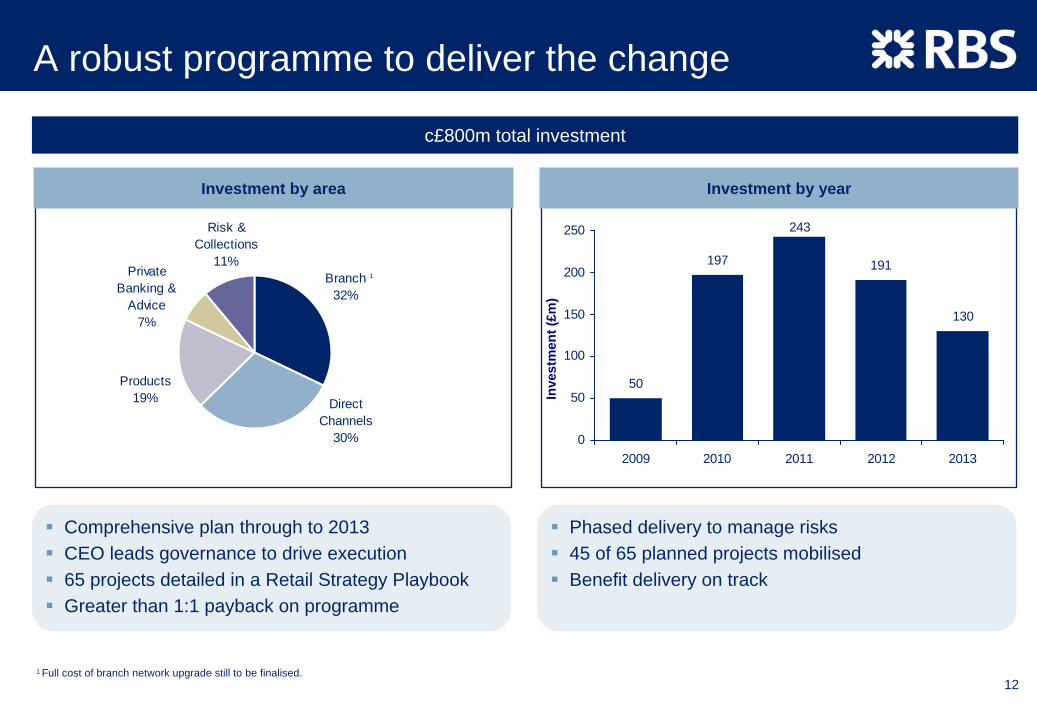
A robust programme to deliver the change
c£800m total investment
Investment by area Investment by year
Comprehensive plan through to 2013CEO leads governance to drive execution 65 projects detailed in a Retail Strategy PlaybookGreater than 1:1 payback on programme
Private Banking &
Advice7%
Risk & Collections
11%
Direct Channels
30%
Branch32%
Products19%
50
197
243
130
191
0
50
100
150
200
250
2009 2010 2011 2012 2013
Inve
stm
ent (
£m)
Phased delivery to manage risks45 of 65 planned projects mobilisedBenefit delivery on track
1
1 Full cost of branch network upgrade still to be finalised.

13
Agenda
UK Retail background & situation assessment
Strategy & Key Initiatives:
- Strategy
- Products
Financial Performance & Outlook
Summary
- Channels
14
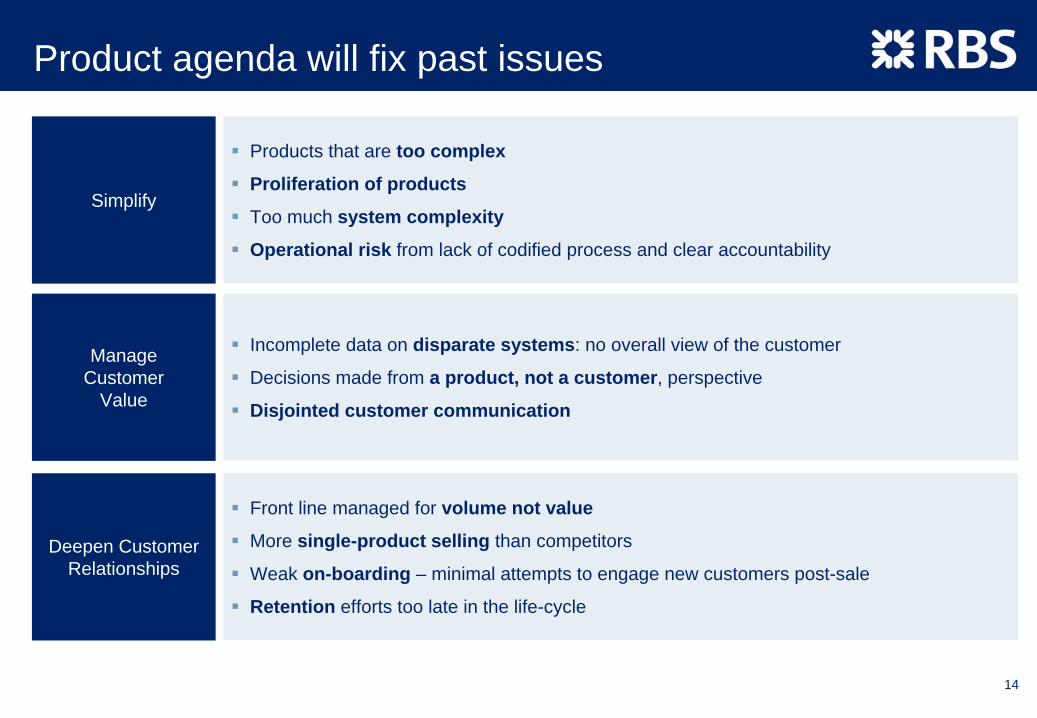
Product agenda will fix past issues
Products that are too complex
Proliferation of products
Too much system complexity
Operational risk from lack of codified process and clear accountability
Simplify
Incomplete data on disparate systems: no overall view of the customer
Decisions made from a product, not a customer, perspective
Disjointed customer communication
Manage Customer
Value
Front line managed for volume not value
More single-product selling than competitors
Weak on-boarding – minimal attempts to engage new customers post-sale
Retention efforts too late in the life-cycle
Deepen Customer Relationships

15
Radically simplifying our business …
Example: Mortgage Transformation Programme But complexity is more than just number of products …
Product Variants
Platforms
Brands 5 3 3
Product Types
12 12
2
5 5 5
608
54109
Past Present Future Efficient, accurate and compliant processes
Investment in System Architecture
Simplicity, transparency and efficiency‘Easy to buy, easy to sell’
Best in Class Transparency

16
Managing Customer Value …
Improving our understanding of customer value …
-60%
-40%
-20%
0%
20%
40%
60%
80%
100%
1 2 3 4 5 6 7 8 9 10
World class data platform
Leading edge decisioning technology
Integrated, multi-channel contact strategy
Value Decile
High Breakeven Loss
Con
trib
utio
n to
val
ue
Enablers

17
Deepening customer relationships
Effective cross-sale creates >10x income differential …
1 2
5
11
3
0
2
4
6
8
10
12
1 2 3 4 5+
Number of products with RBSG
Inco
me
Mul
tiple
1 From all products held 2009 data
... and a 70% reduction in customer attrition 1
-15%
-50%-60%
-70%-80%-70%-60%-50%-40%-30%-20%-10%
0%
1 2 3 4 5+
Number of products with RBSG
Attr
ition
Red
uctio
n

18
Customer Insight in action …
1m Personal Annual Statements already underway … … personalised Internet Prompts already online
Examples of success…
Customer Response:
95% of customers liked the Personal Annual Statement (PAS)
Over 10,000 follow-up conversations held, per month, and growing
Over 2,000 customers booked in for a full Customer Review, per month
First stage internet prompts live (July 2010), 14,000 incremental sales achieved to date

19
Opportunity to grow Savings and MortgagesTotal Deposits Mortgages
Slow market growth forecast … Outperformed a flat market with balance growth of 11% ...
Q3 2010 Y-o-Y Q3 2010 Y-o-Y
RBS £91bn (£60bn savings) +7% RBS £89bn + 11%
Market Total £985bn +2% Market Total £1,241bn +1%
… but we have £160bn opportunity among existing customers … significant opportunity within our existing base
Savings held with others
£20bn £40bn RBS£60bn Other
£100bn
Split Savings
0.9m 1.7m
Mortgage accounts with RBS
Mortgage accounts with others
Mortgage holdings of RBS customersDeposit holdings of RBS customers
Savings with RBS
20
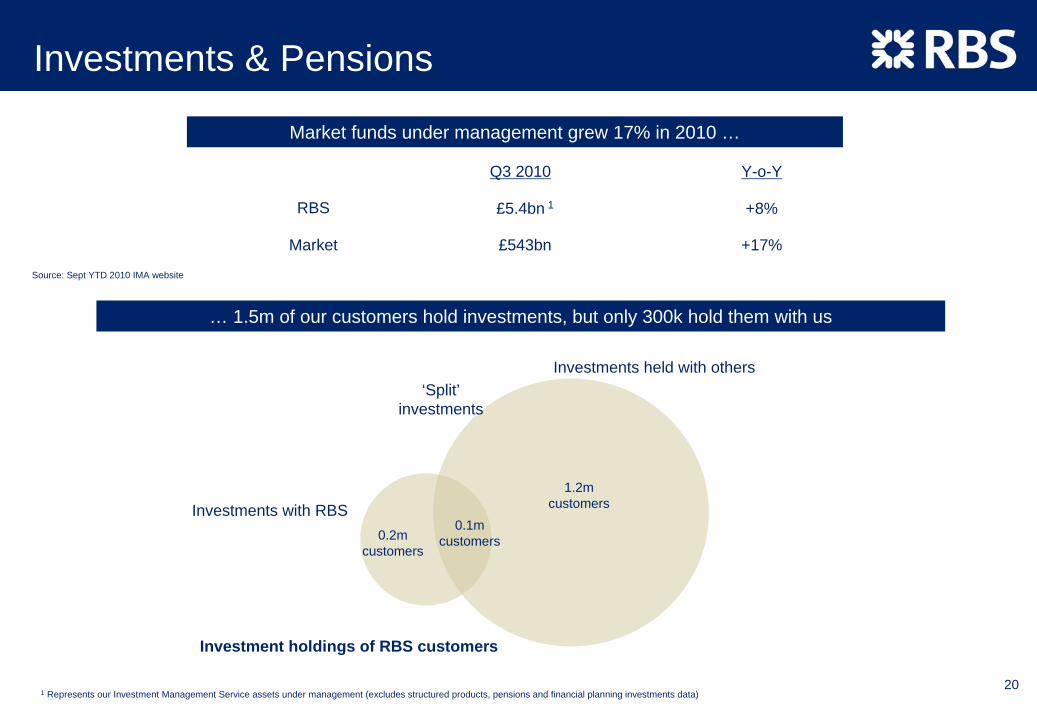
Investments & Pensions
Market funds under management grew 17% in 2010 …
Q3 2010 Y-o-Y
RBS £5.4bn 1 +8%
Market £543bn +17%
1 Represents our Investment Management Service assets under management (excludes structured products, pensions and financial planning investments data)
… 1.5m of our customers hold investments, but only 300k hold them with us
Source: Sept YTD 2010 IMA website
0.2mcustomers
1.2mcustomers
0.1mcustomers
Investments held with others‘Split’
investments
Investments with RBS
Investment holdings of RBS customers

21
Agenda
UK Retail background & situation assessment
Strategy & Key Initiatives:
- Strategy
- Products
Financial Performance & Outlook
Summary
- Channels

22
High
Service
LowLow HighSales
BranchBranch BranchBranch
BranchBranch
ATMATMATMATMATM
MailMail MobMobMailMail
PhonePhone
PhonePhone
InternetInternet
InternetInternet
MobileMobile
Web chatWeb chat
1980s Present 2013
Evolution over time
Relative importance to customer
Low High
PhonePhone
ATMATM
Channel usage mix continues to evolve
MailMail
46
23
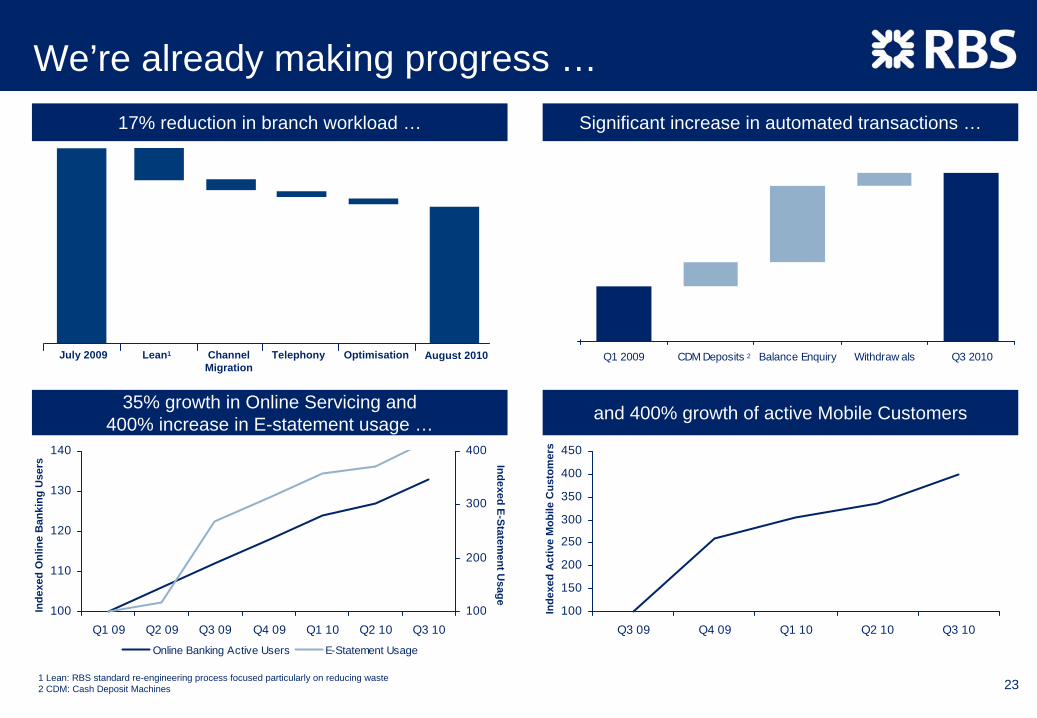
We’re already making progress …17% reduction in branch workload … Significant increase in automated transactions …
July 2009 Lean1 ChannelMigration
Telephony Optimisation
––
August 201097
99
101
103
105
107
Q1 2009 CDM Deposits Balance Enquiry Withdraw als Q3 2010
35% growth in Online Servicing and400% increase in E-statement usage … and 400% growth of active Mobile Customers
100
110
120
130
140
Q1 09 Q2 09 Q3 09 Q4 09 Q1 10 Q2 10 Q3 10100
200
300
400
Online Banking Active Users E-Statement Usage
Inde
xed
Onl
ine
Ban
king
Use
rs Indexed E-Statement U
sage
100
150
200
250
300
350
400
450
Q3 09 Q4 09 Q1 10 Q2 10 Q3 10
Inde
xed
Act
ive
Mob
ile C
usto
mer
s
1 Lean: RBS standard re-engineering process focused particularly on reducing waste2 CDM: Cash Deposit Machines
2

24
We are investing to reshape our Branch network
Format Definition
FlagshipBranches
Major(Full Service)
Branches
CoreBranches
High profile in major cities/locations
Full sales and service facilities for all segments
Ambassador for the brand
Centres of excellence for helpful banking
Large outlet in key towns/conurbations
Providing full service facilities to all segments and personal sales advice
Local and community branches providing a range of core services

25
Upgrading Telephony infrastructure to ...
An example of enhancement to customer experience …
Very Simple Call – Customer wishes to know available funds, pending entries on two accounts and then cancel a Direct Debit (DD).
Total 34+Screens
––
Customer Calls
Customer selects to speak to an
agent
Agent IDs&Vs customer(min 5 screens)
Check Available Funds (min 5 screens)
Agent Checks pending entries (min 10 screens)
Agent locates Direct Debit (min 4 screens)
Agent cancels Direct Debit (min 7 screens)
Agent completes call (3 screens)
TodayEarly,Cloud
Early,Cloud
BackOffice
BackOffice
Early,Cloud
Early,Cloud
Total 8Screens
Customer Calls
Agent IDs&Vs customer(3 screens)
Agent locates and cancels DD(2 screens)
Customer selects to speak to an
agent
Agent checks Balances, Available Funds and pending entries on both accounts
(1 screen)Agent completes call
(2 screens)Future
26
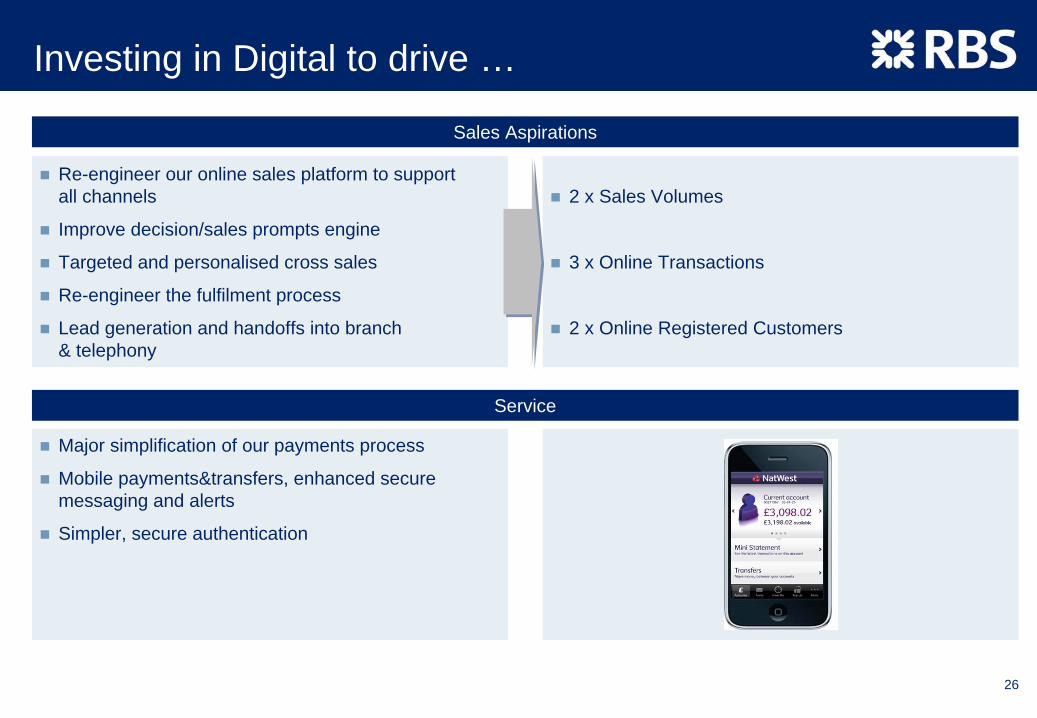
Investing in Digital to drive …
Sales Aspirations
Re-engineer our online sales platform to support all channels
Improve decision/sales prompts engine
Targeted and personalised cross sales
Re-engineer the fulfilment process
Lead generation and handoffs into branch & telephony
2 x Sales Volumes
3 x Online Transactions
2 x Online Registered Customers
Service
Major simplification of our payments process
Mobile payments&transfers, enhanced secure messaging and alerts
Simpler, secure authentication

27
Simplify our advice proposition
Face to Face
Product Focussed
Manual Process
Meets current regulation
Multi Channel
Needs and Goals based solutions
Simplified process using self service and data and decisioning
RDR-compliant segment propositions1
Process Time from 90 mins to 45 mins
40% increase in sales per FPM per week
From: To: Results:
1 Retail distribution review

28
Agenda
UK Retail background & situation assessment
Strategy & Key Initiatives:
- Strategy
- Products
Financial Performance & Outlook
Summary
- Channels

29
Re-balancing the economy remains a challenge
… but slow GDP recovery means ..
… which means the savings ratio is rising ...
Household Savings Ratio
Households are borrowing less ..
-12%
-6%
0%
6%
12%
18%
2004 2005 2006 2007 2008 2009 2010
Mortgages
Personal loans
Rolling annual growth
… that total deposit growth remains low
0%
2%
4%
6%
8%
10%
2008 2009 2010
Household Deposit Growth (y-o-y %)
90
95
100
105
110
2008 2009 2010 2011 2012 2013 2014
UK GDP forecast (2008=100)
3 years to make up lost ground
-6%-4%-2%0%2%4%6%
2005 2006 2007 2008 2009 2010
Rolling annual growth

30
Strong franchise remained profitable through the crisis
20041 20051 20061 20071 FY2008 FY2009 2010 YTD2
Net Interest Income (£m) 2,868 2,929 3,012 3,041 3,187 3,452 2,990 Fee Income (£m) 1,679 1,854 1,919 1,993 1,751 1,495 960 Total Income (£m) 4,547 4,783 4,931 5,034 4,938 4,947 3,950 Total Costs (£m) (2,972) (3,010) (3,026) (3,081) (3,196) (3,039) (2,198)Impairment (£m) (696) (945) (1,082) (1,007) (1,019) (1,679) (938)Operating Profit (£m) 879 828 823 946 723 229 814
Secured Balances (£bn) 51 59 63 65 72 83 89Unsecured Balances (£bn) 21 22 21 22 22 20 19Total assets (£bn) 73 81 85 87 94 103 108Total deposits (£bn) 60 64 69 76 79 87 91
L:D Ratio 118% 122% 119% 112% 116% 115% 115%NIM 4.2% 3.8% 3.7% 3.7% 3.6% 3.6% 3.9%C:I Ratio (adjusted) 65% 63% 61% 61% 65% 61% 56%RoE 18% 16% 16% 17% 11% 3% 16%
RBS Retail has:
Remained in profit throughout
Normalised RoE above 15% through the cycle
NIM operating in the 3.6%–4.2% range
Whilst:
Rebalancing unsecured mix
Growing market share of liabilities
Maintaining strong L:D ratio despite secured emphasis
In effect, moving from short term P&L to longer term focus
1 Historic information 2004 to 2007, RBS estimated based on current UK Retail structure, cost and equity allocations. Indicative only.2 Nine months to 30 September 2010

31
Strong momentum; all key metrics improving
Q1 2009 Q2 2009 Q3 2009 Q4 2009 Q1 2010 Q2 2010 Q3 2010
Cost Income ratio (adjusted) 69% 61% 62% 55% 58% 56% 53%
Published NIM 3.46% 3.69% 3.47% 3.74% 3.66% 3.88% 4.02%
Asset Margin 2.10% 2.55% 2.53% 2.96% 2.91% 3.16% 3.33%
Liability Margin1 1.68% 1.37% 1.15% 0.94% 0.91% 0.87% 0.85%
Mortgage Growth (£bn) 1.1 3.3 3.7 2.9 1.6 2.1 2.2
Savings Growth (£bn)2 0.5 2.7 1.4 1.2 1.4 1.2 1.5
Impairment Charge as % of loans 1.5% 1.9% 1.6% 1.8% 1.5% 1.1% 0.9%
RWA as % of assets 52.6% 55.6% 51.1% 49.8% 47.9% 46.5% 45.8%
RoE 1.0% 1.2% 3.8% 7.1% 8.0% 16.1% 23.2%
Headcount 27,892 26,881 26,074 25,452 2 4,837 23,983 24,361
Source: BOE data Source: GFK data
Market Share Stock
2008 2009 2010 YTD
Deposits 8% 9% 9%
Mortgages 5% 5% 6%
Unsecured 15% 15% 16%
Market Share New Business
2008 2009 2010 YTDCurrent Accounts 17% 20% 19%
Savings 10% 11% 11%
Mortgages 7% 9% 12%
Loans 15% 12% 10%
Cards 10% 10% 9%
1 Margin on retail deposits only2 On £60bn of savings balances, not total deposits
32
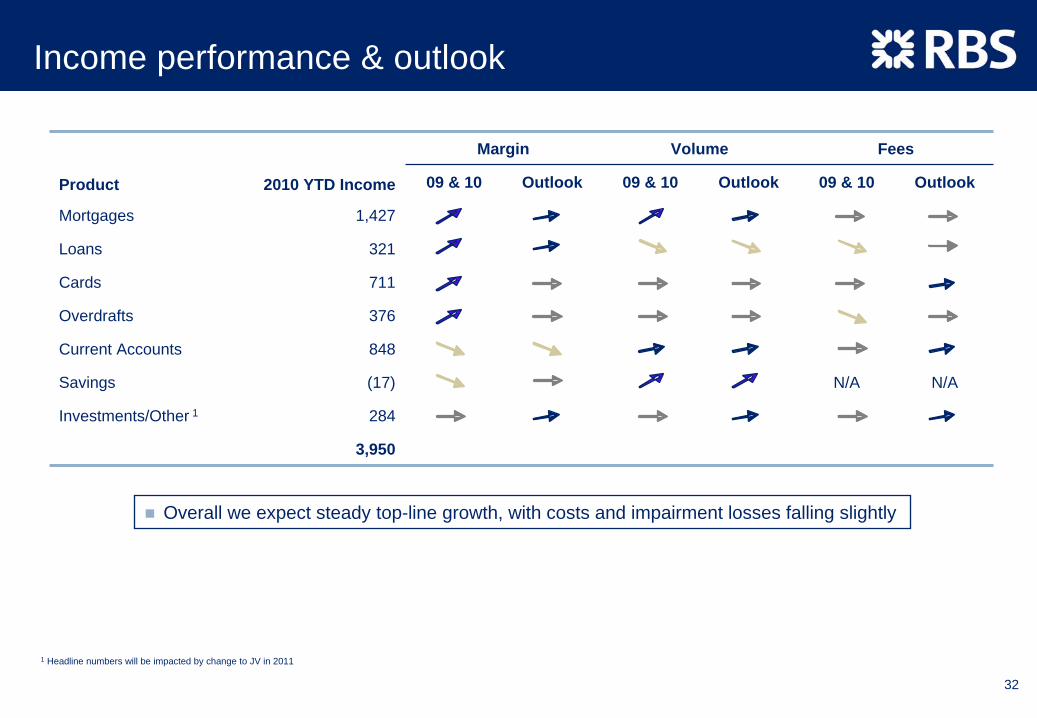
Income performance & outlook
Product 2010 YTD Income
Margin Volume Fees
09 & 10 Outlook 09 & 10 Outlook 09 & 10 Outlook
Mortgages 1,427
Loans 321
Cards 711
Overdrafts 376
Current Accounts 848
Savings (17) N/A N/A
Investments/Other 1 284
3,950
1 Headline numbers will be impacted by change to JV in 2011
Overall we expect steady top-line growth, with costs and impairment losses falling slightly

33
0
20
40
60
80
100
“Engine” Performing Strongly …
Sustained growth in Mortgage Stock Growing Market share in deposits, ahead of competition
£0.0bn
£1.0bn
£2.0bn
£3.0bn
£4.0bn
£5.0bn
£6.0bn
Q1 08 Q2 08 Q3 08 Q4 08 Q1 09 Q2 09 Q3 09 Q4 09 Q1 10 Q2 10 Q3 1060.0bn
65.0bn
70.0bn
75.0bn
80.0bn
85.0bn
90.0bn
Gross Redemptions Stock
DepositsSpot HY Balance
£BnYoY Movement
£BnYoY %
RBS 90 7 8Santander 128 9 8Lloyds 231 12 6Barclays 106 4 4HSBC 108 4 4Nationwide 121 (7) (6)Northern Rock 18 (2) (10)Total 801 27 4Market Total 995 32 3Other Players 194 5 3
… whilst making inroads into efficiencyHeadline Cost-to-Income ratio Headcount, FTEs Costs Trends, £m1
Transformation programme reinforces existing strengths
RBS 2013 target < 50%1 2010 YTD annualised
Nationwide (Retail)
HSBC(PFS
Europe)
Barclays(UK retail ex. Barclaycard)
RBS(UK
Retail)
Lloyds(UK
Retail)
Santander (UK Retail Banking)
%
H1 2010
FY 2009
FY 2008
500
1,000
1,500
2,000
2008 2009 YTD102,600
2,800
3,000
3,200
3,400
Direct costs - staff LHS)
Indirect costs (LHS)
Total costs (RHS)
20,000
30,000
40,000
50,000
2008 2009 20101,500
1,700
1,900
2,100
2,300
2,500
2,700
Retail - Customer facing (LHS)
Retail - Head office (RHS)

34
Impairments are improving
2010 impairments significantly lower than 2009
Unsecured portfolios are 84% of charge, customer defaults are falling and recoveries have stabilised
Outlook: impairments remain sensitive to changes in the broader external environment
Improving trends in customer default levels especially on unsecuredMortgage arrears are likely to lag experience on the unsecured bookRemains sensitive to the broader economic environment, particularly interest rates and unemployment
Impairment charge – driven by unsecured Customer default %
0.0
0.5
1.0
1.5
2.0
2007 2008 2009 2010 (Q3)
Secured Unsecured£bn
22bps
570bps
0.0%
0.2%
0.4%
0.6%
0.8%
1.0%
1.2%
Dec
-08
Mar
-09
Jun-
09
Sep-
09
Dec
-09
Mar
-10
Jun-
10
Sep-
10
Uns
ecur
ed
0.00%
0.02%
0.04%
0.06%
0.08%
0.10%
0.12%
0.14%
Secu
red
RBS Cards Bad Debtf low %
Personal Unsecured Loans Bad Debtf low %
Mortgage Bad Debtf low % (RHS)

35
Clearer risk appetite and strong controls
Ensuring strategic decision making is taken with full understanding of risk appetite
Risk appetite aligned to Group wide appetite
Appetite validated through stress testing and assurance
Business KPI monitored, reported and actioned to support risk appetite through relevant risk management governance
Risk Appetite
Programme of enhancement of the Operational Risk framework to strengthen risk culture and more effectively manage and mitigate our Operational Risks
Ensuring optimal three lines of defence model with clear roles and responsibilities
Significant investment in strategic fraud prevention programme which will protect customer experience and minimise losses
Investing in controls and fraud prevention
Proactive engagement of regulators to inform regulator opinion setting
Representing Retail with consumer bodies and understanding consumer concerns
Active management of upstream Regulatory Agenda
Proactive regulator engagement

36
Agenda
UK Retail background & situation assessment
Strategy & Key Initiatives:
- Strategy
- Products
Financial Performance & Outlook
Summary
- Channels

37
Our priorities are clear
Continue to drive cost efficiency across front and back office
Deliver key RTP1 investments and projects to bring RBS capabilities to world class standards
Build sustainable revenue through improved sales effectiveness, share of wallet and product structures
Strengthen the balance sheet towards 100% Loan-to-Deposit ratio and careful risk management
Deliver Customer Charter commitments to re-engage customers and strengthen our brand
Actively manage margin and capital usage to deliver sustainable ROE above 15% (TTC2)
1 Retail Transformation Programme. 2 Through the cycle

38
Summary – the Retail Investment Case
Improving risk profile and control environment
Ambitious but achievable program of change to get RBS to world class
Strong financial momentum across all key metrics
Experienced, capable and energised leadership team
Excellent customer franchise with good opportunities for growth
Careful investment and P&L management disciplines focused on creating sustainable value
1 Retail Transformation Programme

Appendix

40
UK Retail Management CV’s
Name Title Background
Brian Hartzer
Chief Executive Officer, Retail, Wealth & Ulster
Brian joined RBS in August 2009 from ANZ Australia, where he was Chief Executive Officer - Australia, as well as Global Segment Lead for Retail and Wealth. Brian joined ANZ in 1999 as Managing Director, Consumer Finance and later ran ANZ’s Personal Banking division. Prior to joining ANZ, Brian spent ten years as a financial services consultant in New York, San Francisco, and Melbourne. Brian is a graduate of Princeton University.
Les Matheson
Managing Director, Retail Products
Les joined RBS as Managing Director of Retail Products in January 2010. Prior to joining RBS Les spent 12 years with Citibank, including the role of CEO Retail and Citigroup Country Officer for Australia, before moving to St George Bank as Head of Retail in 2008. Prior to working in banking, Les worked for Procter & Gamble and Kraft foods. During his career Les has lived and worked in numerous countries including Singapore, Japan, Switzerland, Belgium, Germany and Argentina.
Sarah Deaves
Managing Director, Private Banking & Advice
Sarah has been Managing Director of Private Banking & Advice since August 2009, which includes responsibility for the Group’s financial planning joint venture with Aviva and a stock broking joint venture with TD Waterhouse. Sarah joined Coutts & Co in January 2002, initially as Chief Operating Officer, then becoming the first female Chief Executive in November 2002 where she remained until July 2009. Prior to joining Coutts she was Managing Director, Own Brand Businesses, RBSG with responsibility for Lombard Direct and Direct Line Financial Services
Satyendra Chelvendra (Chelvi)
Managing Director, Consumer Distribution
Chelvi worked with RBS as a consultant from September 2009, taking over as Managing Director Consumer Distribution in October 2010. Chelvi has 25 years experience in Financial Services, most of it at ANZ, although he spent the last five years as a retail banking consultant working with major banks around the world on their transformation programs. In ANZ, Chelvi successfully ran the branch network, telephone centres, transaction migration program, the online channel and established ANZ’s Indian offshore IT centre. He was also a founding director of eTrade Australia, and acted as a Global Senior Advisor to BCG.
Helen Page Managing Director, Marketing
Formerly Head of Marketing Communications of Abbey and Head of Marketing at Argos, Helen joined The Royal Bank of Scotland Group in August 2004 as Brand Director of NatWest. During 2005 Helen became Marketing Director of NatWest and RBS before assuming responsibility for all UK brands in 2006. Helen is now Managing Director, Marketing for UK Retail and has recently assumed responsibility for Retail External affairs, Internal Communications and Customer Experience and Complaints

41
UK Retail Management CV’s (Cont’d)
Name Title Background
Susan Allen Director, Change & Business Services
Susan joined the RBS group as a graduate trainee in October 1987 and has worked in a range of roles across the Group. Susan started in the branch network, moving into Correspondent Banking, Treasury and roles in both Head Office and Corporate Banking, including setting up an operations function in UK Corporate Banking. Susan moved to Business Services in early 2007 as Director of Corporate Service Operations, before taking on a role as Business Partner to the RWU division
Fiona Davis Finance Director, UK Retail, Wealth and Ulster
Fiona joined RBS Group in 1987 as a qualified Chartered Accountant and has held various financial roles spanning Group Functions and Manufacturing. With her experience and knowledge of the IT, Project Appraisal and Group Function areas, she moved to the Retail division in August 2004 as Finance Director, Retail Banking. Fiona took up the role as Finance Director, Retail, Wealth and Ulster in 2009 leading the 290+ strong Finance team to provide challenge and support to the UK Retail, Wealth and Ulster divisions.
Neil Fuller Chief Risk Officer, UK Retail
Neil joined the Natwest branch banking network 25 years ago and has spent the majority of his career in front-line facing roles from cashiering to Regional Managing Director. More recently he headed up Retail Operations and Retail Operational Risk for RBS UK. His previous two roles have been Director, Enterprise Risk and Director, Credit Risk. He is based in London and is currently the Chief Risk Officer, UK Retail Risk with overall responsibility for Consumer Credit Risk, Operational Risk, Regulatory Risk, Financial Crime and External Risk. The combined teams total c750 staff and are based primarily in Edinburgh, London, Birmingham, Bristol and Southend.
Louise Haggerty
HR Director, UK Retail, Wealth and Ulster
Louise joined the RBS group in 2000 as Head of Human Resources, Group Functions. In 2002 she moved to Manufacturing as Director, Human Resources before taking the role of HR Director, Retail Markets in March 2006. In February 2007, Louise moved to become HR Director for RBS UK, before being appointed into her current role of HR Director, Retail, Wealth and Ulster. Louise started her career at Indy Electronics, moving to Roche Pharmaceuticals and then Digital Equipment Corporation, where she covered various HR roles. Louise then spent four and a half years at the National Australia Group.