uk pre-entry tuberculosis screening report 2018...uk pre-entry tuberculosis screening report 2018 5...
TRANSCRIPT
UK pre-entry tuberculosis screening report 2018
UK pre-entry tuberculosis screening report 2018
2
About Public Health England
Public Health England exists to protect and improve the nation’s health and
wellbeing, and reduce health inequalities. We do this through world-leading science,
knowledge and intelligence, advocacy, partnerships and the delivery of specialist
public health services. We are an executive agency of the Department of Health and
Social Care, and a distinct delivery organisation with operational autonomy. We
provide government, local government, the NHS, Parliament, industry and the public
with evidence-based professional, scientific and delivery expertise and support.
Public Health England
Wellington House
133-155 Waterloo Road
London SE1 8UG
Tel: 020 7654 8000
www.gov.uk/phe
Twitter: @PHE_uk
Facebook: www.facebook.com/PublicHealthEngland
Prepared by: TB Screening Unit
For queries relating to this document, please contact: [email protected]
© Crown copyright 2019
You may re-use this information (excluding logos) free of charge in any format or
medium, under the terms of the Open Government Licence v3.0. To view this
licence, visit OGL. Where we have identified any third party copyright information
you will need to obtain permission from the copyright holders concerned.
Published July 2019
PHE publications PHE supports the UN
gateway number: GW-594 Sustainable Development Goals
UK pre-entry tuberculosis screening report 2018
3
Contents
Executive summary 4
Acknowledgements 5
Tuberculosis screening clinics 6
Methods 9
Demographics of all applicants 10
Conclusion 23
References 24
Appendices 26
UK pre-entry tuberculosis screening report 2018
4
Executive summary
The tuberculosis pre-entry screening programme has been operational in 101
countries since replacing on-entry screening at UK airports in March 2014. The
programme is delivered in collaboration with the UK Home Office. Public Health
England provides advice, training, clinic audits, and data and information to support
the quality assurance and evaluation of the programme.
This report presents data from 141 overseas clinics for the period between October
2005 and December 2018. Since programme roll out, there have been significant
improvements in data quality and collection. We are still working with partners to
improve data quality and expect that the uptake of electronic data collection tools will
contribute further to this improvement.
Since October 2005, we have received 2,016,795 applications which represents
1,573,018 individual applicants. The median age of applicants for the entire period
was 24 years (interquartile range 20.0-30.0 years) and the largest proportion of
applications where age was known, were adolescents and young adults aged 15-34
years (78.2%, 1,303,170/1,665,847). Where sex was known, 52.4% of applicants
were male.
In total, 304,234 applicants were screened in 2018. The largest screening volumes
in 2018 were in China [32.7% (99,569/304,234)], India [23.6% (71,931/304,234)],
Pakistan [6.9% (21,103/304,234)] and Nigeria [4.3% (13,038/304,234)] reflecting
current migration trends.
During 2018, there were 318 active tuberculosis cases detected through pre-entry
screening, giving an overall tuberculosis yield of 104.5 per 100,000 applicants. The
tuberculosis detection rate increased dramatically from 44.9 per 100,000 in 2006 to
168.4 per 100,000 in 2014, reflecting an increased use of sputum culture and
improved overall quality of screening. There was a decrease in rate between 2015
and 2016 but the rate seems to have stabilised between 2016 and 2018. The
tuberculosis screening yields of most countries were within the ranges that would be
expected from UK surveillance of active tuberculosis cases of recent migrants from
those countries. There are exceptions to this, where some countries are screening
and detecting more or less active tuberculosis cases than expected.
This report provides a summary of pre-entry tuberculosis screening activities for the
UK during 2018. It also provides trends for TB detection by the programme between
2006 and 2018.

UK pre-entry tuberculosis screening report 2018
5
Acknowledgements
We gratefully acknowledge the provision of data by the International Organisation for
Migration (IOM), other overseas panel physicians, the Foreign and Commonwealth
Office (FCO) posts and the Home Office.
We also acknowledge the help and support of Robert Sookoo, Nicol Black, Vinay
Ketkar, Sophia Masud and Graham Bickler (Public Health England (PHE) Port
Health Unit at Heathrow).
We are thankful for support of TB Surveillance Unit for the provision of enhanced
tuberculosis surveillance system (ETS) data.
Authors
This report was prepared by Morris Muzyamba, Hannah Hume, Olivia Conroy and
Grace Smith – Tuberculosis Section (TB Screening Unit), National Infection Service,
PHE.
UK pre-entry tuberculosis screening report 2018
6
Tuberculosis screening clinics
Introduction
The UK experienced an increase in rates of tuberculosis (TB) and case numbers
between 2000 and 2011. Rates peaked in 2011, and since then have decreased by
approximately one-third. Despite these reductions, the UK still has the third highest
TB rate in Western Europe [1].
5,075 cases of TB were reported during 2018 in the UK (7.6 per 100,000) [2]. TB in
England is concentrated in urban areas and among specific risk groups, such as
people with socio-economic risk factors and particularly those who were born in high
TB incidence countries. During 2018, where place of birth was known, 70.5% of UK
TB cases were among non-UK born persons, a rate 14-times higher than UK born
cases [3].
The high percentage of non-UK born cases and the cost of treatment to the NHS
means that pre-entry screening of migrants has the potential to reduce the number
of cases of active TB disease and the risk of transmission, with financial benefits to
the NHS and public health benefits to the population. Pre-entry screening for active
pulmonary TB was rolled out from 2012 to replace on-entry TB screening in the
ports and help decrease prevalent TB cases in non-UK born individuals in the UK [4].
Aims and objectives of the report
The aim of this report is to present the current figures from the pre-entry screening
programme for active pulmonary TB, show trends and provide a comparison by
demographic and geographical characteristics. This provides insight into the
effectiveness of the programme to support quality assurance. A comparison of
numbers detected overseas and domestically in the UK will also be presented.
Through data analysis and information, the report helps to inform quality assurance,
identify issues associated with individual screening clinics and provide feedback for
stakeholders.
Pre-entry screening
Visa applicants who intend to stay in the UK for longer than 6 months and who reside
in a high TB incidence country (>40/100,000), are required to take part in the UK pre-
entry TB screening programme. This is mandated by the UK Immigration Act 1971,
paragraph 2(2), schedule 2 [5] and was based on a successful pilot jointly carried out by
the Home Office and the International Organization for Migration (IOM). This pilot took

UK pre-entry tuberculosis screening report 2018
7
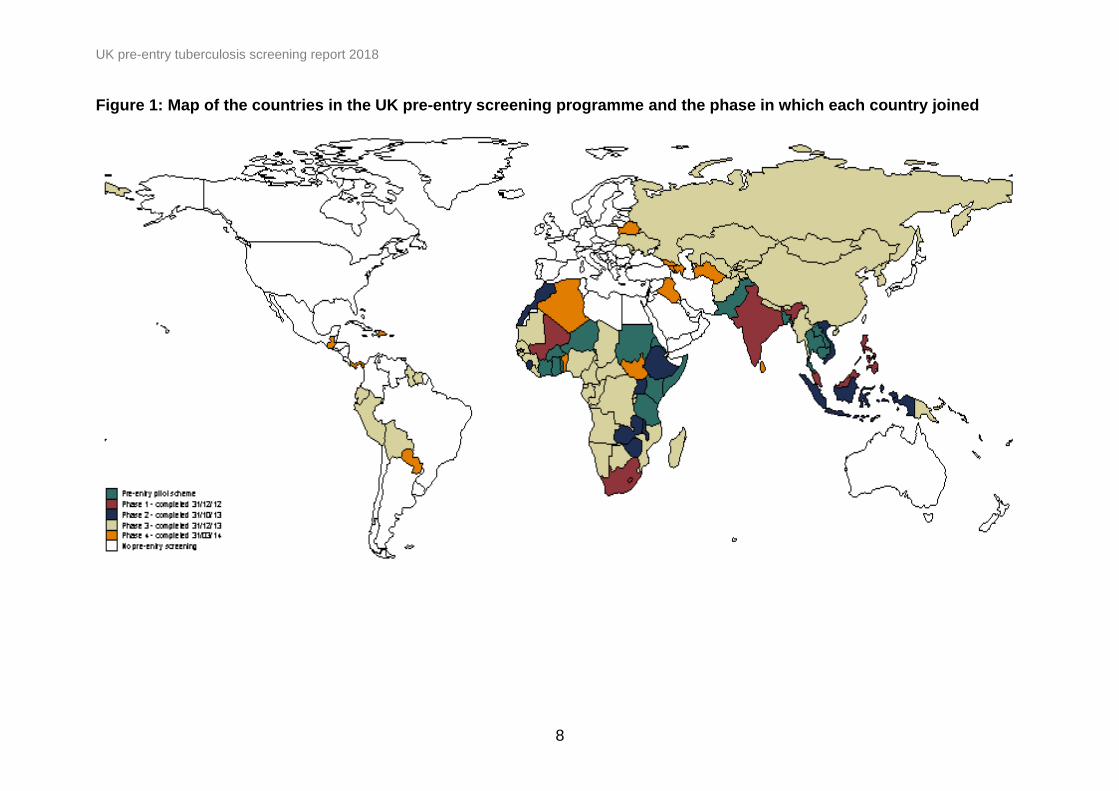
place between October 2005 and September 2012 in 15 countries (Bangladesh,
Burkina Faso, Cambodia, Cote D’Ivoire, Eritrea, Ghana, Kenya, Laos, Niger, Pakistan,
Somalia, Sudan, Tanzania, Thailand and Togo). The programme was globally rolled
out by March 2014 to 101 countries [6,7] with World Health Organization (WHO)
estimated TB incidence of >40 per 100,000 population for 2012 [8] (Figure 1). TB pre-
entry screening is now carried out by both the IOM and non-IOM panel physicians.
The UK pre-entry TB screening programme is similar to the screening programmes
used by other countries. Most notably, the UK partners with countries from the
Migration-5: Australia, Canada, New Zealand and USA. Pulmonary TB screening is
based on chest x-rays (CXR) and symptom enquiry, followed by sputum smear and
culture when TB is suspected [9]. Applicants with pulmonary TB are required to
successfully complete treatment before they can proceed with their visa application.
UK pre-entry tuberculosis screening report 2018
8
Figure 1: Map of the countries in the UK pre-entry screening programme and the phase in which each country joined
UK pre-entry tuberculosis screening report 2018
9
Methods
Data collection
This report presents data collected from IOM and non-IOM clinics. IOM data was
collected by IOM panel physicians, entered via a secure web-based IOM system and
collated by the central IOM office in Manila. This data was then securely transferred to
PHE. Data from non-IOM providers was collected by the clinics, collated via the
overseas UK visa application centres and securely transferred to PHE. During 2018, the
TB screening team conducted an audit of culture updates from all non-IOM clinics for
the period between 2012 and 2018. Clinics were required to provide the clinical details
of all patients that had culture confirmed TB during this time period. We received culture
updates from 75.9% (107/141) of clinics, including all the high throughput clinics. This
increased the number of culture confirmed cases and included cases not originally
identified by screening.
Data cleaning and analysis
Data was cleaned, validated and missing values completed where possible. IOM data
was of good quality, but non-IOM data contained some missing variables and
discrepant dates. Whenever possible, missing values were deduced from other
variables. Variables from IOM and non-IOM data were harmonised and merged into a
common dataset.
Clean data was imported into Stata v.15 (Statacorp LP, College Station, TX, USA)
which was used for all statistical analyses. Graphs and tables were created with MS
Excel 2016 and exported to MS Word (Microsoft Corp, Redmond, WA, USA).
Data was available for IOM screening activities between October 2005 and December
2018 and non-IOM providers between September 2012 and December 2018. Data up to
31 December 2018, as received by 19 April 2018, was included in this report.
UK pre-entry tuberculosis screening report 2018
10
Demographics of all applicants
Pre-entry screening data for 2018 was available for 304,234 UK visa applicants
compared to 255,510 in 2017. Data from non-IOM and IOM clinics is presented together
throughout this chapter, except where noted otherwise.
Age and sex distribution of all applicants
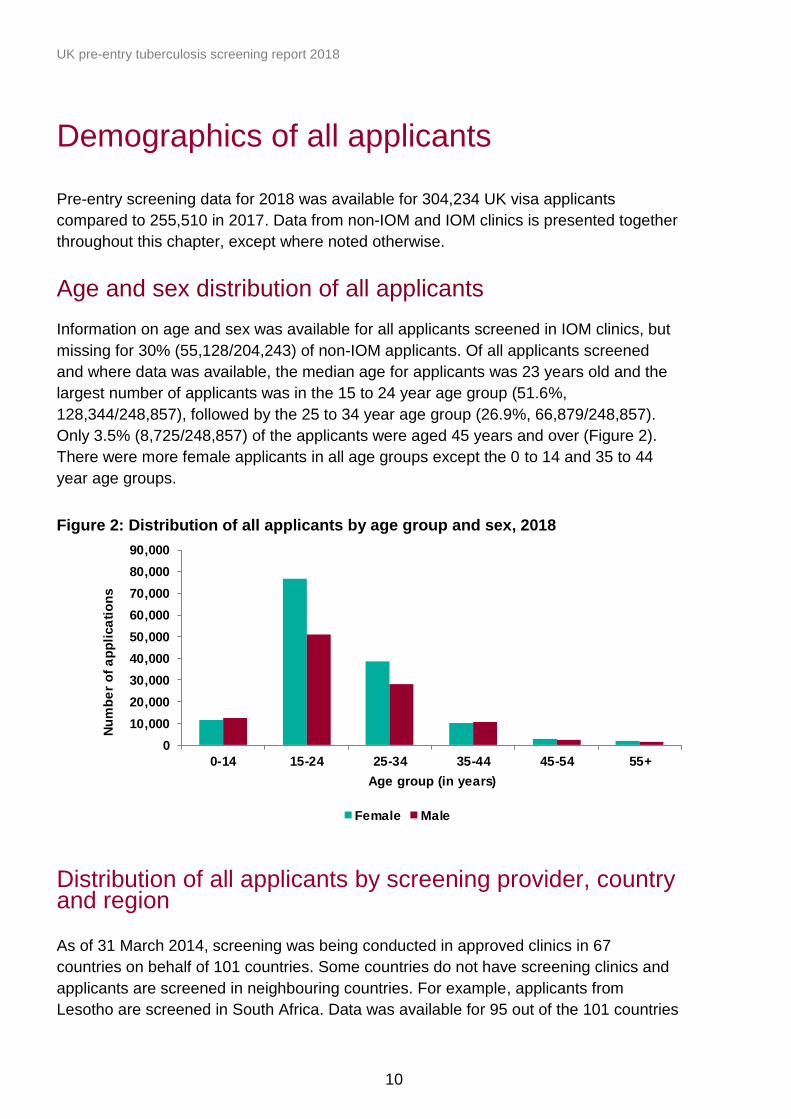
Information on age and sex was available for all applicants screened in IOM clinics, but
missing for 30% (55,128/204,243) of non-IOM applicants. Of all applicants screened
and where data was available, the median age for applicants was 23 years old and the
largest number of applicants was in the 15 to 24 year age group (51.6%,
128,344/248,857), followed by the 25 to 34 year age group (26.9%, 66,879/248,857).
Only 3.5% (8,725/248,857) of the applicants were aged 45 years and over (Figure 2).
There were more female applicants in all age groups except the 0 to 14 and 35 to 44
year age groups.
Figure 2: Distribution of all applicants by age group and sex, 2018
Distribution of all applicants by screening provider, country and region
As of 31 March 2014, screening was being conducted in approved clinics in 67
countries on behalf of 101 countries. Some countries do not have screening clinics and
applicants are screened in neighbouring countries. For example, applicants from
Lesotho are screened in South Africa. Data was available for 95 out of the 101 countries
0
10,000
20,000
30,000
40,000
50,000
60,000
70,000
80,000
90,000
0-14 15-24 25-34 35-44 45-54 55+
Nu
mb
er
of
ap
pli
ca
tio
ns
Age group (in years)
Female Male
UK pre-entry tuberculosis screening report 2018
11
in 2018. We estimate that the remaining 6 countries from which data was missing
screened only 0.2% (488/304,234) of the total UK visa applicants received for 2018 [10].
Of the applicants that underwent screening in 2018, almost half of recorded screens
[47% (143,066/304,234)] took place in South East Asia. Most of the applications from
South East Asia were from China, which accounted for a third [32.7% (99,569/304,234)
of all applications. Just over a third (34.8% (105,808/304,234) of applicants were from
the Indian subcontinent. 14% (42,672/304,234)] were from Africa and a small number of
applicants were from Europe and the Commonwealth of Independent States1 (CIS)
[2.8% (8,458/304,234)], the Middle East [1% (2,945/ 304,234)] and South & Central
America [0.4% (1,285/304,234)].
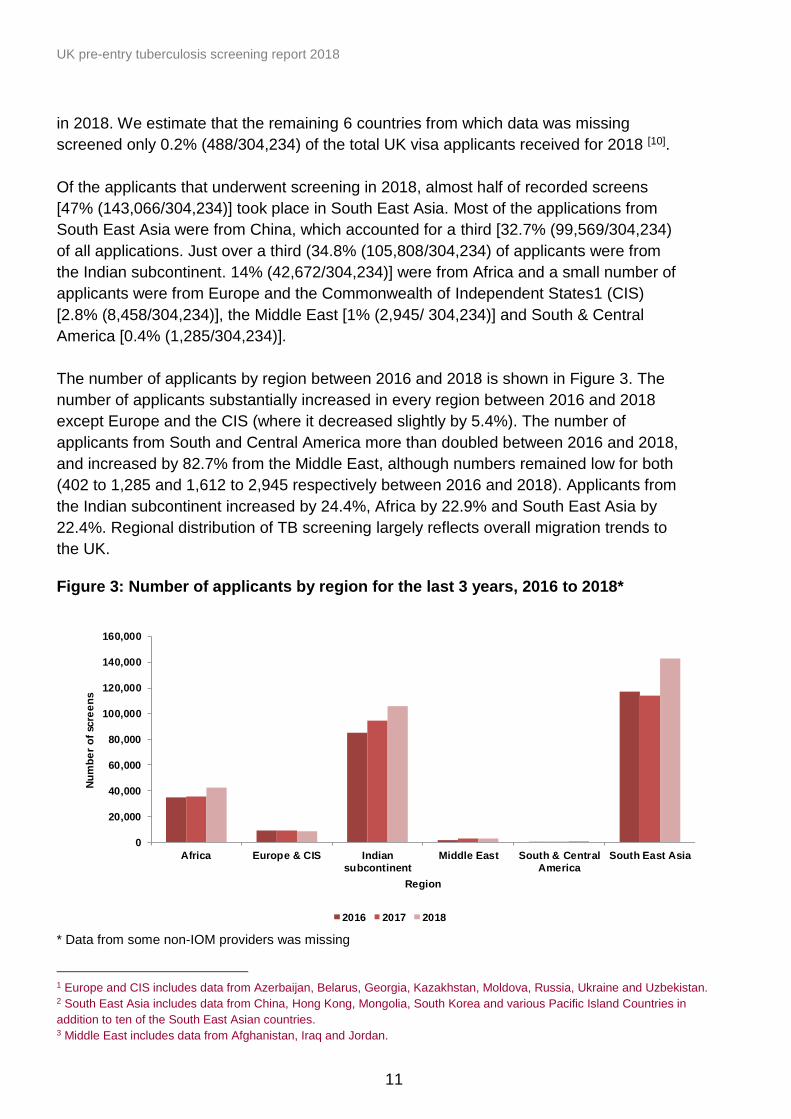
The number of applicants by region between 2016 and 2018 is shown in Figure 3. The
number of applicants substantially increased in every region between 2016 and 2018
except Europe and the CIS (where it decreased slightly by 5.4%). The number of
applicants from South and Central America more than doubled between 2016 and 2018,
and increased by 82.7% from the Middle East, although numbers remained low for both
(402 to 1,285 and 1,612 to 2,945 respectively between 2016 and 2018). Applicants from
the Indian subcontinent increased by 24.4%, Africa by 22.9% and South East Asia by
22.4%. Regional distribution of TB screening largely reflects overall migration trends to
the UK.
Figure 3: Number of applicants by region for the last 3 years, 2016 to 2018*
* Data from some non-IOM providers was missing
1 Europe and CIS includes data from Azerbaijan, Belarus, Georgia, Kazakhstan, Moldova, Russia, Ukraine and Uzbekistan. 2 South East Asia includes data from China, Hong Kong, Mongolia, South Korea and various Pacific Island Countries in
addition to ten of the South East Asian countries. 3 Middle East includes data from Afghanistan, Iraq and Jordan.
0
20,000
40,000
60,000
80,000
100,000
120,000
140,000
160,000
Africa Europe & CIS Indian
subcontinent
Middle East South & Central
America
South East Asia
Nu
mb
er
of
scre
en
s
Region
2016 2017 2018
UK pre-entry tuberculosis screening report 2018
12
Diagnostic tests and case detection
Due to the issues in data quality received from non-IOM clinics (see Table 1 in the
Appendix for list of countries affected), the following paragraphs and flow-chart (Figure 4)
are restricted to IOM data only. Non-IOM data quality issues include missing data for key
variables such as sputum smear and culture results, chest X-ray results and medical
certificate issuance. Such entries for key variables were sometimes discordant.
Chest X-Rays (CXR)
Of the 99,991 applicants from IOM, 89,803 (89.8%) had a CXR taken (Figure 4).
Reasons for not obtaining a CXR were known for 99.9% (10,180) of the 10,187
individuals where CXRs were not done. A total of 129 people did not have a CXR
because they were pregnant and 10,051 were children under 11 years old.
Of the 89,803 individuals that had CXR examinations, 81.7% (81,671/99,991) had a
normal CXR and 2% (1,993/99,991) had abnormalities that were consistent with TB. The
total number of sputum culture results available was 1,921 with 26 pending at the time of
writing. Of the 1,921, 100 cases were culture confirmed and an additional 11 applicants
were diagnosed according to the clinical case definition (see Appendix 7.1) due to TB-
related CXR changes. These 111 TB cases were not issued with clearance certificates
and were instead referred for TB treatment. A total of 111 TB cases diagnosed by IOM
represents a decrease of 9% from 2017 (n=122). An additional 1,882 individuals with
abnormalities consistent with TB were found not to have active TB based on negative
sputum cultures.
Sputum tests
The UK tuberculosis technical instructions (UKTBTI) mandate sputum culture for the
diagnosis of active TB because of the low sensitivity of smears [9]. For this reason,
sputum smear results are not included in Figure 4.
For CXRs with TB-related abnormalities, the UK Technical Instructions [9] require 3
sputum samples to be submitted for smear and culture.
Sputum smears and cultures
Of the 1,937 individuals who had sputum smear results, 1.3% (26/1,937) were sputum
smear positive and 98.7% (1,911/1937) sputum smear negative. All individuals with
positive sputum smears had undergone CXR examination first (Table 1).
UK pre-entry tuberculosis screening report 2018
13
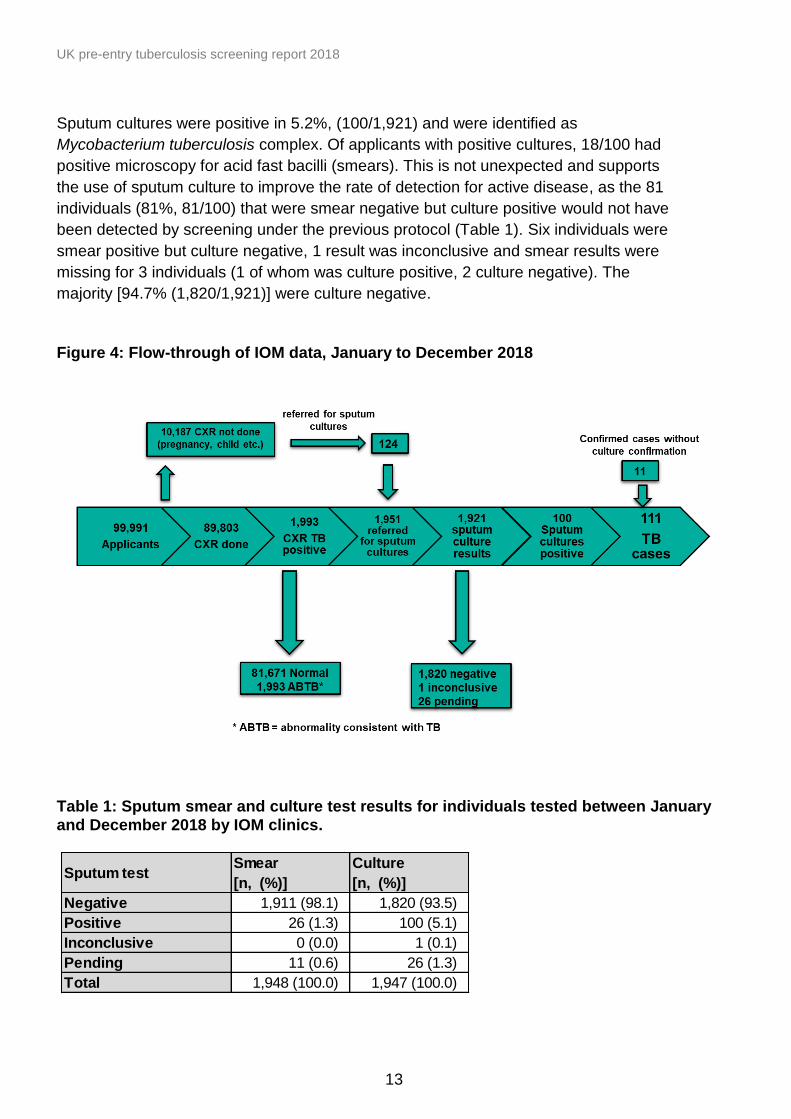
Sputum cultures were positive in 5.2%, (100/1,921) and were identified as
Mycobacterium tuberculosis complex. Of applicants with positive cultures, 18/100 had
positive microscopy for acid fast bacilli (smears). This is not unexpected and supports
the use of sputum culture to improve the rate of detection for active disease, as the 81
individuals (81%, 81/100) that were smear negative but culture positive would not have
been detected by screening under the previous protocol (Table 1). Six individuals were
smear positive but culture negative, 1 result was inconclusive and smear results were
missing for 3 individuals (1 of whom was culture positive, 2 culture negative). The
majority [94.7% (1,820/1,921)] were culture negative.
Figure 4: Flow-through of IOM data, January to December 2018
Table 1: Sputum smear and culture test results for individuals tested between January and December 2018 by IOM clinics.
Sputum testSmear
[n, (%)]
Culture
[n, (%)]
Negative 1,911 (98.1) 1,820 (93.5)
Positive 26 (1.3) 100 (5.1)
Inconclusive 0 (0.0) 1 (0.1)
Pending 11 (0.6) 26 (1.3)
Total 1,948 (100.0) 1,947 (100.0)
UK pre-entry tuberculosis screening report 2018
14
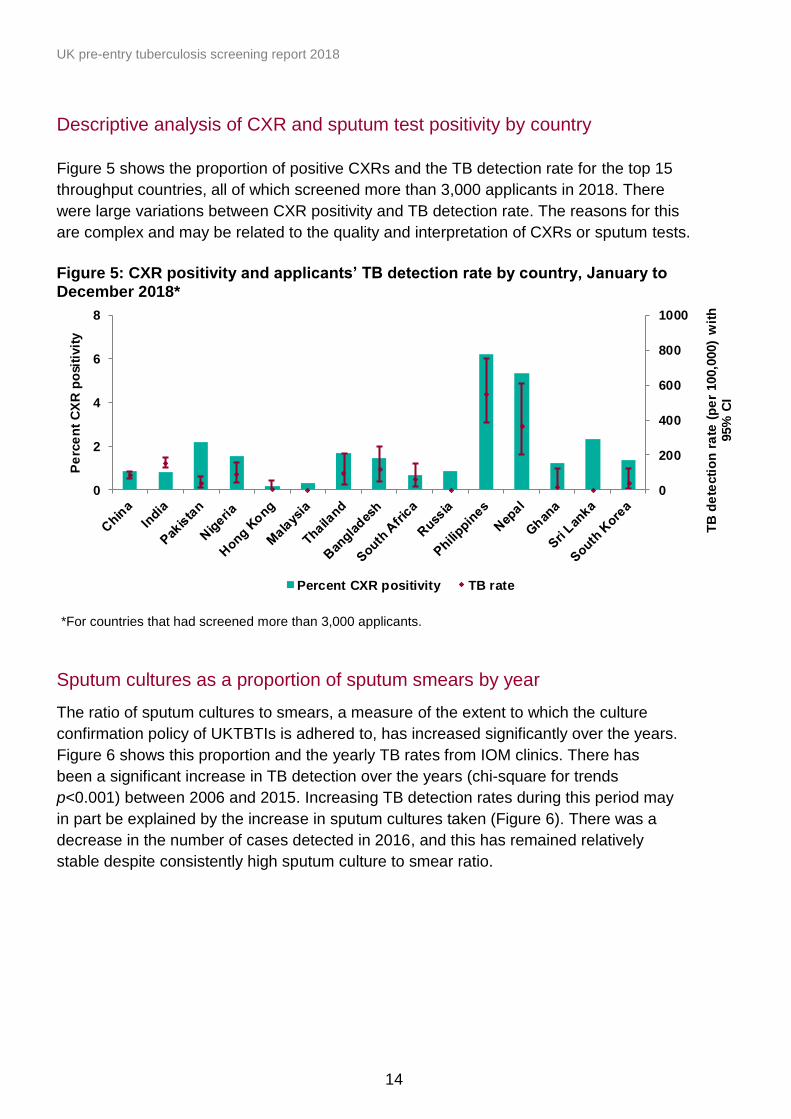
Descriptive analysis of CXR and sputum test positivity by country
Figure 5 shows the proportion of positive CXRs and the TB detection rate for the top 15
throughput countries, all of which screened more than 3,000 applicants in 2018. There
were large variations between CXR positivity and TB detection rate. The reasons for this
are complex and may be related to the quality and interpretation of CXRs or sputum tests.
Figure 5: CXR positivity and applicants’ TB detection rate by country, January to December 2018*
*For countries that had screened more than 3,000 applicants.
Sputum cultures as a proportion of sputum smears by year
The ratio of sputum cultures to smears, a measure of the extent to which the culture
confirmation policy of UKTBTIs is adhered to, has increased significantly over the years.
Figure 6 shows this proportion and the yearly TB rates from IOM clinics. There has
been a significant increase in TB detection over the years (chi-square for trends
p<0.001) between 2006 and 2015. Increasing TB detection rates during this period may
in part be explained by the increase in sputum cultures taken (Figure 6). There was a
decrease in the number of cases detected in 2016, and this has remained relatively
stable despite consistently high sputum culture to smear ratio.
0
200
400
600
800
1000
0
2
4
6
8
TB
de
tecti
on
ra
te (
pe
r 100,0
00)
wit
h
95%
CI
Pe
rce
nt
CX
R p
osi
tivit
y
Percent CXR positivity TB rate

UK pre-entry tuberculosis screening report 2018
15
Figure 6: IOM sputum cultures as a proportion of sputum smears$ by screening year
$As a proxy for proportion of cultures in amongst all sputum tests done
Descriptive analysis of TB cases
In 2018, 318 cases of active TB were detected and notified through the entire screening
programme, giving an overall tuberculosis yield of 104.5 per 100,000 visa applicants.
65.1% of the cases (207/318) were reported from non-IOM clinics. The TB detection
rate in IOM clinics was higher than that in non-IOM clinics (111.0 [95%CI 91.3-133.7]
versus 101.4 [95% CI 88.0-116.1] per 100,000). As of 19 April 2018, a total of 747
sputum culture results from 2018 were still pending (compared to 794 in 2017) and the
number of cases may increase when these are available.
Figure 7 shows the number of TB cases and detection rates by year of screening. TB
detection rates increased significantly between 2006 and 2014, decreased in 2016 and
have remained stable between 2016 and 2018. Females accounted for 52.9% (118/223)
of all the TB cases in 2018 where sex was known, which was a slightly smaller
proportion than 2017 (55.6%). However, TB rates were slightly higher in males
compared to females in 2018 (99.0 and 82.8 per 100,000, respectively).
0
50
100
150
200
250
0
20
40
60
80
100
2006 2007 2008 2009 2010 2011 2012 2013 2014 2015 2016 2017 2018 TB
de
tecti
on
ra
te (
pe
r 100,0
00)
wit
h
95%
CI
Sp
utu
m c
ult
ure
s a
s a
% o
f sm
ea
rs
Screening year
Culture as % of smears TB rate
UK pre-entry tuberculosis screening report 2018
16
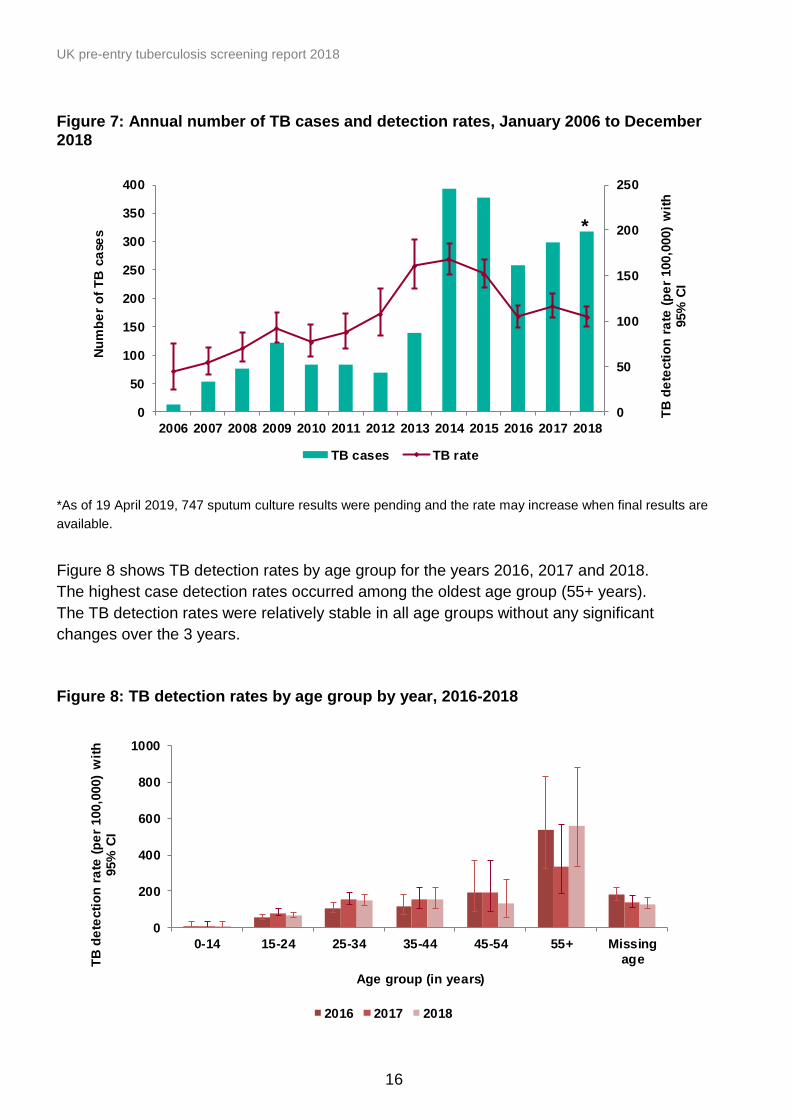
Figure 7: Annual number of TB cases and detection rates, January 2006 to December 2018
*As of 19 April 2019, 747 sputum culture results were pending and the rate may increase when final results are
available.
Figure 8 shows TB detection rates by age group for the years 2016, 2017 and 2018.
The highest case detection rates occurred among the oldest age group (55+ years).
The TB detection rates were relatively stable in all age groups without any significant
changes over the 3 years.
Figure 8: TB detection rates by age group by year, 2016-2018
0
50
100
150
200
250
0
50
100
150
200
250
300
350
400
2006 2007 2008 2009 2010 2011 2012 2013 2014 2015 2016 2017 2018
TB
de
tecti
on
ra
te (
pe
r 100,0
00)
wit
h
95%
CI
Nu
mb
er
of
TB
ca
ses
TB cases TB rate
*
0
200
400
600
800
1000
0-14 15-24 25-34 35-44 45-54 55+ Missing
ageTB
de
tecti
on
ra
te (
pe
r 100,0
00)
wit
h
95%
CI
Age group (in years)
2016 2017 2018

UK pre-entry tuberculosis screening report 2018
17
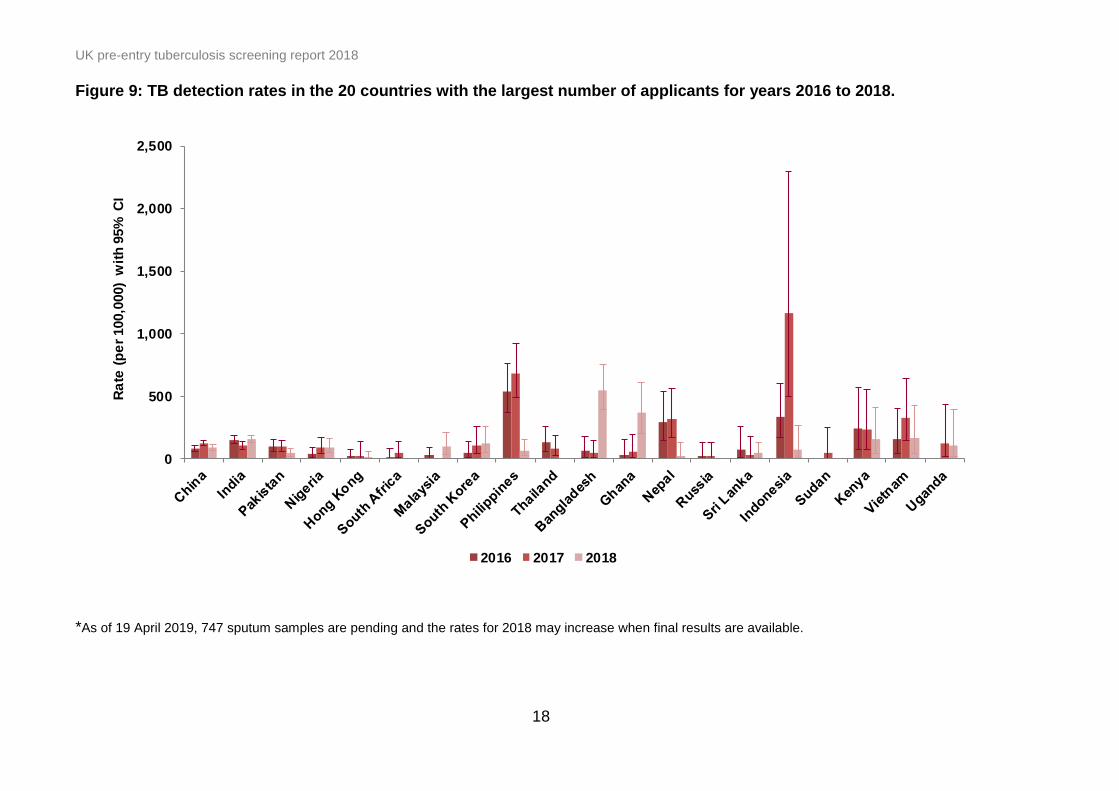
The TB detection rates (with 95% CI) between 2016 and 2018 in 20 countries with the
highest throughput are shown in Figure 9. The TB rates were stable in most countries
with non-significant changes in the period 2016 to 2018. However, significant increases
in rates between 2017 and 2018 were observed in Bangladesh and Ghana. Significant
decreases in rates between 2017 and 2018 were observed in the Philippines and
Indonesia. The reasons for this are not clear and need further investigation.
UK pre-entry tuberculosis screening report 2018
18
Figure 9: TB detection rates in the 20 countries with the largest number of applicants for years 2016 to 2018.
*As of 19 April 2019, 747 sputum samples are pending and the rates for 2018 may increase when final results are available.
0
500
1,000
1,500
2,000
2,500
Ra
te (
pe
r 100,0
00)
wit
h 9
5%
C
I
2016 2017 2018

UK pre-entry tuberculosis screening report 2018
19
TB detection rates by visa category for years 2016 to 2018 are shown in Figure 10.
Where visa category was known, detection rates for visa categories “Family Reunion”,
“Settlement and dependants” and “Students” decreased to similar levels seen in 2016
after an increase in 2017, and “Working Holiday Maker” also saw a decrease after an
increase in 2017. Following similar detection rates in 2016 and 2017, there was an
increase in detection rates for those applying for a ‘Work’ visa. Those under the ‘Other’
visa category and those with missing visa category increased to similar levels seen in
2016 after a decrease in 2017 (Figure 10). The fluctuations could result from missing
data and changes in numbers in applications for the different visa categories.
Figure 10: TB detection rates by applicant visa type, 2016-2018.
Drug susceptibility testing of positive TB cultures
TB culture and drug susceptibility testing (DST) is a mandatory requirement under the
UKTBTIs, and is important to allow appropriate treatment for TB cases. Figure 11
shows the number of positive sputum cultures and the proportion that have had DST
performed. Between 2007 and 2018, the proportion of cultures with DST ranged
between 33.3% and 100% and there was no consistent pattern.
0
100
200
300
400
500
Family
Reunion
Settlement
and
dependants
Students Work Working
Holiday
Maker
Other Missing
TB
de
tecti
on
ra
te (
pe
r 100,0
00)
wit
h 9
5%
C
I
Visa type
2016 2017 2018

UK pre-entry tuberculosis screening report 2018
20
Figure 11: Trends in drug susceptibility testing, 2007 to 2018*
*The graph partially reflects low but increasing drug sensitivity testing as it was rolled out among IOM
clinics (2007 to 2011) and low drug sensitivity testing among non-IOM clinics (2012 to 2018).
Figure 12 summarises the overall DST for all clinics’ results in 2018. In 2018, most TB
cultures were sensitive to all first-line drugs [85.7% (90/105)]. Where DST results were
available, in 2018 14.3% of cases had drug resistance of some description. Of these,
3 had isoniazid monoresistance, 1 had rifampicin monoresistance, 5 were resistant to a
first-line drug other than isoniazid or rifampicin (ethambutol or pyrazinamide) and 5 were
classified as poly-drug resistant (resistant to 2 or more first-line drugs, but not MDR).
One multi-drug resistant TB (MDR) case was seen in 2018, and no extensively-drug
resistant (XDR) TB cases were detected. Drug susceptibility terms are defined in
Appendix 7.
0
20
40
60
80
100
0
20
40
60
80
100
120
140
160
180
2007 2008 2009 2010 2011 2012 2013 2014 2015 2016 2017 2018
% D
ST
Nu
mb
er
of
po
siti
ve
cu
ltu
res
Screening year
Positive culture % DST

UK pre-entry tuberculosis screening report 2018
21
Figure 12: Summary of drug susceptibility patterns for the 702 positive TB cultures, 2018
XDR= Extensively drug resistant, MDR=Multi-drug resistant, INH=Isoniazid & RIF=Rifampicin.
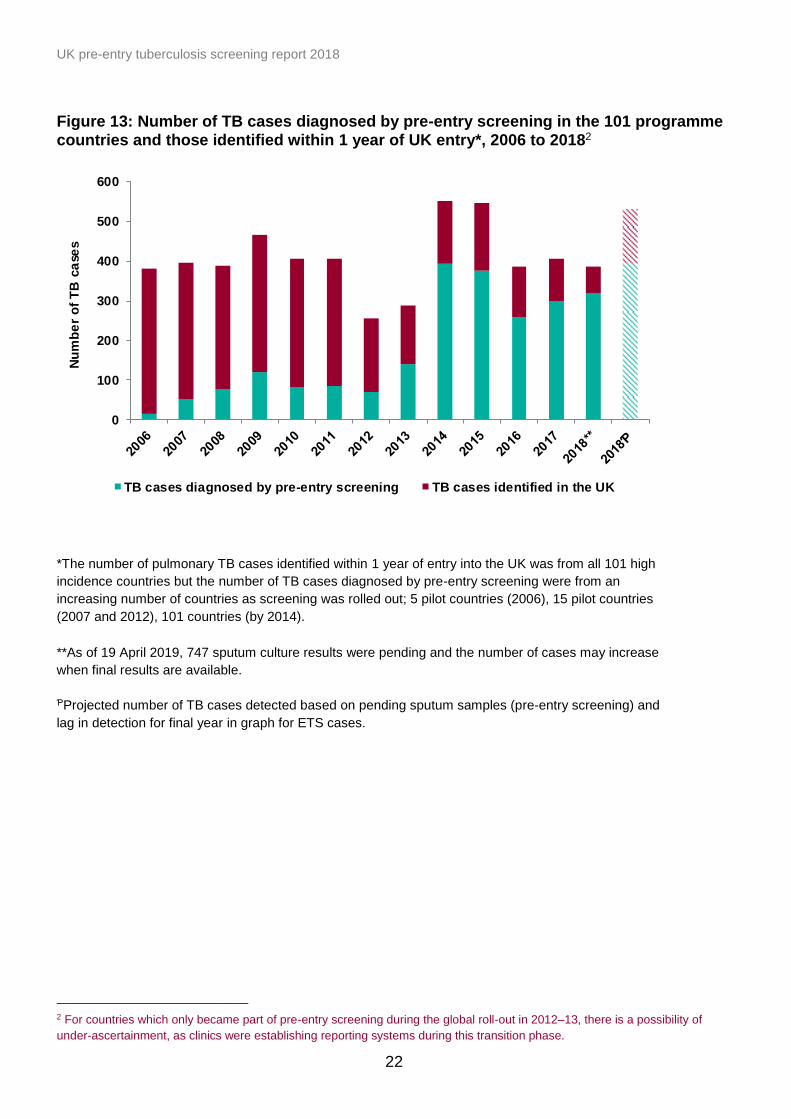
Comparison of screening yields between ETS and pre-entry screening data
Overall, TB numbers detected through the pre-entry TB screening programme
increased significantly from 14 in 2006 to 393 in 2014, then after a decrease to 259 in
2016, have increased to 318 in 2018. During the same period the total number of UK
pulmonary TB cases (as reported to national surveillance, ETS) identified within the
year of entry from the 101 countries [7] in the screening programme decreased from 416
in 2006 to 69 in 2018 (Figure 13). The decreasing number of TB cases diagnosed within
the first year of entry to the UK may be due in part to pre-entry screening and changes
in migration trends [4].
85.7%
4.8%
2.9%
1.0% 4.8% 1.0%
Sensitive to all first line drugs
Resistant to one first-line drug
other than INH or RIF
INH-R (but not RIF-R or MDR)
RIF-R (but not INH-R or MDR)
Resistant to two or more first-
line drugs (but not MDR)
MDR (but not XDR)
UK pre-entry tuberculosis screening report 2018
22
Figure 13: Number of TB cases diagnosed by pre-entry screening in the 101 programme countries and those identified within 1 year of UK entry*, 2006 to 20182
*The number of pulmonary TB cases identified within 1 year of entry into the UK was from all 101 high
incidence countries but the number of TB cases diagnosed by pre-entry screening were from an
increasing number of countries as screening was rolled out; 5 pilot countries (2006), 15 pilot countries
(2007 and 2012), 101 countries (by 2014).
**As of 19 April 2019, 747 sputum culture results were pending and the number of cases may increase
when final results are available.
ƤProjected number of TB cases detected based on pending sputum samples (pre-entry screening) and
lag in detection for final year in graph for ETS cases.
2 For countries which only became part of pre-entry screening during the global roll-out in 2012–13, there is a possibility of
under-ascertainment, as clinics were establishing reporting systems during this transition phase.
0
100
200
300
400
500
600
Nu
mb
er
of
TB
ca
ses
TB cases diagnosed by pre-entry screening TB cases identified in the UK
UK pre-entry tuberculosis screening report 2018
23
Conclusion
This report presents data from the UK pre-entry TB screening programme until the end
of 2018, representing the fourth year of operation since full roll out among 101
countries. Over the last few years, the screening throughput has remained stable at
between 250,000 and 300,000 assessments annually, and the demography of
applicants, a relatively young cohort with a slight female preponderance, has remained
similar. As in previous years, TB detection rates vary significantly between countries,
sites, age groups and visa types. The variations could be due to either differences in TB
prevalence among applicants or changes in TB screening quality, or a mixture of both.
Further work is required to better understand these variations.
In 2018, 318 TB cases were detected by the programme – a rate of 104.5 per 100,000.
This is a slight decrease from 2017 (116.6 per 100,000 with 298 cases), alongside an
increased number of applicants (304,234 in 2018 vs 255,510 in 2017), probably due to
improved data returns in 2018. Although data quality (particularly in the non-IOM data)
remains of concern, significant data quality improvements were made in 2018, including
a culture confirmation audit which identified an additional 20 TB cases. We continue to
closely collaborate and carry out training in order improve data quality, and while more
work remains to be done (particularly in low throughput areas), further improvements
are expected with the ongoing development of a global web-based data solution.
With regards to drug resistance across the programme in 2018, most people with
culture confirmed TB were sensitive to all first-line drugs (85.7%, 90/105). The
proportion of drug-resistant TB cases detected through pre-entry screening (14.3%) was
slightly higher than the 1 reported through the domestic ETS for all TB cases in the UK
(11.4%). The early detection and treatment of drug resistant cases prior to arrival in the
UK may yield some benefits for domestic TB control.
The number of cases detected among migrants from screening countries within 1 year
of entry into the UK (by ETS) compared with the number of cases detected by pre-entry
screening shows that as the numbers detected abroad increased, the number detected
in the UK fell. This suggests that pre-entry screening, as expected, removes the
prevalent active TB cases that could potentially end up in the UK.
In conclusion, our report shows that a number of significant improvements have been made,
including near-universal sputum culture confirmation among IOM applicants [11-16], and
improved procedures in non-IOM clinics. Recent analyses have shown that approximately
11.4% of the reduction in TB cases in the UK was due to pre-entry TB screening [4],
confirming its place as part of a multi-dimensional TB strategy for England [17].
UK pre-entry tuberculosis screening report 2018
24
References
1. ECDC Tuberculosis surveillance and monitoring in Europe 2019.
https://ecdc.europa.eu/en/publications-data/tuberculosis-surveillance-and-monitoring-
europe-2019. Accessed May 2019.
2. Public Health England (PHE). Reported cases of tuberculosis to enhanced tuberculosis
surveillance systems: United Kingdom, 2000 to 2018.
https://www.gov.uk/government/statistics/reports-of-cases-of-tb-to-uk-enhanced-
tuberculosis-surveillance-systems. Accessed May 2019.
3. Public Health England. (2019) Tuberculosis in England: 2018 report. Public Health
England: London.
https://www.gov.uk/government/publications/tuberculosis-in-england-annual-report.
Accessed May 2019.
4. Thomas HL, Harris RJ, Muzyamba MC, Davidson JA, Lalor MK, Campbell CNJ, Anderson
SR and Zenner D. (2018). Reduction in tuberculosis incidence in the UK from 2011 to
2015: a population-based study. Thorax, 73: 769-775.
5. Immigration Act 1971.
http://www.legislation.gov.uk/ukpga/1971/77/pdfs/ukpga_19710077_en.pdf. Accessed May
2019.
6. Migrant tuberculosis screening. Statement by Immigration Minister (2012).
https://www.gov.uk/government/speeches/migrant-tuberculosis-screening. Accessed May
2019.
7. New phase of tuberculosis screening launched as part of Immigration rules changes.
https://www.gov.uk/government/news/new-phase-of-tuberculosis-screening-launched-as-
part-of- immigration-rules-changes. Accessed May 2019.
8. World Health Organisation. Global Tuberculosis report 2012.
http://apps.who.int/iris/bitstream/10665/75938/1/9789241564502_eng.pdf. Accessed May
2019.
9. UK Tuberculosis Technical Instructions (UKTBTI).
https://www.gov.uk/government/publications/uk-tuberculosis-technical-instructions.
Accessed May 2019.
UK pre-entry tuberculosis screening report 2018
25
10. Home Office (2019). Immigration statistics, year ending March 2019: How many people
come to the UK each year?
https://www.gov.uk/government/publications/immigration-statistics-year-ending-march-
2019/how-many-people-come-to-the-uk-each-year. Accessed May 2019.
11. UK pre-entry tuberculosis screening report: 2016
https://www.gov.uk/government/publications/tuberculosis-pre-entry-screening-in-the-uk.
Accessed May 2019.
12. Liu Y, Posey DL, Cetron MS, Painter JA. Effect of a Culture-Based Screening Algorithm on
Tuberculosis Incidence in Immigrants and Refugees Bound for the United States: A
Population-Based Cross-sectional Study. Ann Intern Med. 2015 Mar 17; 162(6):420-8.
13. Aldridge RW, Yates TA, Zenner D, White PJ, Abubakar I, Hayward AC. Pre-entry screening
programmes for tuberculosis in migrants to low-incidence countries: a systematic review and
meta-analysis. Lancet Infectious Diseases [Internet]. 2014 Nov [cited 2014 Nov 8]; Available
from: http://www.thelancet.com/journals/laninf/article/PIIS1473-3099(14)70966-1/abstract
14. Liu Y, Weinberg MS, Ortega LS, Painter JA, Maloney SA. Overseas screening for
tuberculosis in U.S.-bound immigrants and refugees. N Engl J Med. 2009 Jun 4; 360
(23):2406–15.
15. Aldridge RW, Zenner D, White PJ, Muzyamba MC, Loutet M, Dhavan P, et al. Prevalence of
and risk factors for active tuberculosis in migrants screened before entry to the UK: a
population-based cross-sectional study. Lancet Infect Dis [Internet]. 2016 Mar [cited 2016
Apr 27]; Available from: http://linkinghub.elsevier.com/retrieve/pii/S1473309916000724
16. Aldridge RW, Zenner D, White PJ, Muzyamba MC, Loutet M, Dhavan P, Mosca D, Hayward
AC, and Abubakar I (2016). Prevalence of and risk factors for active tuberculosis in migrants
screened before entry to the UK: a population-based cross-sectional study. Lancet Infectious
Disease, 16: 962-70.
17. Public Health England. Collaborative Tuberculosis Strategy for England 2015 to 2020
[Internet]. 2015. Available from: https://www.gov.uk/government/publications/collaborative-
tuberculosis-strategy-for-england. Accessed May 2019.
UK pre-entry tuberculosis screening report 2018
26
Appendices
Case definition
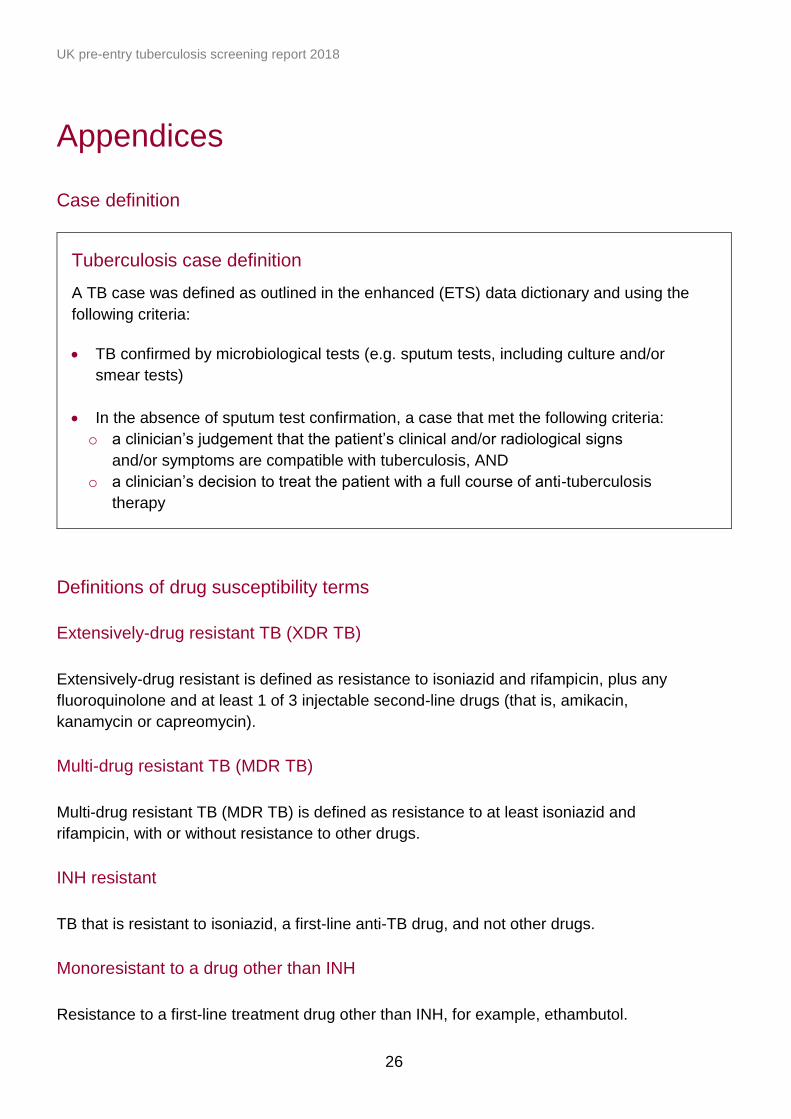
Tuberculosis case definition
A TB case was defined as outlined in the enhanced (ETS) data dictionary and using the
following criteria:
• TB confirmed by microbiological tests (e.g. sputum tests, including culture and/or
smear tests)
• In the absence of sputum test confirmation, a case that met the following criteria:
o a clinician’s judgement that the patient’s clinical and/or radiological signs
and/or symptoms are compatible with tuberculosis, AND
o a clinician’s decision to treat the patient with a full course of anti-tuberculosis
therapy
Definitions of drug susceptibility terms
Extensively-drug resistant TB (XDR TB)
Extensively-drug resistant is defined as resistance to isoniazid and rifampicin, plus any
fluoroquinolone and at least 1 of 3 injectable second-line drugs (that is, amikacin,
kanamycin or capreomycin).
Multi-drug resistant TB (MDR TB)
Multi-drug resistant TB (MDR TB) is defined as resistance to at least isoniazid and
rifampicin, with or without resistance to other drugs.
INH resistant
TB that is resistant to isoniazid, a first-line anti-TB drug, and not other drugs.
Monoresistant to a drug other than INH
Resistance to a first-line treatment drug other than INH, for example, ethambutol.

UK pre-entry tuberculosis screening report 2018
27
Pansusceptible
Susceptible to all first line drugs, for example, isoniazid.
Poly-drug resistant
Poly-drug resistance refers to resistance to 2 or more first-line drugs but not to both
isoniazid and rifampicin.
Rif monoresistance
Resistance to rifampicin, a first-line drug, and not other drugs.
UK pre-entry tuberculosis screening report 2018
28
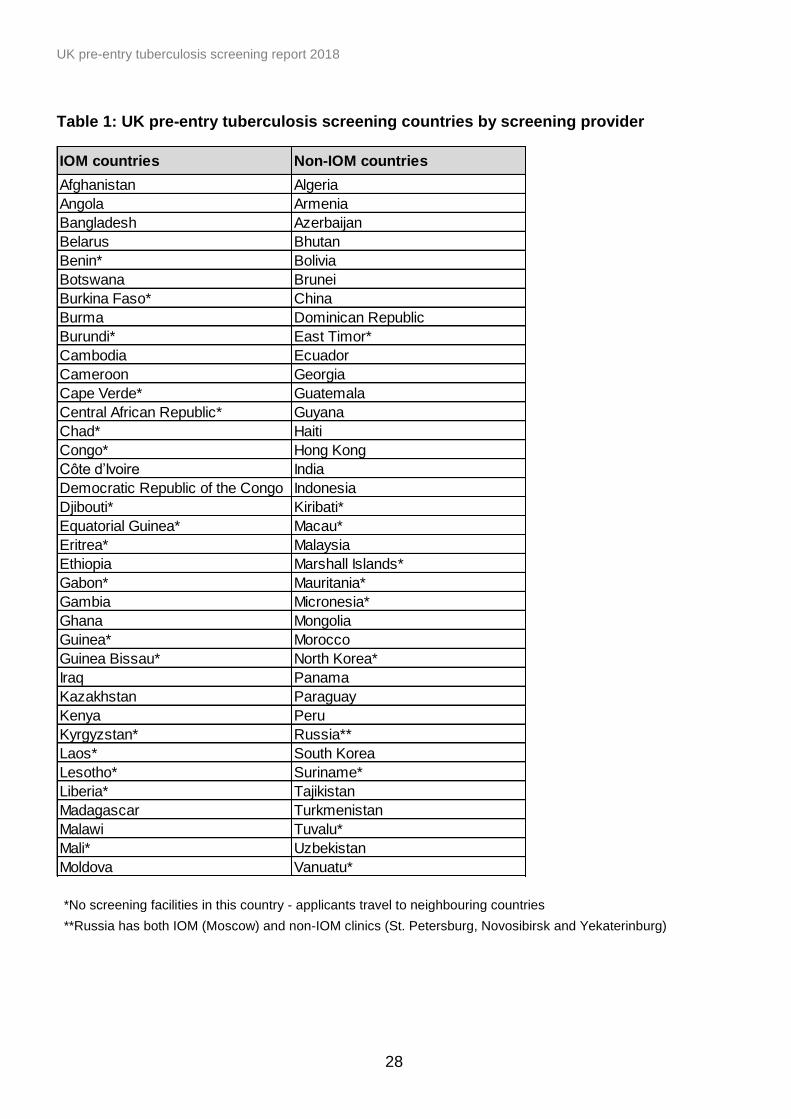
Table 1: UK pre-entry tuberculosis screening countries by screening provider
*No screening facilities in this country - applicants travel to neighbouring countries
**Russia has both IOM (Moscow) and non-IOM clinics (St. Petersburg, Novosibirsk and Yekaterinburg)
IOM countries Non-IOM countries
Afghanistan Algeria
Angola Armenia
Bangladesh Azerbaijan
Belarus Bhutan
Benin* Bolivia
Botswana Brunei
Burkina Faso* China
Burma Dominican Republic
Burundi* East Timor*
Cambodia Ecuador
Cameroon Georgia
Cape Verde* Guatemala
Central African Republic* Guyana
Chad* Haiti
Congo* Hong Kong
Côte d’Ivoire India
Democratic Republic of the Congo Indonesia
Djibouti* Kiribati*
Equatorial Guinea* Macau*
Eritrea* Malaysia
Ethiopia Marshall Islands*
Gabon* Mauritania*
Gambia Micronesia*
Ghana Mongolia
Guinea* Morocco
Guinea Bissau* North Korea*
Iraq Panama
Kazakhstan Paraguay
Kenya Peru
Kyrgyzstan* Russia**
Laos* South Korea
Lesotho* Suriname*
Liberia* Tajikistan
Madagascar Turkmenistan
Malawi Tuvalu*
Mali* Uzbekistan
Moldova Vanuatu*

UK pre-entry tuberculosis screening report 2018
29
Table 1: UK pre-entry tuberculosis screening countries by screening provider (continued)
*No screening facilities in this country - applicants travel to neighbouring countries
**Russia has both IOM (Moscow) and non-IOM clinics (St. Petersburg, Novosibirsk and Yekaterinburg)
IOM countries Non-IOM countries
Mozambique
Namibia
Nepal
Niger
Nigeria
Pakistan
Palau
Papua New Guinea
Philippines
Russia**
Rwanda
São Tomé and Principe*
Senegal
Sierra Leone
Solomon Islands*
Somalia*
South Africa
South Sudan*
Sri Lanka
Sudan
Swaziland*
Tanzania
Thailand
Togo*
Uganda
Ukraine
Vietnam
Zambia
Zimbabwe