uk neqas blood transfusion laboratory practice bi 2015 14-15 btlp.pdf · uk neqas blood transfusion...
TRANSCRIPT

UK NEQAS Blood Transfusion Laboratory Practice
BI-ENNIAL REPORT 2014 - 2015
(August 2016)


UK NEQAS (BTLP) Bi-ennial Report for 2014 and 2015
UK NEQAS Blood Transfusion Laboratory Practice
BI-ENNIAL REPORT
2014 - 2015
UK NEQAS (BTLP) PO Box 133 Watford WD18 0WP
©UK NEQAS (BTLP) 2016
Issued August 2016

UK NEQAS (BTLP) Bi-ennial Report for 2014 and 2015
CONTENTS Page Number
1 INTRODUCTION and SCOPE
1
2 STAFF
1
3 PARTICIPANTS
1 - 2
4 PERFORMANCE SUMMARIES
Exercises distributed 3 General information 4 14R1 5 - 6 14E2 7 14E3 8 14R4 8 - 9 14E5 9 14E6 10 14R7 12 14E8 13 14R9 14 14E10 15 15R1 15 - 6 15E2 17 15E3 17 15R4 18 - 19 15E5 20 15E6 21 15R7 22 - 23 15E8 24 15R9 25 - 26 15E10 27
5 ERROR RATES
28 -29
6 LEARNING POINTS
30 - 31
7 SCHEME DEVELOPMENT AND QUALITY INDICATORS
32 - 34
Accreditation
32
IT &Communications
32
UI submissions
32
ABO titration pilot
32
Point of care for D typing
33
DAT pilot
33
TACT
33
Genotyping pilot
33
KPIs
34

UK NEQAS (BTLP) Bi-ennial Report for 2014 and 2015
8 QUESTIONNAIRES AND NON-SCORING ELEMENTS
35
9 TRENDS IN TECHNIQUES USED IN UK NEQAS EXERCISES
36 - 37
10 INFORMATION/EDUCATION/PUBLICATIONS/PRESENTATIONS
38 - 39
11 REFERENCES
39
12 FINANCIAL STATEMENT
40
13 APPENDICES
41 - 112
1 Steering Committee 41
2 14R1 questionnaire re D typing & IAT crossmatch reagents 42 - 47
3 PowerPoint slide re two analysers 48
4 Emergency issue questionnaire 15R1 49 - 59
5 Supplementary report for 15R4 (mixed field) 60 - 65
6 Summary of UI submissions 66
7 UI ‘Rules’ 67 - 68
8 ABO antibody titration pilot - annual report 2014-15 69 - 76
9 Scoring model for ABO titration scheme 77
10 DAT pilot report 79 - 91
11 Pre-transfusion testing questionnaire 2014 92 - 99
12 Pre-transfusion testing questionnaire 2015 100 - 109
13 Meeting programme 2014 110 - 111
14 Meeting programme 2015 112

UK NEQAS (BTLP) Bi-ennial Report for 2014 and 2015
Page 1 of 112
1. INTRODUCTION AND SCOPE
UK NEQAS (BTLP) is hosted by West Herts Hospitals NHS Trust and is located on the ground floor of the Pathology Block at Watford General Hospital. It shares premises and administrative and logistics staff with UK NEQAS (H). The UK NEQAS Unit is part of pathology within the Clinical Support Directorate, and the legal oversight and working arrangements are described in a Memorandum of Agreement with the Trust. The Scheme is advised by and reports to the BTLP Steering Committee (see Appendix 1 for current membership) and reports unsatisfactory performance to the National Quality Assurance Advisory Panel for Haematology. This report presents data for two calendar years: 2014 and 2015.
2. STAFF
Chair of the Steering Committee – Dr Peter Baker Scheme Director - Dr Megan Rowley Scheme Manager - Mrs Clare Milkins Deputy Scheme Manager - Ms Jenny White Senior EQA Scientist and TACT lead – Ms Claire Whitham EQA Scientist – Mr Arnold Mavurayi Executive Assistant – Ms Isabella De-Rosa Business Manager – Mrs Pinky Bambhra Telephone: +44 (0) 1923 217933 Fax: +44 (0) 1923 217934 Email: [email protected] Website: www.ukneqasbtlp.org
3. PARTICIPANTS
The number of participants registered in all BTLP schemes at December 2015 is shown in table 1. Overseas participation by country is shown in table 2.
Table 1 - Participation December 2015
Scheme UK 1 Non-UK
10 (‘R’ and ‘E’) exercises 381 110
4 ‘R’ exercises 7 196
POCT for D typing 63 0
3 ‘R’ exercises (Turkey) 0 271
ABO titration pilot 43 54
DAT pilot 190 53
TACT – subscriptions (memberships) 91 (1560) 0
1 – includes Republic of Ireland and Channel Islands

UK NEQAS (BTLP) Bi-ennial Report for 2014 and 2015
Page 2 of 112
Table 2 - Overseas Participation in main scheme by Country (including non-clinical)
Country No. Participants No. Participants Country No. Participants
Australia 1 Lebanon 1
Belgium 1 Malawi 1
Chile 1 Malta 3
China 1 Mexico 1
Croatia 2 Netherlands 4
Cyprus 8 New Zealand 1
Denmark 33 Norway 5
Egypt 1 Oman 2
Estonia 2 Poland 1
Falklands 1 Portugal 53
Faroe Islands 1 Romania 1
Finland 4 Saudi Arabia 1
Germany 1 Serbia 2
Gibraltar 1 Singapore 1
Greece 11 Slovenia 1
Greenland 1 South Africa 1
Hong Kong 1 Spain 3
Iceland 1 Sweden 4
Israel 18 Switzerland 3
Italy 108 Sri Lanka 1
Ivory Coast 1 Turkey 275
Kenya 1
Kuwait 13

UK NEQAS (BTLP) Bi-ennial Report for 2014 and 2015
Page 3 of 112
4. PERFORMANCE SUMMARIES
4.1 Table 3 – Summary of ‘E’ and ‘R’ exercises distributed Ex. Code
Distributed
Contents
Main aim
14R1 20 Jan ABO/D, AS, ABID, XM, PH
D typing of a weak D in the context of age and gender; identification of an antibody mixture and detection of a weak anti-Fy
a in the crossmatch; phenotyping for Ss
14E2 17 Feb AS, ABID Identification of weak anti-Jk
a showing dosage and of an
antibody mixture.
14E3 17 March AS, ABID Detection of a weak anti-c and Identification of an antibody mixture.
14R4 22 April ABO/D, AS, ABID, XM, PH
Detection of incompatibility due to ABO and Kidd antibodies; phenotyping for Fy
a/Fy
b; identification of weak anti-Jk
a.
14E5 27 May AS, ABID Identification of antibody mixtures
14E6 16 June AS, ABID
Detection of the NEQAS standard anti-D; identification of an antibody mixture.
14R7 14 July ABO/D, AS, ABID, XM,
PH
Assessment of D typing of D negative (rr) samples with a weakly positive DAT. Detection of anti-Fy
a in the crossmatch;
phenotyping of Jka/Jk
b.
14E8 15 Sept AS, ABID Detection and identification of weak anti-e; identification of anti-S in the presence of an enzyme non-specific antibody.
14R9 13 Oct ABO/D, AS, ABID, XM,
PH Detection of anti-c in the crossmatch. Rh phenotyping.
14E10 17 Nov AS, ABID Identification of common antibody mixtures.
15R1 19 Jan ABO/D, AS, ABID, XM
Interpretation of D typing for an r”r (cdE/cde) patient. Detection of weak anti-Jk
a in the screen and crossmatch. An additional,
non-scoring, emergency element was included and reported separately.
15E2 16 Feb AS, ABID Identification of antibody mixtures.
15E3 16 March AS, ABID Detection and identification of weak antibodies.
15R4 20 April ABO/D, AS, ABID, XM, PH
Detection and interpretation of dual populations for ABO/D; identification of an antibody mixture; detection of incompatibility due to anti-Jk
a.
15E5 18 May AS, ABID Identification of antibody mixtures, including an enzyme ‘non-specific’ in conjunction with a clinically significant antibody.
15E6 22 June AS, ABID Identification of antibody mixtures.
15R7 13 July ABO/D, AS, ABID, XM,
PH Detection and identification of anti-c; detection of ABO incompatibility in the crossmatch.
15E8 14 Sept AS, ABID Identification of antibody mixtures.
15R9 12 Oct ABO/D, AS, ABID, XM,
PH D typing rr DAT positive red cells; identification of an antibody mixture; detection of incompatibility due to anti-Jk
a.
15E10 22 Nov AS, ABID Detection and identification of weak antibodies
AS - Antibody Screen ABID - Antibody Identification XM - Crossmatch PH – Red Cell Phenotyping

UK NEQAS (BTLP) Bi-ennial Report for 2014 and 2015
Page 4 of 112
4.2 General Information Relating to Exercise Summaries and material (4.3 - 4.12)
Data relates to UK clinical laboratories (including Republic of Ireland). Detailed results are not shown for non-UK laboratories as this group is so large and disparate; however, the overall error rates for UK and non-UK are shown in section 5.
Antibody titres quoted are those obtained in the UK NEQAS laboratory on the closing date, by LISS tube IAT, against red cells bearing heterozygous expression of the relevant antigen, unless otherwise stated.
Error rates and return rates reported may include late results, and any amendments made following appeals.
Each ‘patient’ whole blood sample comprises a pool of four or five donations, which may be whole blood or red cells to which ABO compatible FFP and Alsever’s has been added.
Each ‘patient’ plasma sample comprises a pool of ABO compatible plasma donations, some of which contain red cell antibodies.
Each ‘donor’ sample comprises a single red cell donation, diluted in modified Alsever’s solution to a red cell concentration of 7-10%.
Preparation of the plasma pools and ‘donor’ samples is subcontracted to the NHS Blood and Transplant Reagents Unit, although this material may also be prepared or further manipulated within the UK NEQAS Unit.

UK NEQAS (BTLP) Bi-ennial Report for 2014 and 2015
Page 5 of 112
4.3 14R1
Patient 1 – O D weak, inert Donor W – O R1R1, Ss, Fy(a-b+), K- Patient 2 – O D pos, anti-E+Fya (titre 8 and 2 respectively) Donor Y – O r“r, ss, Fy(a-b+), K- Patient 3 – B D neg, inert Donor Z – O rr, SS, Fy(a+b+), K-
Additional information provided:
Basic demographic details were provided for the three patients, to be taken into account when completing the exercise, if relevant: Patient 1: Female, age 30, not transfusion dependent Patient 2: Male, age 35, not transfusion dependent Patient 3: Female, age 67, not transfusion dependent Performance monitoring Patient 1 was intentionally not scored for D typing, as the reaction obtained with a weak D is reagent dependent; donor W was withdrawn from scoring as it was deselected for Patients 1 and 3 by a significant number of participants, although the instructions had requested participants to use the ‘would you transfuse‘ question to indicate that they would not transfuse the units, rather than using the option to deselect the donations. Return rate: 98.8% Results Procedural errors
One laboratory transposed samples for Patient 2 and Patient 3 at the labelling stage but as they were not booked into the LIMS, the usual checking process did not occur.
One false positive D type for Patient 3 was due to transcription error.
Four missed incompatibilities were due to transcription error at data entry.
Two false positive and false negative crossmatches appear to be due to sample or result transposition.
Two laboratories appear to have transposed donors Y and Z when phenotyping. ABO/D
One laboratory reported UI for Patient 3 due to a ‘mixed field’ reaction in the reverse group. The reactions and interpretation for D typing for Patient 1 are shown in table 4.
Table 4: Patient 1 D typing: Reaction grades and interpretations recorded
Interpretation (number)
Combination of reactions recorded with anti-D reagent(s)
Strong pos only1
Weak pos1 (+/- strong
pos)
Strong or weak pos +
neg Neg only1 Includes MF3
D Variant2 (191) 0 169 8 1 13
D Positive (121) 24 93 1 0 3
D UI (66) 0 21 0 0 45
D Negative (16) 0 1 0 13 2
Total (394) 24 284 9 14 63 1With one or two anti-D reagents; 2This response includes weak and partial D; 3 MF = mixed field

UK NEQAS (BTLP) Bi-ennial Report for 2014 and 2015
Page 6 of 112
356/394 (90%) laboratories recorded anomalous D typing reactions for Patient 1, i.e. at least one weak or MF reaction, or one positive and one negative reaction, and 97/356 (27%) reported Patient 1 as D positive. Of these 97 laboratories, only four (6%) of the 65 completing the accompanying questionnaire, stated that they had undertaken testing with a kit to characterise weak and partial D.
A further 13/356 (4%) laboratories made an interpretation of D variant, on the basis of mixed field reactions.
38/394 (10%) laboratories, recorded only strong positive or negative reactions, and apart from one (who made an interpretation of D variant), all made an interpretation that matched the reaction grades. More information relating to reagents used and reaction grades reported can be found in Appendix 2.
Antibody screening: no errors Antibody identification
One laboratory reported anti-E+S due to misinterpretation. Crossmatching (excluding donor W)
One laboratory recorded strong false positive reactions by IAT for all three donors against Patient 1, and a further four made a theoretical deselection.
Table 5 shows whether or not the D positive donation would have been transfused to the young female weak D patient, depending on the interpretation of the D group.
o 196/359 (55%) laboratories reporting a compatible crossmatch for Patient 1 vs. donor W answered ‘Yes’ to the question ‘would you transfuse?’.
o 88/196 (45%) reported Patient 1 as either D negative, D variant (only seven stated that they confirmed with an extended D typing panel) or UI.
Table 5: Results of donor W vs. P1 for the 388 laboratories returning crossmatching results
Interpretation P1 D type (number)
Result for donor W (D positive) vs. Patient 1 (weak D)
Incompatible or Deselected or would not
transfuse
Compatible and would transfuse
D Variant (189) 118 71
D Positive (118) 10 108
D UI (65) 51 14
D Negative (16) 13 3
Total (388) 192 196
Phenotyping (S,s)
There was one false positive (donor Y vs. anti-S). Additional comments
Following BCSH guidelines 1, where anomalous D typing reactions are obtained on a sample from a female patient with child bearing potential, the patient should be reported as D negative until further testing has been undertaken to confirm the D type.
Whilst the D type of a female patient with child bearing potential remains unconfirmed, D negative red cells should be selected for transfusion.
The results suggest that 27-30% of UK laboratories are not complying with the guidelines, putting some young women at risk of sensitisation to the D antigen.

UK NEQAS (BTLP) Bi-ennial Report for 2014 and 2015
Page 7 of 112
14E2
‘Patient’ 1: Inert ‘Patient’ 2: Anti-Jka (titre 1)* ‘Patient’ 3: Inert ‘Patient’ 4: Anti-c+Fya (titre 4 and 8 respectively)
*Not reacting with all Jk(a+b+) cells by all technologies
Return rate: 99.2% Results: Antibody screening: No errors Antibody ID Patient 2 (anti-Jka)
Three laboratories reported an additional antibody not actually present.
Three UI submissions were agreed o 2 were due to non-reactivity with some Jk(a+b+) cells o 1 was due to non-exclusion of an antibody directed against a low frequency antigen.
Antibody ID Patient 4
Three laboratories reported anti-c, but missed the anti-Fya o 2 recorded negative reactions with an Fy(a+) cell o 1 did not realise that anti-Fya was masked.
Three laboratories reported anti-c but misidentified the 2nd antibody (anti-N x2; anti Cw x1).
Twenty UI submissions were made: o 16 were agreed (unable to distinguish between anti-N and anti-Fya x13) o 4 were not agreed as they could have excluded anti-Cw by enzyme, and consequently
identified the anti-Fya. Additional comments The ‘dosage’ phenomenon is not uncommon with antibodies in the Kidd system, making them difficult to identify, especially in a mixture. Reactions are usually enhanced when an enzyme IAT panel is used. Enzyme and room temperature techniques could have been used to distinguish between anti-Fya and anti-N or anti-Cw.

UK NEQAS (BTLP) Bi-ennial Report for 2014 and 2015
Page 8 of 112
14E3
‘Patient’ 1: Anti-c (titre 2) ‘Patient’ 2: Inert ‘Patient’ 3: Inert ‘Patient’ 4: Anti-E+K (titre 4 and 8, respectively)
Return rate: 99.2% Results Antibody screening: No errors Antibody identification Patient 1
One laboratory reported anti-e presumably due to data entry error.
Two reported an additional specificity not actually present (anti-Kpa).
Five made UI submissions involving non-exclusion of anti-Cw, -Kpa, or -Lua, none of which need to be excluded.
Exercise comments Since anti-Cw, anti-Kpa and anti-Lua are rarely of clinical significance, there is no requirement to include a cell positive for these antigens on the screening panel, or to exclude the corresponding antibodies where they are potentially masked in the identification panel.
14R4
‘Patient’ 1: O D neg, anti-Jka (titre 2) Donor W – A D pos, Jk(a-b+), Fy(a+b+) ‘Patient’ 2 O D pos, inert Donor Y – O D neg, Jk(a+b-), Fy(a-b+) ‘Patient’ 3: AB D pos, inert Donor Z – O D neg, Jk(a+b+), Fy(a+b-)
Return rate: 98.5%
Results Procedural errors
One laboratory reported Patient 1 as D positive, apparently due to data entry error (correct reaction grades).
One laboratory reported anti-Fya instead of anti-Jka due to data entry error.
Two missed incompatibilities were apparently due to data entry error (correct reaction grades).
One laboratory missed both Patient 1 incompatibilities due to transcription error when transferring analyser results to a form for web entry.
One laboratory reported two incorrect phenotypes due to testing the samples from 14R1.
One laboratory apparently transposed either samples or results for donor W and donor Z resulting in a false negative and a false positive phenotype.
Antibody identification
Six laboratories reported the presence of anti-K in addition to anti-Jka.
A further nine laboratories made a UI submission because anti-K could not be excluded. All 9 used the identical screening and identification panels, which did not include a Jk(a-) K+ cell.

UK NEQAS (BTLP) Bi-ennial Report for 2014 and 2015
Page 9 of 112
Phenotyping (Fya/Fyb)
Six laboratories recorded three false positive and three false negative reactions.
32 (12%) had no anti-Fya reagent.
41 (15%) had no anti-Fyb reagent. Additional comments
Checks should be in place to reduce the potential for procedural errors when identifying samples for testing, and when transcribing critical test results.
Presumably the six laboratories stating that anti-K was present, were actually unable to exclude it, and could have made UI submissions.
14E5
‘Patient’ 1: Anti-S*+K (titre 1 and 16 respectively) ‘Patient’ 2: Anti-C+D (titre both 16) ‘Patient’ 3: Inert ‘Patient’ 4: Inert
*Not reacting with all Ss cells by all technologies
Return rate: 99.2% Results: Antibody screening: No errors Antibody ID Patient 1 (anti-S+K): Six laboratories reported incorrect or incomplete results:
Two correctly reported one specificity but not the other: anti-K+Fyb and anti-S+D.
Four laboratories identified one of the two specificities but missed the other o 2 reported anti-S only, having excluded anti-K on a false negative reaction by IAT (&
enzyme) o 2 reported anti-K as a single specificity
1 recorded negative reactions with all K-, SS and Ss cells. the other recorded some negative reactions but did note an equivocal reaction with 1 K-
SS cell which they did not investigate any further. Additional comments All positive reactions must be accounted for as part of the antibody identification process. This will cover the possibility of error in the initial identification and prevent unexpected problems in crossmatching and the potential for a haemolytic transfusion reaction.

UK NEQAS (BTLP) Bi-ennial Report for 2014 and 2015
Page 10 of 112
14E6 ‘Patient’ 1: Anti-D (NEQAS Standard) ‘Patient’ 2: Anti-Jka+Fya (titre 4 and 2, respectively) ‘Patient’ 3: Inert ‘Patient’ 4: Inert
Return rate: 98.2% Results Procedural errors
One laboratory reported anti- Jkb+Fya, probably due to data entry error. Antibody screening:
No errors
The proportion of weak and strong reactions for the ‘standard’ anti-D by different technologies was similar to previous exercises and are shown in figure 1 below.
Twelve laboratories used more than one IAT technology for Patient 1, and a further 31 used the same technology more than once, e.g. manual and automated.
Figure 1 – reaction grades by technology for the anti-D standard
Antibody identification Patient 1
Two laboratories reported anti-D+Cw. Antibody identification Patient 2
Three laboratories made errors o 3 UI submissions were not agreed
1 recorded false positive reactions In 2 cases, the 2nd specificity (recorded as unable to exclude) could have been
identified. Additional comments The use of more than one IAT technology or both manual and automated techniques for antibody screening of a straightforward antibody, demonstrates over-testing of the EQA samples by 11% of laboratories. We are aware that several laboratories wish to subject all of their analyers and techniques to EQA, and often cite a CPA/UKAS requirement. However, this does have the potential to negate the purpose of the EQA, when the data is categorical. Discussions with UKAS have confirmed that it is not necessary to subject all blood grouping analysers to EQA; however, other means of assurance will be required, such as IQC. The Scheme has offered some suggestions in the past as to how this may be managed and a copy of a PowerPoint slide shown at the 2014 Participants’ meeting is shown in Appendix 3.

UK NEQAS (BTLP) Bi-ennial Report for 2014 and 2015
Page 11 of 112
14R7
‘Patient’ 1: O D neg, DAT pos, anti-Fya (titre 8) ‘Donor’ W: O D neg, K-, Fy(a+b+), Jk(a+b-) ‘Patient’ 2: B D pos, inert ‘Donor’ Y: O D neg, K-, Fy(a+b-),Jk(a+b+) ‘Patient’ 3: A D neg, DAT pos, anti-K (titre 4) ‘Donor’ Z: O D neg, K-, Fy(a-b+), Jk(a-b+)
Return rate: 99.2% Problems with material There were several problems with the quality of the material:
Whole blood samples for Patients 1 and 2 were simulated with albumin, Alsever’s and reagent anti-A/anti-B as part of the simulated whole blood trial
o the anti-A in the reverse group deteriorated throughout the exercise.
Patients 1 and 3 were DAT positive, but giving only a 2+ reaction at distribution, and deteriorated throughout the exercise.
All three whole blood samples showed signs of significant haemolysis (approximately 14% UK participants recorded unsatisfactory sample quality, for one or more samples, due to haemolysis). This was not unexpected for the DAT positive samples, but was unexpected for Patient 2.
Performance monitoring
UI was accepted for all ABO and D grouping, due to the positive DATs and the deteriorating anti-A in two of the reverse groups.
Results Procedural errors
One laboratory transposed results for Patient 1 and Patient 3 at data entry, resulting in two incorrect ABO groups – the laboratory accession numbers were assigned as 3,2,1, but results entered as 1,2,3.
Three D typing errors occurred at web data entry.
Three laboratories transposed donors W and Z during manual crossmatching.
One crossmatch error appears to have occurred at web data entry.
One laboratory transposed donors W and Z during testing, and another transposed donors Y and Z at some stage of testing or reporting, leading to phenotyping errors.
Antibody screening
One laboratory reported a non-reproducible false negative screen using automation, possibly due to a dispensing problem.
Antibody identification: No errors. Crossmatching
Six laboratories reported 11 false positive results. Phenotyping (Jka, Jkb)
Eight laboratories reported nine false negative and two false positive reactions o 3 reported the rare phenotype Jk(a-b-).
Thirty-one (13%) had no anti-Jka reagent
Thirty-seven (15%) had no anti-Jkb reagent.

UK NEQAS (BTLP) Bi-ennial Report for 2014 and 2015
Page 12 of 112
Additional comments There were no reports of a positive control for D typing by participants, and only 71-75% of those undertaking a DAT reported it as positive. In previous exercises, we have seen false positive D typing results and interpretations where the DAT has been positive. It is good to note that this is not a problem where the DAT is weaker.

UK NEQAS (BTLP) Bi-ennial Report for 2014 and 2015
Page 13 of 112
14E8
‘Patient’ 1: Inert ‘Patient’ 2: Inert ‘Patient’ 3: Anti-e (titre 1) ‘Patient’ 4: Anti-S + ENS 1 (titre 8) 1 Anti-S and anti-S+ENS (enzyme non-specific) were both acceptable results
Problems with material
Patient 1 was retrospectively confirmed to contain a weak (enzyme-IAT only) anti-Wra and was withdrawn from scoring for antibody screening.
Patient 4 also contained a weak anti-Wra, but this was only reported by one non-UK reference centre and did not affect scoring.
Return rate: 98.2% Results: Procedural errors
One laboratory reported anti-c, presumably due to data entry (tickbox) error. Antibody screening: No errors Antibody ID Patient 3 (anti-e):
Two laboratories reported anti-C, based on positive reactions with only the C+ cells o both used an ‘addition’ method in BioVue using NHSBT panel cells (not validated) o neither had access to an enzyme panel.
Nine laboratories reported a second specificity not actually present o anti-K x6; anti-Jka x1; anti-Lea x1; anti-Kpa x1.
Twenty-one laboratories reported anti-e+UI o 19 made UI submissions – 18 were agreed but one could have excluded anti-K on the
screening panel.
One laboratory reported UI, but this was not agreed as anti-e could have been identified. Antibody ID Patient 4 (anti-S+ENS):
Four laboratories reported anti-S plus a second specificity not actually present o 1 each of anti-Jkb, -c, -E, -Cw.
Six laboratories reported anti-S+UI and four were agreed.
The presence of the ENS was recorded by 29%. Additional comments
o All techniques should be validated. The use of non-validated techniques caused two laboratories to miss the presence of anti-e.
o This exercise highlighted the value of including an enzyme panel as part of the antibody identification process.

UK NEQAS (BTLP) Bi-ennial Report for 2014 and 2015
Page 14 of 112
14R9
‘Patient’ 1 - A D pos, anti-c (titre 2) ‘Donor’ W – A D pos, R1R1 ‘Patient’ 2 - AB D pos, inert ‘Donor’ Y – A D pos, R2r
‘Patient’ 3 - B D pos, inert ‘Donor’ Z – A D pos, R1r
Problems with material Donor Z was retrospectively found to have a weak expression of the D antigen, with the serological reactivity weakening during the exercise. The only potential impact was for Rh interpretation during phenotyping as D typing might have been undertaken on the same card/cassette as the rest of the Rh phenotype; however, the scored elements of phenotyping were not affected. Return rate: 99.2% Results: Procedural errors:
There were four apparent data-entry (tickbox) errors for antibody identification o anti-e x3, anti-C x1.
One laboratory ticked EI instead of ‘deselect’ for the three ABO incompatibilities.
One laboratory used the whole blood samples by mistake for crossmatching.
One laboratory reported a series of crossmatching errors which were likely to have been (at least in part) due to crossmatching and reporting results in a 3x3 grid instead of by patient.
Three laboratories transposed two of the donors resulting in incorrect crossmatch results o 2 confirmed this occurred at web data entry o the 3rd concluded that this occurred during testing or recording of results onto the
laboratory worksheet.
One laboratory appears to have transposed donors Y and Z when phenotyping.
Four laboratories recorded incorrect phenotyping reactions but the correct shorthand interpretation, suggesting transcription error.
Antibody screening:
One laboratory reported a non-reproducible false negative antibody screen, using a manual technique. It is possible that they used the whole blood sample in error.
Antibody Identification
Two (unnecessary) UI submissions relating to non-exclusion of antibodies to low frequency antigens were agreed.
One laboratory reported an additional anti-Kpa. Phenotyping (C, c, E, e)
Five laboratories reported six false positive and three false negative reactions, with incorrect shorthand interpretations.

UK NEQAS (BTLP) Bi-ennial Report for 2014 and 2015
Page 15 of 112
14E10
‘Patient’ 1: Anti-K+Fya (titre 16 and 4 respectively) ‘Patient’ 2: Anti-D+E (titre 2 and 4 respectively) ‘Patient’ 3: Inert ‘Patient’ 4: Inert
Return rate: 98.7% Results: Antibody screen: no errors Antibody identification – Patient 2 (anti-D+E)
Three laboratories reported anti-D+C.
Two laboratories reported anti-D+c±E. Additional comments The antibody identification errors could all have been due to ticking the wrong box; however, anti-D+C could have been due to misinterpretation of similar patterns of reaction to anti-D+E. 15R1
Patient 1 – O D neg, r”r, inert Donor W – O D neg, Jk(a-b+), SS Patient 2 – A D pos, anti-Jka (titre 4) Donor Y – O D neg, Jk(a+b+), Ss Patient 3 – B D pos, inert Donor Z – O D neg, Jk(a+b-), ss
In addition to the routine exercise, an additional, non-scoring emergency element was included and reported separately. See Appendix 4 for full report. Return rate: 99.2% Results Procedural errors
One laboratory made a D typing error for Patient 1, probably due to transcription error, as negative reactions were recorded with anti-D reagents.
Two false negatives for Patient 2 were due to data entry error.
Two laboratories transposed donor samples or results during testing or reporting, resulting in crossmatching errors.
Two laboratories recorded a false negative crossmatch due to data entry errors.
Two laboratories appear to have transposed donors Y and Z, resulting in phenotyping errors. ABO/D typing
There were no D typing errors due to misinterpretation of results with anti-CDE reagents o 2015 questionnaire data (annual practice questionnaire – Appendix 12) showed that 7% use
an anti-CDE reagent.
UK NEQAS (BTLP) Bi-ennial Report for 2014 and 2015
Page 16 of 112
Antibody screening
One laboratory reported a false positive interpretation for Patient 3, based on a weak positive reaction by IAT.
Antibody Identification
All identified anti-Jka.
Three recorded the presence of antibodies not present (-Lua, -Cw, enzyme non-specific).
One unnecessary UI submission was agreed, due to non-exclusion of an antibody to a low frequency antigen.
Crossmatching
Twenty-seven laboratories missed the incompatibility for Patient 2 o 3 vs. donor Z (homozygous expression of Jka) o 24 vs. donor Y (heterozygous expression of Jka)
22 used BioVue (22% of BioVue users) 2 used DiaMed (1% of DiaMed users) This did not appear to be influenced by automated or manual testing A 1+ reaction was recorded with in-house BioVue testing on the closing date.
One laboratory recorded false positive results for Patient 1 vs. all 3 donors, based on positive reactions by DRT.
Four laboratories each missed a single compatibility o 2 due to de-selection o 2 recorded weak positive reactions by IAT.
Phenotyping (S, s)
Four laboratories recorded three false negative and two false positive reactions
26/273 (9.5%) did not have any anti-S reagent.
41/273 (15.0%) did not have any anti-s reagent. Additional comments It is good to note that there have been no false positive D types reported in two consecutive exercises where an r’ or r” red cell has been included (last one in 2011), despite 7% of laboratories continuing to routinely use an anti-CDE reagent. There was a significant difference in detection rate of the anti-Jka against the heterozygous Jk(a+b+) cell by IAT technology, with 22% of BioVue users reporting a false negative compared with 1% of DiaMed users. In-house testing gave a 1+ reaction using manual BioVue with a 0.8% diluent.

UK NEQAS (BTLP) Bi-ennial Report for 2014 and 2015
Page 17 of 112
15E2
‘Patient’ 1: Inert ‘Patient’ 2: Anti-E+Fya (titre 4 and 2, respectively) ‘Patient’ 3: Anti-E+Jka (titre 8 and 4, respectively) ‘Patient’ 4: Inert
Return rate: 99.0% Results: Procedural errors:
One laboratory reported a false negative antibody screen for Patient 3 due to data entry error.
One laboratory recorded anti-E+Fyb for Patient 2, due to data entry error. Antibody identification Patient 3
Four laboratories reported anti-E but did not record the presence or potential presence of anti-Jka o all misidentified the 2nd antibody as anti-M o all used an enzyme panel o at least one overlooked a positive reaction in the screening panel with a Jk(a+), E-, M- cell. o at least one was using a panel where all of the Jk(a+) cells were also M+ and/or E+.
Additional comments This particular example of the UK NEQAS anti-Jka does not react by DiaMed with enzyme treated cells. Although Kidd antigens are resistant to enzyme treatment, the report advised that Kidd antibodies should always be excluded by IAT or enzyme IAT as the sensitivity of 2-stage enzyme panels can be variable. We also noted that anti-M could have been excluded by using a panel at room temperature. 15E3
‘Patient’ 1: Inert ‘Patient’ 2: Anti-c (titre 1) ‘Patient’ 3: Anti-c (titre 1) ‘Patient’ 4: Anti-K (titre 4)
Return rate: 98.7% Results Antibody screening:
One laboratory made a false negative interpretation for Patient 4, due to transcription error from the automation to an EQA worksheet.
Antibody identification: anti-c
Two laboratories recorded anti-c+Kpa – one for both Patient 2 and 3 and the other just for Patient 3.
Three unnecessary UI submissions were agreed, relating to non-exclusion of anti-Kpa.

UK NEQAS (BTLP) Bi-ennial Report for 2014 and 2015
Page 18 of 112
15R4
‘Patient’ 1: A D pos/O D pos (25:75), inert Donor W – O D neg, Jk(a+b-), Fy(a+b-) ‘Patient’ 2: B D pos/B D neg (25:75), inert Donor Y – O D neg, Jk(a+b+), Fy(a-b+) ‘Patient’ 3: A D neg, anti-D+Jka (titre 16 and 4 respectively) Donor Z – O D neg, Jk(a+b+), Fy(a-b+)
Return rate: 98.2% Expected results and performance monitoring UI was the expected interpretation for ABO/D for Patient 1 and Patient 2 respectively, as the only details given were to assume that the patients had been recently transfused (to explain why no phenotypes were provided). However, these tests were not subject to penalty scoring. Results Procedural errors
One laboratory recorded a false negative antibody screen for Patient 3. They performed an automated group and screen on the whole blood sample and a separate screen on the plasma sample, but transcribed the screen result from the whole blood printout instead of the plasma printout onto the website.
One laboratory recorded incorrect phenotyping results for all 3 donors. Investigation showed that they probably used the anti-Fya reagent twice as they were distracted and interrupted during testing.
ABO/D typing Significant differences were once again seen between detection and interpretation of the mixed field reactions between laboratories and by different technologies. 30% of those reporting MF for the A/O made an interpretation of group A, and 14% of those recording a MF for D pos/D neg made an interpretation of D positive or D variant. A full report can be found in Appendix 5. Antibody screening
One laboratory, using Capture, reported a false positive for Patient 2. Antibody Identification (anti-D+Jka)
Eleven laboratories made incorrect or incomplete submissions o 5 recorded anti-D but misidentified the 2nd specificity
4 reported anti-Fya instead of anti-Jka
3 overlooked positive reactions with D negative enzyme treated cells 1 reported anti-N instead of anti-Jka; all the D negative cells were N+ and Jk(a+) and
they excluded anti- Jka on negative reactions using an in-house enzyme technique. o 2 recorded anti-D as present, with anti-Jka plus other specificities as not excluded, but did
not make UI submissions. A 3rd was in the same situation but recorded anti-E instead of anti-D, probably due to data entry error.
o 1 recorded anti-D+UI due to several false positive reactions with D negative, Jk(a-) cells. o 1 recorded anti-C+Jka, having overlooked a positive reaction with an R2R2, Jk(a-) screening
cell. o 1 reported anti-Jka only, having overlooked positive reactions with D positive, Jk(a-) panel
cells.

UK NEQAS (BTLP) Bi-ennial Report for 2014 and 2015
Page 19 of 112
Crossmatching
Five laboratories missed the incompatibility between the anti-Jka and donor Y, including the one recording a negative result in the screen (DiaMed). The other four were using BioVue and the two that were contacted said they were using the addition method.
Two laboratories recorded weak false positive reactions.
Phenotyping (Fya, Fyb)
Two laboratories recorded one or more results of Fy(a-b-), one for donor W and the other for donors Y and Z. The former returned the donor sample and we confirmed it to be typing as Fy(a-b-). Microbiological testing did not reveal any bacterial contamination and the DAT was negative; the cause has not been ascertained.
Additional comments The four laboratories that misidentified the anti-Jka as anti-Fya were using BioVue and three of these also missed the anti-Jka in the crossmatch against donor Y.

UK NEQAS (BTLP) Bi-ennial Report for 2014 and 2015
Page 20 of 112
15E5
‘Patient’ 1: Anti-Fya (titre 8) + enzyme non-specific (ENS) ‘Patient’ 2: Anti-E+Cw (titre 4 and 2 respectively) ‘Patient’ 3: Inert ‘Patient’ 4: Inert
Return rate: 98.7%
Performance monitoring The anti-Cw was not detectable using Capture R; however, since the BCSH guidelines1 class this specificity as unlikely to be of clinical significance, the decision was taken to go ahead and distribute it, but withdraw it from scoring. Anti-Fya, with or without the ENS, were both accepted as correct responses for Patient 1. Results: Antibody screening: No errors. Antibody identification Patient 1
The enzyme non-specific was reported by 29% of participants.
Twenty-two laboratories recorded anti-Fya plus a second specificity not actually present o 12 anti-Lua o 9 anti-Kpa o 1 anti-Cw.
One laboratory made a UI submission that was agreed.
At least one laboratory phoned to say that they only had one positive reaction in the enzyme panel, and this happened to be Lu(a+).
Additional comments A much higher number of laboratories than usual cited the presence of antibodies to low frequency antigens that were not actually present. Telephone conversations with some of them made it clear that the enzyme non-specific reactions were variable, and in some cases positive reactions in an enzyme panel coincided with a specific antigen.
Anti-Lua, anti-Kpa and anti-Cw are unlikely to be of clinical significance and there is no requirement to exclude these specificities where they are potentially ‘masked’ in clinical or EQA samples, providing that all IAT reactions obtained are accounted for by specificities already identified.
Enzyme non-specific antibodies are commonly seen in clinical practice, generally demonstrating variable panreactivity. However, sometimes only one cell will be positive (or give a stronger reaction than the other cells) and this may coincidentally be positive for a specific low frequency antigen, but as long as all clinically significant antibodies have been excluded, there is no need to investigate further.

UK NEQAS (BTLP) Bi-ennial Report for 2014 and 2015
Page 21 of 112
15E6 ‘Patient’ 1: Inert ‘Patient’ 2: Anti-E+K (titre 1 and 4) ‘Patient’ 3: Anti-D+Fya (titre 2 and 4) ‘Patient’ 4: Inert
Return rate: 99.5% Results Procedural errors
One laboratory recorded anti-E+k for Patient 2, presumably due to data entry error. Antibody screening: No errors Exercise Comments
Use of an enzyme panel
295/352 (83.8%) laboratories included an enzyme panel for both samples.
A further 2 laboratories included an enzyme panel for Patient 2 but not Patient 3.
A further 24 laboratories included and enzyme panel for Patient 3, but not Patient 2 (90.6% in total).
Referral for confirmation
125/348 (35.9%) indicated that they would have referred both samples for confirmation.
A further 2 would have referred Patient 2 but not Patient 3.
A further 27 (7.8%) would have referred Patient 3 but not Patient 2.

UK NEQAS (BTLP) Bi-ennial Report for 2014 and 2015
Page 22 of 112
15R7
‘Patient’ 1: A D positive, anti-c (titre 2) ‘Donor’ W: A D neg (rr), Jk(a+b+) ‘Patient’ 2: AB D negative, inert ‘Donor’ Y: A D neg (rr), Jk(a+b+) ‘Patient’ 3: B D positive inert ‘Donor’ Z: A D neg (rr), Jk(a-b+)
Return rate: 99.5% Problems with material Donor Z was bacterially infected, and samples left on the bench became grossly haemolysed. Crossmatching and phenotyping involving Donor Z was therefore withdrawn from scoring. The contamination was probably due to an infected batch of Alsever’s. Results Procedural errors
One laboratory transposed samples for Patient 2 and Patient 3 whilst applying accession numbers, and reported the ABO/D results out of sequence. No check was included later in the process.
One laboratory reported a false positive D type due to transcription error.
One laboratory used the whole blood sample for crossmatching in error.
Another missed all the ABO incompatibilities due to transcription error whilst transferring results from the analyser printout to the website.
Antibody screening
One laboratory recorded a false positive screen for Patient 3. Antibody identification
All laboratories identified anti-c, but two reported an additional anti-Kpa, not actually present. Crossmatching
Another missed all the incompatibilities using a manual serological crossmatch – this was not repeatable and the cause was not established, although it is possible that the whole blood samples were used by mistake.
Five reported donor W (probably subgroup A2) as compatible with Patient 3 (group B) o 3, using manual DiaMed, obtained a positive reaction on repeat o 2, using automated Capture, still recorded a negative reaction on repeat.
41% performed a serological crossmatch and 59% opted for theoretical deselection of the ABO incompatible donors.
Phenotyping (Jka, Jkb)
Eight laboratories recorded 11 false negative reactions o 1 used reagent cards that had been withdrawn from clinical use following a product recall.
44/267 (16%) had no anti-Jka reagent
51(19%) had no anti-Jkb reagent.

UK NEQAS (BTLP) Bi-ennial Report for 2014 and 2015
Page 23 of 112
Additional comments The following sentence was agreed with Immucor for inclusion in the report discussion: “Capture technology is designed to detect IgG rather than IgM antibodies, and in the rare situation where a serological crossmatch is used without IT support to prevent ABO incompatibility, a crossmatch by direct agglutination at room temperature should be included.” It’s likely that the anti-A in the group B plasma was mostly IgM and combined with the low antigen site density on Donor W cells (probably A2), caused the false negative reaction. However, there must have been some IgG present, as strong reactions were recorded by the same laboratories against donors Y and Z. The other technologies would have detected the IgM in addition to the IgG element.
UK NEQAS (BTLP) Bi-ennial Report for 2014 and 2015
Page 24 of 112
15E8
‘Patient’ 1: Inert ‘Patient’ 2: Inert ‘Patient’ 3: Anti-c+K (titre 4 and 2 respectively) ‘Patient’ 4: Anti-c+M (titre 2 and 8 respectively)
Return rate: 98.4% Results: Procedural errors
One participant recorded a false positive antibody screen, presumably due to data entry error, as they recorded a negative reaction by IAT.
Three laboratories reported the presence of anti-e+/-C+M, presumably due to data entry error. Antibody screening: no further errors Antibody ID Patient 3 (anti-c+K):
Five laboratories made errors: o 4 reported anti-c+/-E as a single confirmed specificity.
1 overlooked a c-, K+ cell on the screening panel, did not have any K+, c- cells on the antibody identification panel, and did not record that anti-K could not be excluded
2 recorded anti-K as not excluded but did not make UI submissions 1 made a UI submission, which was not agreed.
o 1 laboratory reported anti-c+Fyb on the basis of a positive reaction in IAT with a single c+, Fy(b+) cell (also K+), having excluded anti-K because of a negative reaction in the enzyme panel.
A further 4 made anti-c+UI submissions that were agreed. Antibody ID Patient 4 (anti-c+M):
Five laboratories made errors: o 3 reported anti-c+/-E as a single confirmed specificity.
2 recorded anti-M as not excluded but did not make UI submissions, 1 made a UI submission which was not agreed.
o 1 reported anti-c+/-E, but misidentified the second specificity as anti-Fya o 1 was unable to positively identify either of the antibodies present, but recorded both anti-
c and anti-M amongst the specificities not excluded, without making a UI submission.
A further 5 made anti-c+UI submissions that were agreed.
Additional comments It is advisable to ensure that anti-K has been excluded by IAT, as its activity by enzyme can be variable. Anti-M can be included/excluded by using a room temperature panel by direct agglutination.
UK NEQAS (BTLP) Bi-ennial Report for 2014 and 2015
Page 25 of 112
15R9
‘Patient’ 1 - O D pos, inert ‘Donor’ W – O D neg (rr), Jk(a+b+), SS ‘Patient’ 2 - A D neg, DAT pos, anti-E+Jka (titre 4 & 2) ‘Donor’ Y – O D neg (rr), Jk(a+b-), Ss
‘Patient’ 3 - B D pos, inert ‘Donor’ Z – O D neg (rr), Jk(a+b+), Ss
Problems with material A strong anti-K was used to coat Patient 2 cells. However, the resulting DAT was not strong enough to cause a positive reaction with the negative control or anti-D reagents. Return rate: 99.2% Results: Procedural/transcription/data entry errors
One laboratory transposed the whole blood samples for Patient 2 and Patient 3 whilst applying accession numbers, and reported the ABO/D results out of sequence. A set of reserved numbers was used for EQA samples so the usual process was not followed.
One laboratory reported a false positive D type due to transcription error at data entry.
One laboratory recorded the presence of anti-c±E+Jka, due to a probable data entry error.
One laboratory reported all 3 donors as compatible with Patient 2, due to a data entry error, and 2 others missed a single incompatibility due to data entry error.
Two laboratories transposed donors W and Y at some stage during phenotyping. ABO/D typing
One laboratory did not interpret the ABO group for Patient 2 due to an anomalous reaction in the reverse group.
Antibody screening
One laboratory recorded a false positive screen for Patient 3. Antibody Identification
One laboratory identified anti-E, but misidentified the 2nd antibody as anti-s, with no mention of anti-Jka.
One laboratory said they could not exclude the anti-E, but did not make a UI submission. Crossmatching
Thirteen laboratories missed one or both of the incompatibilities against the Jk(a+b+) cells o 1/215 (0.5%) of those using DiaMed, o 12/79 (15%) of those using BioVue
6 used BLISS 6 used 0.8% diluent
o 3 missed both o 10 missed donor Z only.
Six repeated the crossmatch, and 5 of these detected the incompatibility on repeat.
Seven laboratories reported 13 missed compatibilities.

UK NEQAS (BTLP) Bi-ennial Report for 2014 and 2015
Page 26 of 112
Phenotyping
One laboratory recorded one false negative reaction against anti-s.
55/267 (21%) did not have any anti-S and 70 (26%) did not have any anti-s. Additional comments The majority of missed incompatibilities were made by BioVue users, but the numbers were too low to demonstrate any link with diluent used.

UK NEQAS (BTLP) Bi-ennial Report for 2014 and 2015
Page 27 of 112
15E10
‘Patient’ 1: Anti-E (titre 2) ‘Patient’ 2: Inert ‘Patient’ 3: Inert ‘Patient’ 4: Anti-Fya (titre 1)
Return rate: 98.7% Results: Antibody screen:
Four laboratories, all using Capture technology, reported a false positive antibody screen for Patient 2 (inert).
Antibody identification
Three laboratories made errors: o 1 laboratory reported an additional anti-Lua in both samples o a second reported an additional enzyme non-specific antibody in Patient 4 o a third reported an additional unidentified antibody in Patient 4.
Additional comments The Scheme received several calls during the course of the exercise regarding non-specific antibodies in Capture, and participants were guided to report, as far as possible, in the same way as they would a clinical sample. However, the two options for antibody screening (‘Antibody present’ and ‘None detected’) do not necessarily match clinical reporting options. The following statements were made in the report:
“Non-specific reactions by IAT can make it difficult to identify or exclude clinically significant antibodies, and have the potential to delay transfusion, which is why there is a penalty for a ‘false positive’ screening interpretation.
We are always happy to discuss participants’ queries, and received several calls during the course of this exercise regarding Capture ‘non-specific’ reactions with one or more of the plasma samples, where no red cell antibody was detected using an alternative ‘back-up’ IAT technology. It is difficult to offer advice on how to report these reactions, other than to suggest that clinical practice is reflected as far as possible, although we appreciate that the current options for EQA antibody screening interpretation (‘antibody present’ or ‘none detected’) may not match every laboratory’s reporting options for clinical samples.
Following the same in-house investigations that would be undertaken with a similar clinical sample, if the conclusion is that the positive reactions do not represent a specific red cell antibody, then it would be appropriate to select an interpretation of ‘none detected’. Participants can indicate that positive reactions have been obtained by recording these in the antibody reaction grades section, but can still make an antibody screening interpretation of ‘none detected’. Any further relevant information can be sent by email via the link on the data entry page. However, if the report to the clinicians would be that the patient has a red cell antibody, then the response ‘antibody present’ would be appropriate.”
Since the period covered by this report, the wording of the interpretation option has been changed from ‘none detected’ to ‘no significant antibody detected’.

UK NEQAS (BTLP) Bi-ennial Report for 2014 and 2015
Page 28 of 112
5. SUMMARY OF ERROR RATES
The error rate is based on the number of opportunities for error by all participants returning results. Figures shown in brackets following the error rate for UK laboratories are the percentages known to be due to transcription or transposition errors (Tx). This information is not available for non-UK laboratories, as these participants are not contacted regarding errors made. Error rates of <0.5% are reported to two decimal places and ≥0.5% to one decimal place. Tables 6 and 7 compare error rates over the last four years for UK and non-UK participants respectively, where n = the number of tests distributed in each category that were suitable for scoring.
Table 6 – Error Rates by Test
Test
2015 2014 2013 2012
n error rate % (Tx)
n error rate % (Tx)
n error rate % (Tx)
n error rate % (Tx)
ABO 10 0.10 (100%) 12 0.11 (80%) 11 0.11 (40%) 12 0.17 (88%)
D 10 0.18 (100%) 11 0.16 (100%) 11 0.14 (50%) 12 0.17 (88%)
False Neg Ab Screen
17 0.08 (100%) 17 0.03 (0%) 16 0.02 (100%) 17 0.07 (80%)
False Pos Ab Screen
19 0.13 (11%) 19 0.00 (0%) 19 0.04 (100%) 19 0.05 (75%)
ABID (single) 8 1.2 (0%) 9 1.3 (15%) 6 1.5 (34%) 8 0.50 (27%)
ABID (dual) 8 1.2 (9%) 8 0.9 (4%) 9 0.9% (7%) 9 1.8 (25%)
Missed Incompatibility
12 1.6 (17%) 13 0.48 (88%) 10 0.5 (24%) 13 0.35 (78%)
Missed Compatibility
21 0.34 (7%) 20 0.40 (29%) 11 0.05 (50%) 20 0.48 (18%)
False Pos Phenotyping
6 0.5 (57%) 10 1.0 (46%) 5 0.5 (83%) 10 1.2 (24%)
False Neg Phenotyping
16 0.6 (17%) 20 0.5 (42%) 7 0.8 (38%) 20 0.5 (44%)

UK NEQAS (BTLP) Bi-ennial Report for 2014 and 2015
Page 29 of 112
Table 7 - Non-UK error rates
Test 2015 2014 2013 2012
n error rate % n error rate % n error rate % n error rate %
ABO 10 0.28 12 0.49 11 0.7 12 0.8
D 10 0.5 11 0.7 11 0.7 12 0.7
False Neg Ab Screen
17 0.41 17 1.4 16 1.2 17 0.34
False Pos Ab Screen
19 0.12 19 0.6 19 0.32 19 0.42
ABID (single) 8 2.5 9 2.3 6 3.8 8 2.0
ABID (dual) 8 8.1 8 5.0 9 3.5 9 7.4
Missed Incompatibility
12 4.5 13 3.3 10 4.2 13 1.6
Missed Compatibility
21 0.44 20 1.6 11 0.5 20 1.1
False Pos Phenotyping
6 1.9 10 0.8 5 0.9 10 1.2
False Neg Phenotyping
16 0.8 20 1.0 7 0.6 20 0.8

UK NEQAS (BTLP) Bi-ennial Report for 2014 and 2015
Page 30 of 112
6. LEARNING POINTS FROM EXERCISE RESULTS
Table 8 – Learning points Issue Exercise(s) Learning point
ABO/D Grouping
Making ABO/D interpretations based on mixed field reactions
15R4 A mixed field ABO group (or D group) could be due transfusion of non-identical but compatible red cells, but also stem cell engraftment or failure following allogeneic stem cell transplant. In rare circumstances it could also indicate the first sign of an ABO incompatible (but clinically uneventful) transfusion. A mixed field D typing reaction might be due to a D negative patient being transfused D positive blood. No interpretation should be made until the cause of the anomaly can be confirmed.
Interpretation of D type based on a weak reaction with an anti-D reagent.
14R1 (young female patient)
An interpretation of D positive should not be made on the basis of a weak positive reaction where no patient details are provided. BCSH guidelines recommend further investigation, with an interim interpretation of D negative, for female patients of child bearing potential or any patient likely to require regular transfusion.
Antibody Identification
Recognition that an additional specificity may be masked in an antibody mixture
14E2,15E2 When interpreting antibody identification results it is vital that the presence of additional clinically significant antibodies is systematically excluded, and that all positive reactions are accounted for before a final interpretation is made.
Use of screening panel results and phenotype when interpreting ID results
15E2, 15R4 When interpreting antibody identification results all available information should be taken into account, including patient phenotype, differential reaction by technique, and results of all cells tested (including the screening panel).
Positive reactions not accounted for by the specificity already identified.
14E5 Where reactions in the screen and/or panel cannot be attributed to the antibody(ies) already positively identified, it is essential to investigate the potential presence of other antibodies (regardless of clinical significance), in order to safely complete the antibody identification process. Accounting for all reactions will cover the possibility of error in the initial identification, ensure that all clinically significant antibodies are identified, and prevent unexpected problems in crossmatching should the patient require transfusion.
Inclusion of additional techniques
14E2, 14E8, 15E2, 15E8
An enzyme technique can be an invaluable part of the antibody identification process, particularly where there is a mixture of antibodies or where weak Rh or Kidd antibodies require confirmation or need to be excluded. Kidd antibodies are often weak, show dosage and are difficult to identify – they are often significantly enhanced by using an IAT with enzyme treated cells. Room temperature techniques can be used to include and exclude IgM antibodies such as anti-N and anti-M, and can assist in elucidation of antibody mixtures, where antigens to these antibodies obscure the IAT picture.
Positively identifying antibodies not actually present
14R4, 14E8, 15E8; 15E5
The specificity of an antibody should only be assigned when it is reactive with at least two examples of reagent red cells carrying the antigen and non-reactive with at least two examples of reagent red cells lacking the antigen. This rule applies independently to each antibody specificity potentially present in an antibody mixture, including those considered of unlikely clinical significance.
Antibodies of low 14E2, 14E3, Once all reactions in the identification and screening panel have been
UK NEQAS (BTLP) Bi-ennial Report for 2014 and 2015
Page 31 of 112
clinical significance and to low frequency antigens
14E6, 14E8, 14R9, 15R1, 15E3, 15E5, 15R7, 15E10
accounted for by the presence of antibodies already identified, there is no need to exclude antibodies of low clinical significance or those directed against low frequency antigens.
Procedure for recording and interpreting ID results
14E10 Interpretation and documentation of antibody identification results is an error-prone manual process, and this should be considered when establishing procedures for reporting antibody identification for both clinical and EQA samples.
Phenotyping, crossmatching and general areas
Rare phenotypes 14R7, 15R4 Where particularly rare phenotypes are found, tests should be repeated and controls checks for validity.
Red cell issue 14R1 D positive red cell components should not be transfused to young female patients or those who are likely to be transfusion dependent until any weak reactions with anti-D reagents have been investigated and confirmed as weak D types 1, 2 or 3. (REF 1 & 2).
Using an appropriate serological crossmatch
15R7 Where a serological crossmatch is undertaken without the IT support required to prevent ABO incompatibility, the serological crossmatch must be able to detect ABO incompatibility. E.g., Capture technology is designed to detect IgG antibodies only, and cannot be relied upon to detect all ABO incompatibilities. In these circumstances, a crossmatch by direct agglutination at room temperature should be included.
Use of validated techniques
14E8 All techniques should be validated. Use of a non-validated technique caused two laboratories to miss some reactions, resulting in incorrect identification of an antibody.
Appropriate use of EQA material
14E6 Analysis of results for this exercise, demonstrated that 11% of participants ‘overtested’ the EQA sample, by using more than one technology or both manual and automated techniques for a straightforward antibody screen. This is not in keeping with the JWG ‘Conditions of Participation in EQA’ and compromises the EQA data.

UK NEQAS (BTLP) Bi-ennial Report for 2014 and 2015
Page 32 of 112
7. SCHEME DEVELOPMENT AND QUALITY INDICATORS
7.1 Accreditation The Centre underwent a successful UKAS inspection in June 2015 against ISO 17043 standards. As a result of making a single application from the Schemes based at Watford General Hospital, a single ‘trading name’ and logo was required to be used in conjunction with the UKAS accreditation symbol. The Centre is now accredited under the name: West Herts Hospitals NHS Trust, operating UK NEQAS Haematology and Transfusion. 7.2 IT and communications
100% of participants were registered for web based reporting from 2014.
A new information website was launched in 2015. It provides easy navigation and access to content, and will evolve into both an important new communication avenue for the schemes, and a useful tool for the participants. During 2016, we are planning to develop it further, to include:
o A dedicated feedback page for general feedback, criticisms, suggestions or features that participants would like to see implemented.
o A secure area for Steering Committee and SAG communications. o Facility for participants to be able to make amendments to their own registration, and to
add new tests (e.g. red cell phenotyping) but not remove them or de-register altogether. o Facility for participants to print certificates of registration and annual summaries of
performance.
7.3 UI Submissions A total 87 UI submissions were received during this two year review period, 86 from the UK (including Ireland) and one from outside of the UK. On review of the panel sheets and explanations, the Scheme agreed with 72 submissions (83%) and disagreed with 15 (17%). Appendix 6 lists all the UI submissions, and provides further details on the 15 where there was no agreement; the current version of the ‘Rules’ are in Appendix 7. The largest category for non-agreement was where a second antibody could have been excluded, in accordance with BCSH guidelines. 7.4 ABO titration Pilot The ABO titration pilot scheme has been in progress since 2010. Participation increased by a further 7%, from 91 to 97 participants during 2015. All plasma samples were sent undiluted and covered a range of titration values, including duplicates (prepared from a single pool in a single exercise) and replicates (same pool used over more than one exercise). The results show a wide variation in practice, and a wide range of results within all techniques, including the standard technique. The 2014/15 annual report is shown in Appendix 8. The Scheme has been working with the NHSBT Living Donor Kidney Transplantation Strategy Group to look at ways to standardise results between transplant centres. Comparability of ABO titration results across transplant centres has the potential to:
Improve equity of access of patients to ABO incompatible transplant programmes.
Make protocols for antibody reduction treatments (therapeutic plasma exchange or immunoadsorption) and cut-off titres for suitability for transplant transferrable.
Facilitate meaningful comparison of ABO titre vs. outcome of ABOi renal transplant. The Scheme worked with NIBSC to develop a reference preparation for high titre anti-A and anti-B, and following extensive validation, this was accepted as an international reference preparation by WHO towards the end of 2015, and is now available for purchase from NIBSC. A paper has been submitted to Vox Sanguinis and has now been published 3.

UK NEQAS (BTLP) Bi-ennial Report for 2014 and 2015
Page 33 of 112
Shadow scoring was undertaken in 2015 and a scoring proposal has been agreed by the SAG, Steering Committee and NQAAP, for implementation as soon as the IT is in place to support it. The scoring proposal is detailed in Appendix 9. 7.5 Point of care D typing The Scheme has continued its collaboration with one of the organisations providing a service for termination of pregnancy, where women are given prophylactic anti-D based on results from a commercial tile-based D typing kit at the client’s side in the clinic. Testing and recording of results is all manual, and venous samples are taken if equivocal results are obtained, and referred to a hospital laboratory for confirmatory testing. 7.6 DAT Pilot Two pilot exercises for the Direct Antiglobulin Test (DAT) were distributed in 2015, with over 200 participants from the UK, Eire, Denmark, Italy and Portugal. The data demonstrated material stability for at least a week, with 2+ IgG coated cells. An application for pilot scheme approval was submitted to the UK NEQAS Office and approval received in June 2015. The report to participants is reproduced in Appendix 10. 7.7 On-line competency assessment scheme The Training, Assessment and Competency Tool (TACT) was launched in November 2014 as a ‘minimum viable product’ (MVP). There was significant development in 2015, with key new features being the enzyme panel, and improved staff record management in the form of the dashboard drill-down and the ability to alter the outcome indicator according to local practice and policy. The continuing aim of this system is to provide laboratory staff and managers with an interactive knowledge-based training and competency assessment tool, not solely focussed on the practical applications of training, but on the theoretical knowledge of all Biomedical Scientists working in blood transfusion laboratories. There is a schedule for enhancements to be made to the current scenario in 2016, including a greater variety of antibody specificities and mixtures, crossmatching, phenotyping, patient history, facility to deal with the 2nd sample rule and interpretation of anomalous ABO and D typing results by patient type. There will also be an indicator on the dashboard to guide managers to which scenarios contained anomalies and so may require closer review. 7.8 Pilot Scheme for red cell genotyping Following 2 pre-pilot exercises undertaken in 2014/15 in collaboration with the ISBT, a proposal for a full UK NEQAS pilot scheme for red cell genotyping was approved by the Steering Committee in November 2015. This will be progressed to a full pilot scheme in 2016.

UK NEQAS (BTLP) Bi-ennial Report for 2014 and 2015
Page 34 of 112
7.11 Key Performance Indicators Targets and achievement rates for key performance indicators are shown in table 9.
Table 9 – Combined Key Performance Indicators for 2014 and 2015
Category No. of Events
Target Target
Achievement Rate
Actual Achievement
Rate
Exercise Distributions 20 On schedule 100% 100%
Report Distributions 20 Within 6&8 days of C/D 1
(E&R exercises respectively)
90% 90%
Complaints 36 Acknowledged within
one week; dealt with in 4 weeks
70% 100%
New Unsatisfactory Performers
54 Make telephone contact 90% 87% 4
Within 5 days of C/D 1,2 80% 100%
Borderline Performers 81
Telephone or written contact
50% 51%
Within 10 days of C/D 1,2 80% 100%
Reported Sample Quality – Plasma
87 2% unsatisfactory 90% of
samples
100% (mean = 0.3%
USQ) 3
Reported Sample Quality – Whole Blood Samples
36 2% unsatisfactory 90% of
samples
50% (mean = 6.6%
USQ) 3,5
Reported Sample Quality – Red cells in Alsever’s
36 2% unsatisfactory 90% of
samples
94% (mean = 1.5%
USQ) 3
Integrity of Samples 47064 <0.5% unsuitable for
testing (UFT) per exercise 90% (i.e. 9/10
exercises)
90% (mean = 0.2%
UFT) 6 1 - C/D = Closing Date 2 - Of those contacted 3 - USQ = reported as Unsatisfactory Sample Quality 4 - KPI not met – a number of these did not receive a phone call as it was felt that it would not have been helpful 5 - KPI not met – within the UK and ROI, a target of 3.1% USQ would have been achieved in 88% of samples. The whole blood samples are only used for ABO/D typing in-house testing demonstrates that haemolysis does not affect the blood grouping results. 6 – UFT = unfit for testing

UK NEQAS (BTLP) Bi-ennial Report for 2014 and 2015
Page 35 of 112
8. QUESTIONNAIRES AND NON-SCORING ELEMENTS 8.1 Standard Practice questionnaire
Annual standard practice questionnaires were distributed in 2014 and 2015. See Appendices 11 and 12 for reports. Most practice has not changed significantly since 2013; however, the following points are worthy of note:
a) The proportion of laboratories using electronic issue has risen to 59%, and varies by country, with England and Wales having the highest uptake.
b) 55% of UK laboratories have implemented the group-check policy as recommended in the 2012 BCSH guidelines, with the highest uptake again in England and Wales.
c) A small minority still incorporate the use of anti-CDE reagents (7%) and an IAT test (7%) for D typing, which is outwith BCSH guidelines, and requires that we continue to distribute samples that assess appropriate interpretation of tests with these reagents, e.g. r’ and DAT positive samples.
d) The other area of particular interest to the Scheme, is the number of participating laboratories which do not book the EQA ‘patient’ samples into the IT system, thereby creating an opportunity for error that does not exist in clinical testing. This has dropped slightly from 32% in 2014 to 28% in 2015. Reasons cited included: sample format (separate plasma samples instead of whole blood), shared database, and problems with building up records of EQA ‘patients’; however, 23% cited ‘custom and practice’ as the only reason.
8.2 Emergency Exercise 15R1 included a separate non-scoring emergency element which was reported separately. The report can be found in Appendix 4. Important points to note follow:
14 laboratories (6%) issued group specific (group B) to the patient following a single ABO group (or a second group on the same aliquot), without an immediate spin crossmatch, contrary to BCSH guidelines 1.
Conversely, 10 laboratories (4%) issued group O, even after confirmation of the ABO group on a second sample, thereby meeting the criteria for issue of group specific red cells.
14% selected group O platelets in preference to group A platelets for the group B patient, which is contrary to current guidelines (this exercise preceded the use of platelet additive solution in place of plasma for pooled platelets).

UK NEQAS (BTLP) Bi-ennial Report for 2014 and 2015
Page 36 of 112
9. TRENDS IN USE OF TECHNIQUES IN UK NEQAS EXERCISES
Figures 2 to 6 show trends in grouping, screening and crossmatching techniques and technologies. Data prior to 2008 are taken from one exercise in each year and therefore only include laboratories returning results. Subsequent data are derived from questionnaires, with return rates ranging from 72 to 86%. Historically, questionnaire data have shown that some participants use different or additional techniques for UK NEQAS samples than for clinical samples. Abbreviations used in figure: LPM – Liquid phase microplate CAT – Column agglutination technology IAT – Indirect Antiglobulin Test Figure 2 – ABO/D typing technology
Figure 3 – IAT antibody screening technology
UK NEQAS (BTLP) Bi-ennial Report for 2014 and 2015
Page 37 of 112
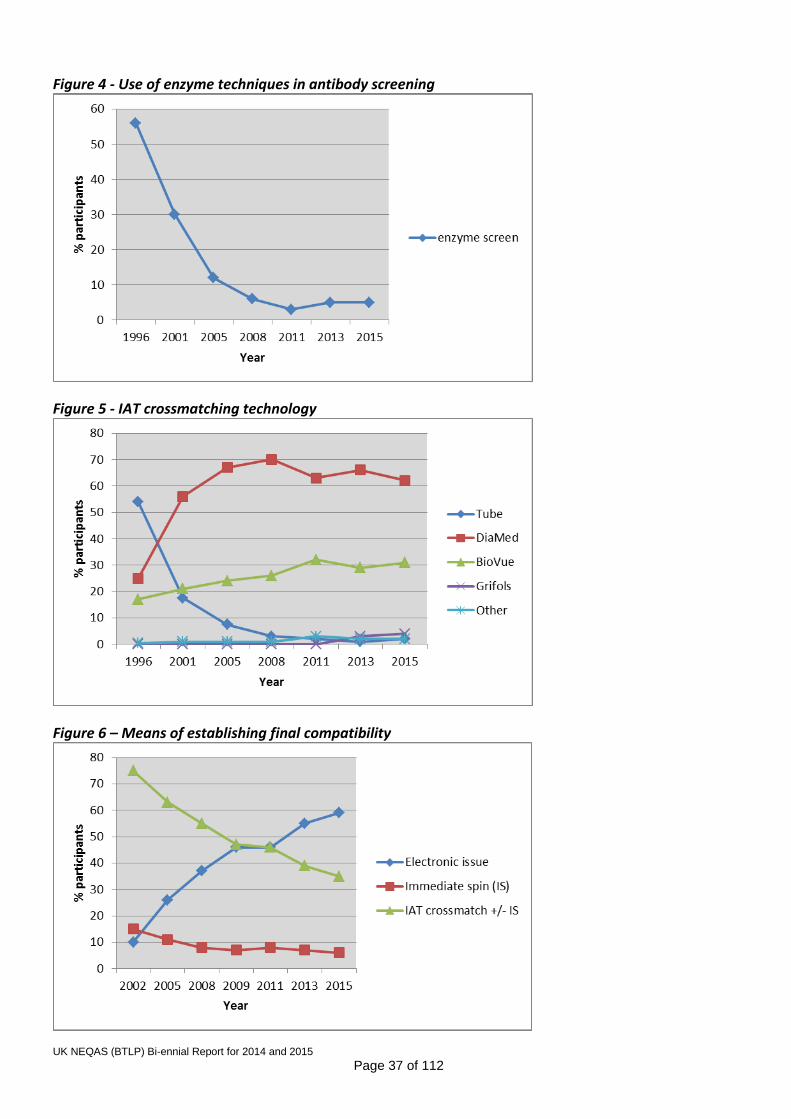
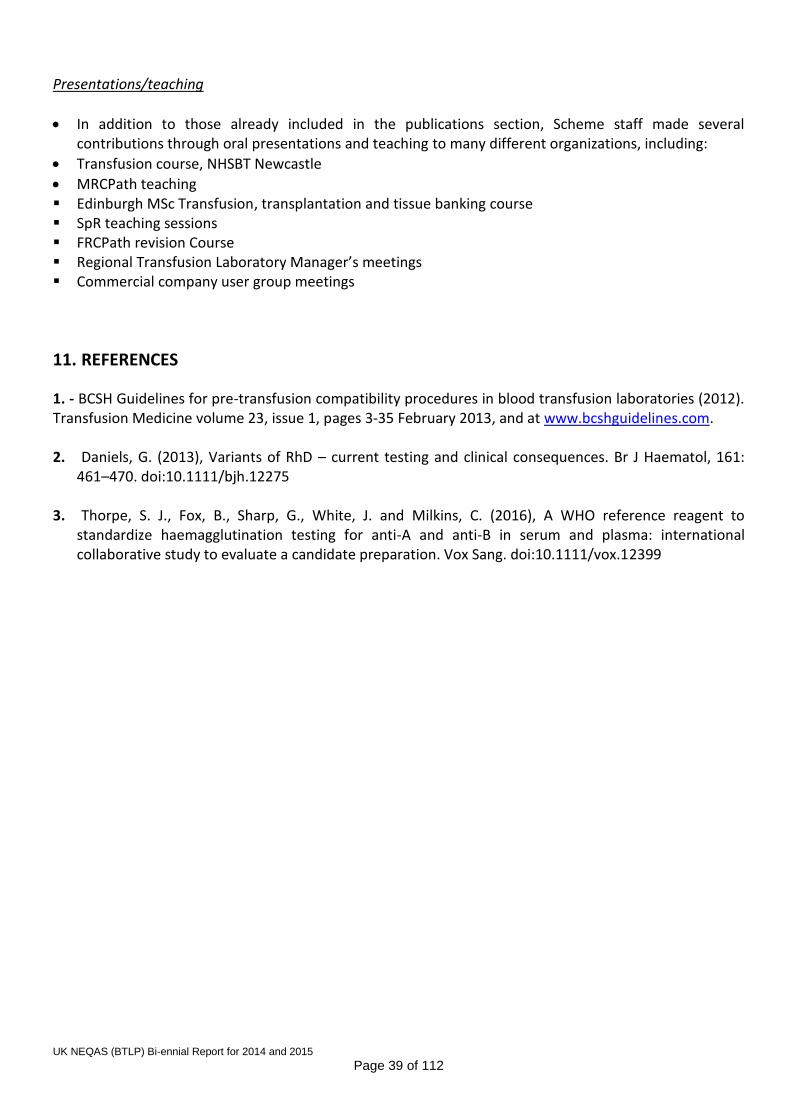
Figure 4 - Use of enzyme techniques in antibody screening
Figure 5 - IAT crossmatching technology
Figure 6 – Means of establishing final compatibility

UK NEQAS (BTLP) Bi-ennial Report for 2014 and 2015
Page 38 of 112
10. INFORMATION, EDUCATION AND PUBLICATIONS/PRESENTATIONS
Education
Annual meeting November 2014: See Appendix 13 for programme details.
Annual meeting November 2015: See Appendix 14 for programme details. Scheme Publications Abstract (poster): UK NEQAS pilot scheme for ABO titration – demonstrating the need to standardise
ABO titration to support ABO incompatible renal transplant programmes. Vox Sang 2014, Suppl 1. White J, Milkins C, Mavurayi A, Bentall A, Rowley M.
Abstract (oral). ‘Interpretation of weak D in young female patients – are UK transfusion laboratories
making correct decisions? Evidence from a UK NEQAS (BTLP) exercise. Transfusion Medicine 2014, 24, Suppl 2. Milkins C, White J, Mavurayi A, Rowley M.
Abstract (oral) Bridging the gap between theory and practice in UK transfusion laboratories –
application of a knowledge based competency scheme (TACT). Vox sang 2015, vol 109, suppl 1. Whitham C, White J, Milkins C, Rowley M.
Abstract (poster) Uptake and impact of a group-check policy in the UK and Ireland. Vox sang 2015, vol
109, suppl 1. Milkins CE, White J, Rowley MR.
Scheme Representations UK NEQAS (BTLP) has been represented on, or associated with, the following committees and organisations during the two year period:
BCSH Blood Transfusion Task Force
BBTS Specialist Interest Group for Blood Bank Technology
Serious Hazards of Transfusion (SHOT) Working Expert Group and Steering Group
UK Transfusion Laboratory Collaborative
ISBT Immunohaematology Working Party and ISBT Academy Standing Committee
Related Publications
SHOT annual reports 2013 and 2014, published 2014 and 2015, respectively.
Guideline for blood grouping and red cell antibody testing in pregnancy. White J, Qureshi H, Massey E, Needs M, Byrne G, Daniels G, Allard S. Submitted for publication in Transfusion Medicine in 2015 – awaiting peer review.
UK Transfusion Laboratory Collaborative: minimum standards for staff qualifications, training, competency and use of IT in hospital transfusion laboratories 2014. Transfusion Medicine, 24, 6, 335-339. B Chaffe, H Glencross, J Jones et al.
BCSH 2014, Guidelines for the specification, implementation and management of IT systems in hospital transfusion laboratories. Transfusion Medicine, 24, 6, 341-371. J. Jones, P. Ashford, D. Asher, J. Barker, L. Lodge, M. Rowley, J. Staves, T. Coates, J. White.
UK NEQAS (BTLP) Bi-ennial Report for 2014 and 2015
Page 39 of 112
Presentations/teaching
In addition to those already included in the publications section, Scheme staff made several contributions through oral presentations and teaching to many different organizations, including:
Transfusion course, NHSBT Newcastle
MRCPath teaching Edinburgh MSc Transfusion, transplantation and tissue banking course SpR teaching sessions FRCPath revision Course Regional Transfusion Laboratory Manager’s meetings Commercial company user group meetings
11. REFERENCES
1. - BCSH Guidelines for pre-transfusion compatibility procedures in blood transfusion laboratories (2012). Transfusion Medicine volume 23, issue 1, pages 3-35 February 2013, and at www.bcshguidelines.com. 2. Daniels, G. (2013), Variants of RhD – current testing and clinical consequences. Br J Haematol, 161:
461–470. doi:10.1111/bjh.12275 3. Thorpe, S. J., Fox, B., Sharp, G., White, J. and Milkins, C. (2016), A WHO reference reagent to
standardize haemagglutination testing for anti-A and anti-B in serum and plasma: international collaborative study to evaluate a candidate preparation. Vox Sang. doi:10.1111/vox.12399

UK NEQAS (BTLP) Bi-ennial Report for 2014 and 2015
Page 40 of 112
12. FINANCIAL STATEMENT
Income and Expenditure Summaries for the two-year period, April 2013 to March 2015 (to the nearest £500) Income:
Participant Type
£
UK Clinical Laboratories:
662500 Non-UK Clinical Laboratories:
459500
Non-Clinical Laboratories:
12500
Grand Total
1134500
Expenditure:
Category
Salaries: 650500
Revenue: 252000
Overheads1: 150500
Education/R&D 2 (inc. books meetings etc.) 81500
Grand Total 1134500
1 – includes accreditation as well as overheads paid to Trust and UK NEQAS 2 – includes TACT development

Appendix 1
UK NEQAS (BTLP) Bi-ennial Report for 2014 and 2015
Page 41 of 112
Composition of Steering Committee at December 2015 Dr Peter Baker (Chair), Royal Liverpool University Hospital Mr Martin Maley, RCI, NHSBT, Newcastle Mrs Anna Capps-Jenner, Ealing Hospital and TDL Dr Katherine Maguire, Northern Ireland BTS Ms Catherine Almond, Kent & Canterbury Hospital Dr Rekha Anand, NHSBT, Birmingham Mr James Taylor, Birmingham Children’s Hospital Dr Mallika Sekhar, Royal Free NHS Foundation Trust Mr Malcolm James (co-opted), NHSBT Reagents, Birmingham Mrs Debbie Asher (Observer - NQAAP representative), Norfolk and Norwich Mrs Clare Milkins (Secretary), Scheme Manager, UK NEQAS Dr Megan Rowley, Scheme Director, UK NEQAS Ms Jenny White, Deputy Scheme Manager, UK NEQAS Meeting dates: 23 March 2015 5 July 2015 30 November 2015

Appendix 2
UK NEQAS (BTLP) Bi-ennial Report for 2014 and 2015
Page 42 of 112
14R1 questionnaire - D typing and IAT XM reagents UK and Republic of Ireland
Introduction The aim of this questionnaire was primarily to collect information on the D typing reagents used in exercise 14R1 and correlate this with the results obtained. The secondary aim was to collect information on the reagents routinely used for the IAT crossmatch (XM) using column agglutination technology (CAT), as communications with participants and manufacturers following previous UK NEQAS exercises have revealed some variation in practice. This summary also includes a section on the interpretation of the D typing results obtained in exercise 14R1 for Patient 1, where patient demographics were provided (Female, aged 30). Return rate Questionnaire responses were received from 360/400 (90%) laboratories. Data manipulation Data for IAT XM reagents:
Duplicate questionnaire entries have been removed, with the most recent complete entry kept for inclusion in the analysis.
Data for primary D typing:
Questionnaire data (as above) has been merged with 14R1 ABO/D typing data, and responses
where there was a mismatch between the primary ABO/D typing technique reported for exercise
14R1 and that reported in the questionnaire have been excluded.
Data for comparison of primary D typing techniques and D typing reactions for 14R1 Patient 1:
Responses have been included in the analysis only if a single D typing technology (used once only)
has been recorded for exercise 14R1.
If one or more than one reaction vs. anti-D has been reported as mixed field (MF), then the
response has been counted as MF.
If at least one reaction vs. anti-D has been reported as weak, then the response has been counted
as weak (unless a MF reaction also recorded).
Results IAT XM reagents in routine use Table 1 shows the number and percentage using each column agglutination technology for the IAT crossmatch. Table 1 - Number and % using each IAT technology for XM
Technology Number (%) of laboratories
DiaMed 229 (64%)
BioVue 98 (27%)
Grifols 11 (3%)
Other or blank 22 (6%)
Total 360 (100%)

Appendix 2
UK NEQAS (BTLP) Bi-ennial Report for 2014 and 2015
Page 43 of 112
Table 2 shows the number and percentage of laboratories using anti-IgG and polyspecific AHG for routine IAT crossmatching, by column agglutination technology. Table 2 – Number and % using anti-IgG and polyspecific AHG in the IAT XM, by CAT technology
Technology (number of responses)
Number (%) of laboratories
Anti-IgG Polyspecific
DiaMed (224) 120 (54%) 104 (46%)
BioVue (98) 29 (30%) 69 (70%)
Grifols (11) 8 (73%) 3 (27%)
Total (333) 157 (47%) 176 (53%)
Red cell diluents routinely used in the IAT XM DiaMed (n=229)
220 (96%) Diluent-2
7 (3%) CellStab
2 (1%) other unspecified diluent.
BioVue (n=98)
60 (61%) 0.8% diluent
31 (31%) BLISS
7 (7%) other unspecified diluent. Grifols (n=11)
9 (82%) DG Gel Sol
1 (9%) saline
1 (9%) not stated. Primary ABO/D typing reagents used in exercise 14R1 Table 3 shows the number and percentage using each technology for routine primary ABO/D typing. Table 3 – Primary ABO/D typing technologies – number (%)
Technology Number of laboratories
DiaMed 184 (52%)
BioVue 101 (29%)
Liquid phase microplate 37 (10%)
Grifols 10 (3%)
Tube 22 (6%)
All technologies 354 (100%)
Primary ABO/D grouping reagents vs. Patient 1 D typing reactions Tables 4-7 show data for cards, cassettes and combinations of reagents used by >10 laboratories, with the exception of Table 6 where the total number of laboratories using Grifols is only 11, and all data is shown. Table 4 shows the configuration of BioVue cassettes used for primary ABO/D typing in exercise 14R1 and the anti-D clones they contain, with the number using each listed cassette, the number using it as a single

Appendix 2
UK NEQAS (BTLP) Bi-ennial Report for 2014 and 2015
Page 44 of 112
test to D type Patient 1 in exercise 14R1, and the reactions obtained (categorised as described in data manipulation section). Table 5 shows equivalent information for DiaMed, Table 6 for Grifols and Table 7 for reagents used in liquid phase microplates (LPMP) and tube testing. Table 4 –BioVue cassettes used vs. D typing reactions for Patient 1 in exercise 14R1
Configuration of Primary ABO/D cassette used (14R1)
Anti-D clones
Number of labs
Used as single test for Patient 1
14R1
Patient 1 reactions vs. anti-D reagent(s)
Strong Weak MF Neg
ABODD (A, B, A,B, D, D, control)
D7B8 RUM-1
15 9 1 5 3 0
ABORh/ Reverse (combo) (A, B, D, control, rev dil, rev dil)
D7B8 82 46 2 19 25 0
A further 4 used stated that they used other BioVue cards: ABD confirmation (2), ABDD/K (2) Table 5 - DiaMed cards used vs. D typing reactions for Patient 1 in exercise 14R1
Configuration of Primary ABO/D card used (14R1)
Anti-D clones
Number of labs
Used as single test for Patient 1
14R1
Patient 1 reactions vs. anti-D reagent(s)
Strong Weak MF Neg
DiaClon ABO/D + Reverse Grouping (A, B, D, control, rev, rev)
LDM3, 175-2
126 95 14 79 1 1
DiaClon ABO/D + Reverse Grouping (A, B, D, D, rev, rev)
LDM1 RUM-1 TH-28 LDM3 175-2
44 32 4 23 5 0
A further 12 stated that they used other DiaMed cards: DiaClon ABO/D + DAT (2), DiaClon ABO/D1 (3), DiaClon ABO/Rh for Patients1 (1) DiaClon ABD Confirmation for Patients (6) 1 contains an anti-D that detects DVI (used by three hospital laboratories) 2 contains an anti-CDE reagent (used by a hospital laboratory) Table 6 - Grifols cards used vs. D typing reactions for Patient 1 in exercise 14R1
Configuration of Primary ABO/D card used (14R1)
Anti-D clones
Number of labs
Used as single test for Patient 1
14R1
Patient 1 reactions vs. anti-D reagent(s)
Strong Weak MF Neg
DG Gel ABO/Rh (CR) (A, B, D, D, control, N, N, N)
P3x61 MS-201
3 3 0 3 0 0
DG Gel ABO/Rh (2D) + Kell (A, B, D, D, K, control, N,N)
P3x61 MS-201
6 5 0 4 0 0
DG Gel ABO/Rh + Kell (A, B, AB, D, K, control, N,N)
P3x61 1 1 0 1 0 0

Appendix 2
UK NEQAS (BTLP) Bi-ennial Report for 2014 and 2015
Page 45 of 112
Table 7 – Reagents used by LPMP and tube vs. D typing reactions for Patient 1 in exercise 14R1
D typing reagents used (14R1) Anti-D clones
Number of labs
Used as single test for Patient 1
14R1
Patient 1 reactions vs. anti-D reagent(s)
Strong Weak MF Neg
Immucor Immuclone and Novoclone
RUM-1 D175 D415
35 13 0 7 0 6
Various suppliers RUM-1 BS-201
15 9 1 8 1 1
A further 9 using varying combinations of reagents including the clones RUM-1, BS-201, V175, D415, BS226, P3x61, ESD11, LDM1, LDM3, D7B8, and BS232. 1 Detects D VI (used by one reference laboratory and one diagnostics company). Interpretation of 14R1 D typing results in clinical context for Patient 1 (female, aged 30) Table 8 shows the reaction grades obtained for Patient 1 vs. anti-D reagent(s), and the interpretations made for Patient 1 based on these reactions. Table 9 shows D typing interpretation made for Patient 1 vs. whether a D positive donation would be issued for transfusion. Table 8: Patient 1 D typing: Reaction grades and interpretations recorded
Interpretation (number)
Combination of reactions recorded with anti-D reagent(s)
Strong pos only1
Weak pos1 (+/- strong
pos)
Strong or weak pos +
neg Neg only1 Includes
MF
D Variant2 (191) 0 169 8 1 13
D Positive (121) 24 93 1 0 3
D UI (66) 0 21 0 0 45
D Negative (16) 0 1 0 13 2
Total (394)3 24 284 9 14 63 1With one or two anti-D reagents; 2This response includes weak and partial D; 3One laboratory is not registered for D typing.
Table 9: Results of Donor W vs. Patient 1 for the 388 laboratories returning crossmatching results
Interpretation P1 D type (number)
Result for Donor W (D positive) vs. Patient 1 (weak D)
Incompatible or Deselected
Compatible – Transfuse Yes
Compatible - Transfuse No
D Variant (189) 19 71 99
D Positive (118) 3 108 7
D UI (65) 5 14 46
D Negative (16) 2 3 11
Total (388) 29 196 163

Appendix 2
UK NEQAS (BTLP) Bi-ennial Report for 2014 and 2015
Page 46 of 112
Discussion 14R1 D typing reagents Patient 1 (D weak) was prepared by pooling D weak donations, and was not scored for D typing, as the results obtained would have been dependent on the characteristics of the anti-D reagent(s) used and the level of testing available. This questionnaire data shows the range of different reagents in use in the UK and ROI, and that D typing reactions are variable both by reagent used and within groups of laboratories using the same reagent(s). However, there appear to be some trends in the data:
A high proportion of those using BioVue cassettes recorded MF reactions with anti-D: 30/57 (53%), vs. 6/136 (4%) using DiaMed cards.
A high proportion of those using Immucor grouping reagents by LPMP or tube, 6/13 (46%), obtained negative reactions vs. anti-D, compared to 4/219 (2%) of those using other reagents by column agglutination technology.
Neither of these observations appears to be directly linked to the constituent anti-D clones. Five laboratories used an anti-D reagent that detects DVI, including three hospital laboratories undertaking routine pre-transfusion testing using DiaMed technology. One further hospital laboratory used an anti-CDE reagent. BCSH guidelines1 state that anti-D reagents used for patient D typing should not detect DVI, and that anti-CDE reagents should not be used. Limitations of the data Overall, 149/354 detailed additional testing for 14R1 and it is not clear whether the results of these tests influenced the reactions reported for exercise 14R1. Incidentally, 11/149 (7%) stated that they would not have performed the additional tests in a similar clinical situation. Provision of basic patient demographics The majority of comments relating to the provision of patient age and gender with exercise 14R1 were positive, with the consensus being that this information had enhanced the relevance of the exercise.
Interpretation of 14R1 D typing results in clinical context – Patient 1 (female, aged 30)
356/394 (90%) laboratories recorded anomalous D typing reactions for Patient 1, i.e. at least one weak or MF reaction, or one positive and one negative reaction, and 97/356 (27%) reported Patient 1 as D positive. Of these 97 laboratories, only 4 (6%), of the 65 completing the accompanying questionnaire, stated that they had undertaken testing with a kit to characterise weak and partial D. Following BCSH guidance1, where anomalous D typing reactions are obtained on a sample from a female patient with child bearing potential, the patient should be reported as D negative until further testing has been undertaken to confirm the D type.

Appendix 2
UK NEQAS (BTLP) Bi-ennial Report for 2014 and 2015
Page 47 of 112
196/359 (55%) laboratories reporting a compatible crossmatch for Patient 1 vs. Donor W answered ‘Yes’ to the question ‘would you transfuse?’. 88/196 (45%)* reported Patient 1 as either D negative, D variant (only seven stated that they confirmed with an extended D typing panel) or UI. Whilst the D type of a female patient with child bearing potential remains unconfirmed, D negative red cells should be selected for transfusion1. *Erratum: The original 14R1 report issued 14/02/14 incorrectly reported this figure as 125/168 (64%).
References 1 BCSH guidelines for pre-transfusion compatibility testing in blood transfusion laboratories. Transfusion Medicine volume 23, issue 1, pages 3-35 February 2013, and at www.bcshguidelines.com (accessed 14/15/14).

Appendix 3
UK NEQAS (BTLP) Bi-ennial Report for 2014 and 2015
Page 48 of 112

Appendix 4
UK NEQAS (BTLP) Bi-ennial Report for 2014 and 2015
Page 49 of 112
Emergency Issue Questionnaire Distributed with exercise 15R1 – January 2015
UK and Republic of Ireland
Introduction Exercise 15R1 included an additional emergency testing element, with the aim of exploring the testing undertaken within 10 minutes where blood is required in an emergency situation and, for a range of patients with differing demographics, the provision of red cells and components, i.e.:
The group and specification of red cell units issued within 10 minutes
The group of further red cell units issued once a second confirmatory sample has been received
The group and type of FFP issued
The group of platelets issued (from a limited selection) and further actions based on this issue Material / instructions One whole blood sample was provided with a matching request card for a patient (Alex Smith, male, D.O.B. 01/01/1970) requiring 4 units of red cells within 10 minutes, for multiple injuries following a road traffic accident. There was an accompanying SurveyMonkey questionnaire requesting details of red cells that would have been provided within 10 minutes, and of further red cells, platelets and FFP to be provided based on the results of the testing within 10 minutes and a (theoretical) second sample confirming these results within 30 minutes. The questionnaire also included repeat sets of questions on the provision of red cells and components, with the responses to be based on the same testing results, but for patients with different demographic details, i.e.:
Male, aged 8, multiple injuries
Female, aged 23, ruptured ectopic pregnancy
Female, aged 75, gastrointestinal bleed Return rate and data analysis Results were returned by 348/396 (87.9%) laboratories. Twenty three stated that they do not test clinical samples in emergency situations, and 325 sets of results have been analysed for this report. Decisions surrounding duplicate submissions:
Complete rather than incomplete submissions have been selected.
If there was more than one complete set of data then most the most recently submitted has been selected.
Edits to data:
Responses of Yes / No to whether testing was undertaken have been edited according to whether corresponding result sections were completed.
Information in comment fields has been used to edit responses where relevant.

Appendix 4
UK NEQAS (BTLP) Bi-ennial Report for 2014 and 2015
Page 50 of 112
Data from the following respondents has been included in some sections of the report but not others, as specified in the table headings:
Sixteen laboratories not returning data for all four scenarios
Nine laboratories returning contradictory data for one or more of the four scenarios regarding
issue of RBC, e.g. stating that B negative units selected were ‘designated emergency O D negative
units’
Five laboratories reporting a grouping result other than B D negative.
Results Testing within 10 minutes (expected result B D negative) Grouping results within 10 minutes (n=228) 233/325 (71.7%) performed an initial group within 10 minutes, but seven of these did not record a blood grouping result. 92/325 (28.3%) did not undertake blood grouping within 10 minutes. 221/226 (97.8%) reported the correct result (B D negative), and results from the remaining five are displayed in Table 1. Table 1: incorrect results for ABO/D typing within 10 minutes
ABO/D group recorded Number (technology)
B D positive 3 (2 tube, I DiaMed and other)
B D variant 1 (DiaMed)
B D UI (unable to interpret) 1 (Tube)
Of the five laboratories reporting an incorrect D type:
o 4 would have issued group O D negative red cells at 10 minutes in all four scenarios
o 1 (reporting B D positive and testing by tube) would have issued O D positive red cells at 10
minutes to the male aged 45, the male aged 8 and the female aged 75, but O D negative for the
female aged 23.
Grouping methods used within 10 minutes Details of testing are shown in Table 2 Table 2: Technology used for initial group (n=233)
Technology Total Number Full group Forward group
only Control Second group
BioVue 24 18 6 20 12
DiaMed 16 3 13 9 2
Grifols 3 1 2 3 1
Microplate 5 2 3 5 4
Slide / Tile 16 3 13 8 9
Tube 164 78 88 70 66
Two techs 5 2 3 2 0
Total 233 105 130 117 94

Appendix 4
UK NEQAS (BTLP) Bi-ennial Report for 2014 and 2015
Page 51 of 112
Laboratories performing an initial group using microplate or Grifols used the same technology for the second group, whilst neither of the DiaMed users stating that they performed a second group recorded a technology. Table 3 shows the technologies used for the second group by those laboratories performing an initial group by BioVue, tube or slide/tile. Table 3: Technology used for second group
Technology Initial group
Technology second group
BioVue DiaMed Grifols Tube Slide/tile Not stated
BioVue (n=12) 6 0 0 4 0 2
Slide / Tile (n=9) 0 1 0 3 2 3
Tube (n=66) 8 10 1 21 0 26
99/233 (40.5%) performed a second group within 10 minutes, including 32 that did not provide any
details of the second group, and the five stating that two technologies were used for the initial
group.
o 53/61 (86.9%) answering this question, tested a new aliquot of cells, but 8/61 (13.1%)
stated that they repeated the group on the same aliquot of cells used for the initial group.
o 34/68 (50.0%) used a different technology from that used for initial group (including the six
that recorded two techniques for the initial group).
Testing within 10 minutes vs. issue of group specific red cells for the first patient (male, aged 45)
105/233 (45.1%) performed one group (or a second group on the same aliquot of cells) and did not
include an ISXM
o 102/105 (97.1%) stated the group of red cell units selected at 10 minutes:
14/102 (13.7%) would have issued group B red cells
88/102 (86.3%) would have issued group O red cells
62/88 (70.5%) converted to issuing group B after receipt of a confirmatory
sample at 30 minutes (for the male, aged 45).
99/233 (42.5%) stated that they had grouped two different aliquots (+/- an ISXM), or done a single
group and an ISXM
o At 10 minutes:
36/99 (36.4%) would have issued group B red cells
63/99 (63.6%) would have issued group O red cells
53/63 (84.1%) converted to issuing group B after receipt of a confirmatory
sample at 30 minutes(for the male, aged 45) .
29/233 (12.4%) stated that they had performed a second group but did not give full details, and did
not perform an ISXM.
o 28/29 (96.6%) stated the group of red cell units selected at 10 minutes:
12/28 (42.9%) would have issued group B red cells
16/28 (57.1%) would have issued group O red cells
11/16 (68.8%) converted to issuing group B after receipt of a confirmatory
sample at 30 minutes (for the male, aged 45), and one to group AB, although
this is likely to be a ‘tickbox’ error.

Appendix 4
UK NEQAS (BTLP) Bi-ennial Report for 2014 and 2015
Page 52 of 112
Table 4 shows the additional test procedures undertaken within 10 minutes in all laboratories, regardless of whether grouping was undertaken. Table 4: Additional test procedures within 10 minutes overall (n=325)
Additional test / procedure Number (%)
‘Immediate spin’ crossmatch (ISXM) 561 (17%)
Sampling units for retrospective crossmatch 193 (59%)
Group check units 272 (8%) 1 Three did not perform a group, 2 20 in ROI + a further two selected previously group checked units (both ROI) Selection of Red Blood Cells (RBC) within 10 minutes Table 5 shows the selection of RBC within 10 minutes by those laboratories not undertaking a group within 10 minutes. Table 5: Selection of RBC within 10 minutes where no group was performed (n=92)
ABO/D group
of red cells
Number issuing RBC (%)
Age 45 Male
Age 8 Male
Aged 23 Female1
Age 75 Female1,2
O D negative 72 (78%) 85 (92%) 91 (100%) 72 (78%)
O D positive 20 (22%) 7 (8%) 0 (0%) 18 (18%) 1 1 blank, 2 1 ticked B D negative but stated that ‘designated O D negative units’ were issued Table 6 shows the selection of RBC within 10 minutes by those laboratories reporting a blood group of B D negative completing all 4 scenarios with no contradictory data, e.g. issue of B negative units that are stated to be ‘designated group O ‘emergency units’. Table 6: Selection of RBC within 10 minutes by laboratories reporting B negative (n=206)
ABO/D group of red cells
Number issuing RBC (%)
Age 45 Male
Age 8 Male
Aged 23 Female
Age 75 Female
O D negative 134 (65%) 141 (68%) 145 (70%) 130 (63%)
O D positive 15 (7%) 5 (3%) 0 (0%) 17 (8%)
B D negative 57 (28%) 60 (29%) 61 (30%) 59 (29%)
Table 7 shows the further specifications of RBC issued within 10 minutes by those laboratories completing all 4 scenarios. The numbers in the table for selection of K negative and CDE negative red cells do not include those who also said that the units were designated as emergency units. The assumption has been made that units designated for emergency use will be K-, and if D negative then also C and E negative.

Appendix 4
UK NEQAS (BTLP) Bi-ennial Report for 2014 and 2015
Page 53 of 112
Table 7: Further specification for RBC selected for issue at 10 minutes (n=315) Additional
specifications for red cells
Number selecting RBC with an additional specification (%)
Age 45 Male
Age 8 Male
Aged 23 Female
Age 75 Female
Units designated ‘emergency group O’
166 (53%) 170 (54%) 166 (53%) 166 (53%)
K negative 44 (14%) 59 (19%) 247 (78%) 38 (12%)
CDE negative 38 (12%) 54 (17%) 80 (25%) 36 (11%)
Other1 34 (11%) 44 (14%) 49 (16%) 34 (11%) 1 including HT neg, CMV neg, HbS neg, units with confirmed group, and c neg for O+ units designated for emergency use.
Selection of components following confirmatory group on second sample (at 30 minutes) For the sake of comparison between the different patient types, the tables in this section only include data from those laboratories returning data for all four scenarios. Selection of red cell units (RBC) Table 8 shows the ABO/D group of red cells issued by those reporting an initial group of B negative, following confirmation of the group on a second sample. Table 8: Selection of further red cells at 30 minutes (n=206)
ABO/D group of red cells
Number (%)
Age 45 Male
Multiple injuries
Age 8 Male
Multiple injuries1
Aged 23 Female
Ectopic pregnancy
Age 75 Female
GI bleed2
O D negative 27 (13%) 37 (18%) 38 (18%) 27 (13%)
O D positive 11 (5%) 3 (2%) 13 (<1%) 16 (8%)
B D negative 158 (77%) 165 (80%) 167 (81%) 146 (72%)
B D positive 9 (4%) 0 (0%) 0 (0%) 14 (7%)
AB D positive 13 (<1%) 0 (0%) 0 (0%) 0 (0%)
A D positive 0 0 (0%) 0 (0%) 13 (<1%) 1 1 blank, 2 2 blanks 3 presumably ‘tickbox’ error as group B D negative reported Selection of fresh frozen plasma (FFP) Table 9 shows details of the type of FFP selected, i.e. standard FFP or pathogen inactivated (pooled solvent detergent treated (SD), or methylene blue (MB) treated), regardless of the level of testing within 10 minutes. This table excludes data from the 42 respondents from the Republic of Ireland where SD FFP is the only product available.

Appendix 4
UK NEQAS (BTLP) Bi-ennial Report for 2014 and 2015
Page 54 of 112
Table 9: Type of FFP selected (n=273)
Type of FFP Number (%)
Age 45 Male1
Age 8 Male1
Aged 23 Female
Age 75 Female2
Standard FFP 263 (97%) 2 (<1%) 251 (92%) 262 (96%)
SD FFP 9 (3%) 84 (31%) 18 (7%) 8 (3%)
MB FFP 0 (0%) 186 (68%) 4 (1%) 1 (<1%) 1 1 blank, 2 2 blanks, Table 10 shows the group of FFP selected by those reporting the initial group as B, where there was no restriction placed on the group of FFP that was available. Table 10: ABO group of FFP selected (n=220)
FFP ABO group
Number (%)
Age 45 Male
Age 8 Male1
Aged 23 Female
Age 75 Female2
Group AB 21 (9%) 37 (5%) 25 (11%) 22 (10%)
Group B 193 (88%) 180 (82%) 193 (88%) 193 (89%)
Group A 4 (2%) 2 (1%) 2 (1%) 1 (<1%)
Group O 2 (1%) 0 (0%) 0 (0%) 2 (1%) 1 1 blank, 2 2 blanks Two of the 92 laboratories that did not perform a group within 10 minutes selected group O FFP for all four patients. Selection of platelet concentrates Table 11 shows the group of platelets selected, where the choice given was restricted to A D positive or O D positive. Table 11: ABO group of platelets selected (n=315) Platelets ABO/D group
Number (%)
Age 45 Male2
Age 8 Male3
Aged 23 Female4
Age 75 Female5
A D positive 266 (86%) 267 (87%) 266 (87%) 267 (86%)
O D positive1 44 (14%) 41 (13%) 41 (13%) 44 (14%) 1 40 selected O D positive in all 4 scenarios 2 5 blanks, 3 7 blanks, 4 8 blanks, 5 4 blanks
Table 12 shows further actions (where any were noted) by the laboratories reporting group B D negative, following issue of D positive platelets in each of the four scenarios. Table 12: Actions following issue of platelets (n=206) Further actions following issue of platelets
Number (%)
Age 45 Male
Age 8 Male
Aged 23 Female
Age 75 Female
Stating any action(s) (including anti-D Ig related actions specified below)
84 (41%) 112 (54%) 202 (89%) 73 (35%)
Issue or suggest anti-D Ig 71 (3%) 28 (14%) 150 (73%) 71 (3%)
Seek medical advice on anti-D or consider anti-D Ig
23 (11%) 25 (12%) 26 (13%) 13 (6%)
2 includes 5 of the same laboratories

Appendix 4
UK NEQAS (BTLP) Bi-ennial Report for 2014 and 2015
Page 55 of 112
Other actions (not related to anti-D prophylaxis) include: consideration of HT status of platelets, monitoring for immune anti-D, monitoring for haemolysis, routine haematology follow-up tests, replacing platelet stock, seeking advice / authorisation from Consultant Haematologist, and informing the ward of the group mismatch. 83/92 laboratories not performing a group within 10 minutes recorded action(s) following the issue of D positive platelets for the female aged 23, and 67/92 (72.8%) included mention of anti-D prophylaxis. Discussion and conclusions Limitations of the data The instructions stated that a theoretical second sample was received confirming the group within 30 minutes. This format worked well if first group was performed and was correct (B D negative). However, where no group was performed within 10 minutes the subsequent questions regarding provision of red cells and components at 30 minutes were also based on having no blood group, but this was unlikely to be the case in a real situation. It is also unlikely that a second sample would confirm a mistake in the original testing, resulting in collection of some potentially misleading data that has not been included in the analysis, e.g. three laboratories reporting a group of B D positive within 10 minutes, would have issued B D positive units at 30 minutes in all four patient scenarios. Testing undertaken within 10 minutes 72% of laboratories performed ABO/D typing within 10 minutes, with 41% of these undertaking a second cell group within the same timeframe; however, 13% (cf. 12% in 2013 and 2010) of these performed the second test on the same aliquot of cells as the first group, which would perpetuate any error in selection of the correct specimen. The BCSH criteria for issue of group specific red cells is that following the initial group, a further test to detect ABO incompatibility should be performed, i.e. a second group on a new aliquot of the primary sample, or an ISXM. In 99/233 (42%) laboratories performing a group within 10 minutes these criteria were met, whilst 105 (45%) did not include a second test to detect ABO incompatibility. A further 29 (12%) performed no ISXM, and whilst undertaking a second group, did not state whether a new aliquot of cells was used. Five incorrect D types were reported; however all five laboratories issued group O D negative blood at 10 minutes in all four patient scenarios. Issue of group specific and group O blood within 10 minutes At least 14/233 (6%) laboratories undertaking testing within 10 minutes issued group specific blood for Alex Smith (B D negative) based on grouping a single aliquot of cells and with no ISXM. (cf. 16% 2013). Conversely, 63/99 (64%) of those undertaking testing to meet BCSH criteria for issue of group specific red cells, issued group O at 10 minutes. Selection of group O blood in this circumstance is a local policy decision based on a risk assessment of emergency testing, with factors including, second sample ‘group check’ policy, the frequency with which emergency testing is undertaken, differences in methodology between routine and emergency testing, level of blood stocks, skill mix and case mix. Data from the 2014 UK NEQAS annual practice questionnaire, showed that 65% of those using a group-check policy, give group O rather than group specific in urgent situations where a second sample has not been tested. It is notable that only 126/167 (75%) of those performing a group and initially selecting group O red cells, converted to issuing group B red cells, following confirmation of the group on a second sample. The English National Blood Transfusion Committee (NBTC) recommends use of O D negative red cells in emergency situations, only until the patient’s blood group has been determined, with a limit of two units wherever possible2.

Appendix 4
UK NEQAS (BTLP) Bi-ennial Report for 2014 and 2015
Page 56 of 112
Issue of red cells where no group was performed within 10 minutes As expected, all of the 92 (28%) laboratories not undertaking blood grouping issued group O blood at 10 minutes. Specifications for units designated as ‘emergency group O’ Data from a 2013 UK NEQAS questionnaire showed that in 99% of laboratories, designated emergency O D negative red cells were K negative and 92% cde/cde (rr). Since then the Blood Stocks Management Scheme (BSMS) has issued a document, ‘red cells for emergency use – best practice from BSMS regional roadshows’3, that recommends a standard specification for adult emergency units to be O D negative, C-, E-, K-. This document discusses further specifications such a CMV negative, high titre (HT) negative, negative for other blood group antigens, and concludes that the priority should be to ensure that there is sufficient supply, rather than aiming to cover all eventualities, and that there should be a focus on appropriate use of designated ‘flying squad’ units. There is no requirement in BCSH guidelines1 to provide HT negative group O red cell units for ABO non-identical transfusion to adults or children because of the very low volume of plasma remaining in SAG-M red cell units, although there are recommendations for HT negative plasma rich components such as group O FFP and platelets. Selection of K- and C-, E- red cells at 10 minutes For this section, the assumption has been made that group O units designated for emergency use are K-, and that those that are D negative units are also be C- and E-. On this basis, in line with BSCH guidance1, 313/315 (99%) would have provided K- units for the 23 year old female. It would seem that in some laboratories K- blood (not designated for emergency use) is also selected for other patients, with 14% specifying K- units for the 45 year old male, 19% for the 8 year old male and 12% for the 75 year old woman. Provision of K- for other patient groups will depend on local policy, but there is no BCSH guidance that this is necessary, unless the patients are transfusion dependent. Consideration should be given to conserving group O negative K- units for situations where K- is a requirement. It is interesting to note that only 246/315 (78%) would have selected C-, E- red cell units for the 23 year old female. There is no BCSH guidance on this, although it may be considered good practice (where time permits) for a female with child bearing potential, as it could prevent the stimulation of anti-C and anti-E, and also rarely anti-G which, if misidentified as anti-D+C, can cause problems with decision making around the use of anti-D prophylaxis, risking sensitisation to D. Selection of FFP BCSH guidelines for transfusion of neonates and older children4 (addendum 20055), and guidelines for the use of FFP cryoprecipitate and cryosupernatant6 (addendum 20057) state that Group O FFP should only be given to group O patients, due to the risk of potentially transfusing large volumes of anti-A, anti-B or anti-A,B, even where testing for HT haemolysins has been undertaken. Four laboratories (two that had obtained a group of B negative within 10 minutes, and two that did perform a group) would have issued group O FFP in one or more of the four patient scenarios, where the instructions stated that the choice of groups available was not restricted. As a risk reduction measure for variant Creutzfeldt-Jacob disease (vCJD), the UK Departments of Health (DH) in 2005 recommended the use of fresh-frozen plasma (FFP) sourced from countries with low bovine spongioform encephalopathy prevalence, for individuals born after 1 January 1996. Whilst this initially referred only to children, this cohort has now reached the age of 19 so the recommendation will increasingly apply to young adults8. Due to the potential for a higher prevalence of viral markers in countries providing this plasma, it is subjected to pathogen inactivation using methylene blue (MB) or solvent detergent (SD) treatment.

Appendix 4
UK NEQAS (BTLP) Bi-ennial Report for 2014 and 2015
Page 57 of 112
Following this guidance, in a routine situation an 8 year old male should be provided with MB or SD FFP9 and only 2/315 (<1%) laboratories selected standard FFP in this patient scenario. In an emergency situation where the blood group is unknown or cannot be established with certainty, group AB FFP may be considered the group of choice. However, pathogen inactivated AB FFP may be in short supply, and in this case, non ABO identical MB FFP might be considered as an alternative. Unfortunately, MB FFP is not tested for HT ABO haemolysins, so when AB or group-specific MB FFP cannot be sourced in an emergency, standard FFP may be a reasonable alternative. This is essentially balancing an immediate risk of haemolysis vs. a potential long term very low risk of vCJD transmission and could be issued under concession or by variation to normal procedures. There is some variation in the availability and use of viral inactivated FFP between countries, and it is interesting to note that 42 of those selecting SD FFP are in the Republic of Ireland (ROI), where this is the only product available. In the UK (excluding ROI), approximately one third of laboratories selected SD FPP and two thirds MB FFP for the 8 year old male. JPAC / SHOT released a position statement in 2012 reviewing the use of pathogen-inactivated FFP10. Selection of platelet concentrates Although platelet increments when given prophylactically have been reported to be better when ABO-compatible platelets are given, it is reasonable to use non-ABO-identical platelets in an emergency as they are likely to be equally effective at stopping any bleeding. Group O individuals are more likely to have HT ABO haemolysins, so there is a small risk, that ABO antibodies from the plasma in which the platelets are suspended can cause red cell haemolysis, e.g. where group O platelets are transfused to a group A patient, and BCSH guidance14 is that platelets that have been found negative for HT haemolysins are used in this situation. There is some evidence from SHOT data11 that group O platelets that have tested negative for HT haemolysins can still cause haemolysis, especially in vulnerable patients such as neonates and children12,13. In a clinical situation, group B platelets would be the first choice for a group B patient, followed by group A, with group O selected only in emergency situations where other groups are not available. Whereas, in this exercise, where both group O and group A platelets were ‘in stock’, group A would have been the better choice. The instructions for this emergency scenario were that only O D positive or A D positive platelets were available for the B D negative patient, and there was no indication as to whether these had been tested for HT ABO haemolysins. The majority of laboratories selected group A platelets in all four patient scenarios; however, 13% laboratories opted to issue the group O platelets. Following transfusion of D positive (group O or A) platelets various relevant actions were suggested, including informing medical staff of ABO/D mismatch, contacting the consultant haematologist for advice, follow-up monitoring for haemolysis and replacing platelet stock. Anti-D prophylaxis following transfusion of D positive platelets Following the transfusion of D positive platelets, BCSH guidance15 is to offer anti-D prophylaxis to D negative female patients with child bearing potential, such as the 23 year old female in this exercise. Whether or not this was instigated was deliberately not asked as a direct question, but examination of the actions following issue of the platelets showed that (85%) respondents that had grouped the patient samples as B D negative, had either stated that anti-D Ig would be issued, or that medical advice would be sought as to whether it should be issued. This leaves 15% where it appears that anti-D prophylaxis would not have been offered, putting this patient at risk of producing anti-D with the potential to affect future pregnancies. A small proportion of laboratories would have issued (as opposed to considered) anti-D Ig in other patient scenarios; 3% each for the male aged 45 and female aged 75, and 14% for the 8 year old male. Anti-D prophylaxis is not necessary for the male aged 45 or the female aged 7515, but could be considered if they are on long term transfusion support. There is no guidance recommending anti-D

Appendix 4
UK NEQAS (BTLP) Bi-ennial Report for 2014 and 2015
Page 58 of 112
prophylaxis for the 8 year old male, although it might not be an unreasonable decision, given that D negative red cells are recommended for D negative patients in this category1. References 1. BCSH (2012) guidelines for pre-transfusion compatibility procedures in blood transfusion laboratories.
http://www.bcshguidelines.com (accessed 11/05/15)
2. NBTC: The appropriate use of group O RhD negative red cells http://www.transfusionguidelines.org/uk-transfusion-committees/national-blood-transfusion-committee/responses-and-recommendations (accessed 11/05/15)
3. Blood Stocks management Scheme Red cells for emergency use – best practice from BSMS regional roadshows. http://www.bloodstocks.co.uk/pdf/red_cells_for_emergency_use.pdf
4. BCSH Transfusion guidelines for neonates and older children British Journal of Haematology Volume 124, Issue 4, pages 433–453, February 2004 and www.bcshguidelines.com (accessed 11/05/15)
5. BCSH 2005 amendment to the guidelines on transfusion for neonates and older children (updates on
dose of anti-D Ig following platelet transfusion, choice of ABO group for blood products for administration to children, requirement for anti-D prophylaxis following FFP) www.bcshguidelines.com (accessed 11/05/15)
6. BCSH Guidelines for the use of fresh frozen plasma, cryoprecipitate and cryosupernatant British
Journal of Haematology Volume 126, Issue 1, pages 11–28, July 2004 and www.bcshguidelines.com (accessed 11/05/15)
7. BCSH 2005 amendment to the guidelines for the use of fresh frozen plasma, cryoprecipitate and
cryosupernatant (selection according to ABO and RhD grouping) and www.bcshguidelines.com (accessed 11/05/15)
8. SaBTO 2015: Measures currently in place in the UK to reduce the potential risk of transmitting vCJD
via blood https://www.gov.uk/government/uploads/system/uploads/attachment_data/file/407681/measures-vcjd.pdfc (accessed 15/5/15)
9. BCSH 2007 amendment to the transfusion guidelines for neonates and older children (update on
specification of imported FFP) www.bcshguidelines.com (accessed 11/05/15) 10. JPAC / SHOT position statement – methylene blue-treated plasma
http://www.transfusionguidelines.org/document-library/documents/position-statement-methylene-blue-treated-plasma
11. SHOT reports, http://www.shotuk.org/shot-reports/ (accessed 11/05/15)
12. Guidelines for the blood transfusion services in the UK – 8th edition 2013, section 12.11 (update on HT testing) http://www.transfusionguidelines.org/red-book/chapter-12-donation-testing-red-cell-immunohaematology/12-11-additional-testing.
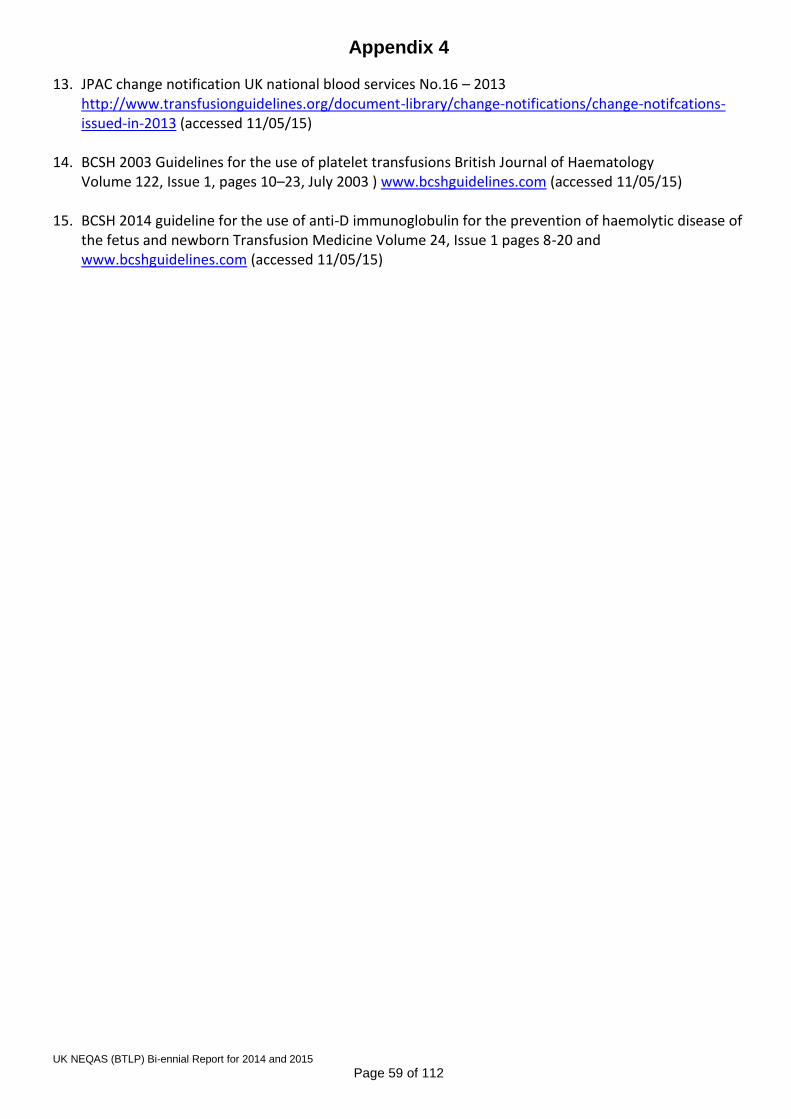
Appendix 4
UK NEQAS (BTLP) Bi-ennial Report for 2014 and 2015
Page 59 of 112
13. JPAC change notification UK national blood services No.16 – 2013 http://www.transfusionguidelines.org/document-library/change-notifications/change-notifcations-issued-in-2013 (accessed 11/05/15)
14. BCSH 2003 Guidelines for the use of platelet transfusions British Journal of Haematology
Volume 122, Issue 1, pages 10–23, July 2003 ) www.bcshguidelines.com (accessed 11/05/15)
15. BCSH 2014 guideline for the use of anti-D immunoglobulin for the prevention of haemolytic disease of the fetus and newborn Transfusion Medicine Volume 24, Issue 1 pages 8-20 and www.bcshguidelines.com (accessed 11/05/15)

Appendix 5
UK NEQAS (BTLP) Bi-ennial Report for 2014 and 2015
Page 60 of 112
Supplementary Report for Exercise 15R4 Distributed 20 April 2015 – UK and Republic of Ireland (ROI)
Introduction
The samples provided for ABO/D grouping for ‘Patients’ 1 and 2 were designed to simulate a dual population of red cells, arising from the clinical situation where red cells compatible but non-identical for ABO or D red cells are transfused. The main aim was to assess the interpretation of mixed field (MF) reactions obtained in ABO/D typing, and with this in mind, samples with dual populations A/O and D+/D- red cells in the proportion of 25:75 were distributed, as this ratio had shown the highest detection rate in previous exercises. However, the results showed variation in the detection and/or recognition of dual populations for ABO and D within and between technologies, and these are detailed in this report supplement. Material and expected results
Patient 1 - Group A D positive / O D positive (25:75) Expected result: UI (ABO) D positive
Patient 2 - Group O D positive / O D negative (25:75) Expected result: O UI (D)
As noted in the initial 15R4 report (issued 15/5/15), the reverse grouping reactions for Patient 1 matched those expected for group A, and information was given that both Patients 1 and 2 had been recently transfused. Whilst this may have influenced some of the grouping interpretations made for Patient 1, UI was still the expected ABO result, as the true ABO group could not be established without further clinical information to confirm that O cells had been transfused to a group A patient. Data analysis
390/392 (99.5%) laboratories in UK and ROI returned results for exercise 15R4 (including late results). Many laboratories recorded the use of more than one technology and/or used both manual and automated techniques, and a few did not record any details of the technology used. Where data has been analysed by technology, only laboratories recording a single technology (tested once, or by the same technology twice) have been included. Where data has been analysed with reference to automated/manual testing, those recording the use of an automated technique +/- a manual technique, have been categorised as using automation. The assumption has been made throughout, that if a MF reaction was not reported, then it was not detected. Results 1. Overall detection of MF reactions Table 1 shows the overall detection rate of the dual population in the two samples, and the other reaction grades reported where a MF reaction was not recorded. Table 1 Reaction grades recorded for Patients 1 vs. anti-A and Patient 2 vs. anti-D
Sample Reaction strength
MF Strong Weak Negative
Reaction vs. anti-A Patient 1 (n=390) 350 (90%) 18 (5%) 12 (3%) 10 (2%)
Reaction vs. anti-D Patient 2 (n=389)1 222 (57%) 18 (5%) 39 (10%) 110 (28%) 1 one not registered for D typing

Appendix 5
UK NEQAS (BTLP) Bi-ennial Report for 2014 and 2015
Page 61 of 112
2. Detection rate by technology and by manual or automated testing Table 2 shows the number using a single technology (tested once, or by the same technology twice), the number and % of each of these recording a MF reaction vs. anti-A for Patient 1 and anti-D for Patient 2. Table 2 Number detecting MF / number using technology (%)
Technology Number detecting MF / number using technology (%)
Anti-A (Patient 1) Anti-D (Patient 2)
BioVue 77/79 (97%) 34/87 (39%)
DiaMed 158/173 (91%) 128/177 (72%)
Grifols 15/15 (100%) 10/15 (67%)
LPMP1 4/8 (50%) 1/30 (3%)
Tube 10/14 (71%) 7/13 (54%)
Total 264/289 (91%) 180/322 (56%) 1 LPMP = liquid phase microplate, and includes those stating Capture or solid phase Tables 3 and 4 show the reaction grades recorded by those not detecting the dual population for Patient 1 vs. anti-A and Patient 2 vs. anti-D respectively. Table 3 Reactions other than MF recorded for Patient 1 vs. anti-A, by technology
Technology Total Negative Weak positive Strong positive
BioVue 2 0 (0%) 1 (50%) 1 (50%)
DiaMed 15 3 (20%)2 1 (7%) 11 (73%)
LPMP3 4 1 (25%) 2 (50%) 1 (25%)
Tube 4 1 (25%)3 0 (0%) 3 (75%) 1 LPMP = liquid phase microplate, and includes those stating Capture or solid phase 2 two recorded a positive reaction vs. A cells 3 recorded a positive reaction vs. A cells Table 4 Reactions other than MF recorded for Patient 2 vs. anti-D, by technology
Technology Total Negative Weak positive Strong positive
BioVue 53 33 (62%) 18 (34%) 2 (4%)
DiaMed 49 34 (69%) 3 (6%) 12 (24%)
Grifols 5 5 (100%) 0 (0%) 0 (0%)
LPMP1 29 28 (97%) 0 (0%) 1 (3%)2
Tube 6 1 (17%) 3 (50%) 2 (33%) 1 LPMP = liquid phase microplate, and includes those stating Capture or solid phase 2 manual testing Tables 5 and 6 show the proportion of those detecting a MF reaction using manual and automated methods, vs. anti-A in Patient 1 and vs. anti-D in Patient 2, respectively.

Appendix 5
UK NEQAS (BTLP) Bi-ennial Report for 2014 and 2015
Page 62 of 112
Table 5 Detection of MF reaction manual vs. automated testing vs. anti-A (Patient 1)
Technology Manual
Number MF/total (% of total) Automated
Number MF/total (% of total)
BioVue 6/7 (86%) 71/72 (99%)
DiaMed 29/38 (76%) 129/135 (96%)
Grifols 0/0 (0%) 15/15 (100%)
LPMP 0/1 (0%) 4/7 (57%) 1 LPMP = liquid phase microplate, and includes those stating Capture or solid phase Table 6 Detection of MF reaction manual vs. automated testing vs. anti-D (Patient 2)
Technology Manual
Number MF/total (% of total) Automated
Number MF/total (% of total)
BioVue 4/7 (57%) 30/80 (38%)
DiaMed 25/38 (66%) 103/139 (74%)
Grifols 0/0 (0%) 10/15 (67%)
LPMP1 0/1 (0%) 1/29 (3%) 1 LPMP = liquid phase microplate, and includes those stating Capture or solid phase Table 7 shows the reaction grades recorded by those using manual and automated column agglutination technology (CAT) and not detecting the dual population for Patient 2 vs. anti-D. Table 7 Reactions recorded for Patient 2 vs. anti-D, by manual or automated testing
Reaction grade Manual (n=16) Automated (n=93)
Strong positive 11 (69%) 3 (3%)
Weak positive 2 (12%) 19 (20%)
Negative 3 (19%) 71 (76%)
3. Trends in detection rate of MF reaction in UK NEQAS exercises Figure 1 shows overall detection rates, over time, for MF reactions in EQA samples with dual populations for ABO and / or D. Figure 1: Detection rates for MF reactions in EQA exercises

Appendix 5
UK NEQAS (BTLP) Bi-ennial Report for 2014 and 2015
Page 63 of 112
4. Interpretation of ABO/D typing results Table 8 shows the ABO interpretation selected vs. reaction obtained with anti-A for Patient 1, and Table 9 the D interpretation selected vs. reaction obtained with anti-D for Patient 2. Table 8 Reaction grade with anti-A vs. interpretation for Patient 1 (n=390)
Reaction grade vs. anti-A
Total Number (%)
UI (unable to interpret)
Group A Group O
Mixed field 350 242 (69%) 108 (31%) 0 (0%)
Weak positive 12 1 (8%) 11 (92%) 0 (0%)
Strong positive 18 0 (0%) 18 (100%) 0 (0%)
Negative 10 2 (20%) 0 (0%) 81 (80%) 1 seven recorded a positive reaction vs. A cells and one did not perform a reverse group. Table 9 Reaction grade with anti-D vs. interpretation for Patient 2 (n=389)
Reaction grade vs. anti-D
Total Number (%)
UI (unable to interpret)
D positive D variant D negative
Mixed field 222 188 (85%) 26 (12%) 7 (3%) 1 (<1%)
Weak positive 39 11 (28%) 9 (23%) 19 (49%) 0 (0%)
Strong positive 18 0 (0%) 181(100%) 0 (0%) 0 (0%)
Negative 109 0 (0%) 0 (0%) 1 (1%) 108 (97%) 1 one recorded a positive reactions vs. one anti-D and a negative reaction vs. a second anti-D. Discussion Background and purpose of the exercise
The recognition of dual populations of red cells is clinically important, and EQA exercises have been distributed regularly to monitor the detection of mixed field reactions in samples with dual populations for ABO and / or D (see Fig. 1). Previous exercises have shown that the detection rate varies with the proportion of cells positive and negative vs. the relevant reagent, e.g. anti-A or anti-D. The report for exercise 10R7 speculated that there are potentially several different mechanisms for missing a dual population, dependent on the differing proportions of ‘positive’ and ‘negative’ cells present.
In exercise 10R7 it was noted that a higher proportion of laboratories were able to detect the MF reaction vs. Anti-A than vs. anti-D, and that this difference was exaggerated when the data was examined by technology. The main purpose of exercise 15R4 was to investigate how MF reactions are interpreted; however, it is interesting to note that the results continue to show variable detection rates for the D+/D- dual population both within and between technologies. Overall detection of dual populations
The overall detection rate for the A/O dual population in this exercise was slightly higher than that observed for the 25:75 A/O sample issued in 10R7, whilst that for the D+/D- dual population was lower than for an equivalent sample in 10R7 see Fig. 1. Consequently, the overall difference in detection between the A/O dual population (Patient 1) and that for the D+/D- sample (Patient 2) was greater in 15R4 that seen in 10R7 (90% and 57% respectively cf. 86% and 71%). This could be because in exercise

Appendix 5
UK NEQAS (BTLP) Bi-ennial Report for 2014 and 2015
Page 64 of 112
10R7 the A/O and D+/D- dual populations were present in the same sample, and detection of the A/O MF reaction might have prompted closer inspection of the remaining reactions. Detection of dual populations by technology
The detection rate for the A/O dual population was highest using column agglutination technology (CAT) at 94% overall cf. 57% for non-CAT (p<0.001). The MF reaction was recorded by 100% Grifols users, 97% BioVue users and 91% DiaMed users. It would appear that the use of automation influenced the variation within CAT as 100% of testing by Grifols is automated, as is 91% BioVue but only 78% DiaMed, and within the DiaMed group 96% detected the MF using automation vs. 76% using manual techniques (p<0.001).
For Patient 1, the majority of laboratories using liquid phase microplate (LPMP), or fully automated Capture which utilises LPMP for grouping, also used a second method and were therefore excluded from the ‘single technology’ analysis. However, the detection rate for the A/O dual population by LPMP alone was low at 50%, and only 3% using LPMP recorded the MF vs. anti-D for Patient 2.
The detection rate of the D+/D- dual population was a significantly higher by DiaMed (72%) than by BioVue (39%) (p<0.001). There was also a significant difference (p<0.001) between the detection rate of the A/O and D+/D- dual populations by BioVue (as seen in exercises 10R7 and 08R8), but this time this effect was also apparent by DiaMed (p=<0.001). Reactions recorded where a MF reaction was not detected
Where a MF reaction was not recorded vs. anti-D the alternative response varied from negative to strong positive, with the majority reporting a negative reaction. However, there were three trends within this data.
Firstly, a weak reaction was recorded by 18/87 (21%) of those using BioVue as a single technology cf. only by 3/177 (2%) of those using DiaMed (p<0.001). This pattern was also seen in exercise 10R7 where 24% BioVue users recorded a weak reaction vs. anti-D, and it was speculated that this could perhaps be due to the effect of shear forces and the affinity of the anti-D reagent.
Secondly, 97% of those missing the MF by LPMP recorded a negative reaction vs. anti-D, and all of these used automation. It is possible that MF reactions vs. anti-D were disrupted by agitation of the plates.
Thirdly, for Patient 2, the majority strong positive reactions obtained vs. anti-D by CAT were obtained in manual testing, with 69% of those testing manually reporting a strong positive reaction cf. 3% of those using automation (p<0.001). This could be due to the reaction at the top of the column being immediately noticeable during manual reading whilst the negative cells at the bottom of the column are overlooked. Reproducibility of MF reactions
A few anecdotal reports were received following exercise 15R4, of MF reactions being detectable/non-detectable when testing several times using the same technology and method. It has been speculated that, in some circumstances, variation in centrifugation of the sample could influence detection of dual populations. The clinical relevance of recognising a dual population of red cells
There are several ways in which an inappropriate clinical decision can be made regarding transfusion of a patient with a dual population of red cells. A MF reaction might not occur in the testing system used, or it might occur but not be recognised, or even if recognised it might still lead to an inappropriate grouping interpretation or choice of blood components.
There are a number of clinical scenarios resulting in dual populations of red cells, with the most common being the transfusion of ABO/D compatible, non-identical blood. A rarer situation, but of utmost

Appendix 5
UK NEQAS (BTLP) Bi-ennial Report for 2014 and 2015
Page 65 of 112
importance, is where the sample is from a post stem cell transplant recipient, either during the engraftment period or when the graft is failing. Failure to obtain or recognise a mixed field reaction in this situation could lead to blood components of the incorrect ABO/D group being transfused, and other special requirements being overlooked. This is also of clinical relevance to laboratories in non-transplant centres, where care is shared, or where transplant patients present with unrelated conditions in routine or emergency settings. Rarely, a mixed field reaction may be attributed to factors such as permanent chimerisms or ABO subgroups; however, it is still important to identify the cause before making a decision on the most appropriate blood group to transfuse. A mixed field reaction may also be the first sign that a clinically unrecognised ABO incompatible transfusion has taken place. Its recognition is therefore critical, to avert the potential for additional ABO incompatible units being transfused. This is especially relevant where no reverse group is performed in the presence of a historical group, as is routine practice for 24% of laboratories (2015 Pre-transfusion testing questionnaire).
Patient 2 was reported as D positive or D variant by 15% of those recording a mixed field reaction vs. anti-D (unchanged since a similar exercise - 10R7), where without a clinical history the laboratory result would give no indication as to whether the original group was D positive or D negative. For Patient 1, an interpretation of group A was made by 31% (cf. 22% in 10R7) of those recording a mixed field reaction vs. anti-A. This may have been due to the lack of any anti-A in the reverse group, indicative of a ‘group A’ patient transfused with group O donor cells. However, without a history, it would have been prudent to defer drawing a conclusion or issuing blood other than group O1. Conclusions
Although the overall detection rates for an A/O dual population have improved over time, it seems that the detection of a D+/D- mixed field is more variable. Also, D typing misinterpretations are potentially being made even where mixed field reactions are recognised. Further investigation is still required to look at the potential effects of sample centrifugation, and for possible mechanisms for not detecting a mixed field reaction where there are a minority of D positive cells (as in 10R7), and to explain the observation of alternative reactions where mixed field reactions would be expected. Reference 1BCSH guidelines for pre-transfusion compatibility testing in blood transfusion laboratories. Transfusion Medicine volume 23, issue 1, pages 3-35 February 2013, and at www.bcshguidelines.com (accessed 23/7/15)

Appendix 6
UK NEQAS (BTLP) Bi-ennial Report for 2014 and 2015
Page 66 of 112
Summary of Data for UI submissions January 14 to December 15 (UK and non-UK)
Table 1 – Details by exercise
Table 2 – Reasons for disagreeing with the UI submissions
Category No.
submissions
Could have identified the antibody with the IAT panel results submitted 3
False positive or false negative reactions recorded 3
Could have excluded additional antibody (ies) based on IAT results submitted
6
Could have excluded Rh antibody with negative reactions in enzyme 3
Total 15
Exercise Code
Antibodies No. UI returns
No. agreed No.
disagreed
14E2 Jka 3 3 0
14E2 c+Fya 20 16 4
14E3 c 5 5 0
14R4 Jka 9 9 0
14E6 Jka+Fya 3 0 3
14E8 e 20 18 2
14E8 S (+ENS) 6 4 2
14R9 c 2 2 0
15R1 Jka 1 1 0
15E3 c 3 3 0
15R4 D+Jkb 1 0 1
15E5 Fya (+ENS) 1 1 0
15R7 c 1 1 0
15E8 c+K 5 4 1
15E8 c+M 6 5 1
15E10 Fya 1 0 1
Total 87 72 15

Appendix 7
UK NEQAS (BTLP) Bi-ennial Report for 2014 and 2015
Page 67 of 112
Acceptance of a result of UI for antibody identification This process should only be used where antibodies of likely clinical significance cannot be fully elucidated or excluded. N.B. UK NEQAS (BTLP) samples do not contain more than two specificities, so if you have positively identified two specificities please do not make an UI submission. The following rules apply:
a. the following will incur penalties
o Misinterpretations contributed to by false negative or false positive reactions. o If a specificity (actually present) is not entered as positively identified and we feel
that it can be identified based on two positive and two negative reactions (as stated in BCSH guidelines) by whatever method is appropriate (e.g. IAT, OR enzymes in the case of Rh). This will be based on a maximum of 2 antibodies being present. (N.B: Serological reactions obtained with the antibody screening cells should be included in the interpretation).
o If a specificity not actually present is entered as positively identified. o If a specificity is entered as ‘cannot be excluded’, but we feel that it can be excluded,
either because of one or more negative reactions with an appropriate antigen positive cell, or because of one or more negative reactions by a particular method. For example, stating that an Rh antibody cannot be excluded from an antibody mixture in the presence of a negative result with an enzyme treated cell carrying the corresponding antigen would incur a penalty.
o If a specificity is entered as ‘cannot be excluded’, but the patient phenotype provided shows that the patient is positive for the corresponding antigen.
o If a clinically significant antibody is not identified in the presence of an enzyme non-specific antibody.
b. the following will not incur penalties
o Being unable to exclude a specificity in line with BCSH guidelines. E.g. having no homozygous cell available to exclude anti-Jka.
o Including a specificity (if actually present) even if the inclusion does not comply with BCSH guidelines (e.g. only one r’r cell).
o If an antibody (actually present) is reacting with homozygous but not with heterozygous cells, and is recorded as ‘cannot be excluded’ rather than as ‘positively identified’. However, this would only apply if our in-house testing also found non-reactivity with heterozygous cells by the same technique; otherwise, this would be classed as a false negative result.

Appendix 7
UK NEQAS (BTLP) Bi-ennial Report for 2014 and 2015
Page 68 of 112
c. the following documentation is required for a UI submission to be considered o The UI box should be marked in addition to any boxes for antibodies that you can
confidently identify.
o The UI submission must include details of antibodies that cannot be positively identified, but cannot be excluded, and your explanation of why identification cannot be confirmed.
o Copies of all panel sheets showing the reactions recorded, (including those used for
antibody screening) must be returned with your exercise result sheet and marked with your PRN.
If supporting paperwork is not submitted, antibodies recorded as positively identified will be considered as your result for performance monitoring purposes.
o Copies of all panel sheets showing the reactions recorded, (including those used for antibody screening) must be returned with your exercise result sheet and marked with your PRN.
o If supporting paperwork is not submitted, antibodies recorded as positively identified
will be considered as your result for performance monitoring purposes.

Appendix 8
UK NEQAS (BTLP) Bi-ennial Report for 2014 and 2015
Page 69 of 112
UK NEQAS for Blood Transfusion Laboratory Practice (BTLP) ABO titration pilot annual summary 2014/15
Introduction
The UK NEQAS (BTLP) ABO titration pilot has been running since an exploratory pilot exercise in 2009 revealed a wide variation of methodology in use, the titration results obtained and their use in the ABO incompatible (ABOi) transplant context. The main focus of the pilot is to look at ABO titration in laboratories supporting ABOi transplant, and by the end of this reporting period, 50 such laboratories were registered.
Since 2010, results obtained with ‘standard’ indirect antiglobulin (IAT) and direct room temperature (DRT) techniques based on DiaMed (as the most commonly used technology) have been requested alongside those using in-house techniques, in an attempt to allow a more direct comparison of results. The standard technique used in 2014/15 is attached as Appendix 1.
The reports issued for each pilot exercise during 2014/15 provided the median and range of results by method and included individual results for each laboratory. This report provides a more detailed analysis of the results. Summary of exercises distributed in 2014-15
Table 1 shows a summary of the exercises distributed during the 2014/15 exercise cycle. All plasma samples issued were group O, and group A1 cells were provided for titration. Shaded cells represent duplicate or replicate samples as defined within the table.
Table 1: Summary of ABOT exercises 2014/15
Data 14/15 ABOT1
June 2014 14/15 ABOT2
Sept 2014 14/15 ABOT3
Dec 2014 14/15 ABOT4
Mar 2015
Number of participants registered
87 (40 UK) 87 (39 UK) 91 (39 UK) 91 (39 UK)
Return rate 93% 94% 95% 90%
Number Std. results 59 DRT 71 IAT
62 DRT 68 IAT
63 DRT 71 IAT
62 DRT 71 IAT
Number in-house results 45 DRT
27 IAT, 10 DTT2 44 DRT
27 IAT, 10 DTT2 43 DRT
25 IAT, 11 DTT2 45 DRT
19 IAT, 13 DTT2
Plasma sample 1 Group and titre1
128 DRT 128 IAT
32 DRT 128 IAT
8 DRT 16 IAT
32 DRT 128 IAT
Plasma sample 2 Group and titre1
2 DRT 1 IAT
32 DRT 128 IAT
32 DRT 32 IAT
16 DRT 16 IAT
Plasma sample 3 Group and titre1
128 DRT 256 IAT
128 DRT 256 IAT
128 DRT 256 IAT
64 DRT 64 IAT
Cells provided for titration A1rr A1rr A1rr A1rr
Duplicate samples within exercise
None P1 and P2 None None
Replicate samples between exercises
Patient 3 14/15 ABOT1, T2 and
T3
Patient 3 14/15 ABOT1, T2 and
T3
Patient 3 14/15 ABOT1, T2 and
T3
Additional information collected
None Reproducibility
for duplicate samples
Workload and reasons for
titration None
1 Titres shown are median results obtained with the standard technique 2 Plasma treated with DTT or equivalent

Appendix 8
UK NEQAS (BTLP) Bi-ennial Report for 2014 and 2015
Page 70 of 112
Participation
During the 2014/15 exercise cycle, a total of 98 laboratories were registered for the ABOT pilot Scheme for at least part of the year, with 85 laboratories remaining registered for all four exercises. However, not all laboratories returned results for all exercises.
Workload and clinical indications for undertaking titration
In December 2014, additional questions on clinical indications for titration and workload were included with exercise 14/15ABO T3, to which 82 laboratories responded. The percentage of laboratories reporting each titration workload range for each clinical category is shown for all laboratories, for UK laboratories (including Republic of Ireland) and for non-UK laboratories in figures 1 – 3 respectively. Table 2 shows the % of laboratories overall, in the UK and outside the UK, performing titration for a range of clinical indications. Table 2: Clinical indications for ABO titration
Clinical indication % Laboratories
All (n=82) UK (n=35) Non-UK (n=47)
ABOi renal transplant (Tp) 51.2 62.9 42.6
ABOi other solid organ transplant (SO Tp) 23.2 25.7 21.3
Haemopoetic Stem Cell Transplant (HSCT) 62.2 48.6 72.3
ABO Haemolytic disease of the newborn (HDFN) 39.0 28.6 46.8
Other 20.7 17.1 23.4
Fig. 1: Workload - all laboratories Fig. 2: Workload - UK laboratories
Fig. 3: Workload - non-UK laboratories
14 laboratories (5 UK and ROI, 9 non-UK)
test fewer than 20 samples per year for any clinical reason, including 10 (5 UK and ROI, 5 non-UK) testing <10 samples per year, and two (non-UK) apparently not performing titrations on any clinical samples.

Appendix 8
UK NEQAS (BTLP) Bi-ennial Report for 2014 and 2015
Page 71 of 112
Technology used for titration in participating laboratories Figures 4 and 5 show the technologies used to return EQA results from 2011 – 2015, using data from returns for the last exercise in each calendar year. Figs. 4 and 5: EQA returns by technology (2011 – 2015)
There has been an increasing use of the Standard techniques compared to that for other technologies. In 2014/15, the Standard technique was used for approximately 70% results returned by DRT and 80% by IAT.
Standard techniques (IAT and DRT)
The numbers returning results for the Standard DRT and IAT for each exercise can be seen in Table 1. The number of laboratories returning ‘Standard’ results showed little variation throughout the year (59-63 for DRT and 68-71 for IAT), as did the number using these results in clinical practice (23-28 DRT and 41-46 IAT). The picture is similar for laboratories using results obtained by the Standard technique to support renal transplant programmes (16-19 DRT and 25-29 IAT), where approximately half of these are in the UK.
Table 3 shows the number (%) of these laboratories with one or more result that is >1 doubling dilution from the IAT or DRT method median in each of the four exercises, and Tables 4 and 5 show the same information, but include only laboratories using their Standard results in clinical practice (for any application) and those using their results to support a renal transplant programme, respectively. Table 3: All laboratories’ Standard results in relation to Standard method median
Category
n (%) laboratories >1 doubling dilution from the median result
14/15 ABOT1 14/15 ABOT2 14/15 ABOT3 14/15 ABOT4
>1 dilution from DRT standard median
11/59 (18.6%)
9/62 (14.5%) 5/63 (7.9%) 3/62 (4.8%)
>1 dilution from IAT standard median
8/71 (11.3%) 3/68 (4.4%) 6/71 (8.5%) 7/71 (9.9%)

Appendix 8
UK NEQAS (BTLP) Bi-ennial Report for 2014 and 2015
Page 72 of 112
Table 4: Standard results used in clinical practice in relation to Standard method median
Category
n (%) laboratories >1 doubling dilution from the median
14/15 ABOT1 14/15 ABOT2 14/15 ABOT3 14/15 ABOT4
>1 dilution from DRT standard median 3/26 (11.5%) 4/24 (16.7%) 2/31 (6.5%) 1/30 (3.3%)
>1 dilution from IAT standard median 5/46 (10.9%) 1/42 (2.4%) 6/46 (13.0%) 6/46 (13.0%)
Table 5: Standard results used to support renal transplant in relation to Standard method median
Category
n (%) laboratories >1 doubling dilution from the median
14/15 ABOT1 14/15 ABOT2 14/15 ABOT3 14/15 ABOT4
>1 dilution from DRT standard median 2/18 (11.1%) 3/16 (18.8%) 1/19 (5.2%) 1/21 (4.8%)
>1 dilution from IAT standard median 2/27 (7.4%) 1/28 (3.6%) 3/27 (11.1%) 4/32 (12.5%)
Cumulative difference between standard medians and medians using ‘in-house’ (IH) techniques
The median IAT results obtained for the 12 samples distributed in 2014/15 using in house techniques (Tube, BioVue, DiaMed and Immucor technology) and the standard technique were examined for distance from the Standard median. Each result was assigned a score of 1 for each dilution above the median and of -1 for each dilution below the median.
Where the median fell between two doubling dilutions the results either side of were assigned a value of 0.5. The scores were totalled to give a cumulative score as shown in figure 6, where ‘0’ represents the IAT median using the standard technique. The numbers for other in-house methods were too small for analysis. Fig. 6: Cumulative difference IH IAT medians vs. ‘standard’ IAT median

Appendix 8
UK NEQAS (BTLP) Bi-ennial Report for 2014 and 2015
Page 73 of 112
Replicate samples (over three exercises)
Exercises 14/15ABOT1, 14/15ABOT2 and 14/15ABOT3 contained a replicate sample from a pool of plasma that was frozen in aliquots, with one thawed for each exercise. Results from laboratories who completed all three exercises using the same technology for each are included in Table 6, which shows the number (%) of results obtained with each method that were the same for all three replicates, and the number (%) where one or more result differed by one, two or more than two doubling dilutions.
Table 6: Reproducibility of titration results for the three replicate samples, by method
Method (number) Same each time Maximum difference
1 dilution 2 dilutions >2 dilutions
Std DRT (51) 11 (22%) 28 (55%) 11 (22%) 1 (2%)
All IH DRT (25) 4 (16%) 13 (52%) 6 (24%) 2 (8%)
IH DiaMed DRT (9) 1 (11%) 8 (89%) 0 (0%) 0 (0%)
IH Tube DRT (11) 3 (27%) 3 (27%) 3 (27%) 2 (18%)
Std IAT (63) 25 (40%) 33 (52%) 2 (3%) 3 (5%)
All IH IAT (14) 3 (21%) 8 (57%) 1 (7%) 2 (14%)
IH IAT DTT (9) 1 (11%) 4 (44%) 2 (22%) 2 (22%)
Results within 1 dilution over the three replicates:
56/76 (74%) all DRT results
68/77 (88%) all IAT results using non-DTT treated plasma
5/9 (56%) all IAT results using DTT treated plasma
39/51 (76%) Standard DRT results
17/25 (68%) In-house DRT results
57/63 (90%) Standard IAT results
11/14 (79%) In-house IAT results (non-DTT)
Duplicate samples (in same exercise) Exercise 14/15ABOT2 included two samples from the same pool (P1 and P2). Table 7 shows the difference between results for P1 vs. P2 in individual laboratories, displayed by technology for DRT and IAT (technologies with <5 results have not been included). Table 7: Reproducibility in testing of duplicate samples by technique
Technique (number of results)
Results P1 vs. P2
Number (%) identical
Number (%) 1 dilution apart
Number (%) >1 dilution apart
DRT Standard (62) 52 (84%) 10 (16%) 0 (0%) IAT Standard (68) 47 (69%) 20 (29%) 1 (2%)
DRT In-house (44) 32 (73%) 11 (25%) 1 (2%) IAT In-house untreated (27) 15 (56%) 12 (44%) 0 (0%)
IAT In-house DTT treated (10) 7 (70%) 3 (30%) 0 (0%)

Appendix 8
UK NEQAS (BTLP) Bi-ennial Report for 2014 and 2015
Page 74 of 112
Inter-laboratory comparison by technology For IAT, the numbers using each technology, other than the standard DiaMed method, are too small for a comparison of results to their own median to look at inter-laboratory variation by technology. However, for DRT, the Standard technique was compared with non-standard DiaMed and tube, as more than ten results were available for these technologies. Figure 7 shows the percentage of results returned by each technology that are >1 dilution away from the technology median; the numbers in brackets show the number using each technology in 14/15 ABOT4. Example histograms showing data by technology for a range of different titres (high, medium and low) are shown in Appendix 2. Fig. 7: Percentage of DRT results >1 dilution from technology median
Shadow scoring for 2014 Shadow scoring has been undertaken on the data collected in the 14/15 series of exercises, and will continue in 2015/16 using the following criteria:
Only results obtained using the Standard method or with any method used by > 20 participants are scored.
One doubling dilution lower/higher than the method median is acceptable.
Outlying results due to obvious transposition errors are not included when calculating medians.
IAT and DRT results are scored separately.
Points are allocated according to how far the result was from the method median, with an increment of one point per dilution.
There is a separate score for non-return of results.
These scores will be displayed on individual reports during 2016 for information only, and do not constitute a formal scoring system. Progress with anti-A and anti-B reference preparations (in collaboration with NIBSC) UK NEQAS (BTLP) has been working with the National Institute for Biological Standards and Control (NIBSC) to develop a reference preparation for high titre anti-A and anti-B. This preparation has been accepted as a WHO reference reagent and is now available from NIBSC as ‘High titre anti-A and anti-B in serum 14/300’ https://www.nibsc.org/documents/ifu/14-300.pdf. Many thanks to those participants who took part in the international validation process.

Appendix 8
UK NEQAS (BTLP) Bi-ennial Report for 2014 and 2015
Page 75 of 112
Discussion Titration techniques are likely to include manual steps in dilution and / or reading and therefore some variation in replicate results is to be expected. However, it would be reasonable to expect results of replicate samples to be within one doubling dilution. Replicate samples distributed in 14/15 ABOT1, T2 and T3 IAT results appear to be more reproducible than DRT results. Overall, 74% of intra laboratory results obtained by DRT and 88% by IAT (untreated plasma) were within one doubling dilution for the three replicate samples. This was examined by technique, and 90% of IAT results obtained using the standard technique were within one doubling dilution cf. 79% in-house IAT results (using untreated plasma). The DRT results were not significantly different, with 76% standard DRT results being within one doubling dilution cf. 68% in-house DRT results. It is not clear how technology affects reproducibility, apart perhaps from the method for reading the titration endpoint. These finding concur with those reported previously (annual report 2012-13), except for the DRT, where the in-house techniques (overall) appeared more reproducible based on the 2012-13 data. Only 55% of IAT results obtained using DTT treated plasma were within one dilution over the three exercises. Duplicate samples distributed in exercise 14/15 ABOT2 Two replicate samples were distributed in exercise 14/15 ABOT2, and 99% of all paired results for individual laboratories were within one dilution. The proportion of results within one doubling dilution was higher than that seen for the replicate samples sent over three exercises (14/15 ABOT2, T3 and T4). This might be because fewer replicates (2 cf. 3) were compared, or because fewer variables impacted on results of tests performed on the same day, e.g. they were less likely to have been undertaken by different individuals. Cumulative difference in-house method medians vs. Standard method medians As expected, DDT treated plasma gave a lower cumulative median than the ‘Standard’ (DiaMed) technique which uses untreated plasma. The overall in-house cumulative median was very close to that for the standard technique; however, this varied by individual in-house technology. The Immucor cumulative median was also lower, presumably since only IgG is detected using Capture technology. The other techniques had a higher cumulative median, with BioVue being the highest (see Figure 4). The position of the BioVue cumulative median remains unchanged since 2012/13, whilst tube and DiaMed (non-standard) cumulative medians have shifted from slightly negative to slightly positive relative the Standard. However, the numbers using these technologies are small and have reduced further since 2012-13. Comparisons to method medians for each technology For IAT, the numbers using each technology, other than the standard DiaMed method, are too small for a comparison of results to their own median to look at inter-laboratory variation by technology. However, for DRT, the Standard technique was compared with non-standard DiaMed and tube, as more than ten results were available for these technologies. This showed both the Standard and non-standard DiaMed techniques to have a tighter range than that for tube.

Appendix 8
UK NEQAS (BTLP) Bi-ennial Report for 2014 and 2015
Page 76 of 112
Conclusions There is still considerable variation in results obtained between techniques, and the introduction of a standard technique would facilitate the transfer of results and transplant protocols (i.e. acceptable titration values for admission to ABOi renal transplant programs and suitability for transplant) across centres.
For DRT, use of the Standard technique appears to reduce the inter laboratory range of results, compared to a tube technique, but it is not possible to establish from the 2014 data whether this is also true for IAT. Where any single technology is used, reproducibility on the day is good within one doubling dilution, but becomes more variable in a significant proportion of laboratories when replicate samples are tested on separate occasions.
It should be possible to use the NIBSC WHO reference reagent ‘High titre anti-A and anti-B in serum 14/300’ for standardising titration testing methodology for anti-A and anti-B, and for establishing consistent cut-off values in the transplant context, where appropriate. Appendices
1. Standard technique in use 2014/15. 2. Example histograms showing Standard and in-house results for individual samples distributed in
2014/15.
Appendix 1
Prepare dilutions of plasma in saline (PBS or NaCl) using a doubling dilution method. Make the dilutions with a minimum volume of 200µl, using an automatic pipette. Use a new tip to dispense each dilution.
Prepare a 0.8 - 1% red cell suspension in CellStab (use ID-diluent 2 if CellStab is not available). Read the endpoint of the titration as the last weak reaction.
LISS indirect antiglobulin test (IAT) using IgG or polyspecific cards
a) Add 50ul of cells suspended in CellStab or ID-diluent 2 to each microtube b) Add 25ul of each plasma dilution to the corresponding microtube c) Incubate at 37oC for 15’ d) Centrifuge 10’ in DiaMed centrifuge
Direct agglutination at room temperature (DRT) using NaCl cards a) Add 50ul of cells suspended in CellStab or ID-diluent 2 to each microtube b) Add 50ul of each plasma dilution to the corresponding microtube c) Incubate at RT for 15’ d) Centrifuge 10’ in DiaMed centrifuge
‘Standard’ techniques 14/15ABO T4

Appendix 9
UK NEQAS (BTLP) Bi-ennial Report for 2014 and 2015
Page 77 of 112
Proposed scoring model for UK NEQAS (BTLP) ABO titration Principles of scoring Categories of performance monitoring
Difference from median result for ‘standard’ results (and any other in-house technology with >20 laboratories). To include laboratories returning results for the standard technique(s):
1) DRT 2) 3) IAT
Definition of satisfactory results
Titration value within 1 doubling dilution of ‘target’, i.e. standard median.
‘Scores’ for ‘outlying’ results
1 point for each doubling dilution >1 away from ‘target’, e.g. if the target were 32, then one point would be incurred for results of 8 or 128, two points for 4 or 256, three points for 2 or 512 etc. To incorporate + or – signs for above or below median, but sign would be removed for cumulative scores.
Points accumulated by each of the two categories within each exercise
Points accumulated between exercises, also by category.
Additional performance information to be provided but not scored (not EQA)
Difference between duplicates in same exercise. To include all laboratories for their routine technique, i.e. if reporting results using standard and in-house (IH) techniques, then only assess IH.
3) DRT 4) IAT
Definitions of UP and PUP Definition of unsatisfactory performance (UP)
1. A total of three points in either IAT or DRT in a single survey.
2. A total of three points in either IAT or DRT over three consecutive surveys.
3. Late or non-return of results in two of three consecutive surveys.
Definition of persistent unsatisfactory performance (PUP)
1. More than one episode of unsatisfactory performance in either IAT or DRT, within 12 months.
2. Two episode of UP due to late or non-return of results in a 12 month period.
3. One episode of UP from each of the above categories (outlying results and non-return) within a 12 month period.

Appendix 10
UK NEQAS (BTLP) Bi-ennial Report for 2014 and 2015
Page 78 of 112
Report of the pre-pilot exercises for Direct Antiglobulin Test (DAT) 15R7 distributed 13 July 2015
15R9 distributed 12 October 2015
Introduction The aim of these pre-pilot DAT exercises was to assess the stability of antibody coated red cells, for the future inclusion of the DAT in the BTLP programme. The first exercise of two in the 2015-16 cycle of exercises was sent with 15R7, and the second was sent with 15R9. Participants were requested on both occasions to investigate the two samples labelled DAT 1 and DAT 2 in the same way as they would clinical samples where a DAT is requested. Participants were requested to test the samples as soon as possible after receipt (in week 1) and then repeat the testing in week 2, as part of the stability testing.
The results were collected via two Survey Monkey questionnaires, one for each exercise. The questionnaire with 15R7 included questions regarding the use of the DAT in clinical practice. Section 1 of this report gives a summary of the responses returned for these questions. The questionnaire accompanying 15R9 was enhanced to include questions regarding control results and details of repeat testing, in response to participant comments supplied during 15R7. Sections 2 and 3 include the results of the DAT samples sent with exercises 15R7 and 15R9 respectively, and section 5 a discussion of the UK results for both exercises.
The majority of participating laboratories were within the UK and the Republic of Ireland (ROI), but the pre-pilot samples were also sent to some laboratories in Portugal, Italy, Sweden, Denmark, and the Netherlands. Section 4 includes questionnaire responses and exercise data from these non-UK laboratories. This data has been analysed and reported separately as raw data, as no follow up of apparently anomalous results was possible. Material The following material was provided on both occasions:
Two red cell samples (in plasma and Alsever’s solution) for the Direct Antiglobulin Test (DAT). In 15R7:
DAT 1 was DAT negative
DAT 2 was coated with a monoclonal anti-D to give a 4+ reaction. In 15R9:
DAT 1 was coated with a weak monoclonal anti-D to give a 2+ reaction.
DAT 2 was coated with a polyclonal anti-K to give a 2+ reaction. Reaction grades quoted are based on in-house pre-acceptance testing. The DAT samples were to be prepared as appropriate for the technology used.

Appendix 10
UK NEQAS (BTLP) Bi-ennial Report for 2014 and 2015
Page 79 of 112
Section 1 – Use of the DAT in clinical practice in the UK and ROI (gathered with 15R7) Table 1 shows the data returned from laboratories regarding their policy for performing a DAT. Table 1 - Circumstances in which a DAT is performed (n=160)
Circumstance No. labs
Post delivery cord samples (routine) 58 (36.3%)
Post delivery cord/neonates samples (only if HDFN suspected) 58 (36.3%)
Investigation of a transfusion reaction 158 (98.8%)
Investigation of auto immune haemolytic anaemia (AIHA) 150 (93.8%)
Routine pre-transfusion testing 9 (5.6%)
Routine donor testing 1 (0.6%)
Other 45 (28.1%)
Of the laboratories returning a detailed response to ‘other’, 16 stated they perform a DAT as part of investigating a positive antibody screen, 10 when requested by a clinician, 8 when a positive result is obtained in an ‘auto’ control when grouping a patient sample, and 8 in neonatal or other cord specific circumstances. Further comments included when haemolysis is suspected, when an incompatible crossmatch result is obtained and the patient has a negative antibody screen, and post bone marrow or haemopoietic stem cell transplantation. Table 2 shows the type and sequence of AHG reagents used in normal laboratory practice for the DAT. Table 2 - AHG reagents in use (n=160)
AHG reagent use No. labs
DAT with polyspecific AHG only 18 (11.2%)
Initial DAT with polyspecific AHG, and if positive, test with anti-IgG, anti-C3d etc. 82 (51.3%)
Panel of specific AHG reagents (+/- polyspecific AHG) from the start 54 (33.8%)
Other 61 (3.7%) 1Five laboratories have different protocols depending on the patient type Automation is used for undertaking the DAT by 85/159 (54.1%) laboratories. The technologies in use for DAT are shown in Table 3; 22 laboratories use more than one technology in clinical practice. Table 3 – Technology used for the DAT
Technology Number of laboratories (n=159) Use as single technology
BioVue 42 (26.4%) 30/42 (71.4%)
DiaMed (BioRad) 105 (66.0%) 95/105 (90.5%)
Grifols 9 (5.7%) 9/9 (100%)
Immucor 5 (3.1%) 1/5 (20%)
Tube 192 (11.9%) 3/19 (15.8%) 2One laboratory returned a response of ‘manual’, and was added to the tube category

Appendix 10
UK NEQAS (BTLP) Bi-ennial Report for 2014 and 2015
Page 80 of 112
Section 2 - 15R7 DAT results in the UK and ROI Return rate / data analysis The pre-pilot with 15R7 was distributed to 234 laboratories, 187 in the UK and Republic of Ireland (ROI) and 47 outside of the UK. Results were returned by 206/234 (88.0%) UK and non-UK laboratories by the closing date, with one returning two sets of results (for two different technologies). The return rate for the UK and ROI laboratories was 160/187 (85.6%), and 46/47 (97.9%) for non-UK laboratories.
158/160 (98.8%) of UK and ROI laboratories reported that they had received the samples between 13/07/2015 to 19/07/2015, i.e. during week 1. Of these, 128 (80.0%) reported that they had tested both samples during week 1 and again during week 2 (20/07/2015 to 27/07/2015), and supplied results of the testing. Only these results are included in the analysis in this section. UK and ROI laboratories were telephoned to clarify transcription and transposition errors, however non-UK laboratories were not. Reported sample quality All laboratories in the UK and ROI reported satisfactory sample quality for both DAT samples on first inspection during week one. 12/156 laboratories (7.7%) reported unsatisfactory sample quality due to haemolysis for one or both samples during testing in week 2. Results of in-house testing Results of the DAT with in-house testing at distribution and at closing of exercise 15R7 showed that sample DAT 1 was negative and that DAT 2 was 4+ positive vs. polyspecific AHG (not tested vs anti-IgG). Participants DAT results DAT 1 results (negative)
Eighty-four laboratories reported results vs. polyspecific AHG for DAT 1 in week 1 and week 2. Eighty-two of these laboratories reported negative results for both weeks. One laboratory reported false positive results vs. polyspecific AHG and anti-IgG in both weeks, and a further laboratory reported a false positive result vs. polyspecific AHG in week 2 only. When contacted, both of these laboratories confirmed that they had made transcription errors during data entry.
Sixty-seven laboratories reported results vs. anti-IgG for DAT 1 in week 1 and week 2. Sixty-one of these laboratories reported negative results for both weeks. Five laboratories returned positive results for either one week or both; of these, four had transposed results for DAT 1 and DAT 2, and one reported false positive reactions in both weeks vs anti-IgG due to transcription errors. One further laboratory returned a weakly positive reaction after testing during week 2, but a negative reaction was obtained on this sample when it was returned and tested by UK NEQAS. DAT 2 results (4+ positive vs. anti-IgG)
Tables 4 to 6 show the reaction grades obtained for DAT 2 in week 1 vs. those obtained in week 2 for the same laboratory, vs. polyspecific AHG, anti-IgG and anti-C3d, respectively. The shaded cells represent identical reactions in both weeks. Figures 1 and 2 show the reaction grades reported in week one on the x axis with those recorded by the same laboratory in week 2 displayed in the columns, vs. polyspecific AHG and anti-IgG respectively.

Appendix 10
UK NEQAS (BTLP) Bi-ennial Report for 2014 and 2015
Page 81 of 112
Table 4 - Reaction grades for DAT 2 vs. polyspecific AHG in week 1 vs. week 2 (n=89)
No. labs
DAT 2 vs Polyspecific AHG
Result week 1 Result week 2
4+ 3+ 2+ Neg
771 4+ 65 9 1 12
11 3+ 4 6 1 0
1 2+ 0 0 1 0 1One laboratory did not report a result vs polyspecific AHG in week 2 2One laboratory reported a negative reaction for week 2, due to a transcription error. Figure 1 – Reaction grades for DAT 2 vs. polyspecific AHG in week 1 vs. week 2
Table 5 - Reaction grades obtained for DAT 2 vs. anti-IgG in week 1 vs. those obtained in week 2 for the same laboratory (n=113)
No. labs
DAT 2 vs Anti-IgG only
Result week 1 Result week 2
4+ 3+ 2+ Neg
881 4+ 74 11 1 0
21 3+ 9 11 1 0
2 2+ 1 0 1 0
2 Neg 12 0 0 13 1Two laboratories did not return a result vs anti-IgG in week 2 2One laboratory reported a false negative in week 1, due to a transcription error 3One laboratory reported a negative reaction in week 2 due to a transposition error Figure 2 - Reaction grades for DAT 2 vs. anti-IgG in week 1 vs. week 2
In week 2, 88.1% of laboratories reported a reaction strength the same as or stronger than that reported in week 1 for DAT 2 vs. anti-IgG. One laboratory reported a reaction strength of 2 grades lower during week 2 than in week 1, whilst another laboratory reported a reaction strength of 2 grades higher.

Appendix 10
UK NEQAS (BTLP) Bi-ennial Report for 2014 and 2015
Page 82 of 112
Table 6 - Reaction grades obtained for DAT 2 vs. anti-C3d in week 1 vs. those obtained in week 2 for the same laboratory (n=103)
No. labs
DAT 2 vs Anti-C3d only
Result week 1 Result week 2
4+ 3+ 2+ 1+ Neg
4 4+ 2 1 1 0 0
101 3+ 0 8 0 1 0
5 2+ 0 0 4 1 0
1 1+ 0 0 0 1 0
84 Negative 0 0 0 1 83 1One laboratory did not return a result vs anti-C3d in week 2 Of the 20 UK and ROI laboratories reporting a positive reaction for DAT 2 vs. anti-C3d, 19 tested in BioVue and one in BioRad (DiaMed). Although there was no specific provision in the questionnaire to report a result vs. a control, 4 out of these 12 BioVue users reported in the comments section that they had obtained a positive reaction vs. a negative control well, with one going on to state that they had achieved a negative result vs. anti-C3d (and the negative control) in BioRad. Twenty-two laboratories reported results vs. anti-IgA for DAT 2 in week 1 and week 2, and all of these reported negative results for both weeks. Table 7 summarises the number (%) of laboratories recording a stronger or weaker reaction grade in week 2 compared to that recorded for week 1. Those reporting inconsistent reactions due to transcription or transposition errors, and those changing to a MF reaction in week 2, have been excluded. Table 7 - Number (%) laboratories recording a stronger or weaker reaction in week 2 cf. week 1
Reactants Reaction grade recorded in week 2 compared to week 1
Stronger Weaker
DAT 2 vs. polyspecific AHG (n=87) 4 (4.6%) 11 (12.6%)
DAT 2 vs. anti-IgG (n=109) 10 (9.1%) 13 (11.9%)
Reported sample quality vs. results Twelve laboratories reported unsatisfactory sample quality upon inspection during week 2 for one or both DAT samples. However, all of these laboratories obtained the expected results during week 1 and week 2 for both samples, and only one of these reported a lower reaction grade for DAT 2 during week 2 (vs anti-IgG).

Appendix 10
UK NEQAS (BTLP) Bi-ennial Report for 2014 and 2015
Page 83 of 112
Section 3 – 15R9 DAT results in the UK and ROI Return rate / data analysis
The pre-pilot with 15R9 was distributed to 243 laboratories, 190 in the UK and ROI and 53 outside of the UK. Overall, results were returned by 195/243 laboratories, 146 (76.8%) in the UK, and 49 (92.4%) non-UK laboratories by the closing date.
144/146 (98.6%) UK and ROI laboratories reported they had received the samples between 12/10/2015 and 18/10/2015, i.e. during week 1. Of these, 120 (83.3%) reported they had tested both samples during week 1 and again during week 2 (19/10/2015 to 26/10/2015), and supplied results of the testing. Only these results are included in the analysis in this section. UK and ROI laboratories were telephoned to clarify where negative results were reported where not expected, however non-UK laboratories were not. Reported sample quality
Overall, unsatisfactory sample quality due to haemolyisis was reported by 31/120 (25.8%) laboratories, with 15 noting haemolysis for DAT 1 only, five for DAT 2 only, and a further 11 for both samples. 7/120 (5.8%) reported unsatisfactory sample quality due to slight haemolysis in week 1, and these laboratories also returned a response of slight or significant haemolysis in one or both samples for week 2. A further 24/120 (20%) laboratories reported unsatisfactory sample quality for one or both samples during testing in week 2 only. Results of in-house testing
Results of the DAT with in-house testing at distribution and at closing of exercise 15R9 showed that vs. anti-IgG, DAT 1 (coated with anti-D) was 2+ positive, and DAT 2 (coated with anti-K) was 2+ positive. Participants’ DAT results
DAT 1 results (2+ positive vs. anti-IgG, coated with anti-D)
Tables 8 and 9 show the reaction grades obtained for DAT 1 in week 1 vs. those obtained in week 2 for the same laboratory, vs. polyspecific AHG and anti-IgG respectively. Identical reactions in week 1 and week 2 are shaded. Figures 3 and 4 show the reaction grades reported in week one on the x axis with those recorded by the same laboratory in week 2 displayed in the columns, vs. polyspecific AHG and anti IgG, respectively. Table 8 - Reaction grades for DAT 1 vs. polyspecific AHG in week 1 vs. week 2 (n=74)
No. labs
DAT 1 vs. polyspecific AHG
Result week 1 Result week 2
4+ 3+ 2+ 1+ MF
3 4+ 0 2 0 0 1
36 3+ 0 24 12 0 0
29 2+ 0 3 23 2 1
4 1+ 0 0 1 3 0
2 MF 0 0 0 0 2

Appendix 10
UK NEQAS (BTLP) Bi-ennial Report for 2014 and 2015
Page 84 of 112
Figure 3 - DAT 1 vs. polyspecific AHG in week 1 vs. week 2
Table 9 - Reaction grades for DAT 1 vs. anti-IgG in week 1 vs. week 2 (n=107)
1This laboratory returned a result of 2+ vs polyspecific AHG in both weeks Figure 4 - Reaction grades for DAT 1 vs. anti-IgG in week 1 vs. week 2
DAT 2 results (2+ positive vs. anti-IgG, coated with anti-K)
Tables 10 and 11 show the reaction grades obtained for DAT 2 in week 1 vs. those obtained in week 2 for the same laboratory, vs. polyspecific AHG and anti-IgG respectively. Identical reactions in week 1 and week 2 are shaded. Figures 5 and 6 show the reaction grades reported in week one on the x axis with those recorded by the same laboratory in week 2 displayed in the columns, vs. polyspecific AHG and anti-IgG, respectively.
No. labs
DAT 1 vs. anti-IgG
Result week 1 Result week 2
4+ 3+ 2+ 1+ MF Neg
3 4+ 0 0 2 0 1 0
43 3+ 0 30 13 0 0 0
53 2+ 0 3 43 5 2 0
4 1+ 0 1 1 2 0 0
3 MF 0 0 2 0 1 0
1 Neg 0 0 0 0 0 11

Appendix 10
UK NEQAS (BTLP) Bi-ennial Report for 2014 and 2015
Page 85 of 112
Table 10 - Reaction grades for DAT 2 vs. polyspecific AHG in week 1 vs. week 2 (n=74)
1 One was found to be positive on repeat when the sample was returned to UK NEQAS. The other could not repeat the testing as the samples had been discarded, and these were reported using a tube method. Figure 5 - DAT 2 vs. polyspecific AHG in week 1 vs. week 2
Table 11 - Reaction grades for DAT 2 vs. anti-IgG in week 1 vs. week 2 (n=106)
1This laboratory also reported a result of 1+ vs polyspecific AHG in both weeks
No. labs
DAT 2 vs. polyspecific AHG
Result week 1 Result week 2
4+ 3+ 2+ 1+ Weak Neg MF
2 4+ 0 2 0 0 0 0 0
7 3+ 0 4 3 0 0 0 0
45 2+ 0 1 36 8 0 0 0
13 1+ 0 1 3 7 1 0 1
5 Weak 0 0 0 0 5 0 0
2 Neg 0 0 0 0 0 21 0
No. labs
DAT 2 vs. anti-IgG
Result week 1 Result week 2
4+ 3+ 2+ 1+ MF Weak Neg
1 4+ 0 1 0 0 0 0 0
16 3+ 0 10 6 0 0 0 0
56 2+ 0 1 46 9 0 0 0
26 1+ 0 0 5 14 2 5 0
1 MF 0 0 0 0 1 0 0
5 Weak 0 0 0 1 0 4 0
1 Neg 0 0 0 0 0 0 11

Appendix 10
UK NEQAS (BTLP) Bi-ennial Report for 2014 and 2015
Page 86 of 112
Figure 6 - DAT 2 vs. anti-IgG in week 1 vs. week 2
Thirteen laboratories reported results vs. anti-IgA for DAT 1 and DAT 2 in both weeks. Twelve of these laboratories reported negative results for both weeks, and one reported a mixed field reaction for DAT 1 in week 2, presumably due to a data entry error, as the response for DAT 2 for the same week was given as ‘not tested’. Table 12 shows the number (%) of laboratories recording a stronger or weaker reaction grade in week 2 compared to that recorded for week 1. Those changing to a MF reaction in week 2 have been excluded. Table 12 - Number (%) laboratories recording a stronger or weaker reaction in week 2 cf. week 1
Reactants Reaction grade recorded in week 2 compared to week 1
Stronger Weaker
DAT 1 vs. polyspecific AHG (n=72) 4 (6%) 16 (22%)
DAT 1 vs. anti-IgG (n=101) 5 (5%) 20 (20%)
DAT 2 vs. polyspecific AHG (n=71) 5 (7%) 14 (20%)
DAT 2 vs. anti-IgG (n=103) 7 (7%) 21 (20%)
Reporting of a lower reaction grade in week 2 does not appear to be linked to any specific technology. Eight laboratories reported mixed field reactions for either one or both samples in weeks 1 or 2. Seven of these laboratories used BioVue, and one used DiaMed. Results vs. anti-C3d Only two laboratories reported a positive reaction for DAT1 vs. anti-C3d (1 Grifols and 1 tube), and for DAT2, three reported a weak positive reaction vs. anti-C3d (2 BioVue and 1 Grifols). None of these were associated with a positive reaction in the control well (cf. 15R7 – page 5). Reported sample quality vs. results The data from the 24 laboratories reporting unsatisfactory sample quality in week 2 only (equating to 33 results) was analysed to see if there was any correlation between deterioration of the sample (examined by reported sample quality) and a weaker reaction grade reported in week 2. For these 24 laboratories, 12/33 (36.4%) results were weaker in week 2 cf. 37/192 (19.3%) results for laboratories reporting satisfactory sample quality in both weeks. The analysis showed that there appears to be a trend for reporting a weakened reaction grade following degradation of the sample quality in week 2 (p=0.03).
Appendix 10
UK NEQAS (BTLP) Bi-ennial Report for 2014 and 2015
Page 87 of 112
Section 4 - DAT pilot results for overseas laboratories Use of the DAT in clinical practice Table 14 shows the data returned from laboratories overseas regarding their policy for performing a DAT. Table 14 - Circumstances in which a DAT is performed (n=46)
Circumstance No. labs
Post delivery cord samples (routine) 23 (50%)
Post delivery cord/neonates samples (only if HDFN suspected) 18 (39.1%)
Investigation of a transfusion reaction 41 (89.1%)
Investigation of auto immune haemolytic anaemia (AIHA) 42 (91.3%)
Routine pre-transfusion testing 5 (10.9%)
Routine donor testing 3 (6.5%)
Other 11 (23.9%)
Table 15 shows the type and sequence of AHG reagents used in normal laboratory practice for the DAT. Table 15 - AHG reagent use (n=46)
AHG reagent use No. labs
DAT with polyspecific AHG only 7 (15.2%)
DAT with polyspecific AHG, and if positive, test with anti-IgG, anti-C3d etc. 34 (73.9%)
Panel of specific AHG reagents (+/- polyspecific AHG) from the start 4 (8.7%)
No response 1 (2.2%)
Automation is used for the DAT in 26/46 (56.5%) overseas laboratories. The technologies in use are shown in Table 16; 36 laboratories used more than one technology. Table 16 - Technology used for the DAT
Technology Number of laboratories (n=46) Used as single technology
BioVue 13 (28.3%) 3/13 (23.1%)
DiaMed (BioRad) 32 (69.6%) 20/32 (62.5%)
Grifols 7 (15.2%) 6/7 (85.7%)
Immucor 7 (15.2%) 0/7 (0%)
Tube 10 (21.7%) 0/10 (0%)
15R7 DAT Results Results were returned by 46 laboratories.
All laboratories who reported a response to the sample quality question returned satisfactory sample quality for DAT 1 in week 1. 5/44 (11.4%) laboratories returned unsatisfactory sample quality for DAT 1 in week 2 due to haemolysis. 1/44 (2.3%) laboratories reported unsatisfactory sample quality for DAT 2 in week 1, and 6/44 (13.6%) in week 2, all citing haemolysis.
42/46 (91.3%) laboratories reported they had received the samples between 13/07/2015 to 19/07/2015, i.e. during week 1. Of these, 38/46 (%) reported they had tested both samples during week 1 and again during week 2 (20/07/2015 to 27/07/2015), and supplied results of the testing.
All laboratories reported negative results for DAT 1 during both weeks, and against polyspecific and monospecific AHG reagents.

Appendix 10
UK NEQAS (BTLP) Bi-ennial Report for 2014 and 2015
Page 88 of 112
Tables 17 to 19 show the results returned for DAT 2. Identical reactions in week 1 and week 2 are shaded. Table 17 - Reaction grades obtained in week 1 vs. those obtained in week 2 for the same laboratory vs. polyspecific AHG for DAT 2.
DAT 2 vs Polyspecific AHG
Result week 1 Result week 2
Result No. labs 4+ 3+ 2+ 1+
4+ 26 24 1 1 0
3+ 8 3 5 0 0
1+ 1 0 0 0 1
Table 18 - Reaction grades obtained in week 1 vs. those obtained in week 2 for the same laboratory vs. anti-IgG only for DAT 2.
DAT 2 vs Anti-IgG only
Result week 1 Result week 2
Result No.labs 4+ 3+ 2+ 1+
4+ 19 18 0 1 0
3+ 8 1 7 0 0
1+ 1 0 0 0 1
Table 19 - Reaction grades obtained in week 1 vs. those obtained in week 2 for the same laboratory vs. anti-C3d only for DAT 2.
DAT 2 vs Anti-C3d only
Result week 1 Result week 2
Result No. labs 4+ 3+ 2+ 1+ wk Neg
4+ 1 1 0 0 0 0 0
3+ 1 0 1 0 0 0 0
Negative 23 0 0 0 1 1 21
From the data collected for DAT 2, 2/26 (7.7%) laboratories who reported a reaction strength of 4+ vs. polyspecific AHG during week 1 went on to report a weaker reaction in week 2. 3/8 (37.5%) laboratories reported that the reaction strength of the DAT vs. polyspecific AHG increased by one grade.
2 laboratories reported a positive reaction in an internal negative control, in the ‘comments’ section of the questionnaire. Both of these laboratories were using Biovue technology. 15R9 Results Results were returned by 49 laboratories.
Seven laboratories reported slight haemolysis in one or both samples for either one or both weeks of testing. Three laboratories reported an insufficient sample quantity for automated testing for DAT 2.
44/49 (89.8%) laboratories reported they had received the samples between 12/10/2015 to 18/10/2015, i.e. during week 1. Of these, 36/44 (81.8%) reported they had tested both samples during week 1 and again during week 2 (19/10/2015 to 26/10/2015), and supplied results of the testing. DAT 1 results
Tables 20 and 21 show the results returned for DAT 1. Identical reactions in week 1 and week 2 are shaded.
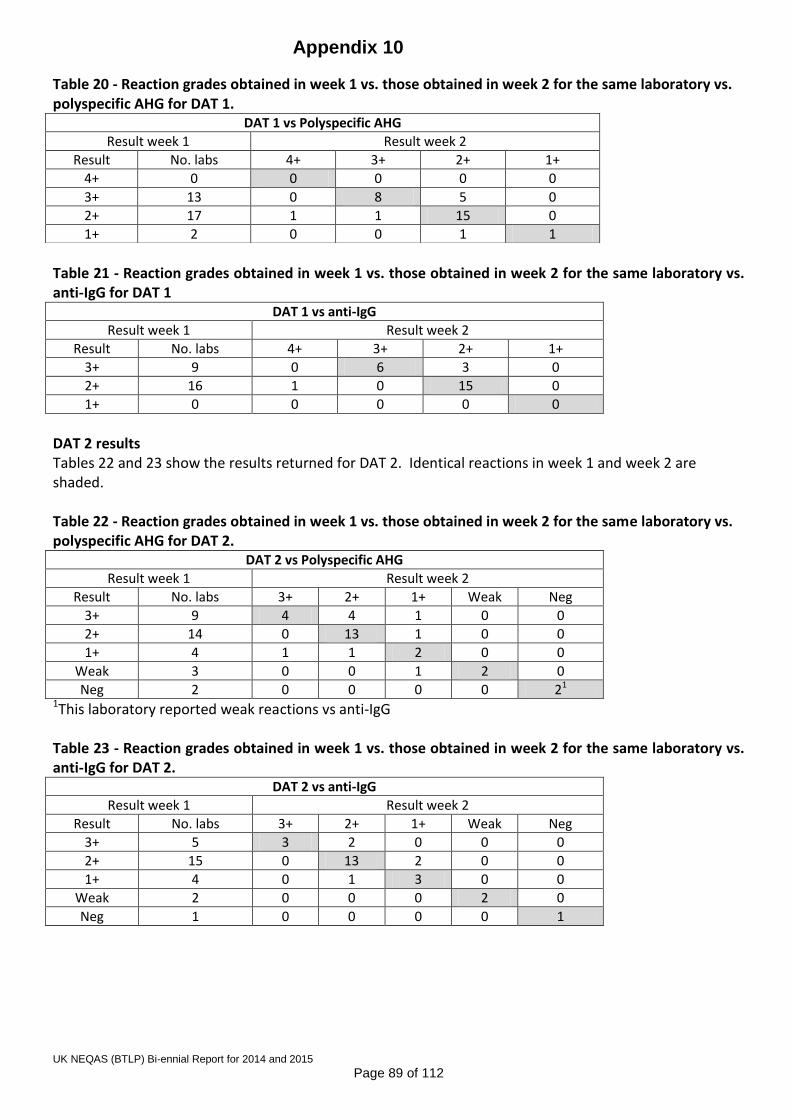
Appendix 10
UK NEQAS (BTLP) Bi-ennial Report for 2014 and 2015
Page 89 of 112
Table 20 - Reaction grades obtained in week 1 vs. those obtained in week 2 for the same laboratory vs. polyspecific AHG for DAT 1.
Table 21 - Reaction grades obtained in week 1 vs. those obtained in week 2 for the same laboratory vs. anti-IgG for DAT 1
DAT 1 vs anti-IgG
Result week 1 Result week 2
Result No. labs 4+ 3+ 2+ 1+
3+ 9 0 6 3 0
2+ 16 1 0 15 0
1+ 0 0 0 0 0
DAT 2 results Tables 22 and 23 show the results returned for DAT 2. Identical reactions in week 1 and week 2 are shaded. Table 22 - Reaction grades obtained in week 1 vs. those obtained in week 2 for the same laboratory vs. polyspecific AHG for DAT 2.
DAT 2 vs Polyspecific AHG
Result week 1 Result week 2
Result No. labs 3+ 2+ 1+ Weak Neg
3+ 9 4 4 1 0 0
2+ 14 0 13 1 0 0
1+ 4 1 1 2 0 0
Weak 3 0 0 1 2 0
Neg 2 0 0 0 0 21 1This laboratory reported weak reactions vs anti-IgG Table 23 - Reaction grades obtained in week 1 vs. those obtained in week 2 for the same laboratory vs. anti-IgG for DAT 2.
DAT 2 vs anti-IgG
Result week 1 Result week 2
Result No. labs 3+ 2+ 1+ Weak Neg
3+ 5 3 2 0 0 0
2+ 15 0 13 2 0 0
1+ 4 0 1 3 0 0
Weak 2 0 0 0 2 0
Neg 1 0 0 0 0 1
DAT 1 vs Polyspecific AHG
Result week 1 Result week 2
Result No. labs 4+ 3+ 2+ 1+
4+ 0 0 0 0 0
3+ 13 0 8 5 0
2+ 17 1 1 15 0
1+ 2 0 0 1 1

Appendix 10
UK NEQAS (BTLP) Bi-ennial Report for 2014 and 2015
Page 90 of 112
Section 5 - Discussion and conclusion of UK results Discussion The primary aim of these pre-pilot DAT exercises was to assess the stability of antibody coated red cells, prior to the introduction of a pilot scheme for DAT as an EQA exercise. Reported sample quality For exercise 15R7, satisfactory sample quality was reported by all laboratories in week 1, with 7.7% reporting some haemolysis for one or both of the samples in week 2. For 15R9, there were more reports of unsatisfactory sample quality, with 6% reporting haemolysis of one or both samples in week 1, and a further 20% reporting haemolysis in week 2 only. However, where red cells are coated with antibody, some mild haemolysis might be expected. There is some indication that there may be correlation between reported sample quality and reaction grades reported. For 15R9, the data from laboratories reporting USQ and a weaker reaction grade in week 2 was compared against that from laboratories who reported satisfactory sample quality with the same criteria, and there appears to be an association between reporting a weaker reaction grade and the presence of haemolysis in the sample in week 2 (p=0.03). Reaction grades obtained The majority of reaction grades reported by individual laboratories for all DAT positive samples (15R7 DAT 2, 15R9 DAT 1 and 15R9 DAT 2) were unchanged between week 1 and week 2.
For 15R7 DAT 2 (4+ vs. anti-IgG), the majority of laboratories recorded a 4+ reaction in week 1, significantly reducing the opportunity for higher reaction grades to be recorded in week 2. 12% of reactions grades reported in week 2 for DAT 2 vs. both polyspecific AHG and anti-IgG were weaker than the corresponding reactions recorded in week 1, but 10% were higher. None of the laboratories reporting a lower reaction grade in week 2 recorded anything less than a 2+ reaction.
The results for 15R9 DAT 1 and DAT 2 (both 2+ vs. anti-IgG), demonstrated that there can be variability in reaction strength grading within the same laboratory, as whilst the DAT is unlikely to have become stronger on storage, up to 7% of reactions recorded in week 2 were stronger than the corresponding reaction recorded in week 1. This can perhaps be explained by subjectivity between laboratory personnel in interpretation of reaction grades, where manual testing is used. Taking this into consideration, there still appears to be a bias towards recording weaker reactions in week 2, with an overall 20% of reactions recorded being reduced. Reporting of a lower reaction grade in week 2 does not appear to be linked to any specific technology.
Taking into account all the data from 15R7 and 15R9 (excluding reports of mixed field reactions), there were only three instances where the reaction grade recorded in the same laboratory during week 1 and week 2 varied by more than one grade. These were all recorded for 15R7 DAT2, where two laboratories reported 4+ in week 1 and 2+ in week 2, and one reported 2+ in week 1 and 4+ in week 2. Unexpected results There were twenty-one false positive results reported for DAT 2 vs. anti-C3d in either week 1 or week 2, with twenty in BioVue and one in DiaMed in 15R7. One laboratory, whose primary technology is BioVue, reported in the comments section that they obtained a negative result for DAT 2 vs. anti-C3d when repeated in DiaMed. Of these twenty BioVue users, four provided information in the comments section to the effect that an internal negative control gave a positive result. Overall, eleven laboratories reported a positive reaction in an internal negative control, in the ‘comments’ section of the questionnaire for 15R7. All eleven of these laboratories used BioVue technology. In response to these comments, the

Appendix 10
UK NEQAS (BTLP) Bi-ennial Report for 2014 and 2015
Page 91 of 112
questionnaire for 15R9 was amended to include questions relating to false positive reactions in an internal negative control and any further testing that this would have prompted. There were three obvious transcription and transposition errors noted during analysis of the results for 15R7. Often, entry of DAT results into the LIMS in a clinical laboratory is a manual process, or in some cases reaction grades can be automatically transmitted to the LIMS, requiring manual input of the interpretation of the DAT. Care must always be taken when manual entry and/or interpretation of any test result into a LIMS is required, and should involve a checking step as part of good laboratory practice. Section 5 shows the data obtained from overseas laboratories, the results of which generally reflect those returned by laboratories in the UK and ROI. Conclusion The results returned for all four samples have shown that the samples demonstrate reasonably good stability over a period of two weeks although there was some reduction in reaction grade in week 2 for the weaker positive DATs in 15R9. The analysis of reported sample quality vs. the results of the 15R9 samples showed that reported reduction in reaction grade is likely to be associated with degradation in sample quality. This suggests that an exercise period of one week would be appropriate for future pilot samples. The strength and specificity of the antibody used to coat the red cells has been varied, although none were less than 2+, and none were coated with C3d. These findings support the intention to proceed to a full pilot study next year, which will also include examination of the stability of complement-coated red cell samples, and weaker reactions by IgG.

Appendix 11
UK NEQAS (BTLP) Bi-ennial Report for 2014 and 2015
Page 92 of 112
Pre-Transfusion Testing Questionnaire - UK and Republic of Ireland Data collected May 2014
Introduction The purpose of this questionnaire was to update basic information on routine pre-transfusion testing procedures, last gathered in June 2013. We will continue to update this information on an annual basis. Return rate Responses were received from 302/390 (77%) laboratories, cf. 72% in 2013, 75% in 2012, 77% in 2011, 75% in 2009 and 86% in 2008. Eleven respondents stated that their laboratory does not undertake routine pre-transfusion testing, and one did not answer any questions regarding details of testing. Duplicate entries have been removed, with the most recent entry kept for inclusion in the analysis. Data from 290 hospital transfusion laboratories has been analysed. Summary and trend data Table 1 shows a summary of current data compared to historical data where available
Table 1 – Trends in routine pre-transfusion testing 2014
n=290 2013
n=278 2011
n=307 2008
n=392 2002
n=446
Automation for ‘group and screen’
Used during core hours1 86% 84% 74% 68% 41%
Proportion of full automation used 24/72 91% 93% 84% 82% NDA
Proportion of full automation interfaced to LIMS 98% 98% 98% 89% NDA
Routine ABO/D Grouping
Liquid phase microplate 11% 10% 13% 14% 41%
Column Agglutination Technology (CAT) 85% 86% 82% 77% 33%
Omit reverse group on patients with historical groups 25% 22% 24% 25% 13%
Omit reverse group on patients without historical group <1% 0% <1% <1% 1%
D typing reagents
Single anti-D used once for patients with a historical group N/A4 53% 52% 45% 15%
Single anti-D once for patients with no historical group N/A4 31% 31% 25% 5%
Routinely include IAT for D typing on apparent D negatives 8% 6% 6% 6% 3%
Include and anti-CDE reagent 6% 3% 3% 1% ≥ 10%
Routine method of establishing compatibility
Electronic issue 53% 55% 46% 37% 10%
‘Immediate’ spin 5% 7% 8% 8% 15%
IAT ( other technique(s)) 42% 39% 46% 55% 75%
IAT technology antibody screening
CAT 89% 91% 90% 90% 85%
Solid phase microplate 11% 8% 10% 9% 4%
IAT technology crossmatching
CAT 97% 98% 96% 96% 77%3
Tube 1% 1% 2% 3% 17%3
Solid phase microplate 2% 1% 2% 1% NDA 1Full automation from 2008 onwards cf. full or ‘semi’ automation in 2002 2 2011/13/14 data includes only those ‘always used out of hours’ whilst 2008 includes ‘used out of hours’ 3 2001 exercise data. NDA = no data available 4Questions removed for 2014

Appendix 11
UK NEQAS (BTLP) Bi-ennial Report for 2014 and 2015
Page 93 of 112
Analysis of 2014 data Workload n=286 Number of group and screens performed per annum Figure 1 shows the percentage laboratories within workload categories based on the approximate number of group and screens performed per year for 2014 (with previous years for comparison). Figure 1
22/42 (52%) of ROI laboratories test <5000 samples per year cf. 46/244 (19%) in the UK.
Testing outside core hours 283/290 (98%) stated that they undertake pre-transfusion testing outside core hours. IT and automation Table 2 shows the LIMS used by the 288 laboratories answering this question. 75% use iSoft or Clinisys. There were 24 other commercial IT suppliers reported, with none of these having more than ten users. Table 2 – Details of LIMS used (where stated)
IT system Number of laboratories (%)
iSoft (including CSC) 112 (39%)
Clinisys 105 (36%)
Other* 71 (25%)
Total 288 (100%)
* including four using in-house systems Booking EQA samples into the LIMS 197/290 (68%) book EQA samples into the LIMS, with no obvious correlation with the LIMS in use. Table 3 shows the number of laboratories recording each reason why EQA samples are not booked into the LIMS; some laboratories recorded more than one reason.

Appendix 11
UK NEQAS (BTLP) Bi-ennial Report for 2014 and 2015
Page 94 of 112
Table 3 – Reasons cited for not booking EQA samples into the LIMS Reason Number of laboratories
The format of the samples (i.e. not whole blood) 34
Problems with cumulative data from EQA ‘patients’ 27
Interference with workload statistics 13
Problems booking into shared databases within Trusts 14
Custom and practice 40
Other 13
23 cited ‘custom and practice’ as the only reason for not booking EQA samples into the LIMS. Use of automation within core hours Table 4 shows the use of automation for routine group and screens within core hours. Table 4 – Use of automation for group and screens during core hours
Testing Number of laboratories (%)
Full automated 249 (86%)
Semi-automated (i.e. not walkaway) 21 (1%)
No automation 39 (13%)
Total 290 (100%) 1includes one with automated reading only During core hours, approximately 97% of group and screens are tested with full automation (taking the number of group and screens performed by each laboratory to be the midpoint where the category is a range, using 500 for the <1000 category and 30000 for the >25000 category). This does not take account of urgent testing which might be undertaken manually in a laboratory with automation, even during core hours. Table 5 shows the number and % of laboratories with an interface between the automation and laboratory information management system (LIMS).
Table 5 – Automation – LIMS interface
Interface between automation and LIMS Number (%)
Bi-directional 173 (69%)
Uni-directional 72 (29%)
Not interfaced 6 (2%)
Total 251 (100%)
Use of automation for other tests Table 6 shows the number and percentage of the 251 laboratories with automation using it for tests other than ‘group and screen’. Table 6 – Use of automation by test
Test Number (%)
Antibody ID 151 (60%)
Crossmatching 84 (33%)
Phenotyping 81 (32%)

Appendix 11
UK NEQAS (BTLP) Bi-ennial Report for 2014 and 2015
Page 95 of 112
Analyser used for group and screen Table 7 shows the number and percentage of laboratories using each analyser for routine group and screens. Table 7 – Automation used for group and screen
Analyser Number (%)
DiaMed ID Gelstation 77 (31%)
DiaMed IH 1000 43 (17%)
DiaMed Banjo1 1 (<1%)
Grifols Erytra 6 (2%)
Grifols WADiana Gelstation 3 (1%)
Immucor NEO 22 (9%)
Immucor Echo 7 (3%)
Immucor Galileo 3 (1%)
Ortho AutoVue Innova 78 (31%)
Ortho AutoVue 10 (4%)
Qasar 1 1 (<1%)
Total 251 (100%) 1reader only Use of automation outside core hours 247 have full automation and stated whether it is used for testing out of hours:
225/247 (91%) always use the automation
14/247 (6%) sometimes use the automation outside core hours
8/247 (3%) never use the automation outside core hours. Details of serological testing ABO/D typing technology manual testing Table 8 shows the technology used by laboratories for primary ABO/D typing and antibody screening of patients with a previous group, using automation, manual techniques and overall. Table 8 – Technology used for primary group and screen (G+S) - manual, automated and overall
Technology Number Full auto Number semi or
Manual Total Number (%)
DiaMed G&S 120 21 141 (49%)
BioVue G&S 88 6 94 (32%)
Immucor G&S1 32 0 32 (11%)
Grifols G&S 9 0 9 (3%)
Tube G&S 0 1 1 (3%)
Tube group/DiaMed screen 0 10 10 (3%)
LPMP group/DiaMed screen 0 1 1 (<1%)
DiaMed group/BioVue screen 0 1 1 (<1%)
DiaMed group (no screen) 0 1 1 (<1%)
All techniques 249 41 290 (100%) 1group by LPMP and screen by Capture R
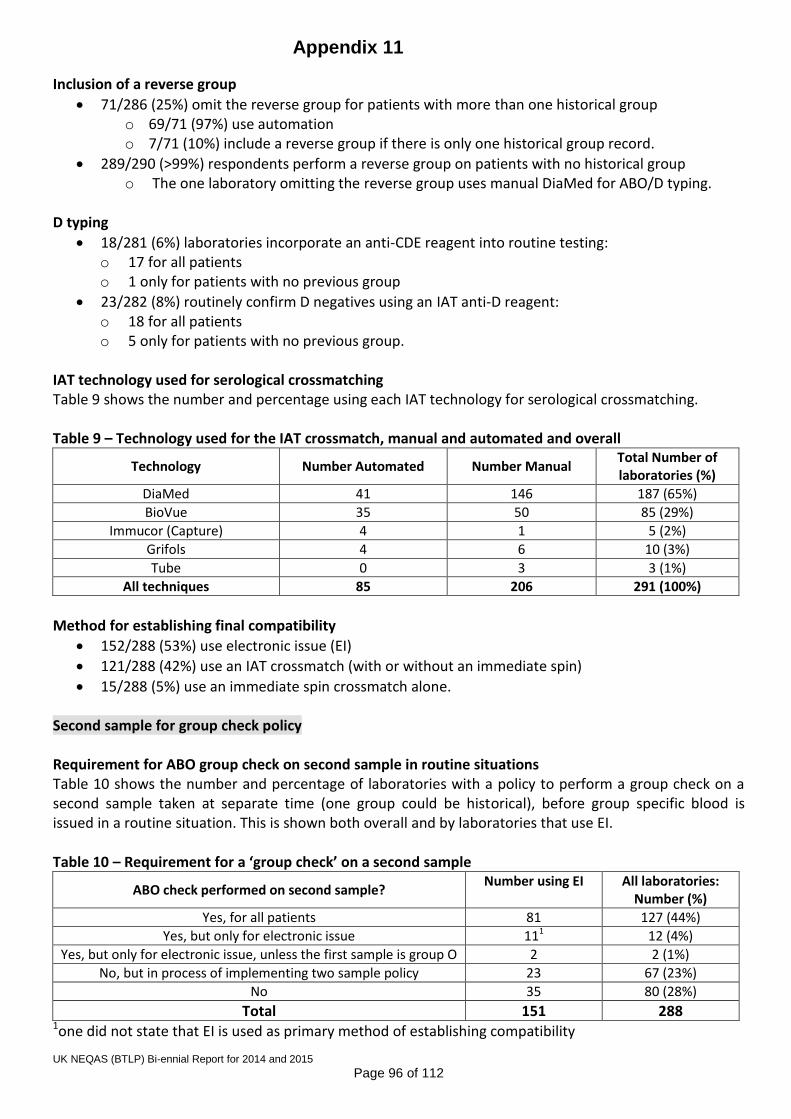
Appendix 11
UK NEQAS (BTLP) Bi-ennial Report for 2014 and 2015
Page 96 of 112
Inclusion of a reverse group
71/286 (25%) omit the reverse group for patients with more than one historical group o 69/71 (97%) use automation o 7/71 (10%) include a reverse group if there is only one historical group record.
289/290 (>99%) respondents perform a reverse group on patients with no historical group o The one laboratory omitting the reverse group uses manual DiaMed for ABO/D typing.
D typing
18/281 (6%) laboratories incorporate an anti-CDE reagent into routine testing: o 17 for all patients o 1 only for patients with no previous group
23/282 (8%) routinely confirm D negatives using an IAT anti-D reagent: o 18 for all patients o 5 only for patients with no previous group.
IAT technology used for serological crossmatching Table 9 shows the number and percentage using each IAT technology for serological crossmatching. Table 9 – Technology used for the IAT crossmatch, manual and automated and overall
Technology Number Automated Number Manual Total Number of laboratories (%)
DiaMed 41 146 187 (65%)
BioVue 35 50 85 (29%)
Immucor (Capture) 4 1 5 (2%)
Grifols 4 6 10 (3%)
Tube 0 3 3 (1%)
All techniques 85 206 291 (100%)
Method for establishing final compatibility
152/288 (53%) use electronic issue (EI)
121/288 (42%) use an IAT crossmatch (with or without an immediate spin)
15/288 (5%) use an immediate spin crossmatch alone. Second sample for group check policy Requirement for ABO group check on second sample in routine situations Table 10 shows the number and percentage of laboratories with a policy to perform a group check on a second sample taken at separate time (one group could be historical), before group specific blood is issued in a routine situation. This is shown both overall and by laboratories that use EI. Table 10 – Requirement for a ‘group check’ on a second sample
ABO check performed on second sample? Number using EI
All laboratories:
Number (%)
Yes, for all patients 81 127 (44%)
Yes, but only for electronic issue 111 12 (4%)
Yes, but only for electronic issue, unless the first sample is group O 2 2 (1%)
No, but in process of implementing two sample policy 23 67 (23%)
No 35 80 (28%)
Total 151 288 1one did not state that EI is used as primary method of establishing compatibility

Appendix 11
UK NEQAS (BTLP) Bi-ennial Report for 2014 and 2015
Page 97 of 112
93/151 (62%) laboratories using EI require a group check on a second sample compared to 48/137 (34%) using a serological crossmatch.
Testing of second sample The level of testing performed on the second sample is detailed in Table 11. Table 11 – Combinations of tests performed on the second sample
Combination of tests on the second sample Number of laboratories (%)
Full ABO/D group and antibody screen 113 (83%)
Full ABO/D group 6 (4%)
ABO forward group 17 (13%)
Total 136 (100%)
Policy for provision of red cells if a second sample is not available and blood is required urgently 123 laboratories with a group check policy for all patients (as opposed to just for those undergoing EI), answered this question. Assuming that testing has been completed on the first sample to BCSH specifications for group compatible blood, 80/123 (65%) would give group O and 42/123 (34%) would give group specific blood. One laboratory (1%) stated that they do not have a policy for this situation. Workload associated with group check sample Table 12 shows the approximate number of occasions per 24 hour period, where the 118 laboratories requiring a group check on all patients and answering this question, have to contact clinical areas to request a second sample. Table 12 - Number of requests made to clinical areas for a second sample per 24 hour period
Number of requests Number of laboratories (%)
<5 97 (82%)
5-10 19 (16%)
11-15 1 (1%)
>15 1 (1%)
Total 118 (100%)
Exemptions from the second sample policy Table 13 shows the number and percentage of the 129 laboratories requiring a group check on all patients, where some departments are excluded the policy. Some laboratories exclude more than one department. Table 13 – Departments exempt from the second sample policy
Exemptions to second sample policy Number of laboratories (%)
None 95 (74%)
All paediatrics 11 (9%)
Paediatrics (up to the age of 5) 1 (1%)
Neonates only1 4 (3%)
SCBU and paediatric oncology 1 (1%)
Trauma 7 (5%)
Other 42 (3%) 1one requests a second sample but does not enforce it 2including external hospitals / clinics, emergency gynae cases, theatres

Appendix 11
UK NEQAS (BTLP) Bi-ennial Report for 2014 and 2015
Page 98 of 112
Table 14 shows the number of laboratories by country that use EI and automation, and the number that either currently test a second sample before issuing group specific blood, or are in the process of implementing a policy to do so. Table 14 – Use of automation, EI and policy for group check on second sample by country
Country Use of automation:
Number (% within country)
Electronic issue: Number
(% within country)
Second sample policy or being implemented:
Number (% within country)
England (n=197) 179 (91%) 127 (64%) 146 (74%)
Scotland (n=31) 25 (81%) 8 (26%) 17 (55%)
Wales (n=12) 10 (83%) 8 (67%) 10 (83%)
Northern Ireland (n=8) 8 (100%) 3 (38%) 6 (75%)
Republic of Ireland (n=42) 29 (69%) 5 (12%) 15 (36%)
Use of enzyme techniques
11/284 (4%) routinely perform an antibody screen with enzyme treated cells
256/284 (90%) have access to an enzyme panel for antibody identification o 144/256 (56%) use an enzyme IAT as part of the antibody identification process, if
indicated. o Two use an enzyme technique for screening but not antibody identification.
Discussion Some of the questions from previous years have been removed or reformatted, to reflect that the vast majority (approximately 97%) of routine group and screens are performed using automation. Most of the data reported has not changed significantly from that collected and reported in 2013. However, it is noted that:
44% of laboratories (cf.26% in 2013) request two samples taken at separate times for a group check (one group could be historical), before group specific blood is issued in a routine situation, and a further 23% are in the process of implementing this policy (cf. 36% in 2013).
There are still a higher proportion of those using EI requesting a second sample than those crossmatching serologically (54% cf. 34%).
The numbers using automation and EI, and requiring a second sample, varies by country within the UK, and is considerably lower in the Republic of Ireland (where there is a higher proportion of small laboratories) than in the UK.
Only one laboratory is using tubes for both the group and screen, although 10 screening by DiaMed use tubes for grouping.
The use of CDE reagents for patient D typing is increasing (6% cf. 3% in 2013), and the use of an anti-D reagent to confirm apparent D negative patient samples also appears to be rising (8% cf. 6% in 2013), although both of these practices are contraindicated in BCSH guidelines1.
EQA ‘requests’ are booked into the LIMS in 68% laboratories, allowing the EQA samples to follow the same process as clinical samples, thus making the EQA results more relevant to clinical practice. Some laboratories cited sample format (i.e. not whole blood) as a reason for not booking EQA samples to the LIMS, and whilst it is appreciated that the sample format is not ideal, this does not seem to be a barrier to

Appendix 11
UK NEQAS (BTLP) Bi-ennial Report for 2014 and 2015
Page 99 of 112
LIMS entry in the majority of laboratories. In some cases there are additional obstacles to overcome, e.g. where there is a shared database and / or problems with building up historical records for EQA ‘patients’. It might be possible to overcome these issues with additional planning in allocating names and numbers to the EQA samples for entry to the LIMS. However, in 40 laboratories ‘custom and practice’ was cited as a reason not to book in EQA samples, with this being the only reason for 23 (8%). The conditions of EQA Scheme participation2 issued by the Royal College of Pathology Joint Working Group (JWG) for Quality Assessment in Pathology, state that ‘EQA samples must be treated in exactly the same way as clinical samples. If this is not possible because of the use of non-routine material for the EQA (such as photographs) they should still be given as near to routine treatment as possible’. The questionnaire data will continue to be collected and analysed on an annual basis. References 1BCSH guidelines for pre-transfusion compatibility testing in blood transfusion laboratories. Transfusion Medicine volume 23, issue 1, pages 3-35 February 2013, and at www.bcshguidelines.com (accessed 19/9/14). 2JWG conditions of EQA Scheme participation http://www.rcpath.org/Resources/RCPath/Migrated%20Resources/Documents/J/Joint_Working_Group_Conditions_of_Participation_August10.pdf (accessed 19/9/14).

Appendix 12
UK NEQAS (BTLP) Bi-ennial Report for 2014 and 2015
Page 100 of 112
Pre-Transfusion Testing Questionnaire - UK and Republic of Ireland Data collected May 2015
Introduction The purpose of this questionnaire was to update basic information on routine pre-transfusion testing procedures, last gathered in May 2014. We will continue to update this information on an annual basis. Return rate Responses were received from 296/385 (77%) laboratories, cf. 77% in 2014, 72% in 2013, 75% in 2012, 77% in 2011, and 86% in 2008. Eleven respondents do not undertake routine pre-transfusion testing, and six did not answer any questions regarding details of testing. Duplicate entries have been removed, with the most recent entry kept for inclusion in the analysis. Data from 279 hospital transfusion laboratories has been analysed. Summary and trend data Table 1 shows a summary of current data compared to historical data, where available. Table 1 – Trends in routine pre-transfusion testing
Process/procedure 2015
n=279 2014
n=290 2013
n=278 2011
n=307 2008
n=392
Full automation for ‘group and screen’
Used during core hours 88% 86% 84% 74% 68%
Proportion of full automation always used 24/7 93% 91% 93% 84% 82%
Routine ABO/D Grouping
Liquid phase microplate 13% 11% 10% 13% 14%
Column Agglutination Technology (CAT) 82% 85% 86% 82% 77%
Omit reverse group on patients with historical groups 24% 25% 22% 24% 25%
Omit reverse group on patients without historical group <1% <1% 0% <1% <1%
D typing reagents
Routinely include IAT for D typing on apparent D negatives
7% 8% 6% 6% 6%
Include an anti-CDE reagent 7% 6% 3% 3% 1%
Routine method of establishing compatibility
Electronic issue 59% 53% 55% 46% 37%
‘Immediate’ spin 6% 5% 7% 8% 8%
IAT ( other technique(s)) 35% 42% 39% 46% 55%
‘Group check’ policy
Group-check policy 55% 44% 26% No data No data
IAT technology antibody screening
CAT 87% 89% 91% 90% 90%
Solid phase microplate 13% 11% 8% 10% 9%
IAT technology crossmatching
CAT 96% 97% 98% 96% 96%
Tube 2% 1% 1% 2% 3%
Solid phase microplate 2% 2% 1% 2% 1%

Appendix 12
UK NEQAS (BTLP) Bi-ennial Report for 2014 and 2015
Page 101 of 112
Analysis of 2015 data Workload n=274 Number of group and screens performed per annum Figure 1 shows the percentage laboratories within workload categories based on the approximate number of group and screens performed per year for 2015 (with previous years for comparison). Figure 1
18/38 (47%) of laboratories in the Republic of Ireland test <5000 samples per year cf. 43/242 (18%) in the UK.
IT and automation Table 2 shows the LIMS used, with 77% using iSoft or Clinisys. There were at least 19 other commercial IT suppliers reported, with none of these having more than eight users. Table 2 – Details of LIMS used (where stated)
IT system Number (%)
iSoft (including CSC) 117 (42%)
Clinisys 98 (35%)
Other* 64 (23%)
Total 279 (100%)
* including three using in-house systems

Appendix 12
UK NEQAS (BTLP) Bi-ennial Report for 2014 and 2015
Page 102 of 112
Booking EQA samples into the LIMS 202/279 (72%) book EQA samples into the LIMS, with no obvious correlation with the LIMS in use. Table 3 shows the number of laboratories recording each reason why EQA samples are not booked into the LIMS; some laboratories recorded more than one reason. Table 3 – Reasons cited for not booking EQA samples into the LIMS
Reason Number
The format of the samples (e.g. group and antibody screen for one ‘patient’ are undertaken on separate samples)
40
Problems with cumulative data from EQA ‘patients’ 23
Interference with workload statistics 10
Problems with holding EQA data on a database shared between sites 16
Custom and practice 33
Other 7
18 cited ‘custom and practice’ as the only reason for not booking EQA samples into the LIMS. Use of automation within core hours Table 4 shows the use of automation for routine group and screens within core hours. Table 4 – Use of automation for group and screens during core hours
Testing Number (%)
Full automated 246 (88%)
Semi-automated (i.e. not walkaway)1 2 (1%)
No automation 31 (11%)
Total 279 (100%) 1includes one with automated reading only
During core hours, approximately 98% of group and screens are tested with full automation. This has been calculated using the actual number of group and screens performed by each laboratory if stated, otherwise it has been estimated as the midpoint where the category is a range, using 500 for the <1000 category and 30000 for the >25000 category. This does not take account of urgent testing which might be undertaken manually in a laboratory with automation, even during core hours. Table 5 shows the number and percentage of laboratories with an interface between the automation and laboratory information management system (LIMS). Of the four with no interface, three were in the process of upgrading to new automation or validating new equipment; the fourth stated that the functionality does not exist with their in-house LIMS.
Table 5 – LIMS interface with automation
Interface between automation and LIMS Number (%)
Bi-directional 177 (71%)
Uni-directional 67 (27%)
Not interfaced 4 (2%)
Total 248 (100%)
Use of automation for other tests Table 6 shows the number and percentage of the 248 laboratories with automation using it for tests other than ‘group and screen’.

Appendix 12
UK NEQAS (BTLP) Bi-ennial Report for 2014 and 2015
Page 103 of 112
Table 6 – Use of automation by test
Test Number (% of total using
automation)
Antibody ID 155 (63%)
Crossmatching 83 (33%)
Phenotyping 83 (33%)
Analyser used for group and screen Table 7 shows the number and percentage of laboratories using each analyser for routine group and screens. Table 7 – Automation used for group and screen
Analyser Number (%)
DiaMed ID Gelstation 71 (29%)
DiaMed IH 1000 42 (17%)
Grifols Erytra 9 (4%)
Grifols WADiana Gelstation 3 (1%)
Immucor NEO 24 (10%)
Immucor Echo 9 (4%)
Immucor Galileo 3 (1%)
Ortho AutoVue Innova 76 (31%)
Ortho AutoVue 9 (4%)
Qasar 1 1 (<1%)
Banjo 1 1 (<1%)
Total 248 (100%) 1reader only
Use of automation outside core hours 271/277 (98%) stated that they undertake pre-transfusion testing outside core hours. 245 have full automation and stated whether it is used for testing out of hours:
229/245 (93%) always use the automation
7/245 (3%) sometimes use the automation outside core hours
9/245 (4%) never use the automation outside core hours.

Appendix 12
UK NEQAS (BTLP) Bi-ennial Report for 2014 and 2015
Page 104 of 112
Details of serological testing Routine ABO/D typing technology Table 8 shows the technology used by laboratories for primary ABO/D typing and antibody screening of patients with a previous group, using automation, manual techniques and overall. Table 8 – Technology used for primary group and screen (G+S) - manual, automated and overall
Technology Number full auto Number semi automation or
manual Total number (%)
DiaMed 113 13 126 (45%)
BioVue 85 5 90 (32%)
Immucor 36 0 36 (13%)
Grifols 12 0 12 (4%)
Tube group/DiaMed screen 0 13 13 (5%)
LPMP group/DiaMed screen 0 1 1 (<1%)
Tube group/LPMP screen 0 1 1 (<1%)
All techniques 246 33 279
Inclusion of a reverse group
66/272 (24%) omit the reverse group for patients with more than one historical group o 3/66 (5%) use manual techniques o 10/66 (15%) do include a reverse group if there is only one historical group record. o 1/66 (2%) also omits the reverse group on patients with no historical group, using manual
DiaMed for ABO/D typing.
D typing
18/274 (7%) laboratories incorporate an anti-CDE reagent into routine testing: o 16 for all patients o 2 only for patients with no previous group
18/269 (7%) routinely confirm D negatives using an IAT anti-D reagent: o 11 for all patients o 7 only for patients with no previous group.
IAT technology used for serological crossmatching Table 9 shows the number and percentage using each IAT technology for serological crossmatching. Table 9 – Technology used for the IAT crossmatch (manual and automated methods and overall)
Technology Number automated Number manual Total number (%)
DiaMed 39 132 171 (62%)
BioVue 33 52 85 (31%)
Immucor (Capture) 5 0 5 (2%)
Grifols 6 6 12 (4%)
Tube 0 5 5 (2%)
All techniques 83 195 278

Appendix 12
UK NEQAS (BTLP) Bi-ennial Report for 2014 and 2015
Page 105 of 112
Method for establishing final compatibility
165/278 (59%) use electronic issue (EI)
97/278 (35%) use an IAT crossmatch (with or without an immediate spin)
16/278 (6%) use an immediate spin crossmatch alone. Use of enzyme techniques
14/275 (5%) routinely perform an antibody screen with enzyme treated cells
248/275 (90%) have access to an enzyme panel for antibody identification
106/274 (39%) use an enzyme IAT as part of the antibody identification process, if indicated. Table 10 shows when the enzyme panel is used Table 10 – use of enzyme panel
When enzyme panel is used Number (%)
For every positive antibody screen 168 1
Only when specificity is not clear by IAT (or further specificities cannot be excluded)
66 2
On all newly positive antibody screens (±where specificity is not clear or to confirm Rh antibody)
12 3
Other 2 4 1 – one commented that many paediatric samples have insufficient plasma to undertake the enzyme panel 2 – one stated that they also include an enzyme panel where an Rh antibody is suspected 3 – one commented that this would include any change in pattern from a historical antibody 4 – one if enzyme screen is positive; one if screen result is <2+ Second sample for group check policy Requirement for ABO group check on second sample in routine situations Table 11 shows the number and percentage of laboratories with a policy to perform a group check on a second sample taken at separate time (one group could be historical), before group specific blood is issued in a routine situation. This is shown both overall and by laboratories that use EI. Table 11 – Requirement for a ‘group check’ on a second sample
ABO check performed on second sample? Number (%)
Using EI All laboratories
Yes, for all patients 100 (61%) 151 (55%)
Yes, for all patients except where the first sample is group O 1 (<1%) 1 (<1%)
Yes, but only for electronic issue (EI) 7 (4%) 7 (3%)
Yes, but only for EI, except where the first sample is group O 1 (<1%) 1 (<1%)
No, but in process of implementing this 26 (16%) 56 (20%)
No 30 (18%) 61 (22%) 1
Total 165 (100%) 277 (100%) 1 14 stated that they use secure bedside electronic patient ID systems, with five confirming that they use this as an alternative strategy to prevent ABO incompatible transfusion
101/165 (61%) laboratories using EI require a group check on a second sample for all patients compared to 51/112 (46%) using a serological crossmatch.

Appendix 12
UK NEQAS (BTLP) Bi-ennial Report for 2014 and 2015
Page 106 of 112
Testing of second sample The level of testing performed on the second sample is detailed in Table 12. Table 12 – Combinations of tests performed on the second sample
Combination of tests on the second sample Number (%)
Full ABO/D group and antibody screen 130 (83%)
Full ABO/D group 8 (5%)
Full ABO group 0 (0%)
ABO forward group 18 (12%)
Total 156 (100%)
Table 13 shows the different measures taken to assure that the two samples have been taken independently for those requiring two samples for all patients. Table 13 - Assurance that the two samples have been taken independently of one another
Method of assurance Number
Special tube system 5
Two different signatures as single physical measure (± education and training) 4
Two different times as single physical measure (± education and training) 102 1
Rely solely on education and training 10
Two signatures and two different times (± education and training) 19
No special system 8 2 1 – includes: one either different times or signatures; one pre-assessment and admission; one controlled using e-requesting system at bedside; one cited two separate phlebotomy events but gave no details as to how this is assured 2 – A further four did not give any answer, suggesting that they have no particular system in place.
Policy for provision of red cells if a second sample is not available and blood is required urgently 149 laboratories with a group check policy for all patients (as opposed to just for those undergoing EI), answered this question. Assuming that testing has been completed on the first sample to BCSH specifications for group compatible blood, 112/149 (75%) would give group O and 35/149 (23%) would give group specific blood. Two laboratories (1%) stated that they do not have a policy for this situation. Workload associated with group check sample Table 14 shows the approximate number of occasions per 24 hour period, where the 148 laboratories requiring a group check on all patients and answering this question, have to contact clinical areas to request a second sample. Table 14 - Number of requests made to clinical areas for a second sample per 24 hour period
Number of requests Number (%)
None or 1 69 (47%)
2-5 54 (37%)
5-10 20 (14%)
11-15 1 (<1%)
>15 3 (2%)
Total 147 (100%)

Appendix 12
UK NEQAS (BTLP) Bi-ennial Report for 2014 and 2015
Page 107 of 112
Where respondents were able to equate this to a % of workload:
≤1%, rarely or negligible: n=25
1-3%: n=8
3-5%: n=12
5-10%: n=8
10-15%: n=2
20%+: n=4 Exemptions from the second sample policy Table 15 shows details of exemptions to the policy in the 152 laboratories requiring a group check on all patients. The majority of laboratories have no exemption and others exclude more than one department. Table 15 – Departments exempt from the second sample policy
Exemptions to second sample policy Number (%)
None 98 (64%)
All paediatrics 6 (4%)
Neonates only 35 (23%)
Trauma 7 (5%)
Other 1 5 (3%) 1 newborns (1st 12 hours of life); all urgent requests (x2); infants (<12 month) are given group O; satellite hospital Delays to transfusion Participants were asked if they had experienced any delays to transfusion as a result of the group-check policy and 146 responded:
No: 120 (82%)
Yes, but rarely: 25 (17%)
Yes, a few times: 1 (1%) Increase in use of group O red cells Participants were asked if there had been any notable increase in use of O D negative or O D positive red cells as a result of the group-check policy and 147 responded:
No, not really: 119 (81%)
Yes, but minimal: 27 (18%)
Yes, significant: 1 (1%) o This laboratory is not based in the hospital and said that there can be delays in getting the
second sample. They also reported a minimal impact on workload.

Appendix 12
UK NEQAS (BTLP) Bi-ennial Report for 2014 and 2015
Page 108 of 112
Variation in practice by country Table 16 shows the number of laboratories by country that use EI and automation, and the number that either currently test a second sample before issuing group specific blood, or are in the process of implementing a policy to do so. Table 16 – Use of automation, EI and policy for group check on second sample by country
Country
Number (% within country)
Using automation
Using electronic issue
With second sample policy in place or
being implemented
England (n=192) 179 (93%) 136 (71%) 156 (81%)
Scotland (n=25) 22 (88%) 10 (40%) 14 (56%)
Wales (n=15) 13 (87%) 12 (80%) 11 (73%)
Northern Ireland (n=7) 7 (100%) 2 (26%) 5 (71%)
Republic of Ireland (n=38) 25 (66%) 4 (11%) 20 (53%)
Other (n=2) 2 (100%) 0 (0%) 2 100%)
Total 248 164 208
Alternative strategies to prevent ABO incompatible transfusion due to wrong blood in tube Although (in answer to an earlier question), 39 participants said that they have secure electronic patient identification systems in place, i.e. barcoded wristbands with handheld barcode scanners and printers to allow secure bedside labelling of samples, only six of these cited this system as an alternative strategy to a check-check policy. Other strategies cited:
Piloting or in process of implementing an electronic system: 4
Use of request form with a declaration box to be signed by the person taking the sample that it was checked and labelled at the bedside: 1
Issue group O if no historical record (small paediatric hospital with mostly group O in stock): 1
Risk assessment undertaken and decision not to implement group-check policy: 2
Typenex or similar system with additional number on wristband, sample and blood bag: 3
Training and education: 1
Discussion Most of the data reported has not changed significantly from that collected and reported in 2014. However, it is noted that:
55% of laboratories (cf.44% in 2014) request two samples taken at separate times for a group check (one group could be historical), before group specific blood is issued in a routine situation, and a further 20% are in the process of implementing this policy (cf. 23% in 2014).
There are still a higher proportion of those using EI requesting a second sample than those crossmatching serologically (61% cf. 46%), although the gap is narrowing.
The numbers using automation and EI, and requiring a second sample, varies significantly by country.
Overall, the use of EI continues to slowly increase, at 59% (cf 53% in 2014).
Use of solid phase for antibody screening appears to have increased slightly, at 13% (cf 11% in 2014).

Appendix 12
UK NEQAS (BTLP) Bi-ennial Report for 2014 and 2015
Page 109 of 112
EQA ‘requests’ are booked into the LIMS in 72% laboratories (an increase form 68% in 2014), allowing the EQA samples to follow the same process as clinical samples, thus making the EQA results more relevant to clinical practice. Some laboratories cited sample format (i.e. not whole blood) as a reason for not booking EQA samples to the LIMS, and whilst it is appreciated that the sample format is not ideal, this does not seem to be a barrier to LIMS entry in the majority of laboratories. In some cases there are additional obstacles to overcome, e.g. where there is a shared database and / or problems with building up historical records for EQA ‘patients’. It might be possible to overcome these issues with additional planning in allocating names and numbers to the EQA samples for entry to the LIMS. However, in 33 laboratories ‘custom and practice’ was cited as a reason not to book in EQA samples, with this being the only reason for 18 (6% of all respondents). The conditions of EQA Scheme participation2 issued by the Royal College of Pathology Joint Working Group (JWG) for Quality Assessment in Pathology, state that ‘EQA samples must be treated in exactly the same way as clinical samples. If this is not possible because of the use of non-routine material for the EQA (such as photographs) they should still be given as near to routine treatment as possible’. The questionnaire data will continue to be collected and analysed on an annual basis. References 1BCSH guidelines for pre-transfusion compatibility testing in blood transfusion laboratories. Transfusion Medicine volume 23, issue 1, pages 3-35 February 2013, and at www.bcshguidelines.com (accessed 18/8/15). 2JWG conditions of EQA Scheme participation: http://www.rcpath.org/Resources/RCPath/Migrated%20Resources/Documents/J/Joint_Working_Group_Conditions_of_Participation_August10.pdf (accessed 18/8/15).
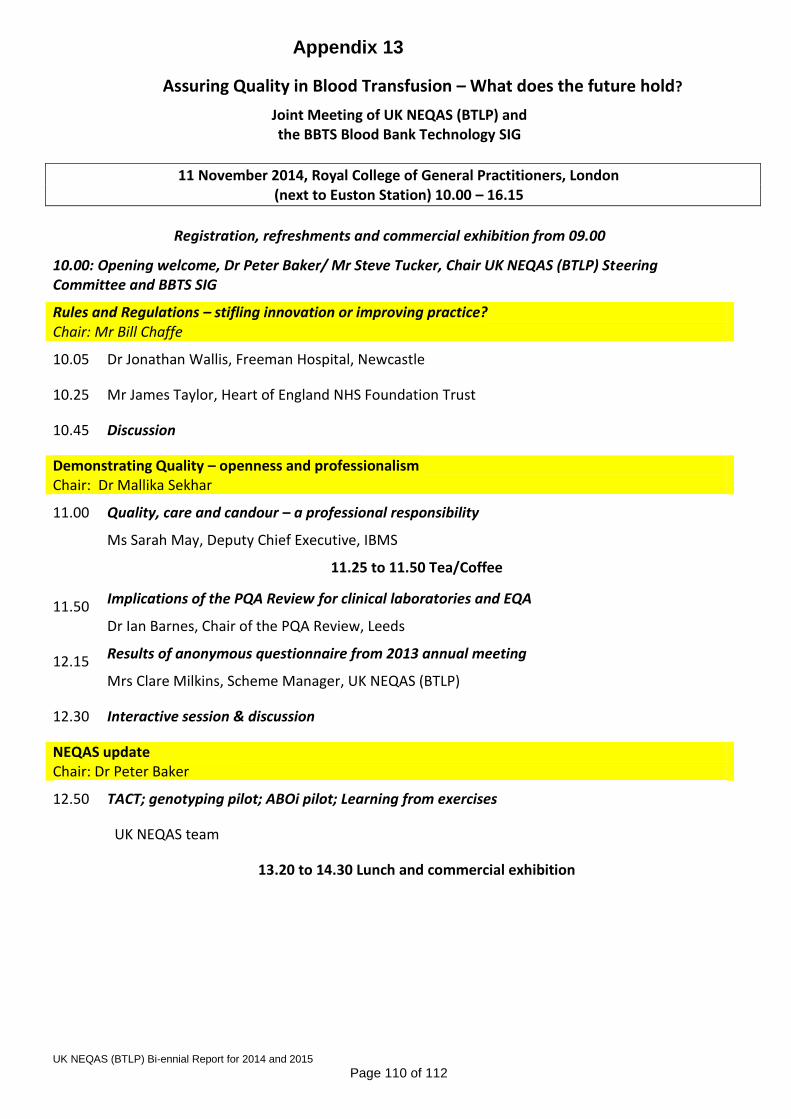
Appendix 13
UK NEQAS (BTLP) Bi-ennial Report for 2014 and 2015
Page 110 of 112
Assuring Quality in Blood Transfusion – What does the future hold?
Joint Meeting of UK NEQAS (BTLP) and the BBTS Blood Bank Technology SIG
11 November 2014, Royal College of General Practitioners, London (next to Euston Station) 10.00 – 16.15
Registration, refreshments and commercial exhibition from 09.00
10.00: Opening welcome, Dr Peter Baker/ Mr Steve Tucker, Chair UK NEQAS (BTLP) Steering Committee and BBTS SIG
Rules and Regulations – stifling innovation or improving practice? Chair: Mr Bill Chaffe
10.05 Dr Jonathan Wallis, Freeman Hospital, Newcastle
10.25 Mr James Taylor, Heart of England NHS Foundation Trust
10.45 Discussion
Demonstrating Quality – openness and professionalism Chair: Dr Mallika Sekhar
11.00 Quality, care and candour – a professional responsibility
Ms Sarah May, Deputy Chief Executive, IBMS
11.25 to 11.50 Tea/Coffee
11.50 Implications of the PQA Review for clinical laboratories and EQA
Dr Ian Barnes, Chair of the PQA Review, Leeds
12.15 Results of anonymous questionnaire from 2013 annual meeting
Mrs Clare Milkins, Scheme Manager, UK NEQAS (BTLP)
12.30 Interactive session & discussion
NEQAS update Chair: Dr Peter Baker
12.50 TACT; genotyping pilot; ABOi pilot; Learning from exercises
UK NEQAS team
13.20 to 14.30 Lunch and commercial exhibition

Appendix 13
UK NEQAS (BTLP) Bi-ennial Report for 2014 and 2015
Page 111 of 112
Antenatal anti-D – still an issue Chair: Mr Steve Tucker
14.30 Report from the anti-D audit
Dr Megan Rowley, National Comparative Audit
14.50 Anti-D failures evidenced by SHOT reporting
Dr Jane Keidan, SHOT Writing Group
15.10 Immune or prophylactic anti-D – what do the new antenatal guidelines say?
Ms Jenny White, member of guideline writing group
15.30 Column Agglutination titration scores for measurement of anti-D in pregnancy
Mr David Bruce, NHSBT, Newcastle
15.50 Use of flow cytometry in blood transfusion
Ms Fran Green, IBGRL
16.10 Discussion
Close 16.15 with refreshments
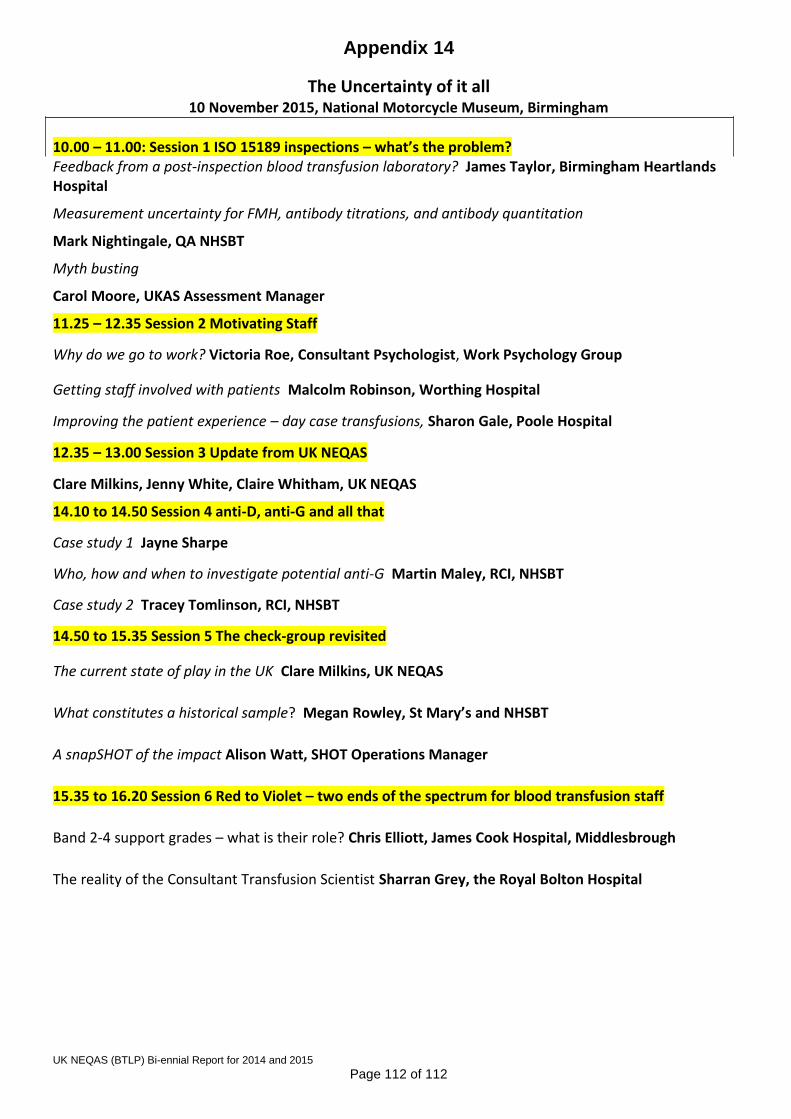
Appendix 14
UK NEQAS (BTLP) Bi-ennial Report for 2014 and 2015
Page 112 of 112
The Uncertainty of it all 10 November 2015, National Motorcycle Museum, Birmingham
10.00 – 11.00: Session 1 ISO 15189 inspections – what’s the problem? Feedback from a post-inspection blood transfusion laboratory? James Taylor, Birmingham Heartlands Hospital
Measurement uncertainty for FMH, antibody titrations, and antibody quantitation
Mark Nightingale, QA NHSBT
Myth busting
Carol Moore, UKAS Assessment Manager
11.25 – 12.35 Session 2 Motivating Staff
Why do we go to work? Victoria Roe, Consultant Psychologist, Work Psychology Group
Getting staff involved with patients Malcolm Robinson, Worthing Hospital
Improving the patient experience – day case transfusions, Sharon Gale, Poole Hospital
12.35 – 13.00 Session 3 Update from UK NEQAS
Clare Milkins, Jenny White, Claire Whitham, UK NEQAS
14.10 to 14.50 Session 4 anti-D, anti-G and all that
Case study 1 Jayne Sharpe
Who, how and when to investigate potential anti-G Martin Maley, RCI, NHSBT
Case study 2 Tracey Tomlinson, RCI, NHSBT
14.50 to 15.35 Session 5 The check-group revisited
The current state of play in the UK Clare Milkins, UK NEQAS
What constitutes a historical sample? Megan Rowley, St Mary’s and NHSBT
A snapSHOT of the impact Alison Watt, SHOT Operations Manager
15.35 to 16.20 Session 6 Red to Violet – two ends of the spectrum for blood transfusion staff
Band 2-4 support grades – what is their role? Chris Elliott, James Cook Hospital, Middlesbrough
The reality of the Consultant Transfusion Scientist Sharran Grey, the Royal Bolton Hospital

UK NEQAS Blood Transfusion Laboratory Practice
PO Box 133
Watford
WD18 0WP
UK
T: + 44 (0)1923 217933
W: www.ukneqasbtlp.org