uk may 2012 - damstahl
TRANSCRIPT
Damstahl Stainless Steel Report
May 2012
Report: Stainless Steel in Damstahl-Land, No. 12, May 2012© Damstahl 2012, Damstahl - a member of the NEUMO-Ehrenberg-Group - 1 -
Report: Stainless Steel in Damstahl-Land, No. 12, May 2012© Damstahl 2012, Damstahl - a member of the NEUMO-Ehrenberg-Group - 2 -
Contents• Stainless Steel at a Glance
• European Industry News & Business Climate
• Market Performance:
→ Germany
→ Netherlands
→ United Kingdom
→ Denmark
→ Sweden
→ Norway
• Raw Materials
Report on Market HighlightsIssue 12, May 2012
Focus of the Month:The New Tiger: U.S. Market outperformed all others in 2011
Report: Stainless Steel in Damstahl-Land, No. 12, May 2012© Damstahl 2012, Damstahl - a member of the NEUMO-Ehrenberg-Group - 3 -
Stainless Steel at a GlanceStainless Steel Market takes a Break in Q2/12
• Demand: European Stainless steel demand has slowed as expected in Q2/12. Besides a reduced demand from stockists also some end users such as process industry and transportation have started to slow in April/May in Europe. In general, the market situation in Central Europe and Scandinavia is still far from being weak. European distributors are currently, however, in a stronger price competition in order to keep market shares. This has already an impact on the price situation in the European market.
• Stocks: Stainless steel stocks are still relatively full. Stockholders are not under pressure to buy additional material for stocks, and thus they are very cautious with new orders. They just replace material for stock what was sold before.
• End Use: The two stainless 2011 demand drivers process industry and automotive industry are losing steam at the moment. Order intake in process industry and machinery has substantially dropped in Europe and also in export markets such as China. Automotive has softened as feared in earlier expectations. One reason is the uncertainty at consumers about austerity policy, unsolved Greece, Spain, Italy etc problems, fears about the future of the EURO currency. On the other hand, demand for food processing equipment and for oil/gas equipment is still on a high level.
• Nickel Price: Prices dropped further to around 17,000 US$/t. There are ambivalent news from NPI. Industry hopes for an Indonesian export ban did not materialise yet. If this would have been happened, it could have been a strong support for Ni prices. It is reported from Indonesia that export taxes have been imposed on NPI but there are also news that there will be a quota regulation for NPI ore (means that each exporter can only supply a specific contingent of NPI in the future).
• Macro-economics: EU-economy has stagnated in Q1/12 (zero growth compared to Q4/11). A recession was statistically avoided thanks to a 0.5 GDP growth in Germany. Nevertheless some countries are already in a recession since several quarters. Germany’s surprising growth was driven by increased exports and improved local consumption. But: investment activity contracted substantially in Germany as well!
Report: Stainless Steel in Damstahl-Land, No. 12, May 2012© Damstahl 2012, Damstahl - a member of the NEUMO-Ehrenberg-Group - 4 -
• Industry News
• Business Climate at a Glance - PMI
European Industry News / Business Climate
European Industry News Flat: Return to Profits in Q2/12 expected - after three Quarters with Losses at European Mills
• The European stainless steel crude steel production reached 2.1 million t in Q1/12. This is a 15% growth´compared to Q4/11 (including the very weak December production) . European mills have been more than satisfied with Q1/12 – but in fact, European production was slightly below the volume a year ago. For Q2/12, a production level below Q1/12 production is expected by market participants.
• Profitability: mills have achieved a substantial improvement in results – compared to Q4/11. But profitability was lagging behind EBITDA a year ago. For the 2nd quarter, companies hope for stable EBITDAs due to improvements at diverse cost cutting programs.
• Acerinox: Melt production increased from 571 kt (Q1/11) to 612 kt in Q1/12. In total the Group capacity utilization ratio was at 92%. Results: Q1/12 EBIT was slightly above Q4/11 - but with 60 mill. € behind Q1/11 (114 mill.€). A lower stock valuation contributed to this result. Acerinox Spain: SMS Innse will provide an AOD converter vessel and two change vessels (tapping weight of 108 tonnes – start-up in 2012) and will update the EAF (120 t – commission planned for 2013).
• Aperam: EBITDA has improved from 39 mill. € (Q4/11) to 49 mill. € in Q1/12. But, compared to the beginning of 2011, EBITDA declined by 45 mill. €. Aperam’s European stainless steel shipments have increased from 238,000 t in Q4/11 to 263,000 t in Q1/12 (+10%).
• Outokumpu Stainless: has improved from a loss of -13 mill. € in Q4/11 to a profit of 60 mill. €in Q1/12- mainly due to higher deliveries (from 323kt to 399kt /+ 24%). To further improve cost positions, Outokumpu intends to cut 150–200 jobs in Tornio and Terneuzen/Netherlands. The company announced that it will take most likely longer than expected before the anti-trust authorities will decide about the Inoxum takeover (expectation: until September/October).
Report: Stainless Steel in Damstahl-Land, No. 12, May 2012© Damstahl 2012, Damstahl - a member of the NEUMO-Ehrenberg-Group - 5 -
Report: Stainless Steel in Damstahl-Land, No. 12, May 2012© Damstahl 2012, Damstahl - a member of the NEUMO-Ehrenberg-Group - 6 -
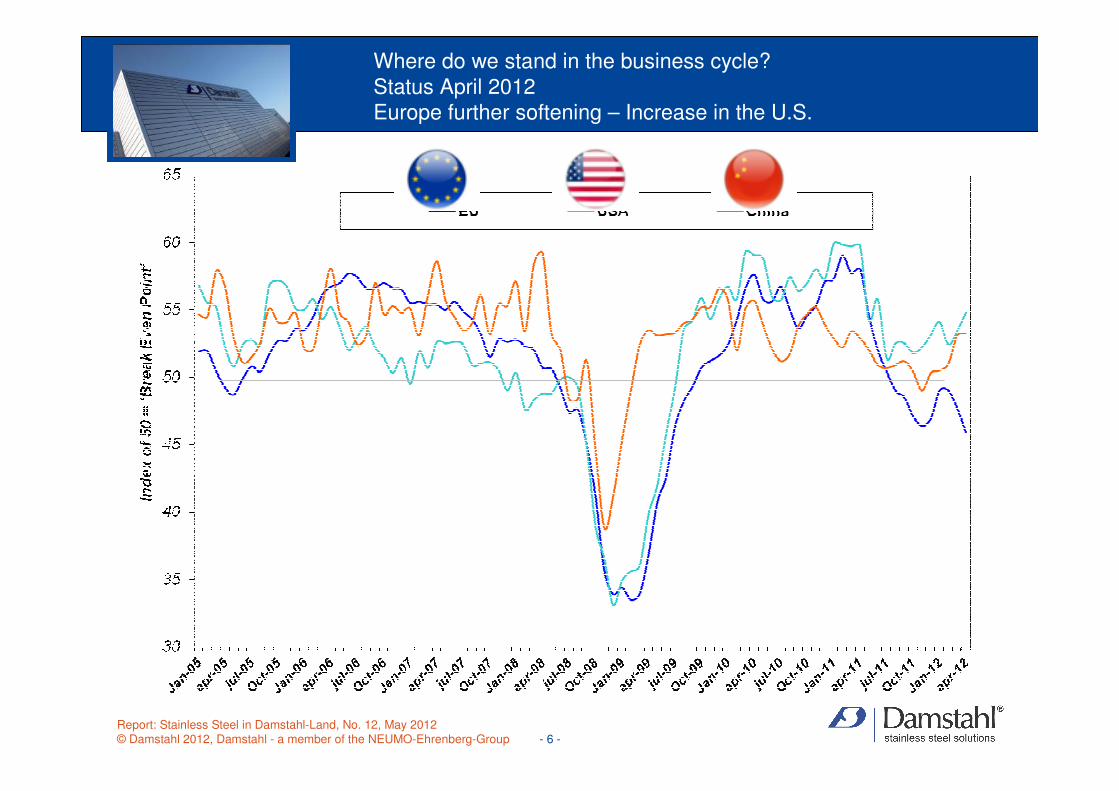
Where do we stand in the business cycle? Status April 2012 Europe further softening – Increase in the U.S.
• Summary: Relevant Issues In Damstahl-Land
• Germany
• Netherlands
• United Kingdom
• Denmark
• Sweden
• Norway
Market Performance in ‘Damstahl-Land’
Report: Stainless Steel in Damstahl-Land, No. 12, May 2012© Damstahl 2012, Damstahl - a member of the NEUMO-Ehrenberg-Group - 7 -
Relevant Issues In Damstahl-LandGermany + Netherlands
• Germany: Stainless steel market was relatively quiet in April/early May – but far from coming into a recession. There is an increasing competition amongst stockholders with impact on market prices at the moment in order to keep market shares in stagnant market. Stocks in the German market are on sufficient levels – buyers are not planning to significantly up- or destock at the moment.
• Process Industry / Machinery: the German association VDMA (Verband Deutscher Maschinen- und Anlagenbau) reported that order intake has dropped by minus 9% yoy in Q1/12. Especially export orders fell significantly. The association expects a stable production this year and a growth in 2013.
• GEA group: The German process industry supplier achieved a 24% order intake increase yoy (to 1.5 bn €) in Q1/12. Primarily, the segment food process technology was responsible for this improvement. This segment grew by 38% and has now an order share of 55% within GEA group. Demand for food processing will remain a growth driver for GEA this year.
• Germany’s car production is suffering from a weakness in export markets. January to April: -2% (1.9 million cars), exports fell by 5% yoy. Particularly, April was weak: production minus 10%!
• The German Construction Confederation (ZDB) forecasted the German construction industry to grow by 3.8% in 2012. A large number of permits issued in late 2011 led to favourable conditions for housing in Q1/12. This will continue in Q2/12 but the dynamics will slow down.
• Damstahl and Edelstahl Service Frankfurt will have a combined stand on the Achema fair (chemical engineering and environmental protection) in Frankfurt this year (June 18-22)
• Netherlands: Damstahl has experienced a continuous growth in the Netherlands this year. It is however expected that Damstahl gains shares as newcomer against established market players.
• Mixed Signals: According to Statistics Netherlands, Dutch exports grew by 3.8 % in Q1/12. But, the construction output was nearly 11 % down in Q1/12 compared with the same period last year and the consumption (especially cars) was 1.1 % lower in Q1/12 compared with the same period 2011.
Report: Stainless Steel in Damstahl-Land, No. 12, May 2012© Damstahl 2012, Damstahl - a member of the NEUMO-Ehrenberg-Group - 8 -
• United Kingdom: Damstahl experienced average market activity at expected price levels. Somelarger competitors within the UK are reporting lower than normal activity and reduced stock levels, this could be due to a general lack of confidence in market conditions.
• Export and import figures in the vehicle trade for Q1/12 show, that the volumes of cars exported jumped by 21.8% compared with Q4/11. The cars imports were up by 5.8% compared with Q4/11.
• GDP in US contracted between Q4/11 and Q1/12 by 0.2%. The UK economy has not grown in the last 12 months. Economy fell over 7% from peak to trough during the crisis 2008/09. Despite a temporary past-recession recovery, UK economy is still ~4.5% below its pre-recession peak. Construction activity remained disappointing: activity fell by ~5% (yoy) in February 2012.
• Denmark: April was slow, due to many holidays. May was a much better month. Sub-suppliers are moving in the right direction. At dropping prices, customers are only buying what is absolutely needed for orders. Now the prices are a bit more stable. Super diary tubes are more and more requested. Customers in the metal cutting industry are showing good market activities.
• Arla Foods: Europe’s largest dairy conglomerate received a go-ahead for the construction of world’s largest fresh milk dairy plant (1.3 bn litres of milk per year) in Aylesbury/UK (start-up: 2013). Investment at one of the largest construction projects in UK is around 150 mill. British Pounds.
• Danfoss: Q1/12 showed moderate growth. Net sales were 8.4 bn DKK (Q1/11: 8.5 bn DKK), corresponding to a decline of 2%. Adjusted for divestments, Danfoss recorded a 2% growth (yoy). Danfoss’ expectations for 2012: net sales and profits will reach the same level as last year.
• Grundfos: The Danish pump manufacturer achieved a turnover of 2.8 bn € in 2011 after 2.6 bn in the previous year (+8%) and will in 2012 invest the highest annual amount ever in production facilities and r&d. Grundfos expects a stable business in 2012 (same turnover than in 2011).
• The RMIG Group (perforated metals) opened a second warehouse in Poland, located in Bierun, which is situated between the two large economic centres of Katowice and Krakow.
Report: Stainless Steel in Damstahl-Land, No. 12, May 2012© Damstahl 2012, Damstahl - a member of the NEUMO-Ehrenberg-Group - 9 -
Relevant Issues In Damstahl-LandUnited Kingdom + Denmark
Relevant Issues In Damstahl-LandSweden + Norway
• Sweden: General opinion among Swedish distributors is that the market right now is very much ‘stop and go’ - neither bad nor good. Prices are currently under pressure, there is a larger portion of spot business among end users than usually.
• BE-Group: Net sales fell by 5% in Q1/12 (yoy) compared to Q1/11, amounting to SEK 1.436 mill. (1.519 mill. Q1/11 ). Shipped tonnage decreased by 1% in the same quarter. BE Group sees a positive development in Q1/12. The start of 2012 was still pervaded by caution, although demand gradually improved over the quarter.
• Alfa Laval: order intake at the heat exchanger manufacturer increased by 22% yoy (to 7.9 bnSEK). Compared with Q4/11: +17%. Order shift from Q4/11 to Q1/12 contributed, however, to the growth. Regionally, strongest growth was reached in Eastern Europe and North America.
• OSTP (Outokumpu Stainless Tubular Products): recorded an operating profit of € 2 mill. ($ 2.6m) in Q1/12, compared with an operating loss of € 9m in Q1/11. The company closed its Nyby works in Sweden and moved some of the production lines to Pietarsaari in Finland, where production will be ramped up in Q2/12.
• Norway: The market activity is determined by falling prices due to alloy surcharges. Especially on flat products, where prices are below other countries such as Denmark or Sweden. Long products are stabile with appropriate prices. Due to this, the activity is not at the same level as in Q1/12.
• Statoil: oil/gas production grew by 11%, net operating income increased by 14% yoy. Statoil completed 12 exploration wells in Q1/12, of which eight were successful. The company has signed an agreement with Rosneft (Russia) in order to jointly explore frontier areas of Russia and Norway.
Report: Stainless Steel in Damstahl-Land, No. 12, May 2012© Damstahl 2012, Damstahl - a member of the NEUMO-Ehrenberg-Group - 10 -
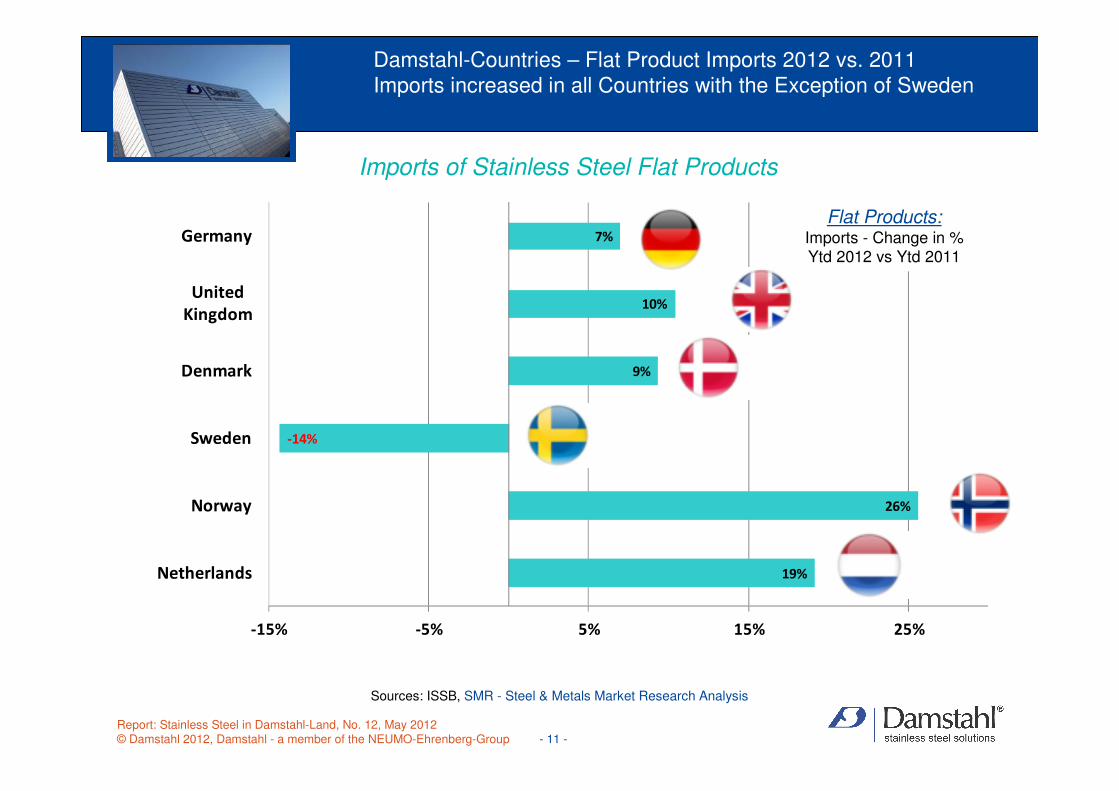
Damstahl-Countries – Flat Product Imports 2012 vs. 2011Imports increased in all Countries with the Exception of Sweden
19%
26%
-14%
9%
10%
7%
-15% -5% 5% 15% 25%
Netherlands
Norway
Sweden
Denmark
United
Kingdom
GermanyFlat Products:
Imports - Change in %Ytd 2012 vs Ytd 2011
Imports of Stainless Steel Flat Products
Sources: ISSB, SMR - Steel & Metals Market Research Analysis
Report: Stainless Steel in Damstahl-Land, No. 12, May 2012© Damstahl 2012, Damstahl - a member of the NEUMO-Ehrenberg-Group - 11 -
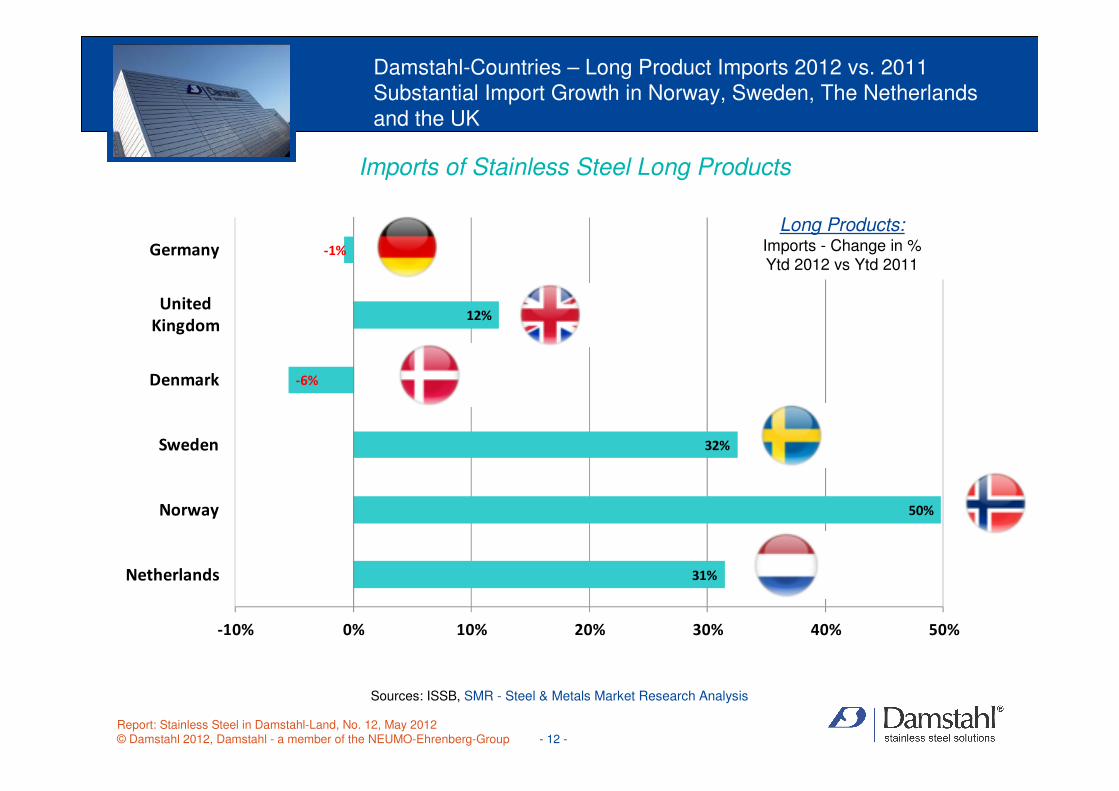
Damstahl-Countries – Long Product Imports 2012 vs. 2011Substantial Import Growth in Norway, Sweden, The Netherlands and the UK
31%
50%
32%
-6%
12%
-1%
-10% 0% 10% 20% 30% 40% 50%
Netherlands
Norway
Sweden
Denmark
United
Kingdom
Germany
Long Products: Imports - Change in %Ytd 2012 vs Ytd 2011
Imports of Stainless Steel Long Products
Sources: ISSB, SMR - Steel & Metals Market Research Analysis
Report: Stainless Steel in Damstahl-Land, No. 12, May 2012© Damstahl 2012, Damstahl - a member of the NEUMO-Ehrenberg-Group - 12 -
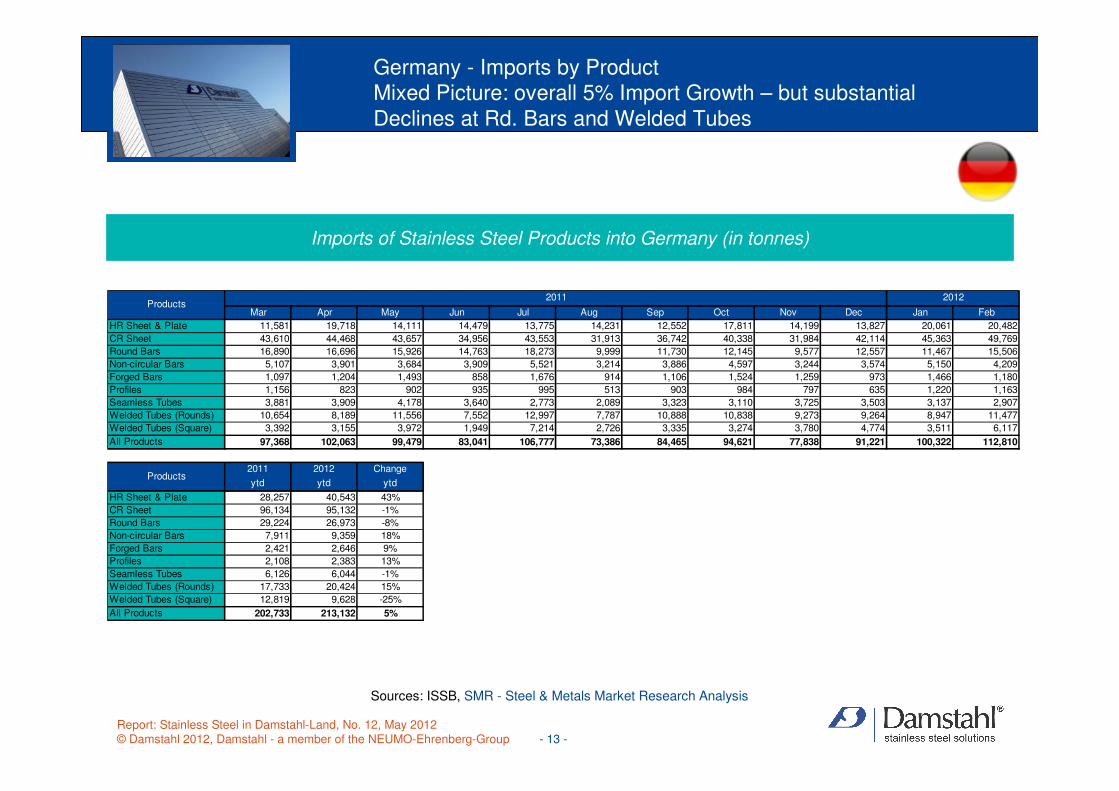
Germany - Imports by ProductMixed Picture: overall 5% Import Growth – but substantial Declines at Rd. Bars and Welded Tubes
Imports of Stainless Steel Products into Germany (in tonnes)
Sources: ISSB, SMR - Steel & Metals Market Research Analysis
Mar Apr May Jun Jul Aug Sep Oct Nov Dec Jan Feb
HR Sheet & Plate 11,581 19,718 14,111 14,479 13,775 14,231 12,552 17,811 14,199 13,827 20,061 20,482
CR Sheet 43,610 44,468 43,657 34,956 43,553 31,913 36,742 40,338 31,984 42,114 45,363 49,769
Round Bars 16,890 16,696 15,926 14,763 18,273 9,999 11,730 12,145 9,577 12,557 11,467 15,506
Non-circular Bars 5,107 3,901 3,684 3,909 5,521 3,214 3,886 4,597 3,244 3,574 5,150 4,209
Forged Bars 1,097 1,204 1,493 858 1,676 914 1,106 1,524 1,259 973 1,466 1,180
Profiles 1,156 823 902 935 995 513 903 984 797 635 1,220 1,163
Seamless Tubes 3,881 3,909 4,178 3,640 2,773 2,089 3,323 3,110 3,725 3,503 3,137 2,907
Welded Tubes (Rounds) 10,654 8,189 11,556 7,552 12,997 7,787 10,888 10,838 9,273 9,264 8,947 11,477
Welded Tubes (Square) 3,392 3,155 3,972 1,949 7,214 2,726 3,335 3,274 3,780 4,774 3,511 6,117
All Products 97,368 102,063 99,479 83,041 106,777 73,386 84,465 94,621 77,838 91,221 100,322 112,810
2011 2012 Change
ytd ytd ytd
HR Sheet & Plate 28,257 40,543 43%
CR Sheet 96,134 95,132 -1%
Round Bars 29,224 26,973 -8%
Non-circular Bars 7,911 9,359 18%
Forged Bars 2,421 2,646 9%
Profiles 2,108 2,383 13%
Seamless Tubes 6,126 6,044 -1%
Welded Tubes (Rounds) 17,733 20,424 15%
Welded Tubes (Square) 12,819 9,628 -25%
All Products 202,733 213,132 5%
Products
Products2011 2012
Report: Stainless Steel in Damstahl-Land, No. 12, May 2012© Damstahl 2012, Damstahl - a member of the NEUMO-Ehrenberg-Group - 13 -
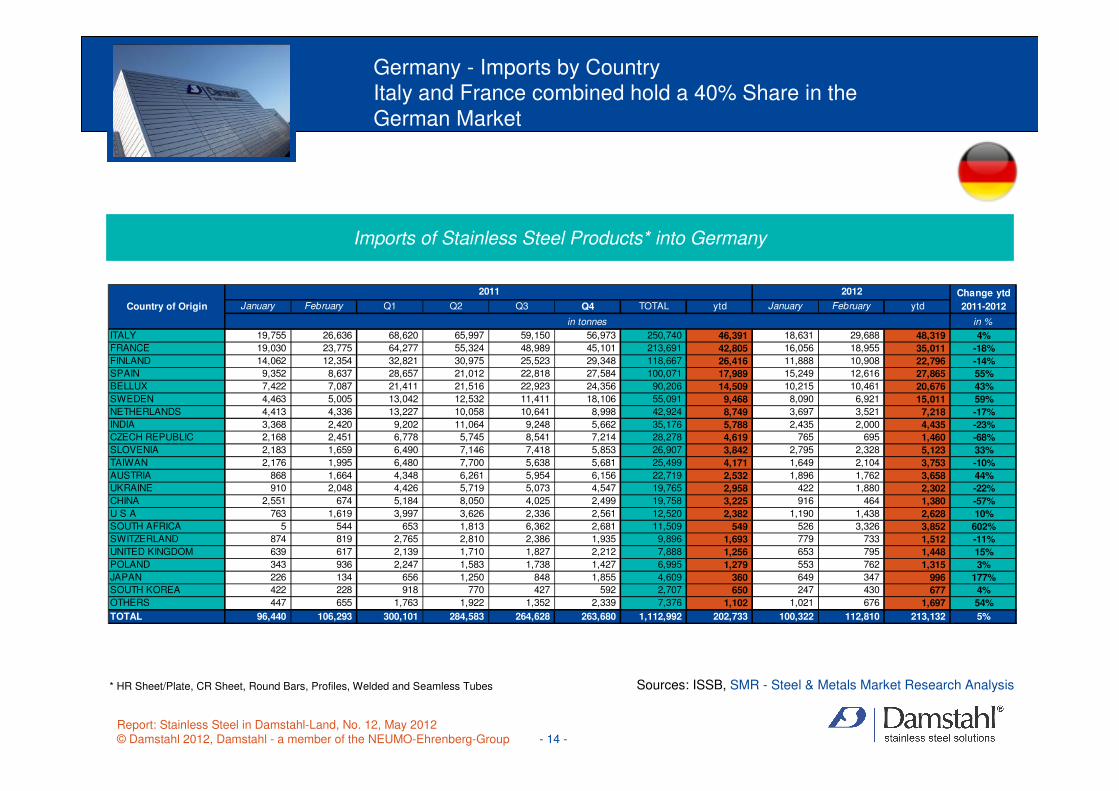
Germany - Imports by CountryItaly and France combined hold a 40% Share in the German Market
Imports of Stainless Steel Products* into Germany
* HR Sheet/Plate, CR Sheet, Round Bars, Profiles, Welded and Seamless Tubes Sources: ISSB, SMR - Steel & Metals Market Research Analysis
Change ytd
January February Q1 Q2 Q3 Q4 TOTAL ytd January February ytd 2011-2012
in %
ITALY 19,755 26,636 68,620 65,997 59,150 56,973 250,740 46,391 18,631 29,688 48,319 4%
FRANCE 19,030 23,775 64,277 55,324 48,989 45,101 213,691 42,805 16,056 18,955 35,011 -18%
FINLAND 14,062 12,354 32,821 30,975 25,523 29,348 118,667 26,416 11,888 10,908 22,796 -14%
SPAIN 9,352 8,637 28,657 21,012 22,818 27,584 100,071 17,989 15,249 12,616 27,865 55%
BELLUX 7,422 7,087 21,411 21,516 22,923 24,356 90,206 14,509 10,215 10,461 20,676 43%
SWEDEN 4,463 5,005 13,042 12,532 11,411 18,106 55,091 9,468 8,090 6,921 15,011 59%
NETHERLANDS 4,413 4,336 13,227 10,058 10,641 8,998 42,924 8,749 3,697 3,521 7,218 -17%
INDIA 3,368 2,420 9,202 11,064 9,248 5,662 35,176 5,788 2,435 2,000 4,435 -23%
CZECH REPUBLIC 2,168 2,451 6,778 5,745 8,541 7,214 28,278 4,619 765 695 1,460 -68%
SLOVENIA 2,183 1,659 6,490 7,146 7,418 5,853 26,907 3,842 2,795 2,328 5,123 33%
TAIWAN 2,176 1,995 6,480 7,700 5,638 5,681 25,499 4,171 1,649 2,104 3,753 -10%
AUSTRIA 868 1,664 4,348 6,261 5,954 6,156 22,719 2,532 1,896 1,762 3,658 44%
UKRAINE 910 2,048 4,426 5,719 5,073 4,547 19,765 2,958 422 1,880 2,302 -22%
CHINA 2,551 674 5,184 8,050 4,025 2,499 19,758 3,225 916 464 1,380 -57%
U S A 763 1,619 3,997 3,626 2,336 2,561 12,520 2,382 1,190 1,438 2,628 10%
SOUTH AFRICA 5 544 653 1,813 6,362 2,681 11,509 549 526 3,326 3,852 602%
SWITZERLAND 874 819 2,765 2,810 2,386 1,935 9,896 1,693 779 733 1,512 -11%
UNITED KINGDOM 639 617 2,139 1,710 1,827 2,212 7,888 1,256 653 795 1,448 15%
POLAND 343 936 2,247 1,583 1,738 1,427 6,995 1,279 553 762 1,315 3%
JAPAN 226 134 656 1,250 848 1,855 4,609 360 649 347 996 177%
SOUTH KOREA 422 228 918 770 427 592 2,707 650 247 430 677 4%
OTHERS 447 655 1,763 1,922 1,352 2,339 7,376 1,102 1,021 676 1,697 54%
TOTAL 96,440 106,293 300,101 284,583 264,628 263,680 1,112,992 202,733 100,322 112,810 213,132 5%
Country of Origin
2012
in tonnes
2011
Report: Stainless Steel in Damstahl-Land, No. 12, May 2012© Damstahl 2012, Damstahl - a member of the NEUMO-Ehrenberg-Group - 14 -
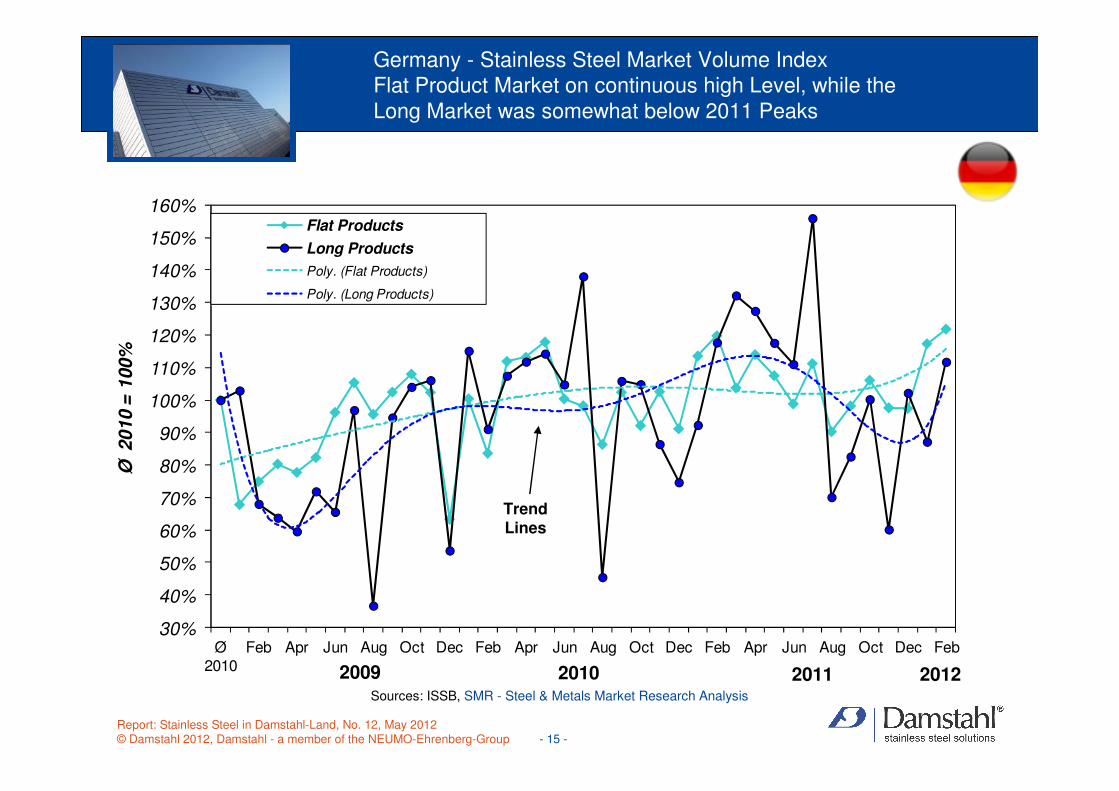
Germany - Stainless Steel Market Volume IndexFlat Product Market on continuous high Level, while the Long Market was somewhat below 2011 Peaks
30%
40%
50%
60%
70%
80%
90%
100%
110%
120%
130%
140%
150%
160%
Ø 2010
Feb Apr Jun Aug Oct Dec Feb Apr Jun Aug Oct Dec Feb Apr Jun Aug Oct Dec Feb
Ø 20
10 =
100%
Flat Products
Long Products
Poly. (Flat Products)
Poly. (Long Products)
Sources: ISSB, SMR - Steel & Metals Market Research Analysis
Trend Lines
2009 2010 2011 2012
Report: Stainless Steel in Damstahl-Land, No. 12, May 2012© Damstahl 2012, Damstahl - a member of the NEUMO-Ehrenberg-Group - 15 -
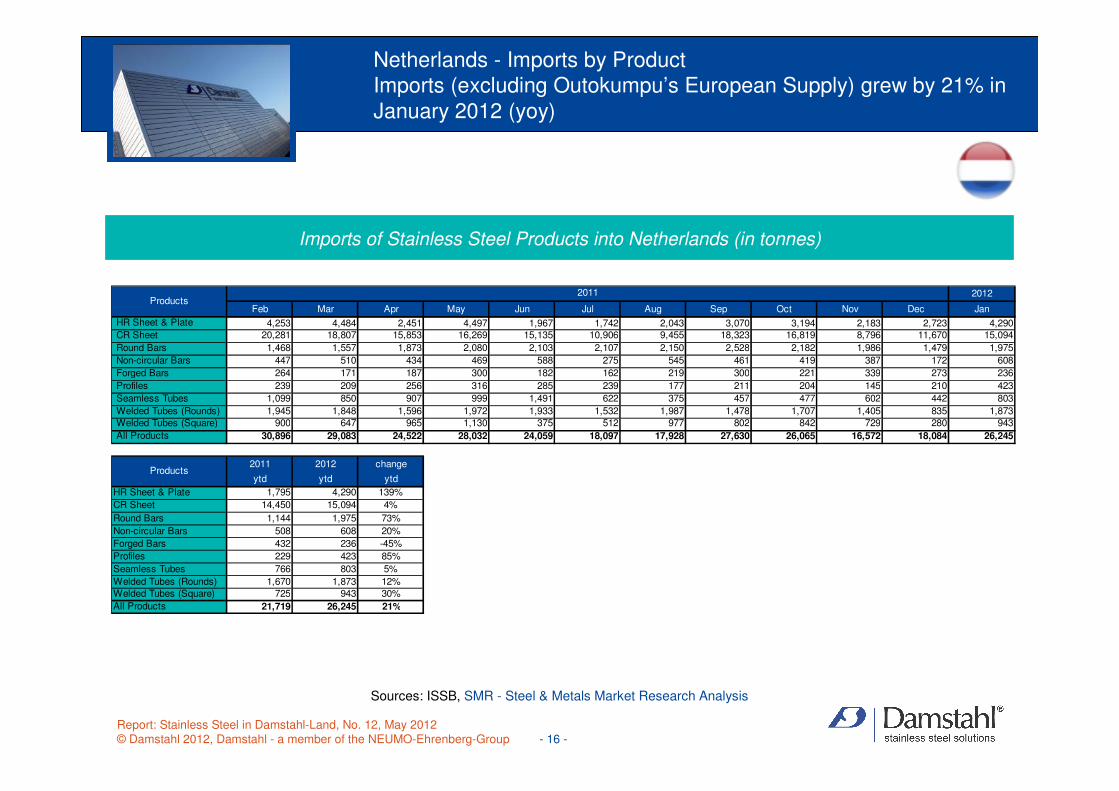
Netherlands - Imports by ProductImports (excluding Outokumpu’s European Supply) grew by 21% in January 2012 (yoy)
Imports of Stainless Steel Products into Netherlands (in tonnes)
Sources: ISSB, SMR - Steel & Metals Market Research Analysis
2012
Feb Mar Apr May Jun Jul Aug Sep Oct Nov Dec Jan
HR Sheet & Plate 4,253 4,484 2,451 4,497 1,967 1,742 2,043 3,070 3,194 2,183 2,723 4,290CR Sheet 20,281 18,807 15,853 16,269 15,135 10,906 9,455 18,323 16,819 8,796 11,670 15,094
Round Bars 1,468 1,557 1,873 2,080 2,103 2,107 2,150 2,528 2,182 1,986 1,479 1,975
Non-circular Bars 447 510 434 469 588 275 545 461 419 387 172 608
Forged Bars 264 171 187 300 182 162 219 300 221 339 273 236
Profiles 239 209 256 316 285 239 177 211 204 145 210 423
Seamless Tubes 1,099 850 907 999 1,491 622 375 457 477 602 442 803
Welded Tubes (Rounds) 1,945 1,848 1,596 1,972 1,933 1,532 1,987 1,478 1,707 1,405 835 1,873
Welded Tubes (Square) 900 647 965 1,130 375 512 977 802 842 729 280 943
All Products 30,896 29,083 24,522 28,032 24,059 18,097 17,928 27,630 26,065 16,572 18,084 26,245
2011 2012 change
ytd ytd ytd
HR Sheet & Plate 1,795 4,290 139%
CR Sheet 14,450 15,094 4%
Round Bars 1,144 1,975 73%
Non-circular Bars 508 608 20%
Forged Bars 432 236 -45%
Profiles 229 423 85%
Seamless Tubes 766 803 5%
Welded Tubes (Rounds) 1,670 1,873 12%
Welded Tubes (Square) 725 943 30%
All Products 21,719 26,245 21%
Products
Products
2011
Report: Stainless Steel in Damstahl-Land, No. 12, May 2012© Damstahl 2012, Damstahl - a member of the NEUMO-Ehrenberg-Group - 16 -

Netherlands - Imports by Country Instable Imports – The Netherlands is a Transfer Country for Stainless Steel Deliveries
Imports of Stainless Steel Products* into Netherlands
* HR Sheet/Plate, CR Sheet, Round Bars, Profiles, Welded and Seamless Tubes Sources: ISSB, SMR - Steel & Metals Market Research Analysis
Change ytd
January Q1 Q2 Q3 Q4 TOTAL ytd January ytd 2010-2011
in %
FINLAND 38,414 122,008 102,667 107,151 106,720 438,546 38,414 41,857 41,857 9%
SPAIN 5,197 19,968 11,781 10,648 13,186 55,583 5,197 8,547 8,547 64%
GERMANY 3,700 11,740 10,976 9,702 8,162 40,580 3,700 3,973 3,973 7%
ITALY 3,232 13,691 11,007 7,271 6,526 38,495 3,232 5,649 5,649 75%
BELLUX 1,195 9,100 13,276 8,110 9,472 39,958 1,195 1,737 1,737 45%
SOUTH AFRICA 833 4,755 4,561 4,598 4,908 18,822 833 700 700 -16%
TAIWAN 1,650 5,822 5,715 7,716 4,176 23,429 1,650 845 845 -49%
SWEDEN 1,140 2,729 2,374 1,967 1,949 9,019 1,140 1,275 1,275 12%
FRANCE 1,321 4,927 4,687 1,977 4,169 15,760 1,321 928 928 -30%
CHINA 1,460 3,391 5,728 4,165 2,198 15,482 1,460 360 360 -75%
INDIA 526 1,345 2,500 3,276 2,657 9,778 526 904 904 72%
JAPAN 196 603 608 303 354 1,868 196 247 247 26%
U S A 349 836 541 1,400 946 3,723 349 155 155 -56%
UNITED KINGDOM 192 616 874 397 396 2,283 192 133 133 -31%
BRAZIL 149 481 251 483 437 1,652 149 213 213 43%
SOUTH KOREA 91 346 233 109 164 852 91 34 34 -63%
SWITZERLAND 105 231 249 233 166 879 105 104 104 -1%
VIETNAM 18 286 233 175 108 802 18 - - -100%
UKRAINE 24 120 69 387 196 772 24 147 147 513%
MALAYSIA 94 191 329 223 24 767 94 - - -100%
POLAND 96 214 242 104 128 688 96 30 30 -69%
OTHERS 247 520 621 515 527 2,183 247 294 294 19%
TOTAL* 21,719 81,698 76,613 63,655 60,721 282,687 21,719 26,245 26,245 21%
** excl. Finland
Country of Origin
in tonnes
2011 2012
Report: Stainless Steel in Damstahl-Land, No. 12, May 2012© Damstahl 2012, Damstahl - a member of the NEUMO-Ehrenberg-Group - 17 -
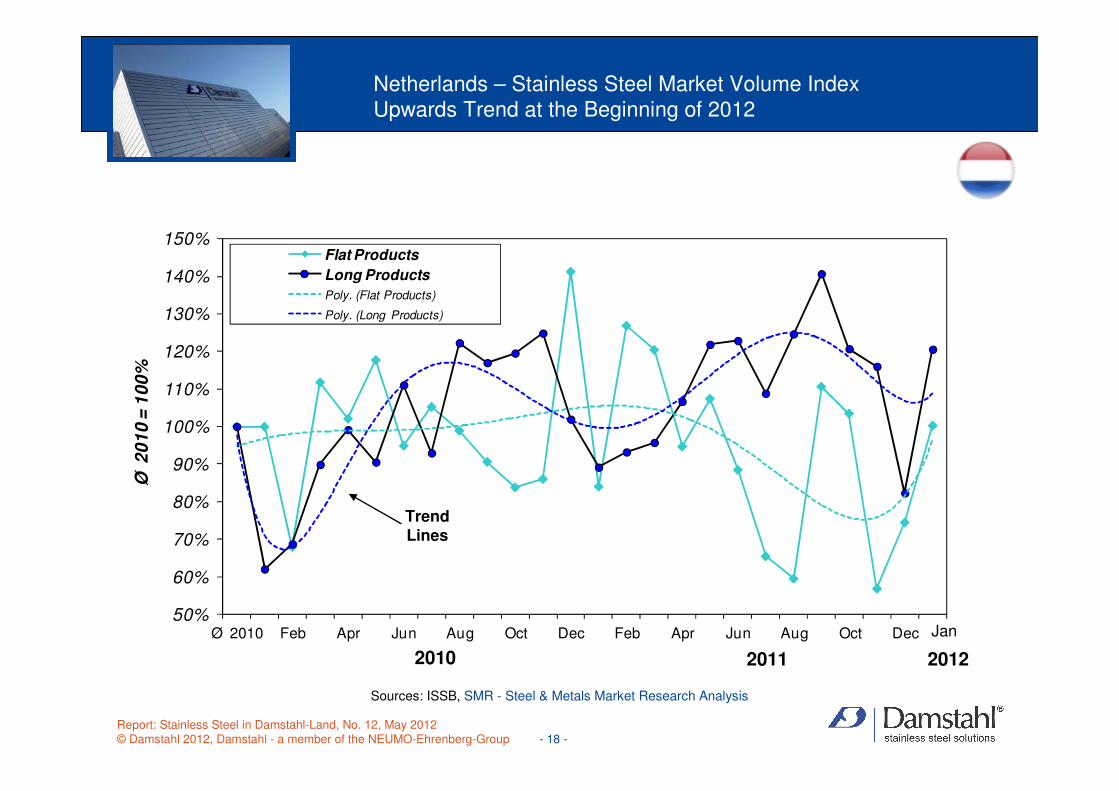
Netherlands – Stainless Steel Market Volume IndexUpwards Trend at the Beginning of 2012
Sources: ISSB, SMR - Steel & Metals Market Research Analysis
50%
60%
70%
80%
90%
100%
110%
120%
130%
140%
150%
Ø 2010 Feb Apr Jun Aug Oct Dec Feb Apr Jun Aug Oct Dec
Ø 2
01
0 =
10
0%
Flat Products
Long Products
Poly. (Flat Products)
Poly. (Long Products)
Trend Lines
2010 2011
Jan
2012
Report: Stainless Steel in Damstahl-Land, No. 12, May 2012© Damstahl 2012, Damstahl - a member of the NEUMO-Ehrenberg-Group - 18 -
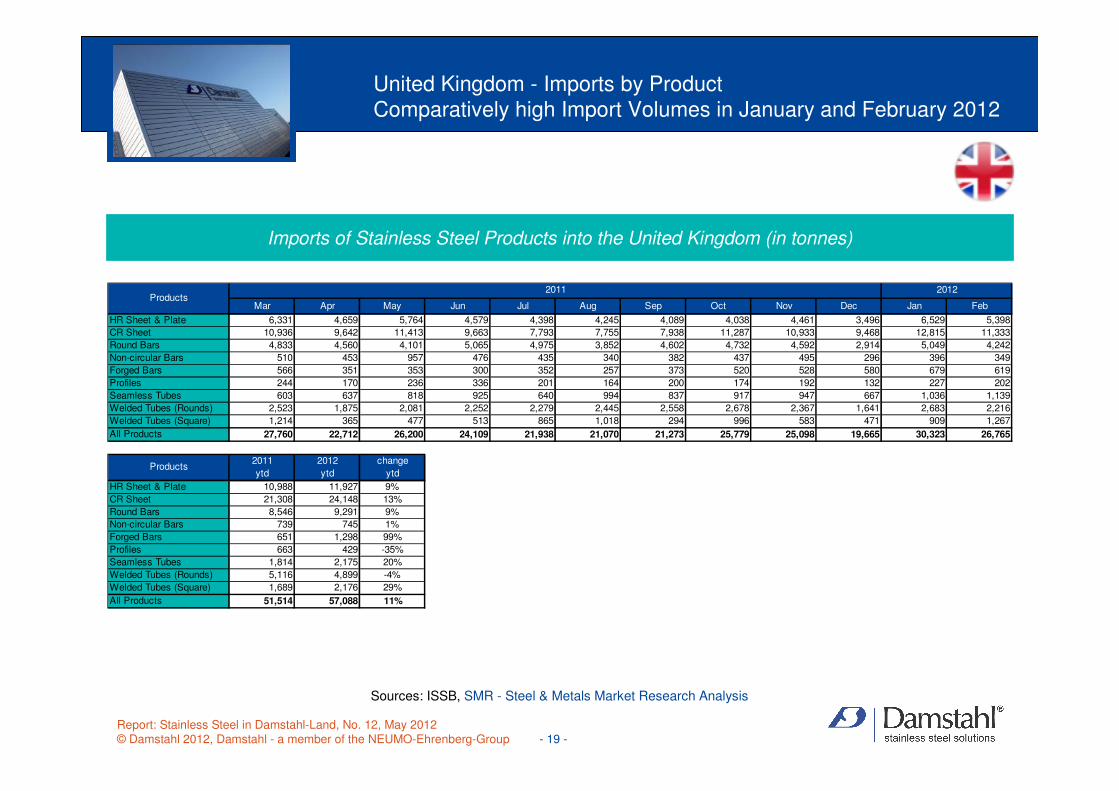
United Kingdom - Imports by ProductComparatively high Import Volumes in January and February 2012
Imports of Stainless Steel Products into the United Kingdom (in tonnes)
Sources: ISSB, SMR - Steel & Metals Market Research Analysis
Mar Apr May Jun Jul Aug Sep Oct Nov Dec Jan Feb
HR Sheet & Plate 6,331 4,659 5,764 4,579 4,398 4,245 4,089 4,038 4,461 3,496 6,529 5,398
CR Sheet 10,936 9,642 11,413 9,663 7,793 7,755 7,938 11,287 10,933 9,468 12,815 11,333
Round Bars 4,833 4,560 4,101 5,065 4,975 3,852 4,602 4,732 4,592 2,914 5,049 4,242
Non-circular Bars 510 453 957 476 435 340 382 437 495 296 396 349
Forged Bars 566 351 353 300 352 257 373 520 528 580 679 619
Profiles 244 170 236 336 201 164 200 174 192 132 227 202
Seamless Tubes 603 637 818 925 640 994 837 917 947 667 1,036 1,139
Welded Tubes (Rounds) 2,523 1,875 2,081 2,252 2,279 2,445 2,558 2,678 2,367 1,641 2,683 2,216
Welded Tubes (Square) 1,214 365 477 513 865 1,018 294 996 583 471 909 1,267
All Products 27,760 22,712 26,200 24,109 21,938 21,070 21,273 25,779 25,098 19,665 30,323 26,765
2011 2012 change
ytd ytd ytd
HR Sheet & Plate 10,988 11,927 9%
CR Sheet 21,308 24,148 13%
Round Bars 8,546 9,291 9%
Non-circular Bars 739 745 1%
Forged Bars 651 1,298 99%
Profiles 663 429 -35%
Seamless Tubes 1,814 2,175 20%
Welded Tubes (Rounds) 5,116 4,899 -4%
Welded Tubes (Square) 1,689 2,176 29%
All Products 51,514 57,088 11%
Products
Products2011 2012
Report: Stainless Steel in Damstahl-Land, No. 12, May 2012© Damstahl 2012, Damstahl - a member of the NEUMO-Ehrenberg-Group - 19 -
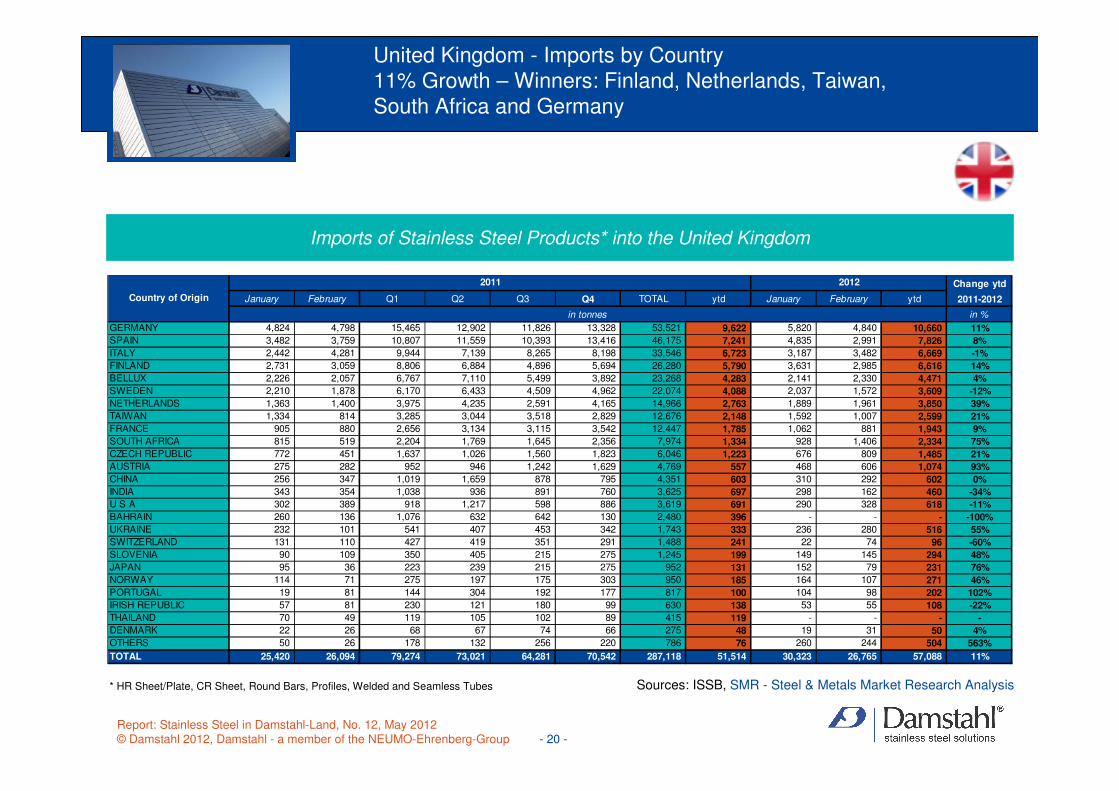
United Kingdom - Imports by Country11% Growth – Winners: Finland, Netherlands, Taiwan, South Africa and Germany
Imports of Stainless Steel Products* into the United Kingdom
* HR Sheet/Plate, CR Sheet, Round Bars, Profiles, Welded and Seamless Tubes Sources: ISSB, SMR - Steel & Metals Market Research Analysis
Change ytd
January February Q1 Q2 Q3 Q4 TOTAL ytd January February ytd 2011-2012
in %
GERMANY 4,824 4,798 15,465 12,902 11,826 13,328 53,521 9,622 5,820 4,840 10,660 11%
SPAIN 3,482 3,759 10,807 11,559 10,393 13,416 46,175 7,241 4,835 2,991 7,826 8%
ITALY 2,442 4,281 9,944 7,139 8,265 8,198 33,546 6,723 3,187 3,482 6,669 -1%
FINLAND 2,731 3,059 8,806 6,884 4,896 5,694 26,280 5,790 3,631 2,985 6,616 14%
BELLUX 2,226 2,057 6,767 7,110 5,499 3,892 23,268 4,283 2,141 2,330 4,471 4%
SWEDEN 2,210 1,878 6,170 6,433 4,509 4,962 22,074 4,088 2,037 1,572 3,609 -12%
NETHERLANDS 1,363 1,400 3,975 4,235 2,591 4,165 14,966 2,763 1,889 1,961 3,850 39%
TAIWAN 1,334 814 3,285 3,044 3,518 2,829 12,676 2,148 1,592 1,007 2,599 21%
FRANCE 905 880 2,656 3,134 3,115 3,542 12,447 1,785 1,062 881 1,943 9%
SOUTH AFRICA 815 519 2,204 1,769 1,645 2,356 7,974 1,334 928 1,406 2,334 75%
CZECH REPUBLIC 772 451 1,637 1,026 1,560 1,823 6,046 1,223 676 809 1,485 21%
AUSTRIA 275 282 952 946 1,242 1,629 4,769 557 468 606 1,074 93%
CHINA 256 347 1,019 1,659 878 795 4,351 603 310 292 602 0%
INDIA 343 354 1,038 936 891 760 3,625 697 298 162 460 -34%
U S A 302 389 918 1,217 598 886 3,619 691 290 328 618 -11%
BAHRAIN 260 136 1,076 632 642 130 2,480 396 - - - -100%
UKRAINE 232 101 541 407 453 342 1,743 333 236 280 516 55%
SWITZERLAND 131 110 427 419 351 291 1,488 241 22 74 96 -60%
SLOVENIA 90 109 350 405 215 275 1,245 199 149 145 294 48%
JAPAN 95 36 223 239 215 275 952 131 152 79 231 76%
NORWAY 114 71 275 197 175 303 950 185 164 107 271 46%
PORTUGAL 19 81 144 304 192 177 817 100 104 98 202 102%
IRISH REPUBLIC 57 81 230 121 180 99 630 138 53 55 108 -22%
THAILAND 70 49 119 105 102 89 415 119 - - - -
DENMARK 22 26 68 67 74 66 275 48 19 31 50 4%
OTHERS 50 26 178 132 256 220 786 76 260 244 504 563%
TOTAL 25,420 26,094 79,274 73,021 64,281 70,542 287,118 51,514 30,323 26,765 57,088 11%
Country of Origin
2011 2012
in tonnes
Report: Stainless Steel in Damstahl-Land, No. 12, May 2012© Damstahl 2012, Damstahl - a member of the NEUMO-Ehrenberg-Group - 20 -
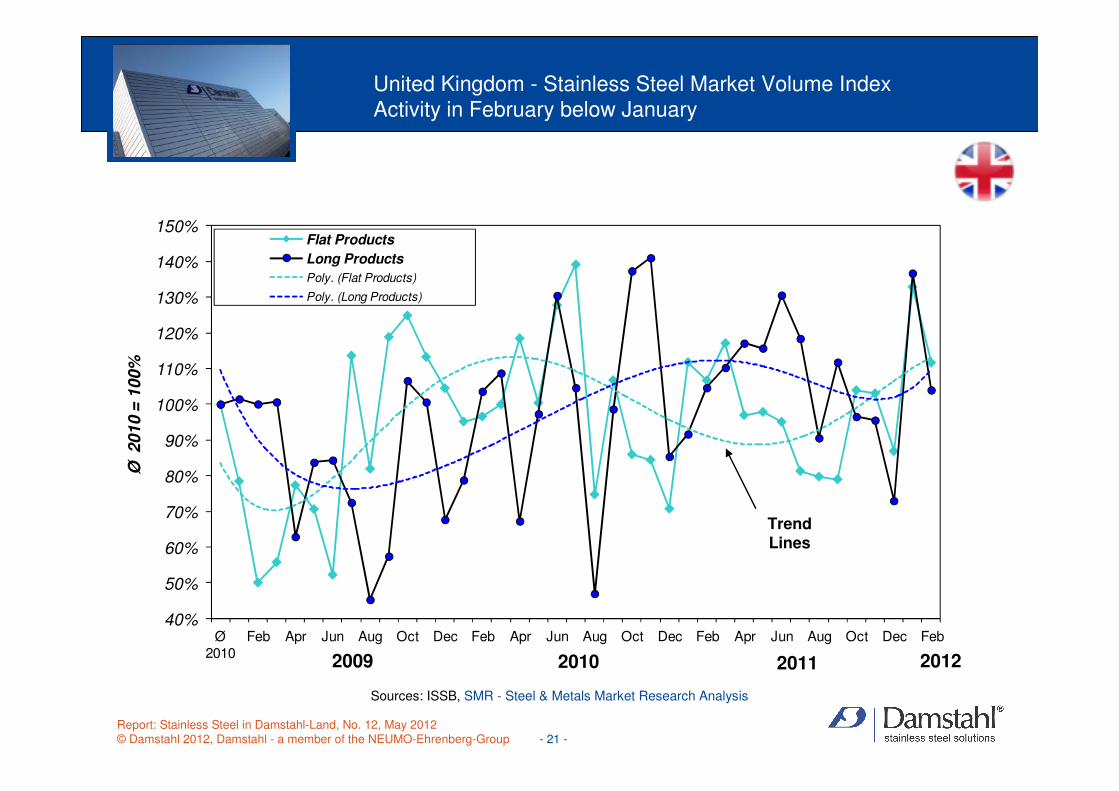
United Kingdom - Stainless Steel Market Volume IndexActivity in February below January
Sources: ISSB, SMR - Steel & Metals Market Research Analysis
40%
50%
60%
70%
80%
90%
100%
110%
120%
130%
140%
150%
Ø 2010
Feb Apr Jun Aug Oct Dec Feb Apr Jun Aug Oct Dec Feb Apr Jun Aug Oct Dec Feb
Ø 201
0 =
10
0%
Flat Products
Long Products
Poly. (Flat Products)
Poly. (Long Products)
Trend Lines
2009 2010 2011 2012
Report: Stainless Steel in Damstahl-Land, No. 12, May 2012© Damstahl 2012, Damstahl - a member of the NEUMO-Ehrenberg-Group - 21 -

Denmark - Imports by ProductJanuary 2012: highest Import Volume since March 2011
Imports of Stainless Steel Products into Denmark (in tonnes)
Sources: ISSB, SMR - Steel & Metals Market Research Analysis
2012
Feb Mar Apr May Jun Jul Aug Sep Oct Nov Dec Jan
HR Sheet & Plate 913 1,238 1,086 1,100 951 910 955 1,057 1,055 848 795 842
CR Sheet 4,668 5,878 4,544 4,298 4,683 5,092 5,109 4,924 4,475 4,940 3,870 5,061
Round Bars 1,232 1,449 1,186 1,132 1,270 968 1,271 1,248 1,152 1,241 1,174 1,219
Non-circular Bars 117 167 125 144 167 127 116 164 192 141 161 176
Forged Bars 210 176 89 104 78 131 134 86 113 142 99 149
Profiles 98 88 133 134 145 134 136 142 125 101 139 124
Seamless Tubes 160 257 154 173 174 155 171 138 162 210 185 251
Welded Tubes (Rounds) 1,048 1,103 750 788 884 1,054 1,057 996 911 1,372 1,444 1,254
Welded Tubes (Square) 537 1,547 614 1,272 1,317 674 528 595 990 903 526 1,320
All Products 8,983 11,903 8,681 9,145 9,669 9,245 9,477 9,350 9,175 9,898 8,393 10,396
2011 2012 change
ytd ytd ytd
HR Sheet & Plate 1,051 842 -20%
CR Sheet 5,299 5,061 -4%
Round Bars 1,478 1,219 -18%
Non-circular Bars 110 176 60%
Forged Bars 147 149 1%
Profiles 120 124 3%
Seamless Tubes 176 251 43%
Welded Tubes (Rounds) 936 1,254 34%
Welded Tubes (Square) 469 1,320 181%
All Products 9,786 10,396 6%
Products
Products
2011
Report: Stainless Steel in Damstahl-Land, No. 12, May 2012© Damstahl 2012, Damstahl - a member of the NEUMO-Ehrenberg-Group - 22 -
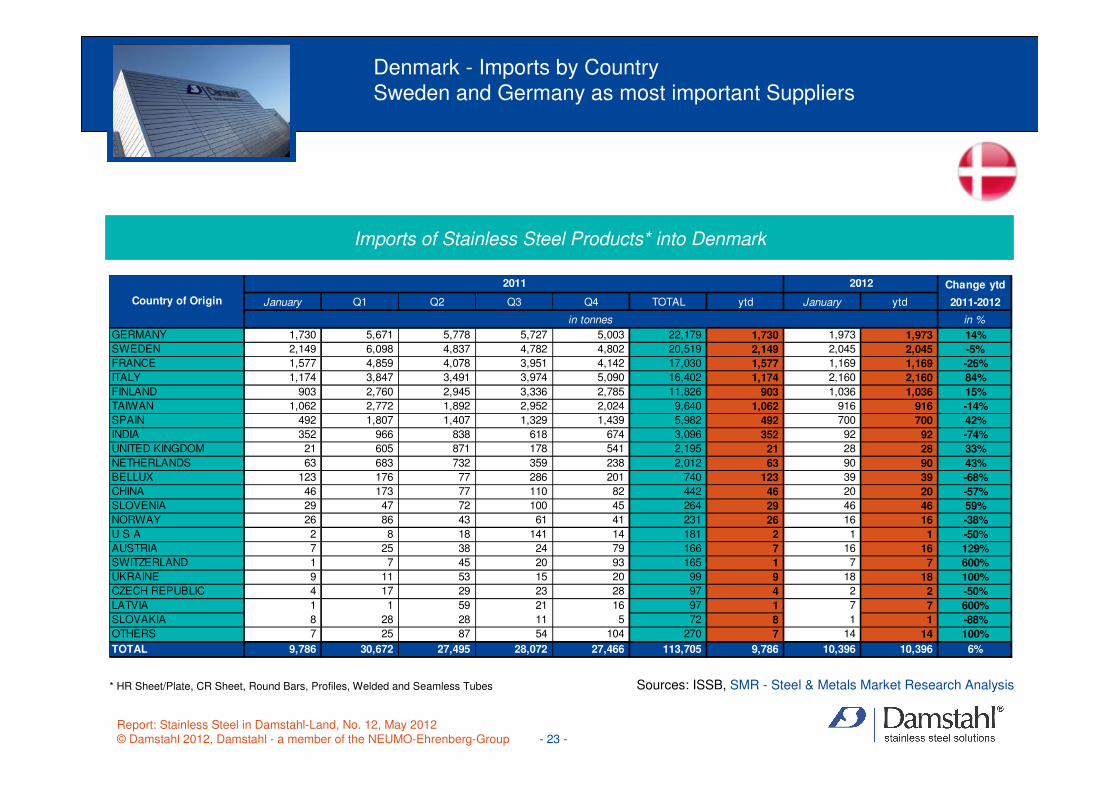
Denmark - Imports by CountrySweden and Germany as most important Suppliers
Imports of Stainless Steel Products* into Denmark
* HR Sheet/Plate, CR Sheet, Round Bars, Profiles, Welded and Seamless Tubes Sources: ISSB, SMR - Steel & Metals Market Research Analysis
Change ytd
January Q1 Q2 Q3 Q4 TOTAL ytd January ytd 2011-2012
in %
GERMANY 1,730 5,671 5,778 5,727 5,003 22,179 1,730 1,973 1,973 14%
SWEDEN 2,149 6,098 4,837 4,782 4,802 20,519 2,149 2,045 2,045 -5%
FRANCE 1,577 4,859 4,078 3,951 4,142 17,030 1,577 1,169 1,169 -26%
ITALY 1,174 3,847 3,491 3,974 5,090 16,402 1,174 2,160 2,160 84%
FINLAND 903 2,760 2,945 3,336 2,785 11,826 903 1,036 1,036 15%
TAIWAN 1,062 2,772 1,892 2,952 2,024 9,640 1,062 916 916 -14%
SPAIN 492 1,807 1,407 1,329 1,439 5,982 492 700 700 42%
INDIA 352 966 838 618 674 3,096 352 92 92 -74%
UNITED KINGDOM 21 605 871 178 541 2,195 21 28 28 33%
NETHERLANDS 63 683 732 359 238 2,012 63 90 90 43%
BELLUX 123 176 77 286 201 740 123 39 39 -68%
CHINA 46 173 77 110 82 442 46 20 20 -57%
SLOVENIA 29 47 72 100 45 264 29 46 46 59%
NORWAY 26 86 43 61 41 231 26 16 16 -38%
U S A 2 8 18 141 14 181 2 1 1 -50%
AUSTRIA 7 25 38 24 79 166 7 16 16 129%
SWITZERLAND 1 7 45 20 93 165 1 7 7 600%
UKRAINE 9 11 53 15 20 99 9 18 18 100%
CZECH REPUBLIC 4 17 29 23 28 97 4 2 2 -50%
LATVIA 1 1 59 21 16 97 1 7 7 600%
SLOVAKIA 8 28 28 11 5 72 8 1 1 -88%
OTHERS 7 25 87 54 104 270 7 14 14 100%
TOTAL 9,786 30,672 27,495 28,072 27,466 113,705 9,786 10,396 10,396 6%
Country of Origin
in tonnes
2011 2012
Report: Stainless Steel in Damstahl-Land, No. 12, May 2012© Damstahl 2012, Damstahl - a member of the NEUMO-Ehrenberg-Group - 23 -
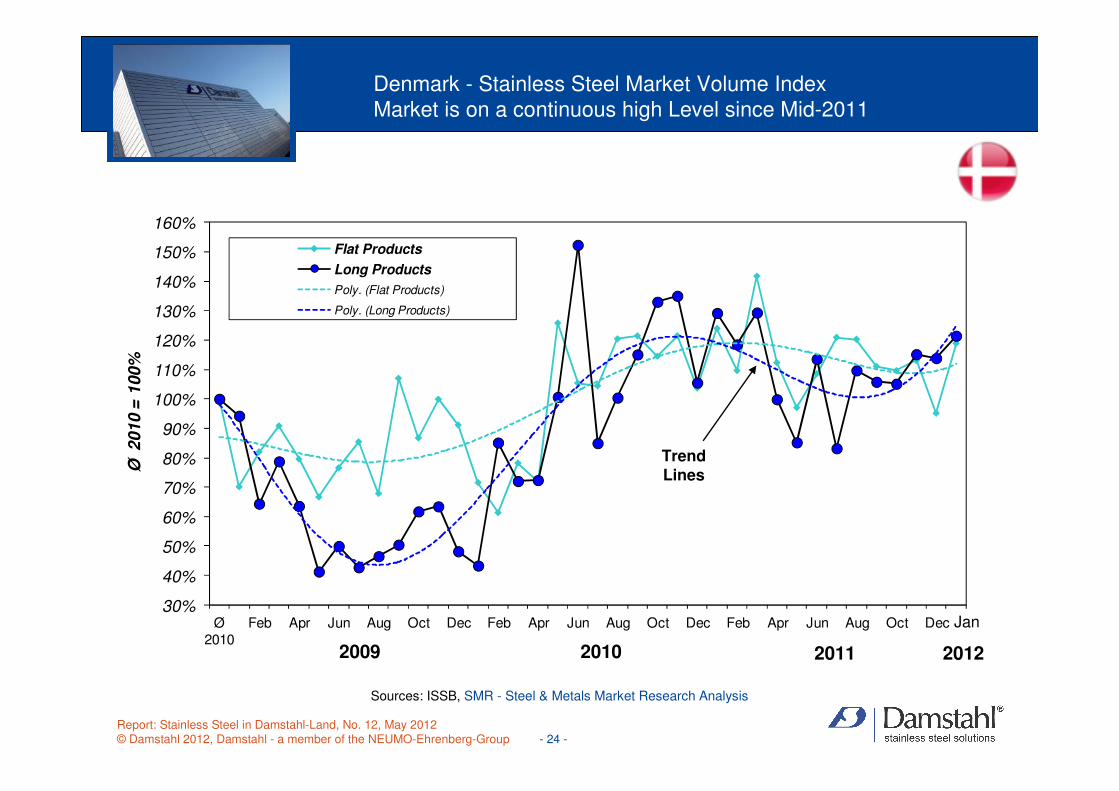
Denmark - Stainless Steel Market Volume IndexMarket is on a continuous high Level since Mid-2011
Sources: ISSB, SMR - Steel & Metals Market Research Analysis
30%
40%
50%
60%
70%
80%
90%
100%
110%
120%
130%
140%
150%
160%
Ø 2010
Feb Apr Jun Aug Oct Dec Feb Apr Jun Aug Oct Dec Feb Apr Jun Aug Oct Dec
Ø 2
010
= 1
00%
Flat Products
Long Products
Poly. (Flat Products)
Poly. (Long Products)
Trend Lines
2009 2010 2011 2012
Jan
Report: Stainless Steel in Damstahl-Land, No. 12, May 2012© Damstahl 2012, Damstahl - a member of the NEUMO-Ehrenberg-Group - 24 -
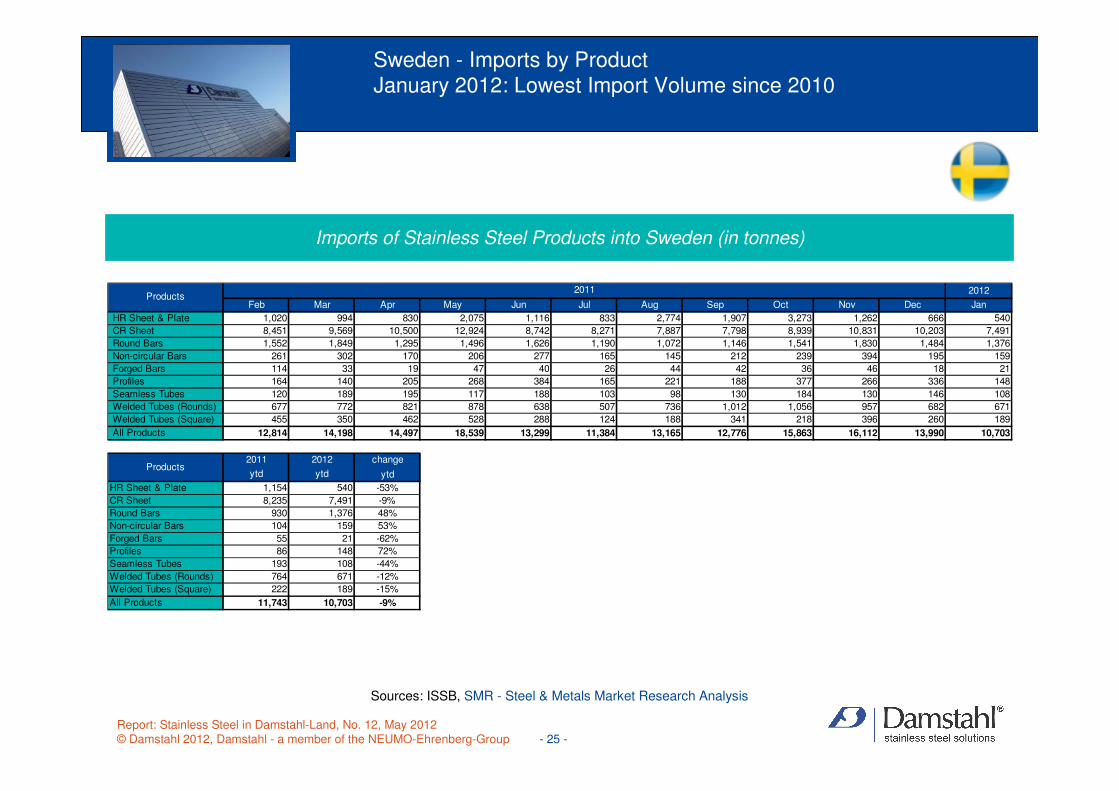
Sweden - Imports by ProductJanuary 2012: Lowest Import Volume since 2010
Imports of Stainless Steel Products into Sweden (in tonnes)
Sources: ISSB, SMR - Steel & Metals Market Research Analysis
2012
Feb Mar Apr May Jun Jul Aug Sep Oct Nov Dec Jan
HR Sheet & Plate 1,020 994 830 2,075 1,116 833 2,774 1,907 3,273 1,262 666 540
CR Sheet 8,451 9,569 10,500 12,924 8,742 8,271 7,887 7,798 8,939 10,831 10,203 7,491
Round Bars 1,552 1,849 1,295 1,496 1,626 1,190 1,072 1,146 1,541 1,830 1,484 1,376
Non-circular Bars 261 302 170 206 277 165 145 212 239 394 195 159
Forged Bars 114 33 19 47 40 26 44 42 36 46 18 21
Profiles 164 140 205 268 384 165 221 188 377 266 336 148
Seamless Tubes 120 189 195 117 188 103 98 130 184 130 146 108
Welded Tubes (Rounds) 677 772 821 878 638 507 736 1,012 1,056 957 682 671
Welded Tubes (Square) 455 350 462 528 288 124 188 341 218 396 260 189
All Products 12,814 14,198 14,497 18,539 13,299 11,384 13,165 12,776 15,863 16,112 13,990 10,703
2011 2012 change
ytd ytd ytd
HR Sheet & Plate 1,154 540 -53%
CR Sheet 8,235 7,491 -9%
Round Bars 930 1,376 48%
Non-circular Bars 104 159 53%
Forged Bars 55 21 -62%
Profiles 86 148 72%
Seamless Tubes 193 108 -44%
Welded Tubes (Rounds) 764 671 -12%
Welded Tubes (Square) 222 189 -15%
All Products 11,743 10,703 -9%
Products
Products2011
Report: Stainless Steel in Damstahl-Land, No. 12, May 2012© Damstahl 2012, Damstahl - a member of the NEUMO-Ehrenberg-Group - 25 -
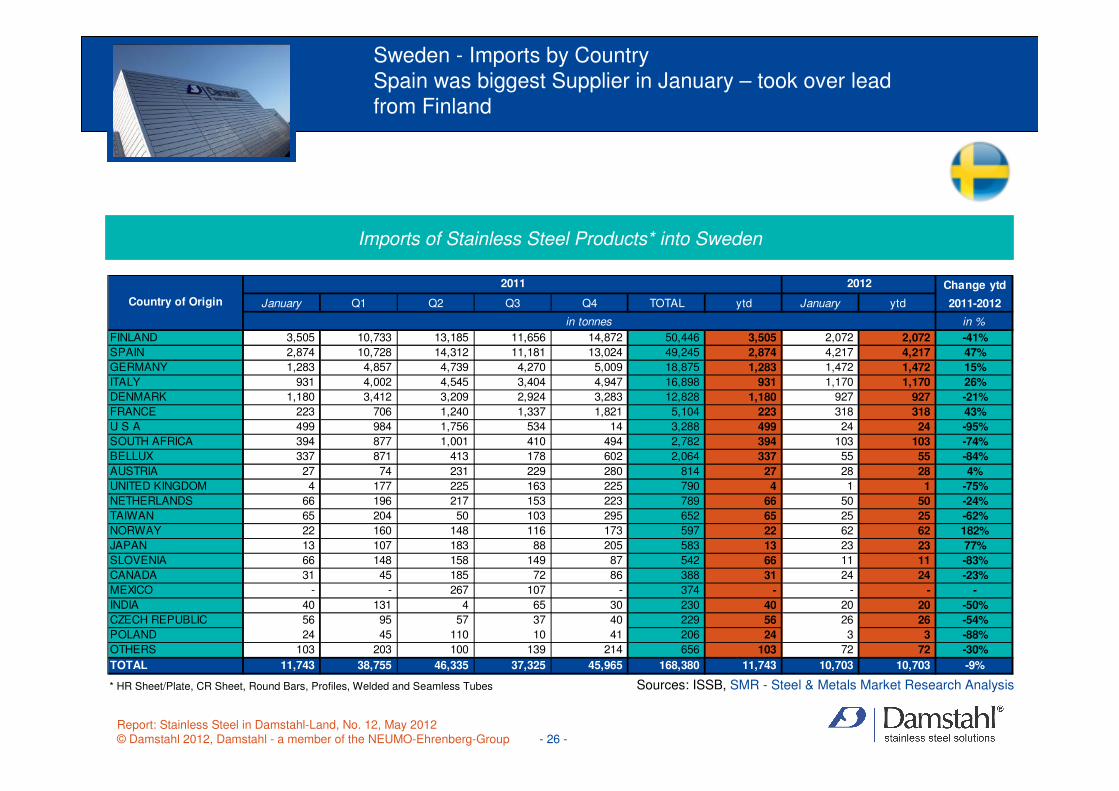
Sweden - Imports by Country Spain was biggest Supplier in January – took over lead from Finland
Imports of Stainless Steel Products* into Sweden
* HR Sheet/Plate, CR Sheet, Round Bars, Profiles, Welded and Seamless Tubes Sources: ISSB, SMR - Steel & Metals Market Research Analysis
Change ytd
January Q1 Q2 Q3 Q4 TOTAL ytd January ytd 2011-2012
in %
FINLAND 3,505 10,733 13,185 11,656 14,872 50,446 3,505 2,072 2,072 -41%
SPAIN 2,874 10,728 14,312 11,181 13,024 49,245 2,874 4,217 4,217 47%
GERMANY 1,283 4,857 4,739 4,270 5,009 18,875 1,283 1,472 1,472 15%
ITALY 931 4,002 4,545 3,404 4,947 16,898 931 1,170 1,170 26%
DENMARK 1,180 3,412 3,209 2,924 3,283 12,828 1,180 927 927 -21%
FRANCE 223 706 1,240 1,337 1,821 5,104 223 318 318 43%
U S A 499 984 1,756 534 14 3,288 499 24 24 -95%
SOUTH AFRICA 394 877 1,001 410 494 2,782 394 103 103 -74%
BELLUX 337 871 413 178 602 2,064 337 55 55 -84%
AUSTRIA 27 74 231 229 280 814 27 28 28 4%
UNITED KINGDOM 4 177 225 163 225 790 4 1 1 -75%
NETHERLANDS 66 196 217 153 223 789 66 50 50 -24%
TAIWAN 65 204 50 103 295 652 65 25 25 -62%
NORWAY 22 160 148 116 173 597 22 62 62 182%
JAPAN 13 107 183 88 205 583 13 23 23 77%
SLOVENIA 66 148 158 149 87 542 66 11 11 -83%
CANADA 31 45 185 72 86 388 31 24 24 -23%
MEXICO - - 267 107 - 374 - - - -
INDIA 40 131 4 65 30 230 40 20 20 -50%
CZECH REPUBLIC 56 95 57 37 40 229 56 26 26 -54%
POLAND 24 45 110 10 41 206 24 3 3 -88%
OTHERS 103 203 100 139 214 656 103 72 72 -30%
TOTAL 11,743 38,755 46,335 37,325 45,965 168,380 11,743 10,703 10,703 -9%
Country of Origin
2011 2012
in tonnes
Report: Stainless Steel in Damstahl-Land, No. 12, May 2012© Damstahl 2012, Damstahl - a member of the NEUMO-Ehrenberg-Group - 26 -
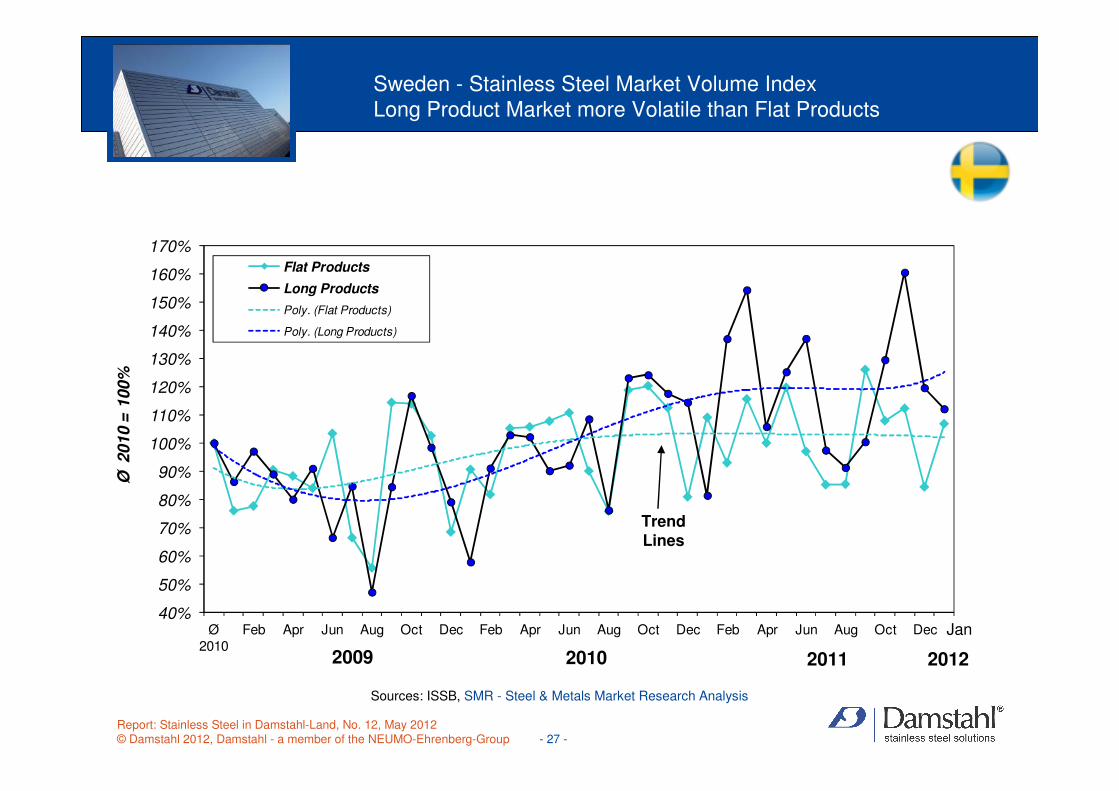
Sweden - Stainless Steel Market Volume Index Long Product Market more Volatile than Flat Products
Sources: ISSB, SMR - Steel & Metals Market Research Analysis
40%
50%
60%
70%
80%
90%
100%
110%
120%
130%
140%
150%
160%
170%
Ø 2010
Feb Apr Jun Aug Oct Dec Feb Apr Jun Aug Oct Dec Feb Apr Jun Aug Oct Dec
Ø 2010 =
100%
Flat Products
Long Products
Poly. (Flat Products)
Poly. (Long Products)
Trend Lines
2009 2010 2011 2012
Jan
Report: Stainless Steel in Damstahl-Land, No. 12, May 2012© Damstahl 2012, Damstahl - a member of the NEUMO-Ehrenberg-Group - 27 -
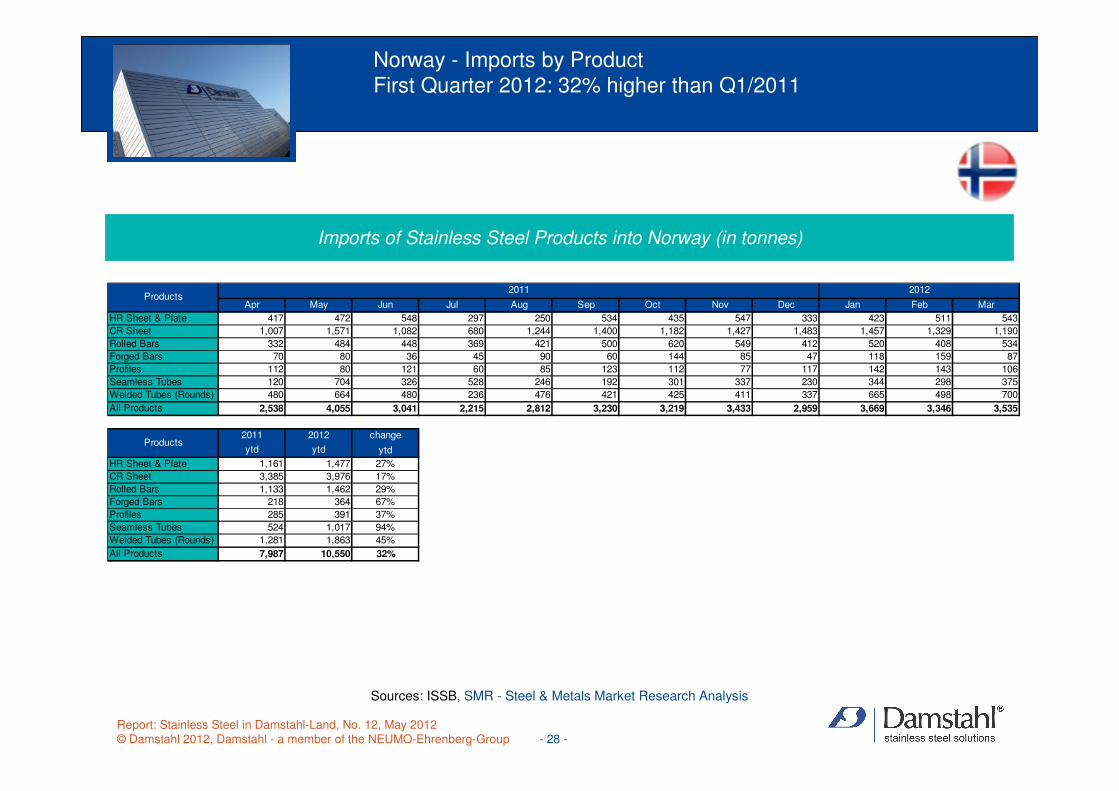
Norway - Imports by ProductFirst Quarter 2012: 32% higher than Q1/2011
Imports of Stainless Steel Products into Norway (in tonnes)
Sources: ISSB, SMR - Steel & Metals Market Research Analysis
Apr May Jun Jul Aug Sep Oct Nov Dec Jan Feb Mar
HR Sheet & Plate 417 472 548 297 250 534 435 547 333 423 511 543
CR Sheet 1,007 1,571 1,082 680 1,244 1,400 1,182 1,427 1,483 1,457 1,329 1,190
Rolled Bars 332 484 448 369 421 500 620 549 412 520 408 534
Forged Bars 70 80 36 45 90 60 144 85 47 118 159 87
Profiles 112 80 121 60 85 123 112 77 117 142 143 106
Seamless Tubes 120 704 326 528 246 192 301 337 230 344 298 375
Welded Tubes (Rounds) 480 664 480 236 476 421 425 411 337 665 498 700
All Products 2,538 4,055 3,041 2,215 2,812 3,230 3,219 3,433 2,959 3,669 3,346 3,535
2011 2012 change
ytd ytd ytd
HR Sheet & Plate 1,161 1,477 27%
CR Sheet 3,385 3,976 17%
Rolled Bars 1,133 1,462 29%
Forged Bars 218 364 67%
Profiles 285 391 37%
Seamless Tubes 524 1,017 94%
Welded Tubes (Rounds) 1,281 1,863 45%
All Products 7,987 10,550 32%
Products
Products2011 2012
Report: Stainless Steel in Damstahl-Land, No. 12, May 2012© Damstahl 2012, Damstahl - a member of the NEUMO-Ehrenberg-Group - 28 -
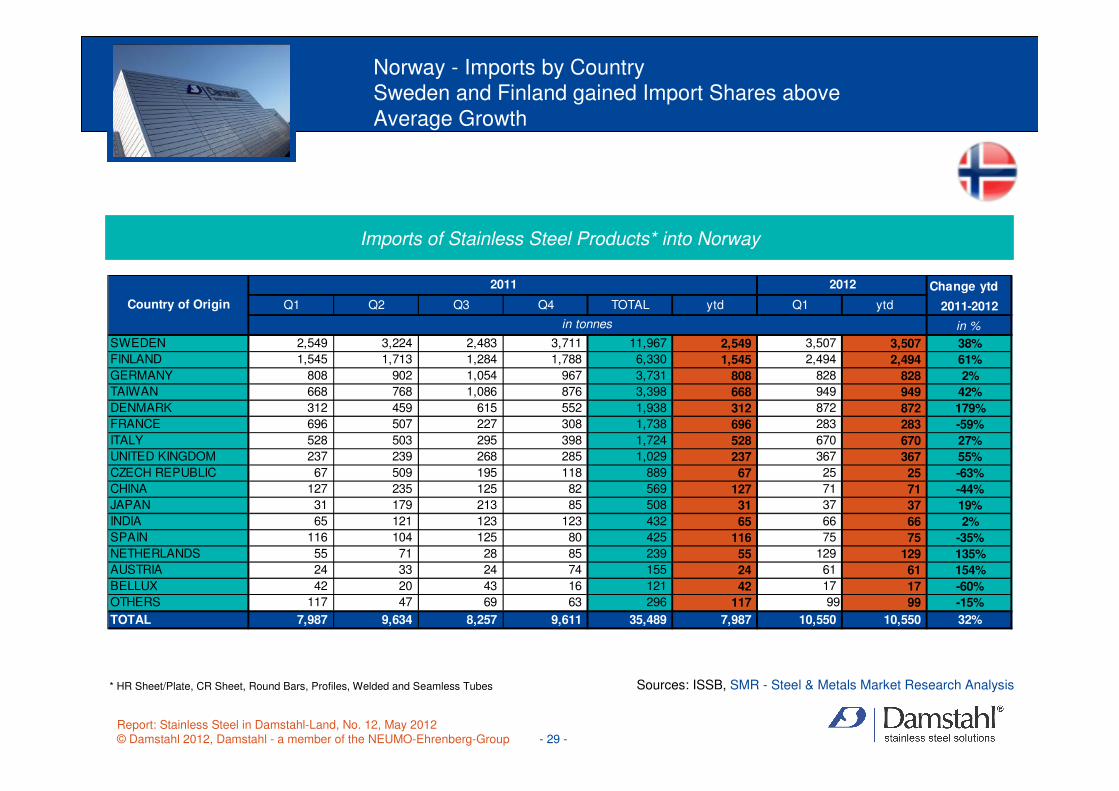
Norway - Imports by Country Sweden and Finland gained Import Shares above Average Growth
Imports of Stainless Steel Products* into Norway
* HR Sheet/Plate, CR Sheet, Round Bars, Profiles, Welded and Seamless Tubes Sources: ISSB, SMR - Steel & Metals Market Research Analysis
Change ytd
Q1 Q2 Q3 Q4 TOTAL ytd Q1 ytd 2011-2012
in %
SWEDEN 2,549 3,224 2,483 3,711 11,967 2,549 3,507 3,507 38%
FINLAND 1,545 1,713 1,284 1,788 6,330 1,545 2,494 2,494 61%
GERMANY 808 902 1,054 967 3,731 808 828 828 2%
TAIWAN 668 768 1,086 876 3,398 668 949 949 42%
DENMARK 312 459 615 552 1,938 312 872 872 179%
FRANCE 696 507 227 308 1,738 696 283 283 -59%
ITALY 528 503 295 398 1,724 528 670 670 27%
UNITED KINGDOM 237 239 268 285 1,029 237 367 367 55%
CZECH REPUBLIC 67 509 195 118 889 67 25 25 -63%
CHINA 127 235 125 82 569 127 71 71 -44%
JAPAN 31 179 213 85 508 31 37 37 19%
INDIA 65 121 123 123 432 65 66 66 2%
SPAIN 116 104 125 80 425 116 75 75 -35%
NETHERLANDS 55 71 28 85 239 55 129 129 135%
AUSTRIA 24 33 24 74 155 24 61 61 154%
BELLUX 42 20 43 16 121 42 17 17 -60%
OTHERS 117 47 69 63 296 117 99 99 -15%
TOTAL 7,987 9,634 8,257 9,611 35,489 7,987 10,550 10,550 32%
Country of Origin
in tonnes
2011 2012
Report: Stainless Steel in Damstahl-Land, No. 12, May 2012© Damstahl 2012, Damstahl - a member of the NEUMO-Ehrenberg-Group - 29 -
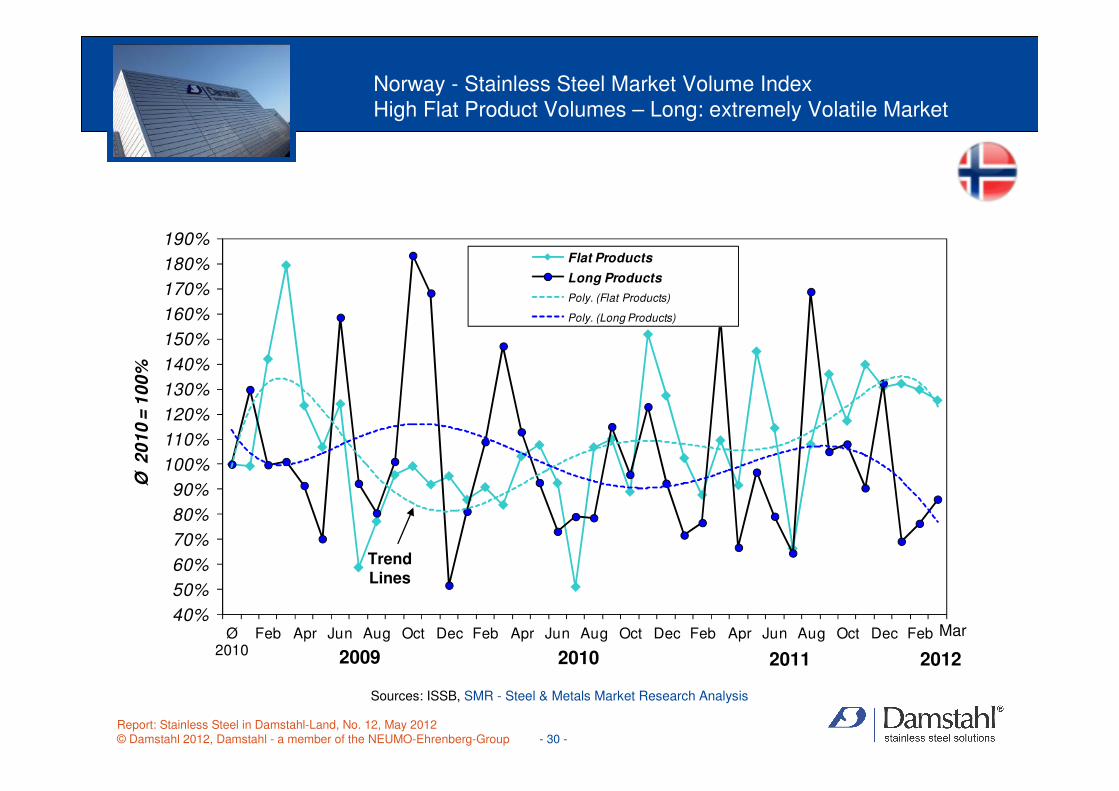
Norway - Stainless Steel Market Volume Index High Flat Product Volumes – Long: extremely Volatile Market
Sources: ISSB, SMR - Steel & Metals Market Research Analysis
40%
50%
60%
70%
80%
90%
100%
110%
120%
130%
140%
150%
160%
170%
180%
190%
Ø 2010
Feb Apr Jun Aug Oct Dec Feb Apr Jun Aug Oct Dec Feb Apr Jun Aug Oct Dec Feb
Ø 2
01
0 =
10
0%
Flat Products
Long Products
Poly. (Flat Products)
Poly. (Long Products)
Trend Lines
2009 2010 2011 2012
Mar
Report: Stainless Steel in Damstahl-Land, No. 12, May 2012© Damstahl 2012, Damstahl - a member of the NEUMO-Ehrenberg-Group - 30 -

• Nickel
• Chrome
• Molybdenum
• Scrap
Raw Materials
Report: Stainless Steel in Damstahl-Land, No. 12, May 2012© Damstahl 2012, Damstahl - a member of the NEUMO-Ehrenberg-Group - 31 -
Raw Materials - Nickel and ChromeNi Price down, Cr Price up...
• NICKEL, LME Ni prices in May fell below 17,500 US$ per t (8 $/lb), thus having dropped from a peak of almost 22,000 US$/t in January 2012 to around 17,000 US$/t. It is difficult to predict the price development of the near future. After first signs of a slight recovery in late April, prices have started to fall again since then.
• NPI Indonesia: A major reason for this drop is that the announced Ni price supporting Indonesian export ban for laterite nickel ore will not materialize. It seems that laterite ores can still be supplied from Indonesia with a (tentative) 20% export tax. This seems to be acceptable for Chinese NPI industry. This is bad news for conventional Ni producers because enough NPI will be there also in the future. Alternative, a quota regulation for ore exporter is discussed in Indonesia.
• NPI in the Future: NPI production increased to around 225,000 t in 2011. No substantial growth of production is expected for this year. New NPI projects in China apply RKEFs (rotary kiln electric furnaces) for high grade NPI (12% Ni) – which can be produced cost competitive at Ni price of ~14,000 US$/t. A doubling of these capacities is planned for the next years. Indonesia is a major ore supplier for NPI. Further NPI growth also depends on how much Indonesia will lift export duties for NPI.
• Ni demand from stainless steel mills is subdued (particularly in Europe and China) after a relatively strong first quarter.
• INSG (International Nickel Study Group) expects that demand will exceed supply this year by around 60,000 t (= supply surplus). This is an indicator that at least high nickel price increases are not very realistic at the moment.
• CHROME: Agreement between European stainless steel mills and South African Ni supplier about a 20 ct price increase to 1.35 US$ per lb. South African mills have suspended a high number of FeCr smelters until beginning of May (some such as IFM even until June) due to tight electricity supply. Thanks to this measurements, South African suppliers have created a FeCr tightness amid a (theoretically) weak demand for FeCr.
• China: Chinese mills did not accept such high prices as they have other sources for Cr. They import LG2 ores from South Africa and convert them in own FeCr smelters in China. The South African government plans to introduce a tax on CrOre exports in order to keep South African smelters competitive against Chinese smelters (fed by South African ores).
Report: Stainless Steel in Damstahl-Land, No. 12, May 2012© Damstahl 2012, Damstahl - a member of the NEUMO-Ehrenberg-Group - 32 -
Raw Materials - Molybdenum and Stainless Steel ScrapImproved Demand leads to increasing FeMo and 18/8 Scrap Prices
• MOLYBDENUM – Demand for Mo is stagnant. Important end uses such as project industry, mechanical engineering and automotive are currently not growing. Mo is primarily used in these applications in non-stainless applications (especially in alloy engineering steels) – but has also a direct price impact on general Mo prices applied also for stainless.
• Fe Mo prices are however relatively stable at the moment. Current price levels are around 33-34 US$ per kg for FeMo and up to 32 US$ per kg for drummed molybdic oxide. The small price gap between Mo Oxide and FeMo makes conversion not very attractive.
• In contrast to 2009 and 2010 when there was substantial up-stocking of Mo, supply and demand have been in balance in 2011. Particularly Chinese producers and distributors supplied also material from stock. All in all, consumption and supply were both around 240 kt last year.
• Mo demand increased by 13% in 2011 – driven by increasing Mo containing steel production in China, NAFTA and Europe.
• Mercator Mining (Canada) will make a decision on the development timetable for its El Creston Mo project in Sonora (Mexico) in the second half of this year, after the filing of an updated technical report. El Creston is expected to produce approx. 24 mill. lbs pounds of Mo per year (~4% of global consumption).
• STAINLESS STEEL SCRAP - Demand for 18-8 scrap has slowed at the beginning of Q2/12 due to softer order intake at stainless steel mills – but is considered still as satisfactory by scrap merchants. In spite of a comparatively week demand, discounts on intrinsic raw material in scrap have somewhat increased again in recent weeks. In contrast to 18/8 scrap, Mo containing stainless scrap is however still tight.
• Availability: Scrap availability has normalized again after a period of low availability which is normal after a Ni price drop. Nevertheless, periods with little scrap availability usually do not last long as small stainless steel scrap dealers cannot hold back material for long. Due to this mechanism, availability has improved again in a market with falling Ni price. Big players (being customers of these dealers) have the material available again, but due to their economy now being stronger they do not sell to the mills at any price.They provide material with a lower discount in such a case.
Report: Stainless Steel in Damstahl-Land, No. 12, May 2012© Damstahl 2012, Damstahl - a member of the NEUMO-Ehrenberg-Group - 33 -
• U.S Stainless Steel Market Summary 2011
• U.S. Stainless Steel Market in 2012 and beyond
• Export / Import Analysis
Focus of the Month: The New Tiger: U.S. Market outperformed all others in 2011
Report: Stainless Steel in Damstahl-Land, No. 12, May 2012© Damstahl 2012, Damstahl - a member of the NEUMO-Ehrenberg-Group - 34 -
Report: Stainless Steel in Damstahl-Land, No. 12, May 2012© Damstahl 2012, Damstahl - a member of the NEUMO-Ehrenberg-Group - 35 -
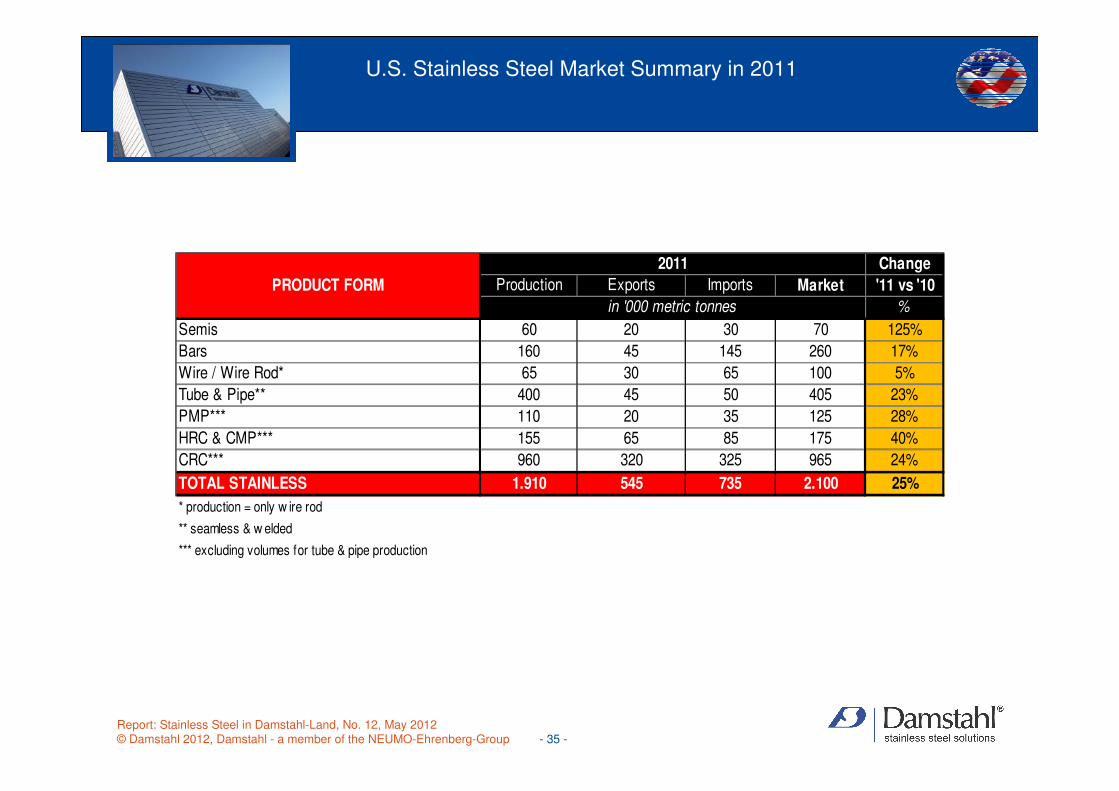
U.S. Stainless Steel Market Summary in 2011
Change
Production Exports Imports Market '11 vs '10
%
Semis 60 20 30 70 125%
Bars 160 45 145 260 17%
Wire / Wire Rod* 65 30 65 100 5%
Tube & Pipe** 400 45 50 405 23%
PMP*** 110 20 35 125 28%
HRC & CMP*** 155 65 85 175 40%
CRC*** 960 320 325 965 24%
TOTAL STAINLESS 1.910 545 735 2.100 25%
* production = only w ire rod
** seamless & w elded
*** excluding volumes for tube & pipe production
PRODUCT FORM
2011
in '000 metric tonnes
Report: Stainless Steel in Damstahl-Land, No. 12, May 2012© Damstahl 2012, Damstahl - a member of the NEUMO-Ehrenberg-Group - 36 -
• Summary: After the astonishing year 2011 with a total growth rate of 25%, the US stainless steel market is still in a good shape in Q1/12, although loosing some dynamics at the end of the quarter. Increasing Ni prices at the beginning of 2012 have initiated a short up-stocking phase till February. Stainless steel demand in the first two months of 2012 was 9% higher than in 2011. In March 2012, stockholders reacted on a substantial Ni price correction, leading to a slowing order intake at U.S. mills for Q2/12 deliveries and falling stocks. America has been the main global growth driver in 2011 (+25%), outperforming even China and the Rest of the World.
• Outlook 2012: In total, the market grew by 25% in 2011. All product forms except wire and wire rod (5%) grew at double-digit rates. Such an extraordinary growth can not be expected again in 2012, but a growth rate of 5% seems to be realistic.
• Stocks: US stocks dropped by 5% from end of February 2012 to end of March 2012. The stock level at the end of March was the lowest level since September 2010. After a strong year 2011, the supply chain is far from being overstocked. Thus, orders from stockholders have to remain at robust levels in the next months even if the nickel weakness continues.
• US Production: Crude steel production in Q1/12 was substantially below the extraordinary strong Q1/11 but also significantly higher than the last two quarters in 2011. Finished product shipments however showed only slight growth (+2%) in the first two months of 2012. The main reason for the increasing gap between a falling crude production and increasing product shipments is that Inoxum does not yet melt in the United States. They import HR coils (and slabs from July on) for re-rolling in Alabama from Italy. NAS has increased melting production in Q1/12 (+4%). AK Steel’s production in Q1/12 was 4% lower than a year ago. Allegheny Technology's flat segment sales decreased 10%, maybe a first sign of increased competition with Inoxum.
U.S. Stainless Steel Market in 2012 and beyond
Report: Stainless Steel in Damstahl-Land, No. 12, May 2012© Damstahl 2012, Damstahl - a member of the NEUMO-Ehrenberg-Group - 37 -
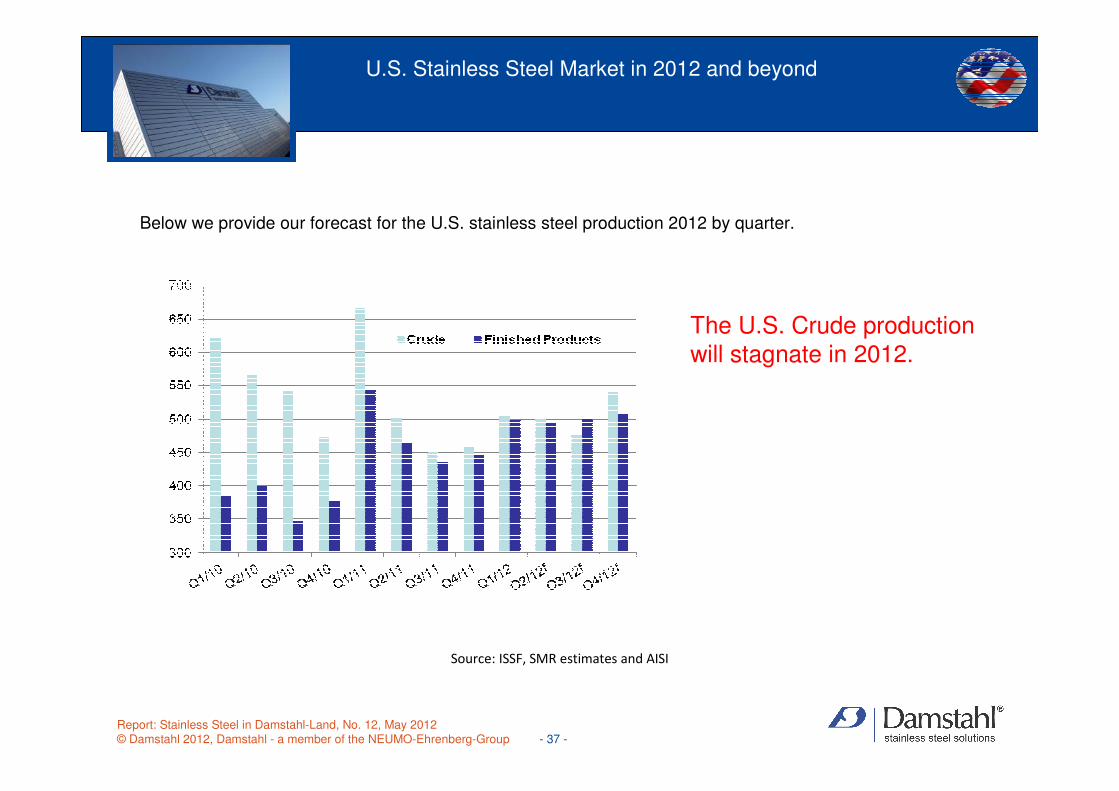
Below we provide our forecast for the U.S. stainless steel production 2012 by quarter.
U.S. Stainless Steel Market in 2012 and beyond
Source: ISSF, SMR estimates and AISI
The U.S. Crude productionwill stagnate in 2012.

Report: Stainless Steel in Damstahl-Land, No. 12, May 2012© Damstahl 2012, Damstahl - a member of the NEUMO-Ehrenberg-Group - 38 -
U.S. Stainless Steel Imports and Exports 2000 – 2011 and 2012f
U.S. Stainless Steel Market – Import / Export Analysis
Source: USITC and SMR estimates
The U.S. Could become a net stainless steel exporterfor the 1st time in 2013!
Report: Stainless Steel in Damstahl-Land, No. 11, March 2012© Damstahl 2012, Damstahl - a member of the NEUMO-Ehrenberg-Group - 39 -