uk fact booklet 2011-2012 - university of kentucky
TRANSCRIPT
FACT BOOKLET2011-2012UNIVERSITY OF KENTUCKY

- 1 -
Table of ContentsLetter from President Eli Capilouto 2-3UK Mission and Vision 4Enrollment 5-9First-year Student Profile 10-11Retention and Graduation Rates 12-13Degrees Conferred 14-16Annual Tuition and Fees 17Full-time Employees 18-19Faculty Statistics 20-22Faculty Salaries 23Budgeted Revenue and Expenditures 24-25
Private Giving 26Grant and Contract Awards 27Research and Development 28University Endowment 29Library Collections 30Benchmark Institutions 31Administrative Organization 32Board of Trustees 33Administrative History 34UK Values 35
- 2 -
January 2012
In compliance with KRS 164.250, I am pleased to provide you with the 2011-2012 Fact Booklet, a collection of current facts and statistics about people and programs at the University of Kentucky. Many items in this booklet are of interest to our stakeholders and the general public, including statistics on enrollments, retention, research expenditures, and faculty salaries. A summary of the 2011-2012 Operating and Capital Budget is also included in this electronic publica-tion.
The University of Kentucky had a banner year with the fourth consecutive year of increased enrollment and second consecutive year of record enrollments. Over 28,000 students were enrolled at the University, including historically high numbers of undergraduates and doctoral students enrolled in professional practice programs. UK also attracted record numbers of African-Americans and international students enrolled in undergraduate programs. Hispanic stu-dents have doubled since 2006 and our total population of international students has tripled in that time.
We received a record number of applications, more than 15,000, for admission to the fall 2011 semester – a 12 percent increase over the previous year. Over the last several years, we have increased the size of our undergraduate student population while attracting more talented first-year students. The fall 2011 freshman class set two new UK records by presenting a 3.63 high school GPA and average ACT composite score of 25.4. The fall-to-fall retention rate of the previous freshman class surpassed 80 percent for the fourth year in a row.
The University of Kentucky’s mission is based on a profoundly important idea that a nationally and internationally renowned university can be the catalyst for change and growth in the 21st century. That mission – our promise to Kentucky – has never been more vital. As Kentucky’s flagship, land grant research university, we remain steadfast in our effort to find creative solutions to complex challenges; to provide the best education to our students; to create a campus culture that is responsive and supportive of our faculty and staff; and to uplift people and com-munities across the Commonwealth.
As we continue our ascent, we hope to build a better University of Kentucky, and through it, a better future for our state.
Sincerely,
Eli CapiloutoPresident
- 3 -

- 4 -
The University of Kentucky will be one of the nation’s 20 best public research universities.
VISION
MISSION
-- Adopted by the Board of Trustees, June 9, 2009
The University of Kentucky is a public, land grant university dedicated to improving people’s lives through excellence in education, research and creative work, service, and health care. As Kentucky’s flagship institution, the University plays a critical leadership role by promoting diversity, inclusion, economic development, and human well-being.
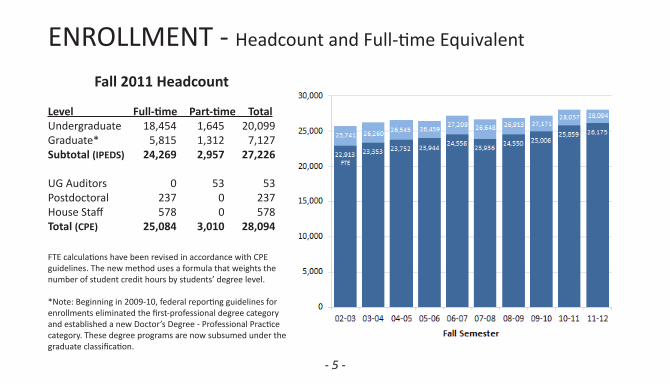
ENROLLMENT - Headcount and Full-time Equivalent
Fall 2011 Headcount
Level Full-time Part-time TotalUndergraduate 18,454 1,645 20,099Graduate* 5,815 1,312 7,127Subtotal (IPEDS) 24,269 2,957 27,226
UG Auditors 0 53 53Postdoctoral 237 0 237House Staff 578 0 578Total (CPE) 25,084 3,010 28,094
- 5 -
FTE calculations have been revised in accordance with CPE guidelines. The new method uses a formula that weights the number of student credit hours by students’ degree level.
*Note: Beginning in 2009-10, federal reporting guidelines for enrollments eliminated the first-professional degree category and established a new Doctor’s Degree - Professional Practice category. These degree programs are now subsumed under the graduate classification.
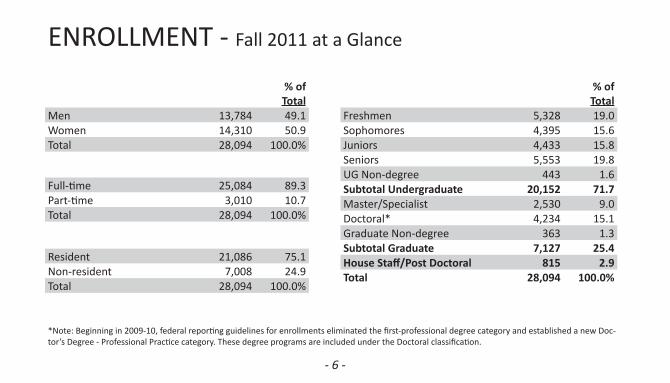
ENROLLMENT - Fall 2011 at a Glance
- 6 -
*Note: Beginning in 2009-10, federal reporting guidelines for enrollments eliminated the first-professional degree category and established a new Doc-tor’s Degree - Professional Practice category. These degree programs are included under the Doctoral classification.
% of Total
Men 13,784 49.1Women 14,310 50.9Total 28,094 100.0%
Full-time 25,084 89.3Part-time 3,010 10.7Total 28,094 100.0%
Resident 21,086 75.1Non-resident 7,008 24.9Total 28,094 100.0%
% of Total
Freshmen 5,328 19.0Sophomores 4,395 15.6Juniors 4,433 15.8Seniors 5,553 19.8UG Non-degree 443 1.6Subtotal Undergraduate 20,152 71.7Master/Specialist 2,530 9.0Doctoral* 4,234 15.1Graduate Non-degree 363 1.3Subtotal Graduate 7,127 25.4HouseStaff/PostDoctoral 815 2.9Total 28,094 100.0%
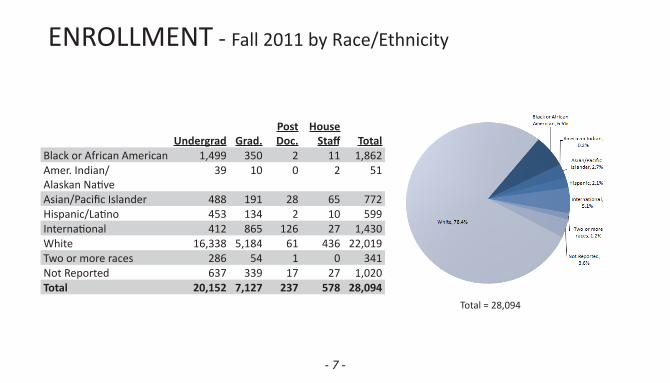
ENROLLMENT - Fall 2011 by Race/Ethnicity
- 7 -
Total = 28,094
Undergrad Grad.PostDoc.
HouseStaff Total
Black or African American 1,499 350 2 11 1,862Amer. Indian/ Alaskan Native
39 10 0 2 51
Asian/Pacific Islander 488 191 28 65 772Hispanic/Latino 453 134 2 10 599International 412 865 126 27 1,430White 16,338 5,184 61 436 22,019Two or more races 286 54 1 0 341Not Reported 637 339 17 27 1,020Total 20,152 7,127 237 578 28,094

- 8 -
UNDERGRADUATES - by Residency Status
YearKentuckyResidents
Out-of-StateStudents
Fall 2011 15,949 4,203
Fall 2010 15,933 4,055
Fall 2009 15,457 3,760
Fall 2008 15,197 3,791
Fall 2007 15,196 3,634
Fall 2006 15,757 3,571
Fall 2005 15,481 3,251
Fall 2004 15,587 2,905
Fall 2003 15,486 2,704
Fall 2002 15,348 2,530
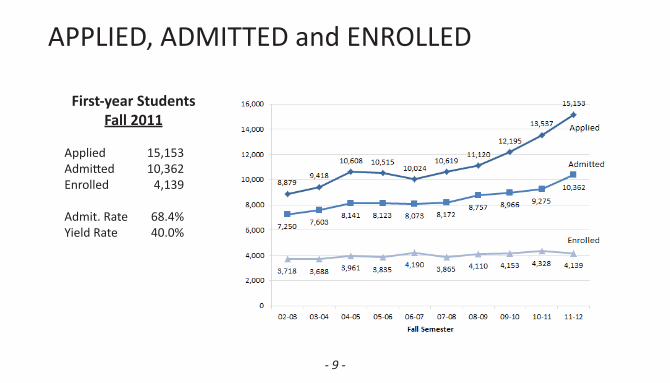
APPLIED, ADMITTED and ENROLLED
- 9 -
First-year StudentsFall 2011
Applied 15,153 Admitted 10,362 Enrolled 4,139
Admit. Rate 68.4% Yield Rate 40.0%
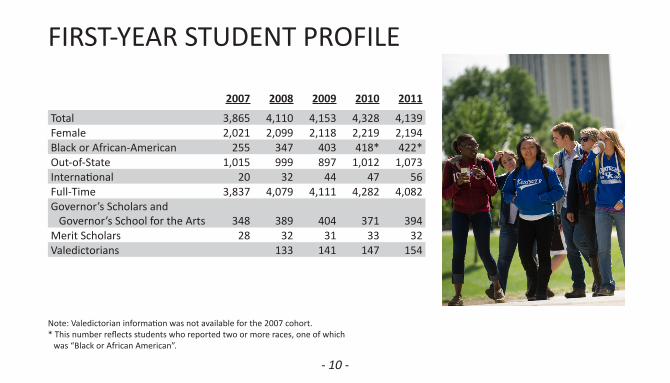
FIRST-YEAR STUDENT PROFILE
- 10 -
Note: Valedictorian information was not available for the 2007 cohort.* This number reflects students who reported two or more races, one of which
was “Black or African American”.
2007 2008 2009 2010 2011
Total 3,865 4,110 4,153 4,328 4,139Female 2,021 2,099 2,118 2,219 2,194Black or African-American 255 347 403 418* 422*Out-of-State 1,015 999 897 1,012 1,073International 20 32 44 47 56Full-Time 3,837 4,079 4,111 4,282 4,082Governor’s Scholars and Governor’s School for the Arts 348 389 404 371 394Merit Scholars 28 32 31 33 32Valedictorians 133 141 147 154

ACT Scores - Entering First-year Students
- 11 -
Note: Some students submit SAT scores rather than ACT scores. These students’ scores are not reflected in the table and graph.
Year N Mean25th/75thPercentile
Fall 2011 3,865 25.5 23/28Fall 2010 4,049 25.2 22/28Fall 2009 3,906 24.7 22/28Fall 2008 3,825 24.4 22/27 Fall 2007 3,532 24.3 21/27Fall 2006 3,864 23.9 21/26Fall 2005 3,453 24.5 22/27Fall 2004 3,609 24.2 21/27Fall 2003 3,385 24.3 22/27Fall 2002 3,391 23.8 21/26

RETENTION RATE
- 12 -
*Retention rates apply to first-time, full-time, degree- seeking students.
First-to-second Year RetentionRate*
Cohort Overall WhiteBlack or African
American Other2010 81.5 81.8 80.9 80.32009 81.8 83.1 71.2 80.62008 80.3 80.5 75.3 84.42007 81.0 81.2 80.0 79.52006 76.4 76.3 76.6 77.72005 77.8 78.0 76.1 76.42004 78.9 79.6 69.0 80.52003 78.4 78.4 72.8 83.12002 77.1 77.3 78.0 71.52001 79.3 79.3 77.5 81.1

Six-yearGraduationRate*
GRADUATION RATE
- 13 -
Note: The graduation rate for 2005 is preliminary.*Graduation rates apply to first-time, full-time, degree-seeking students.**Reflects a correction made after IPEDS submission.
Cohort Overall WhiteBlack or African
American Other2005 59.0 59.7 46.0 56.32004 58.2 60.1 38.7 51.52003 59.6 60.5 42.9 62.82002 57.7 58.6 47.6 51.12001** 61.4 62.5 50.3 49.62000 59.1 60.6 45.0 50.51999 59.8 60.8 46.2 57.11998 59.6 60.2 49.7 61.41997 61.1 62.2 49.0 59.41996 57.7 59.1 43.2 53.9

- 14 -
DEGREES CONFERRED
2010-2011
Baccalaureate 3,712
Master’s/Specialist’s 1307
Doctor’s Degree:
Research/Scholarship 261
Professional Practice 522
* Includes Specialist degrees** Includes Doctor’s Degrees (Research/Scholarship) and Doctor’s Degrees (Professional Practice)
- 15 -
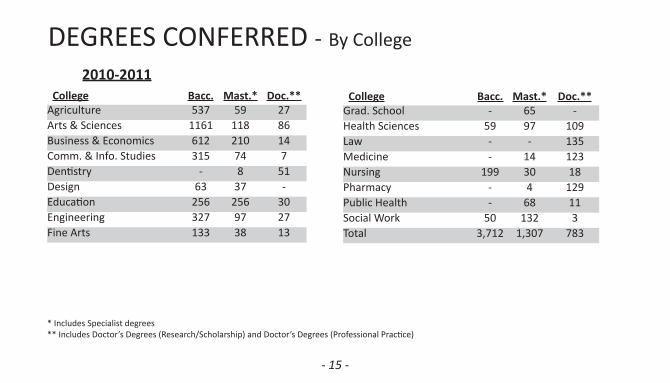
DEGREES CONFERRED - By College
2010-2011College Bacc. Mast.* Doc.**
Agriculture 537 59 27Arts & Sciences 1161 118 86Business & Economics 612 210 14Comm. & Info. Studies 315 74 7Dentistry - 8 51Design 63 37 -Education 256 256 30Engineering 327 97 27Fine Arts 133 38 13
College Bacc. Mast.* Doc.**Grad. School - 65 -Health Sciences 59 97 109Law - - 135Medicine - 14 123Nursing 199 30 18Pharmacy - 4 129Public Health - 68 11Social Work 50 132 3Total 3,712 1,307 783

- 16 -
DOCTORATES - Enrollments and Degrees Awarded
YearFall
EnrollmentDegreesAwarded
2011-12 4,2342010-11 4,225 7832009-10 4,122 7342008-09 3,949 7192007-08 3,843 7172006-07 3,757 6532005-06 3,633 6342004-05 3,599 6702003-04 3,593 6052002-03 3,542 571
Note1: Federal reporting guidelines have eliminated the first-professional degree category and established a new Doctor’s Degree - Professional Practice category. Doctoral enrollments and degree recipients have been revised to include enroll-ments and degrees from former first-professional programs.
Note2: Enrollments are based on the fall semester of a given academic year. The number of degree recipients for 2011-12 is not yet available.
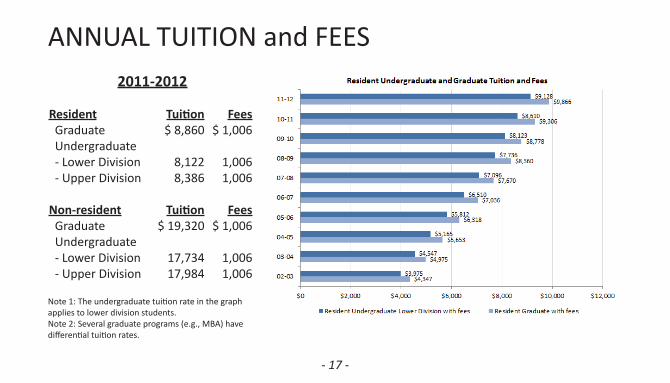
2011-2012
Resident Tuition Fees Graduate $ 8,860 $ 1,006 Undergraduate - Lower Division 8,122 1,006 - Upper Division 8,386 1,006
Non-resident Tuition Fees Graduate $ 19,320 $ 1,006 Undergraduate - Lower Division 17,734 1,006 - Upper Division 17,984 1,006
ANNUAL TUITION and FEES
- 17 -
Note 1: The undergraduate tuition rate in the graph applies to lower division students. Note 2: Several graduate programs (e.g., MBA) have differential tuition rates.

- 18 -
FULL-TIME EMPLOYEES
2010-2011
Note 1: Percentages may not total properly due to rounding.Note 2: The President’s Office includes staff from the Athletics Department and the Offices of the General Counsel, Institutional Advancement, and Commercialization and Economic Development.Note 3: Starting in 2006-07, library faculty are reported to the federal government in the other professional category. For this publication, library faculty are classified separately.
Provost
Full-TimeEmployees President’sOffice
Educational Units
Administration/Support
Finance andAdministration
Health Affairs Total % Total
Exec./Admin./Managerial 36 182 111 83 101 513 4.2%Faculty 0 2,157 0 0 0 2,157 17.6%Library Faculty 0 63 0 0 0 63 0.5%Other Professional 199 1,767 494 362 1,168 3,990 32.6%Secretarial/Clerical 80 1,273 308 182 653 2,496 20.4%Tech./Paraprofessional 22 913 103 194 336 1,568 12.8%Skilled Crafts 6 31 6 151 0 194 1.6%Service/Maintenance 10 172 127 655 280 1,244 10.2%Total 353 6,558 1,149 1,627 2,538 12,225 100.0%
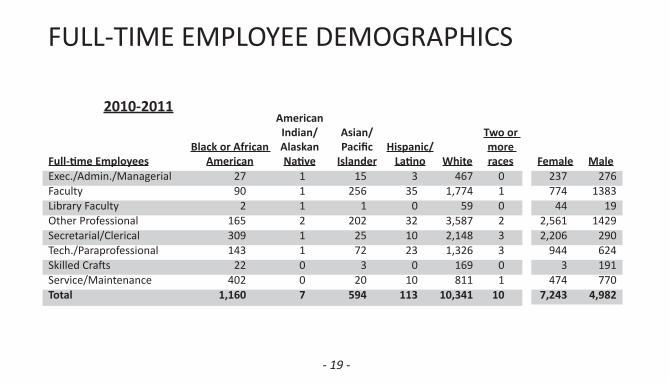
2010-2011
FULL-TIME EMPLOYEE DEMOGRAPHICS
- 19 -
Full-timeEmployeesBlack or African
American
AmericanIndian/AlaskanNative
Asian/Pacific
IslanderHispanic/Latino White
Two or moreraces
Exec./Admin./Managerial 27 1 15 3 467 0Faculty 90 1 256 35 1,774 1Library Faculty 2 1 1 0 59 0Other Professional 165 2 202 32 3,587 2Secretarial/Clerical 309 1 25 10 2,148 3Tech./Paraprofessional 143 1 72 23 1,326 3Skilled Crafts 22 0 3 0 169 0Service/Maintenance 402 0 20 10 811 1Total 1,160 7 594 113 10,341 10
Female Male237 276774 1383
44 192,561 14292,206 290
944 6243 191
474 7707,243 4,982
- 20 -
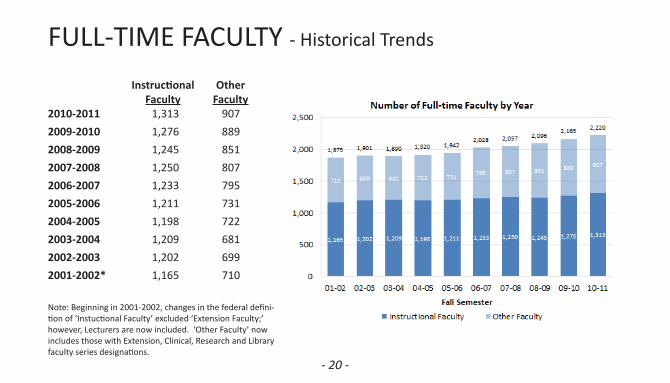
FULL-TIME FACULTY - Historical Trends
Note: Beginning in 2001-2002, changes in the federal defini-tion of ‘Instuctional Faculty’ excluded ‘Extension Faculty;’ however, Lecturers are now included. ‘Other Faculty’ now includes those with Extension, Clinical, Research and Library faculty series designations.
InstructionalFaculty
Other Faculty
2010-2011 1,313 9072009-2010 1,276 8892008-2009 1,245 8512007-2008 1,250 8072006-2007 1,233 7952005-2006 1,211 7312004-2005 1,198 7222003-2004 1,209 6812002-2003 1,202 6992001-2002* 1,165 710
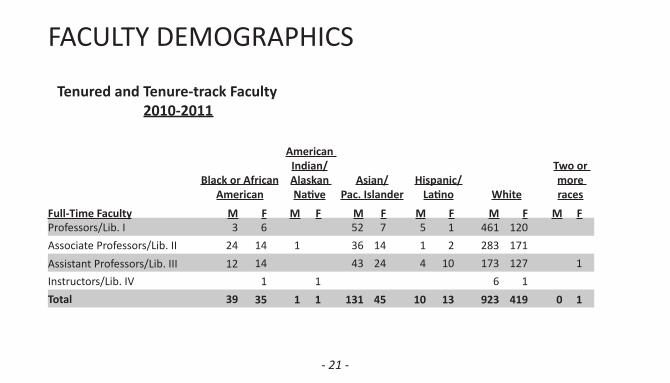
Tenured and Tenure-track Faculty 2010-2011
FACULTY DEMOGRAPHICS
- 21 -
Black or African American
AmericanIndian/Alaskan Native
Asian/Pac.Islander
Hispanic/Latino White
Two or moreraces
Full-TimeFaculty M F M F M F M F M F M FProfessors/Lib. I 3 6 52 7 5 1 461 120Associate Professors/Lib. II 24 14 1 36 14 1 2 283 171Assistant Professors/Lib. III 12 14 43 24 4 10 173 127 1Instructors/Lib. IV 1 1 6 1Total 39 35 1 1 131 45 10 13 923 419 0 1
- 22 -
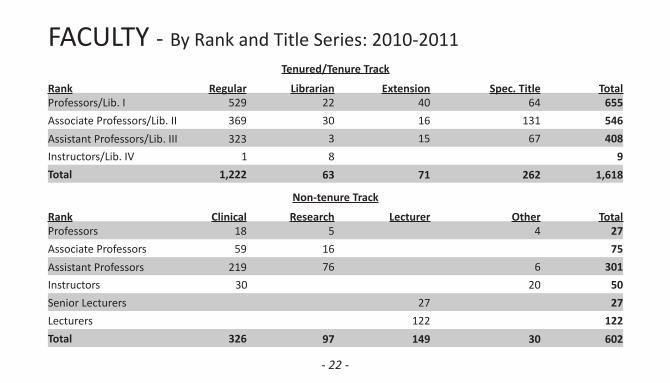
FACULTY - By Rank and Title Series: 2010-2011Tenured/TenureTrack
Rank Regular Librarian Extension Spec.Title TotalProfessors/Lib. I 529 22 40 64 655Associate Professors/Lib. II 369 30 16 131 546Assistant Professors/Lib. III 323 3 15 67 408Instructors/Lib. IV 1 8 9Total 1,222 63 71 262 1,618
Non-tenure Track
Rank Clinical Research Lecturer Other TotalProfessors 18 5 4 27Associate Professors 59 16 75Assistant Professors 219 76 6 301Instructors 30 20 50Senior Lecturers 27 27Lecturers 122 122Total 326 97 149 30 602
- 23 -
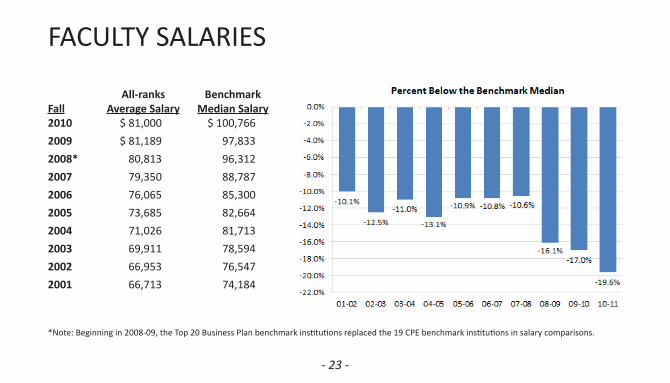
FACULTY SALARIES
FallAll-ranks
Average SalaryBenchmark
Median Salary2010 $ 81,000 $ 100,7662009 $ 81,189 97,8332008* 80,813 96,312 2007 79,350 88,7872006 76,065 85,300 2005 73,685 82,664 2004 71,026 81,713 2003 69,911 78,594 2002 66,953 76,5472001 66,713 74,184
*Note: Beginning in 2008-09, the Top 20 Business Plan benchmark institutions replaced the 19 CPE benchmark institutions in salary comparisons.

- 24 -
REVENUE (In Millions)
Source of FundsRevised Budget
2010-11Budget2011-12
State Appropriations $290.7 $303.4Student Tuition and Fees 289.4 314.3County Appropriations 17.8 18.4Endowment and Investment Income 26.5 24.5Federal Appropriations 17.7 17.7Gifts, Grants and Contracts 229.2 234.4Sales and Services 20.8 20.9Hospital Services 917.8 1,027.7
Auxiliary Enterprises 85.2 90.7
UK Affiliated Corporations 407.2 398.1Appropriated Fund Balances - University 192.0 221.8Transfers 5.5 2.9
Total $2,499.8 $2,674.8

- 25 -
EXPENDITURES (In Millions)
Instruction $367.5 $353.7Research 299.3 285.0Public Service 304.7 311.1Libraries 25.5 26.1Academic Support 101.0 102.9Student Services 34.8 37.1Institutional Support 109.2 110.0Operations and Maintenance 66.5 84.1Student Financial Aid 106.3 116.0Auxiliary Enterprises 145.5 164.8Hospital Services 867.7 1008.2Mandatory Transfers 71.8 75.8
Total $2,499.8 $2,674.8
Personnel Services $1,156.0 $1,235.8Operating Expenses 1,197.2 1,243.7Capital Outlay 74.8 119.5Mandatory Transfers 71.8 75.8
Total $2,499.8 $2,674.8
CategoryRevised Budget
2010-11Budget2011-12Program
Revised Budget2010-11
Budget2011-12
- 26 -
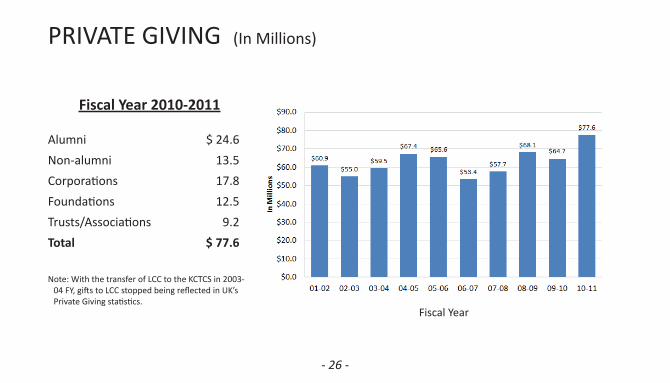
PRIVATE GIVING (In Millions)
Alumni $ 24.6Non-alumni 13.5Corporations 17.8Foundations 12.5Trusts/Associations 9.2Total $ 77.6
Note: With the transfer of LCC to the KCTCS in 2003-04 FY, gifts to LCC stopped being reflected in UK’s Private Giving statistics.
Fiscal Year
Fiscal Year 2010-2011
- 27 -
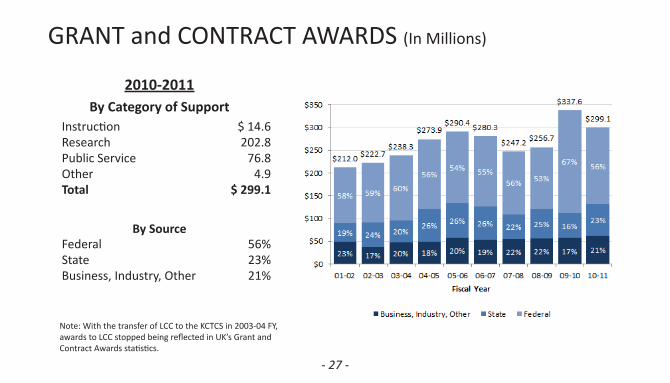
GRANT and CONTRACT AWARDS (In Millions)
Note: With the transfer of LCC to the KCTCS in 2003-04 FY, awards to LCC stopped being reflected in UK’s Grant and Contract Awards statistics.
2010-2011ByCategoryofSupport
Instruction $ 14.6Research 202.8Public Service 76.8Other 4.9Total $ 299.1
By SourceFederal 56%State 23%Business, Industry, Other 21%
- 28 -
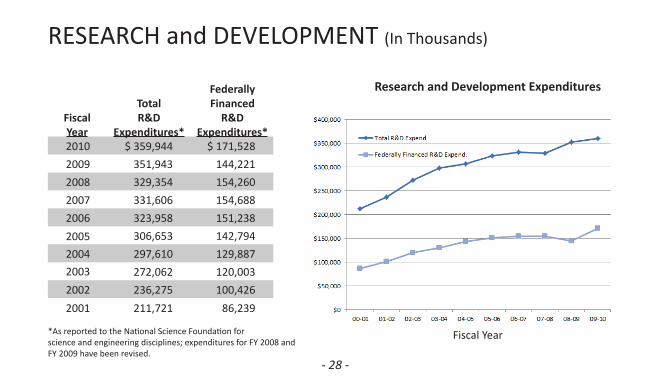
RESEARCH and DEVELOPMENT (In Thousands)
*As reported to the National Science Foundation for science and engineering disciplines; expenditures for FY 2008 and FY 2009 have been revised.
ResearchandDevelopmentExpenditures
Fiscal Year
Fiscal Year
Total R&D
Expenditures*
FederallyFinancedR&D
Expenditures*2010 $ 359,944 $ 171,5282009 351,943 144,2212008 329,354 154,2602007 331,606 154,6882006 323,958 151,2382005 306,653 142,7942004 297,610 129,8872003 272,062 120,0032002 236,275 100,4262001 211,721 86,239

- 29 -
UNIVERSITY ENDOWMENT (In Thousands)
Note: In 2006, the Chandler Medical Center Univer-sity Hospital Quasi-Endowment Fund for $150 million was established, accounting for the large increase over the 2005 total.
MarketValueofUniversityEndowment
Fiscal Year
Fiscal Year
Market Value
2011 $ 881,8602010 748,6762009 668,008 2008 871,8612007 916,5902006 746,1142005 538,3842004 491,0982003 414,3282002 399,030

- 30 -
LIBRARY COLLECTIONS
UK Libraries’ collections also include access to approximately 450 licensed networked electronic databases, over 69,000 electronic journals and over 550,000 electronic books accessible in the University’s 12 libraries and also available to faculty and students off campus via a proxy server. In addition, the collections include: 264,000 maps; over 200 current state, national and international newspapers; nearly 8,000 interviews in the Louis B. Nunn Center for Oral History; the University Archives and Records Program; the Wendell H. Ford Public Policy Research Center; the Audio-Visual Archives; the Bert T. Combs Appalachian Collection; the Public Policy Archives; the Rare Book Collection which includes the W. Hugh Peal Collection of 19th century English and related literature; and the Preservation Reformatting Center. The Center for Digital Programs creates digital content for the Kentucky Digital Library including electronic texts, digitized photographs, images and archival finding aids. UK Libraries is a regional deposi¬tory for U.S. government publications, and also a de-pository for Canadian government publications and European Union publications. British Parliamentary Papers, Kentucky government publications, and technical reports from federal agencies are all selectively collected.
2008-2009 2009-2010 2010-2011Volumes Held 3,784,382 3,915,579 3,980,246Current Periodical Titles 78,194 87,287 97,417Mircoforms 6,506,097 6,555,102 6,594,828Audio-visual Materials 96,717 99,373 99,342
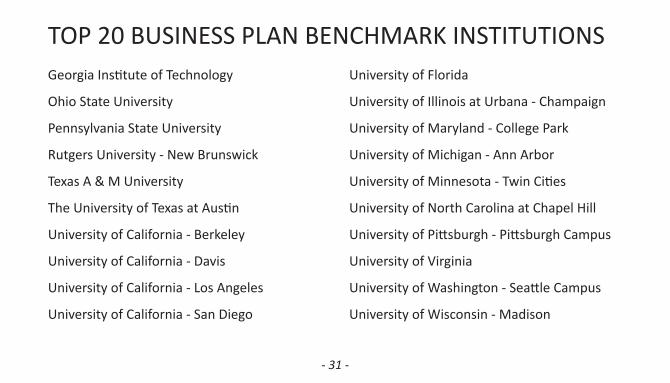
Georgia Institute of Technology
Ohio State University
Pennsylvania State University
Rutgers University - New Brunswick
Texas A & M University
The University of Texas at Austin
University of California - Berkeley
University of California - Davis
University of California - Los Angeles
University of California - San Diego
- 31 -
TOP 20 BUSINESS PLAN BENCHMARK INSTITUTIONSUniversity of Florida
University of Illinois at Urbana - Champaign
University of Maryland - College Park
University of Michigan - Ann Arbor
University of Minnesota - Twin Cities
University of North Carolina at Chapel Hill
University of Pittsburgh - Pittsburgh Campus
University of Virginia
University of Washington - Seattle Campus
University of Wisconsin - Madison

ADMINISTRATIVE ORGANIZATION
- 32 -
- 33 -
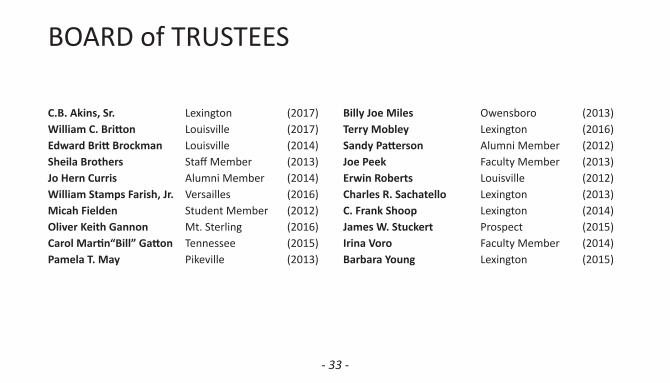
BOARD of TRUSTEES
C.B. Akins, Sr. Lexington (2017)WilliamC.Britton Louisville (2017)EdwardBrittBrockman Louisville (2014)Sheila Brothers Staff Member (2013)Jo Hern Curris Alumni Member (2014)WilliamStampsFarish,Jr. Versailles (2016)Micah Fielden Student Member (2012)Oliver Keith Gannon Mt. Sterling (2016)CarolMartin“Bill”Gatton Tennessee (2015)PamelaT.May Pikeville (2013)
Billy Joe Miles Owensboro (2013)Terry Mobley Lexington (2016)SandyPatterson Alumni Member (2012)JoePeek Faculty Member (2013)Erwin Roberts Louisville (2012)Charles R. Sachatello Lexington (2013)C.FrankShoop Lexington (2014)JamesW.Stuckert Prospect (2015)Irina Voro Faculty Member (2014)Barbara Young Lexington (2015)
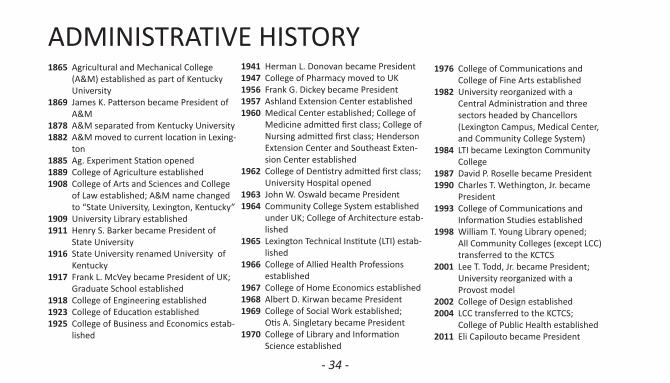
ADMINISTRATIVE HISTORY1865 Agricultural and Mechanical College
(A&M) established as part of Kentucky University
1869 James K. Patterson became President of A&M
1878 A&M separated from Kentucky University1882 A&M moved to current location in Lexing-
ton1885 Ag. Experiment Station opened1889 College of Agriculture established1908 College of Arts and Sciences and College
of Law established; A&M name changed to “State University, Lexington, Kentucky”
1909 University Library established1911 Henry S. Barker became President of
State University1916 State University renamed University of
Kentucky1917 Frank L. McVey became President of UK;
Graduate School established1918 College of Engineering established1923 College of Education established1925 College of Business and Economics estab-
lished
1941 Herman L. Donovan became President1947 College of Pharmacy moved to UK1956 Frank G. Dickey became President1957 Ashland Extension Center established1960 Medical Center established; College of
Medicine admitted first class; College of Nursing admitted first class; Henderson Extension Center and Southeast Exten-sion Center established
1962 College of Dentistry admitted first class; University Hospital opened
1963 John W. Oswald became President1964 Community College System established
under UK; College of Architecture estab-lished
1965 Lexington Technical Institute (LTI) estab-lished
1966 College of Allied Health Professions established
1967 College of Home Economics established1968 Albert D. Kirwan became President1969 College of Social Work established; Otis A. Singletary became President1970 College of Library and Information
Science established
1976 College of Communications and College of Fine Arts established1982 University reorganized with a
Central Administration and three sectors headed by Chancellors (Lexington Campus, Medical Center, and Community College System)
1984 LTI became Lexington Community College1987 David P. Roselle became President1990 Charles T. Wethington, Jr. became
President1993 College of Communications and
Information Studies established1998 William T. Young Library opened; All Community Colleges (except LCC)
transferred to the KCTCS2001 Lee T. Todd, Jr. became President;
University reorganized with a Provost model
2002 College of Design established2004 LCC transferred to the KCTCS;
College of Public Health established2011 Eli Capilouto became President
- 34 -

- 35 -
VALUESThe values of the University guide its decisions and the behavior of its community. Its core values are:
• Integrity• Excellence• Mutual Respect and Human Dignity• Diversity and Inclusion• Academic Freedom
-- Adopted by the Board of Trustees, June 9, 2009
• Shared Governance• Work-life Sensitivity • Civic Engagement• Social Responsibility