uk competitiveness indicators 1999
TRANSCRIPT

Our Competitive Future
UK CompetitivenessIndicators 1999
Foreword 3
Executive Summary 4
Chapter 1.
Introduction 6
Chapter 2.
Business Environment 9
Macroeconomic Environment 10
2.1 Macroeconomic volatility (growth, inflation,
short-term interest rates, exchange rates)
Competition 12
2.2 Openness to trade and foreign investment
2.3 Prices
Labour Market 16
2.4 Unemployment
2.5 Diversity of employment opportunities
2.6 Industrial action
2.7 Labour market regulation
Business Perceptions of Institutions 22
2.8 Business perceptions of the institutional and
political environment
Quality of Life 23
2.9 Sustainable Development Indicators
Chapter 3.
Resources 24
Human Capital 25
3.1 Adult literacy and numeracy
3.2 National Learning Targets
Physical Capital 27
3.3 Business investment per worker
3.4 Government investment per head
Finance 29
3.5 Venture capital
3.6 Second tier markets
3.7 Stock market size and turnover
Information and Communications Technology (ICT) 32
3.8 Business uptake and use of ICT
3.9 ICT understanding in companies
3.10 E-commerce
Science and Technology 35
3.11 Publications and citations of UK research
in academic journals
3.12 Government spend on R&D per worker
3.13 Business spend on R&D per worker
Chapter 4.
Innovation Process 38
Technology Commercialisation 39
4.1 Business spend on innovation including R&D
4.2 UK’s patenting performance
4.3 Proportion of firms who innovate
4.4 Share of sales from new or improved products
Receptiveness to Foreign Ideas 43
4.5 Internationalisation of R&D
4.6 Technological alliances between firms
Knowledge Transfer 45
4.7 Sources of information for innovation
4.8 Joint publishing by universities and industry
4.9 University spin-outs
Entrepreneurship 48
4.10 Entry and exit rates
4.11 Fast growing firms
4.12 Attitudes to entrepreneurship
Chapter 5.
Results 51
Output 52
5.1 GDP per head
Productivity 53
5.2 Output per worker and per hour
Employment 54
5.3 Employment rate
Specialisation in Trade 55
5.4 Trade balances in knowledge based industries
Composition of the Economy 56
5.5 Share of output in knowledge based industries
Chapter 6.
Next Steps 57
AnnexCompetitiveness Council 58
Data Notes and Sources 59
Contents
1
UK Competitiveness Indicators 1999

I am pleased to publish the first inwhat I intend to be an annual series
of UK Competitiveness Indicators.
The indicators will be used to monitor the progress of the UK as a knowledge driven economy, to assess ourcompetitiveness against the world’s leading economies and to help in designing policies to narrow the gap inproductivity and living standards with our maincompetitors.The indicators are intended to be helpful not only to the Government as a guide to policy andpriorities, but also to UK companies whom I encourageto think about how they might improve performance inareas highlighted by the indicators.
In seeking to audit performance in this way, we arebreaking new ground.Although there have been previousbenchmarking studies of the UK economy, this will be thefirst time that there has been a systematic assessment basedon a wide-ranging set of competitiveness indicators.
This is no easy task.There are many influences on anation’s competitiveness and, although there is reasonableconsensus over the factors that are the most important,economists and others disagree over the precise numberand nature of the factors to be included. Even whereagreement can be reached on the concepts, it is sometimesdifficult to find reliable statistical indicators that can becompared across countries.
Nevertheless, I believe that an attempt can and should bemade to benchmark our performance in key areas. Mydepartment has consulted widely on the factors to includeand the measures to use by studying work done in othercountries, by talking to researchers in universities andinternational organisations and by seeking the views ofmembers of the Competitiveness Council that I set upearlier this year.
This publication is the product of that consultation. But Iwant this spirit of consultation to continue. I want to hearfrom business and other interested parties whether theapproach we have adopted to measuring competitivenessthis year is the right one. Have we picked the right factors?Are there too many indicators or too few? Are theindicators representative of the factors that truly determinenational competitiveness? Do they capture the main featuresof the knowledge driven economy? What areas of researchneed to be pursued in order to develop better measures?
Some of these questions are addressed, and preliminaryviews expressed, in the report. However, I would like theIndicators report to be a living document, which evolvesover time as new research is carried out and as we developimproved measures of competitiveness. I want this processto be open and transparent and I want to hear as wide arange of views as possible. I would therefore encouragebusiness and others to pass on their comments to myofficials at the address given in the final chapter of thedocument.
Measuring our progress in building a successful knowledgedriven economy is essential. But before we embark onmeasurement, I want to be sure that the approachcommands general acceptance in the business communityand more widely. I look forward to hearing your views.
The Rt Hon Stephen Byers MPSecretary of State for Trade and Industry
Foreword
3
Comments on UK Competitiveness Indicators should be sent,by 30 April 2000, to:
Economics and Statistics DirectorateRoom 535Department of Trade and Industry1 Victoria StreetLondon SW1H 0ET
Telephone: (020) 7215 6276E-mail: [email protected]

In the modern global economy, British companiesincreasingly have to compete by developing and exploitingtheir skills, knowledge and creativity. Companies willchoose to locate elsewhere if the economic environmentin the UK does not support a modern knowledgeeconomy. Moreover, the challenge of the globalmarketplace is heightened by the development of theEuropean single market and the advent of a singlecurrency in the euro area.
The UK Competitiveness Indicators are designed to track theUK’s competitiveness as a knowledge driven economy andto monitor progress in closing the gap in productivity andliving standards with our main competitors.The selectionof indicators is based on the analysis underlying theGovernment’s Competitiveness White Paper, OurCompetitive Future: Building the Knowledge Driven Economy(Cm. 4176) and draws upon the views of the recentlyestablished Competitiveness Council chaired by theSecretary of State for Trade and Industry.
This first assessment, which is intended to propose abaseline for future comparisons, shows that in manyrespects the UK is beginning to succeed as a knowledgedriven economy, but in a number of areas we have someway to go to achieve the standards of the best.
Despite a history of macroeconomic instability,there are now many positive features in thebusiness environment, which should give ourcompanies the right platform to achieve thestandards of the best.
Following a period of macroeconomic volatility, theprospects for economic stability have now improved.TheUK appears to have an economy that is open tointernational trade and investment, with a labour marketwidely regarded as functioning well.This is reflected in agood employment performance, at least by Europeanstandards. Business perceptions of the political, institutionaland regulatory environment are relatively positive and wescore well on some measures of the quality of life.
However, comparisons looking at price levels suggest thatin many areas competition can and should be moreintense.There are still concerns about trends in costcompetitiveness and doubts about whether we have asufficiently discerning and demanding consumer base. Inaddition, levels of long-term unemployment and youth
unemployment are still a problem.The Government hastaken action in all these areas although it will naturallytake time for the measures to have their full effect.
There is some encouraging evidence onresources such as the strength of our sciencebase and take up of ICT, but progress is beingheld back by poor skills and under-investment.
The UK’s science base is strong and our research is highlyregarded around the world. However, we need to keepinvesting in the science base to safeguard this strongperformance. Between the mid-1980s and the mid-1990s,government expenditure on R&D and business investmentin R&D both fell relative to our main competitors.
One set of technologies that will be crucial for futureperformance is Information and CommunicationsTechnology (ICT). Businesses in the UK seem to berealising the importance of ICT and investing in it,although they have been less effective in putting these newtechnologies to the best use.
Gaps in workforce skills could be a contributory factor.Skill levels remain a cause for concern across the economyas a whole, despite the progress being made towards theNational Learning Targets, which set qualifications targetsfor the working population whether acquired duringinitial education or during working life.
A combination of macroeconomic instability anddeficiencies in management and workforce skills hascontributed to a history of under-investment.This isimportant in the knowledge driven economy because newinvestment embodying the latest technology is an importantway in which new ideas are spread through the economy.
This new investment is in certain respects being held backby the availability of appropriate finance, particularly forfast-growth, early-stage firms.The provision of equityfinance, and in particular venture capital, is crucial, andalthough there has been a substantial increase in theamount of venture capital in recent years, a funding gapstill remains.
In terms of the innovation process, the UK iswell keyed in to the global pool of knowledge,although more needs to be done to turn ourexpertise into marketable products.
Executive Summary
4
UK Competitiveness Indicators 1999

Receptiveness to foreign ideas, as measured byinternationally financed R&D and collaboration acrossborders, is a strength. However, there are weaknesses inmany aspects of the innovation process. Data on patents,business enterprise spending on innovation, and the shareof turnover in manufacturing accounted for by new orimproved products suggests that UK industry’s innovationperformance is lagging behind our principal competitors.However, the record of the UK service sector ininnovation appears somewhat better.
Collaboration between business and universities is under-developed, although joint authorship of publications byhigher education institutions and business is expandingstrongly.
Enterprise is more important than ever in the knowledgedriven economy but performance in and attitudes towardsentrepreneurship fall short of best practice amongst ourcompetitors.
On average, we work more hours than ourcompetitors to achieve results, but nationalincome per head is still almost one fifth lowerthan the G7 average.We need to work smarter,rather than harder, and build on undoubtedareas of strength.
GDP per head is around the European Union average butstill 18 per cent below the average for the G7.1 Ourrelatively good performance on employment and thegrowth in total hours worked contrasts with adisappointing productivity performance. Securingproductivity improvements by the more effective use ofknowledge is the way to improve living standards,spreading strong performance in some key knowledge-intensive sectors throughout the economy.
Overall, the indicators in this report, and the discussions inthe Competitiveness Council, confirm that there are manyencouraging examples of good performance across the UKeconomy. Macroeconomic prospects are improving andother features of the business environment are positive; theproportion of people in work is high; the UK’s sciencebase is strong and our research is highly regarded aroundthe world; and we perform well in some key knowledge-intensive sectors.
However, there are also clearly areas where improvement isneeded.The Council identified innovation, enterprise andsmall firms, management, skills and the role of consumersas areas requiring attention. In all these areas, theGovernment is already taking action.The indicators willbe refined and used to monitor progress in addressingthese and other challenges, although it is recognised thatsustained effort over a number of years will be required tonarrow the gap with our main competitors.
Executive Summary
5
1 UK, Germany, France, Italy, US, Canada and Japan.

The Competitiveness White Paper and the accompanyingAnalysis and Background paper identified a performance gapwith our major competitors.The White Paper went on toexamine how this gap could be closed in the context ofan economy where success increasingly depends on thegeneration and exploitation of knowledge.The WhitePaper also emphasised that the progress of the knowledgedriven economy does not depend simply on pushing backthe frontiers of knowledge or promoting high-tech orknowledge-intensive sectors. It is about the more effectiveuse and exploitation of all types of knowledge across thewhole range of economic activity.
In explaining the thinking behind the White Paper,the Analysis and Background paper described howinformation and communication technology, scientific and technological development, global competition andchanging demand were driving the increased importanceof knowledge for prosperity It also explained how this ischanging the mix of inputs an economy needs to succeed,and the processes by which these inputs are transformedinto high value goods and services and hence incomes.
In the global economy, capital is mobile, technology spreadsquickly and goods can be made in low cost countries andshipped to developed markets. British business thereforehas to compete by exploiting distinctive capabilities whichcompetitors find hard to imitate.Whereas, in the past,competitiveness – a nation’s ability to sustain high and risingstandards of living1– might have been based on raw material,land or cheap labour, increasingly in the modern economyit needs to be based on knowledge, skills and creativity.
The challenge is all the greater when multinationalcompanies have a choice of where to locate.This challengeis heightened by the development of the European singlemarket and the advent of the single currency in the euro area.
Purpose of the UK Competitiveness Indicators
The White Paper stated the Government’s intention todevelop a set of competitiveness indicators, to measure theUK’s progress in meeting the challenges of the knowledgeeconomy and closing the performance gap with otheradvanced economies.
A new Cabinet sub-committee has been established, andpart of its role will be to review the UK’s performanceagainst the UK Competitiveness Indicators each year. Seekingimprovements in the UK’s performance against the UKCompetitiveness Indicators is part of the Department of Tradeand Industry’s Public Service Agreement and is one of theDTI’s Key Targets for 2002.The Indicators will also be usedas a tool to help meet the joint HM Treasury and DTItarget of putting in place policies to narrow theproductivity gap relative to other industrialised countriesover the cycle, by highlighting strengths and weaknesses,and helping prioritise areas that may need attention byGovernment.
There are a number of different ways of tracking UKperformance.The most straightforward would be to look at a single measure such as GDP per head. GDP per headis generally considered to be the best overall measure ofliving standards, when used in conjunction with measuresof the quality of life and the distribution of income.However, in analysing the economy and drawing policyconclusions it is necessary to look beyond GDP at thedeterminants of economic success.
Drawing upon the Analysis and Background paper and onwork done in the US and a number of other Europeancountries, this report identifies a set of indicators thattogether can be used to improve our understanding of theperformance gap, and to monitor progress in closing it.Unlike some other competitiveness reports, there is nooverall composite indicator.A single-valued index cannotcapture all the dimensions of economic performance,nor can it do justice to the complexity of the economy.Instead the approach taken here is to use a series ofindicators accompanied by an assessment explaining whyeach indicator is important, how the UK performs andwhat this means for the UK.
The UK Competitiveness Indicators complement a number ofother initiatives being taken forward across Government.These include the DfEE’s National Learning Targets, thespecific competitiveness targets set for the RegionalDevelopment Agencies, Scottish Enterprise and the Welsh Development Agency, the RegionalCompetitiveness Indicators published by the Departmentof Trade and Industry, the DETR’s Sustainable Development
Chapter 1: Introduction
Introduction
6
1 The widely used OECD definition of a nation’s competitiveness is “the degree to which a country can, under free and fair market conditions, produce goods and serviceswhich meet the test of international markets, while simultaneously maintaining and expanding the real incomes of its people over the long term”.

Introduction
7
Indicators and the DSS’s Poverty Indicators.The UKCompetitiveness Indicators are consistent with these otherinitiatives, and build upon other analyses.
Structure of the UK Competitiveness Indicators
The indicators are grouped under four headings workingfrom the business environment and inputs, throughprocesses to results:1
• the business environment – measures ofmacroeconomic stability, competition, businessperceptions and the quality of life in the UK;
• resources – measures of human and physical capital,finance, technology and R&D;
• innovation process – measures of commercialexploitation of science and technology,entrepreneurship, diffusion of knowledge across bordersand between firms; and
• results – GDP per head, productivity, employment andtrade, and the changing structure of output.
The indicators under these headings reflect key themes inthe White Paper and the Analysis and Background paper, inparticular those of promoting competition, strengtheningBritish capabilities and encouraging people to collaborateto compete.
Apart from macroeconomic stability and a well developedinstitutional framework, competition has a central role toplay in shaping the business environment. It is seen both asa force behind the development of the knowledge driveneconomy and a stimulus to productivity improvement ingeneral.The degree of competition in an economydepends on the whole range of factors determining howfirms interact.Across the economy, competitive pressureswill depend on openness to foreign trade and investment,the domestic regulatory environment, the extent to whichmarkets are liberalised, and the degree of protectionagainst monopoly power.
The White Paper also identified the need to develop UK resources or capabilities in key areas – creating andexploiting scientific knowledge and technology; fosteringenterprise and innovation, which in turn depends on wellfunctioning capital markets; and improving the skills of the
workforce, while ensuring their skills are used effectively.
The development of a knowledge driven economy is alsochanging the way firms organise themselves, promotingnew partnerships between employers and employees andencouraging collaboration between firms in networks andclusters.Two basic processes were identified that requiredgreater collaboration within and between firms:
• The fortunes of the firm are more dependent on thedevelopment of the knowledge within it. Managershave to pay greater attention to ensuring that the rightincentives are set and the right relationships establishedin the workplace to ensure knowledge is usedeffectively and developed. Meanwhile, the ease withwhich information can be spread facilitates contractingout and new forms of business organisation; and
• The nature of competition between firms is changing.Increasingly, firms are finding that to share developmentcosts and to keep up with rapidly advancing bestpractice, they have to develop new formal and informallinks. Sometimes, this can lead to the emergence ofclusters of high performing firms in a region.
The indicators chosen
In order to assess performance, we have identified 39indicators to be monitored.These indicators – listed in theContents page – are to be tracked over time and, wherepossible, across countries. International comparisons arebased on the G7, and may go beyond the G7 where datais available and where other countries have an interestingstory to tell.Where comparable international data are notavailable, UK time series data is used instead.
Many aspects of the knowledge driven economy remainimperfectly measured. Some activities are entirely new,while others are inherently difficult for the statisticalauthorities and businesses to quantify. For instance, theknowledge available to an enterprise, so important tocompetitiveness, is much harder to measure than itsphysical assets. However, there is enough information tocompile a set of indicative statistics that can enable us tobenchmark UK performance.
1 This structure is based loosely on a model developed for Massachusetts, the Index of the Massachusetts Innovation Economy, published by the Massachusetts TechnologyCollaborative.
Measurement difficulties mean that a proxy often has tobe used for an aspect of performance that needs to becaptured (e.g. innovation needs to be proxied by a mix ofindicators such as R&D spend and patent counts).Themeasurement of the size of the knowledge economy itselfis problematic. In the Analysis and Background paper, thegrowing use of knowledge in the economy was illustratedby the share of knowledge intensive sectors such as aerospaceor business services.This indicator is included here using aslightly wider definition, and a similar approach has beenused in the trade performance indicator to look at howthe UK’s comparative advantage is changing.
However, illustrating the importance of knowledge in thisway understates the use of knowledge in the wholeeconomy – in nominally “high-tech” sectors or otherwise.For this reason, the OECD have recently widened theirdefinition of the knowledge-intensive sector to includesome sectors which use high technology methods ofproduction and not just those which produce hightechnology products. However, the growing importance ofknowledge in other “traditional” sectors is also important,but much more difficult to track.1
The Data Notes and Sources section explains how theindicators were compiled and raises issues about the datathat need to be taken into account in interpreting theindicators.
As understanding and measurement techniques improve,it is likely that new indicators will be generated byacademics, Government or other institutions that couldusefully be incorporated in the UK CompetitivenessIndicators.
The following four chapters describe the 39 indicators,and appraise our performance under each.The mainpolicy conclusions are summarised at the beginning ofeach chapter where historical performance against each ofthe indicators is assessed under three headings: signs ofstrength; performance only average; or clear weaknesses.This is illustrated in a “traffic lights” diagram, where,broadly speaking, the green zone corresponds toperformance matching the top two of the G7, while thered zone denotes performance in the bottom two.Equivalent rating schemes are employed whencomparisons are made with other countries or over time.
Introduction
8
1 The DTI published a paper on Manufacturing in the Knowledge Driven Economy in November 1999.

Business Environment Introduction
9
The analysis shows that despite a history ofmacroeconomic instability, there are now manypositive features in the economic environment,which should give our businesses the rightplatform to achieve the standards of the best.
Following a period of macroeconomic volatility, theprospects for economic stability have now improved.The UK appears to have an economy that is open tointernational trade and investment, with a labour marketwidely regarded as functioning well.This is reflected in a good unemployment performance, at least by Europeanstandards. Business perceptions of the political, institutionaland regulatory environment are relatively positive and wescore well on some measures of the quality of life.
However, comparisons looking at price levels suggest that in many areas competition can and should be moreintense.There are still concerns about trends in costcompetitiveness and doubts about whether we have a sufficiently discerning and demanding consumer base.In addition, levels of long-term unemployment and youthunemployment are still a problem.The Government hastaken action in all these areas, although it will naturallytake time for the measures to have their full effect.
Summary of Business Environment Indicators
2.2 Openness to trade and foreign investment
2.6 Industrial action
2.7 Labour market regulation
2.8 Business perceptions of the institutional and
political environment
2.3 Prices
2.4 Unemployment
2.5 Diversity of employment opportunities
2.9 Sustainable Development Indicators
2.1 History of macroeconomic volatility
The green band shows those areas where the UK has signs of strength. UK performanceis regarded as only average in those indicators placed in the amber box. Indicators in thered section show clear signs of weakness.Within each of the three bands, indicators are listed in order of their appearance in this chapter.
Chapter 2: Business Environment
The context in which business operates, innovates and competes, much of which is beyond the control of individualfirms, is a key determinant of performance. Business is more likely to flourish in an economy characterised by stability,flexibility and a high quality of life.
Five areas of the business environment are considered in the UK Competitiveness Indicators:
• Macroeconomic environment – instability affects business confidence, the cost of capital and the willingness ofentrepreneurs to take risks.
• Competition – strong domestic and foreign competition encourages the development of new products and processes.
• The labour market – in a rapidly changing world, the labour market needs to be responsive to new circumstances ifemployment opportunities are to be generated and conditions created for sustained productivity growth.
• Business perceptions of UK institutions – factors such as the legal framework and the efficiency of the regulatorysystem affect the willingness of firms to invest.
• Quality of life – there is increasing recognition that quality of life is not only the key goal of economic activity, butan important determinant of economic performance.
The traffic light summarises the historical performance of individual indicators, with each indicator assigned to a band onthe basis of the assessment set out in the rest of this chapter.There is no international comparison for the quality of lifeindicators (sustainable development), but it appears in the average box because while progress is being made, there ismuch more to be done.
Business Environment Macroeconomic Environment
10
Why is it significant?
Instability and uncertainty are bad for business.Volatileinterest rates, high and unstable inflation and uncertaintyover the future course of output and demand underminebusiness confidence and damage the incentives to investand plan for the long term.
Of course, uncertainty cannot be banished altogether.Swings in output are a natural feature of moderneconomies. However, there is a clear difference between anatural process of change and economic instability createdby poor macroeconomic management.
How does the UK perform?
In the last three decades, the UK’s record on economicvolatility has been poor, with damaging effects on incentives
and growth.This is not simply because of fluctuations in theinternational economy.The UK has been more volatile thanother economies, partly due to policy choices in macro-economic management. During this period, there werefrequent changes in the monetary and fiscal objectives. UKmonetary policy, at different times, gave prominence to ortargeted broad money, narrow money, nominal GDP, theexchange rate and inflation. Fiscal objectives tended to shiftover time.The resulting uncertainty contributed to lowerlevels of investment, productivity and, ultimately, growth.
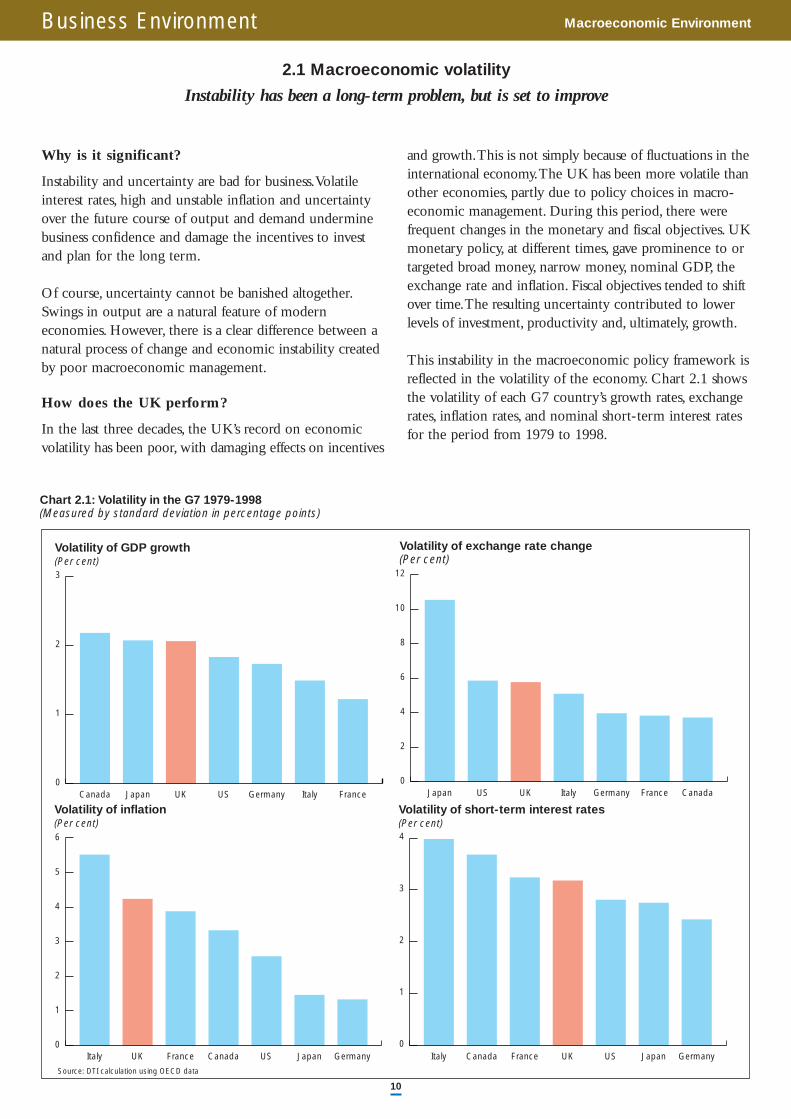
This instability in the macroeconomic policy framework isreflected in the volatility of the economy. Chart 2.1 showsthe volatility of each G7 country’s growth rates, exchangerates, inflation rates, and nominal short-term interest ratesfor the period from 1979 to 1998.
2.1 Macroeconomic volatility
Instability has been a long-term problem, but is set to improve
Canada Japan UK US Germany Italy France
Volatility of GDP growth(Per cent)
0
1
2
3
Chart 2.1: Volatility in the G7 1979-1998(Measured by standard deviation in percentage points)
Japan US UK Italy Germany France Canada
Volatility of exchange rate change(Per cent)
0
2
4
6
8
10
12
Source: DTI calculation using OECD data
Italy UK France Canada US Japan Germany
Volatility of inflation (Per cent)
0
1
2
3
4
5
6
Italy Canada France UK US Japan Germany
Volatility of short-term interest rates(Per cent)
0
1
2
3
4

Business Environment Macroeconomic Environment
11
During this period, the UK was one of the G7’s most volatileeconomies.The UK had one of the most volatile growthrates and also suffered the two deepest and longest recessionsin the G7 in the post-war period, as well as one of thelargest booms. Despite a relatively active monetary policy,as shown by the volatility of short-term interest rates, theUK has also had the second most volatile inflation rate.
Further analysis can be undertaken to see how the UK’svolatility experience has been changing over time.Analysing a succession of ten-year periods from 1979 to1998 suggests that inflation rate volatility has remainedroughly constant since 1985, while the volatility of theUK’s growth rate has been falling. Nevertheless, OECDestimates of the output gap show that the UK had themost volatile economic cycle of any of the G7 economiesin the late 1980s and early 1990s.
What does this mean for the UK?
It is clear that the UK had a more volatile macroeconomicenvironment than its G7 competitors between 1979 and1998.This contributed to our relatively poor productivityand investment performance. Over the last full internationaleconomic cycle, 1982-1993, the UK invested a lower shareof GDP than any other G7 country.
The UK needs a period of sustained stability. Governmentshould aim to avoid unnecessary fluctuations in output anddesign macroeconomic policies to promote stability and
reduce uncertainty. For this reason, the Government hasreformed the macroeconomic framework to focus policy onstability.The Bank of England was given operationalresponsibility to set interest rates to meet the Government’sinflation target.As data on inflation expectations shows,this has increased the credibility of the Government’scommitment to low inflation.The Government alsoenshrined the Code for Fiscal Stability in legislation toenhance the credibility of the commitment to setting fiscalpolicy on a sustainable basis, including meeting two fiscal rules:
• the golden rule that the current budget be in balanceor surplus over the economic cycle; and
• the sustainable investment rule that over the economiccycle net public debt as a proportion of GDP remain ata prudent and stable level.
The transparent and forward-looking monetary and fiscalpolicies now put in place will reduce the risk of instabilitybeing caused by short-term political factors and focusmacroeconomic policy on the long-term interests of theeconomy.This in turn will encourage business to plan andinvest for the long term.
As a result of these policies, the future looks promising.The OECD has projected macroeconomic performance tothe year 2000, and the implication of their analysis is thatthe UK will become an absolutely and relatively lessvolatile economy.
Why is it significant?
Competition drives companies to improve productivity, toreduce prices and to innovate. It benefits consumers andimproves the competitiveness of the UK economy.
However, competition is difficult to quantify and cannot bemeasured by a few standard indicators. Competition is acomplex and multi-dimensional dynamic process and thekey drivers of competition vary considerably between markets. Competition is affected by the structure of markets,in particular the degree of concentration, the ease of entry,the openness of an economy to international trade and foreign direct investment (FDI), the rate of innovation, theconduct of companies in a market, and the strength andeffectiveness of how competition policy is enforced.
Moreover, the degree of competition is also influenced bythe attitudes of consumers. By being flexible in their buyingpatterns, assertive, demanding and well informed,consumers can enhance competitive pressures andstimulate firms to produce at the lowest cost. Furthermore,sophisticated consumers can encourage innovation byproviding a market for new and novel products.
Economies that are open to trade and FDI are able tospecialise in producing what they do best. Opennessfacilitates technology transfer, spreads best practice andpromotes access to the global knowledge pool. It opens upnew markets and increases the potential returns to newideas.There is also considerable evidence that industries that
are open to foreign competition perform more strongly,that inward investment boosts productivity, and thatoutward investment complements exports and technology transfer.
How does the UK perform?
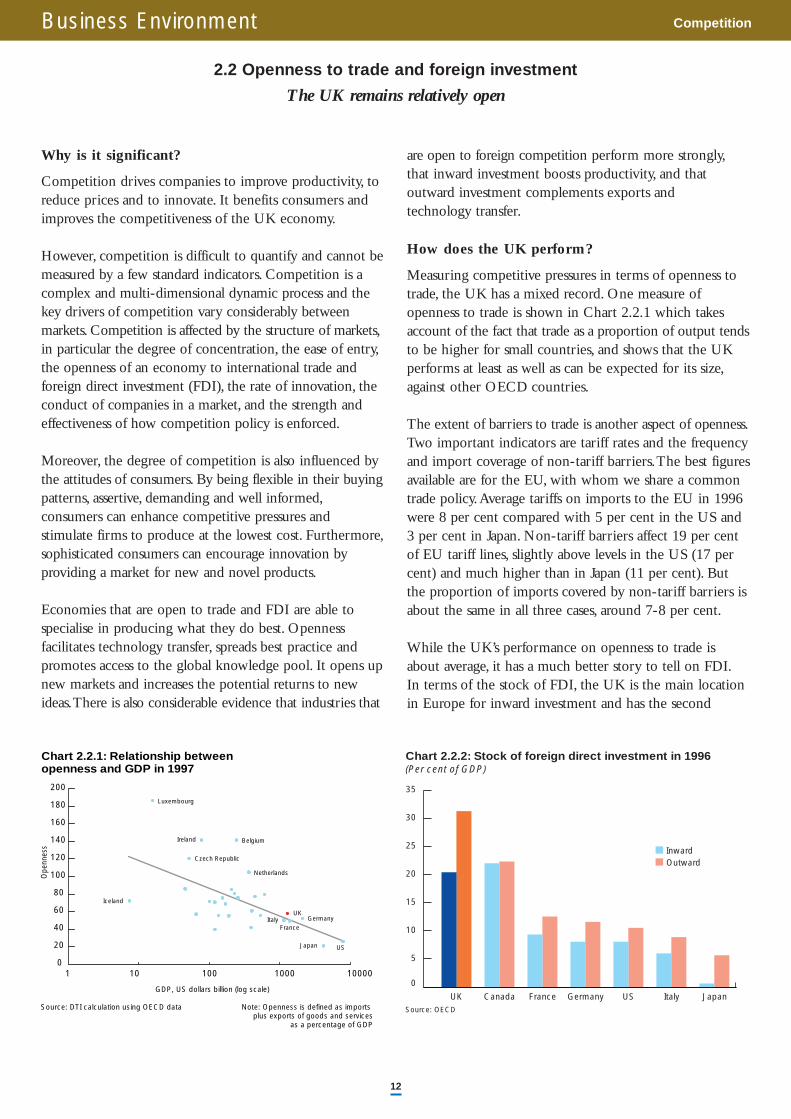
Measuring competitive pressures in terms of openness totrade, the UK has a mixed record. One measure ofopenness to trade is shown in Chart 2.2.1 which takesaccount of the fact that trade as a proportion of output tendsto be higher for small countries, and shows that the UKperforms at least as well as can be expected for its size,against other OECD countries.
The extent of barriers to trade is another aspect of openness.Two important indicators are tariff rates and the frequencyand import coverage of non-tariff barriers.The best figuresavailable are for the EU, with whom we share a commontrade policy.Average tariffs on imports to the EU in 1996were 8 per cent compared with 5 per cent in the US and3 per cent in Japan. Non-tariff barriers affect 19 per centof EU tariff lines, slightly above levels in the US (17 percent) and much higher than in Japan (11 per cent). Butthe proportion of imports covered by non-tariff barriers isabout the same in all three cases, around 7-8 per cent.
While the UK’s performance on openness to trade isabout average, it has a much better story to tell on FDI.In terms of the stock of FDI, the UK is the main locationin Europe for inward investment and has the second
2.2 Openness to trade and foreign investment
The UK remains relatively open
Business Environment Competition
12
France
Luxembourg
Iceland
Ireland Belgium
Netherlands
Czech Republic
GermanyItaly
Japan US
UK
Chart 2.2.1: Relationship between openness and GDP in 1997
0
20
40
60
80
100
120
140
160
180
200
1 10 100 1000 10000
GDP, US dollars billion (log scale)
Source: DTI calculation using OECD data Note: Openness is defined as imports plus exports of goods and services
as a percentage of GDP
Ope
nnes
s
Source: OECD
UK Canada France Germany US Italy Japan
Chart 2.2.2: Stock of foreign direct investment in 1996(Per cent of GDP)
InwardOutward
0
5
10
15
20
25
30
35
Business Environment Competition
13
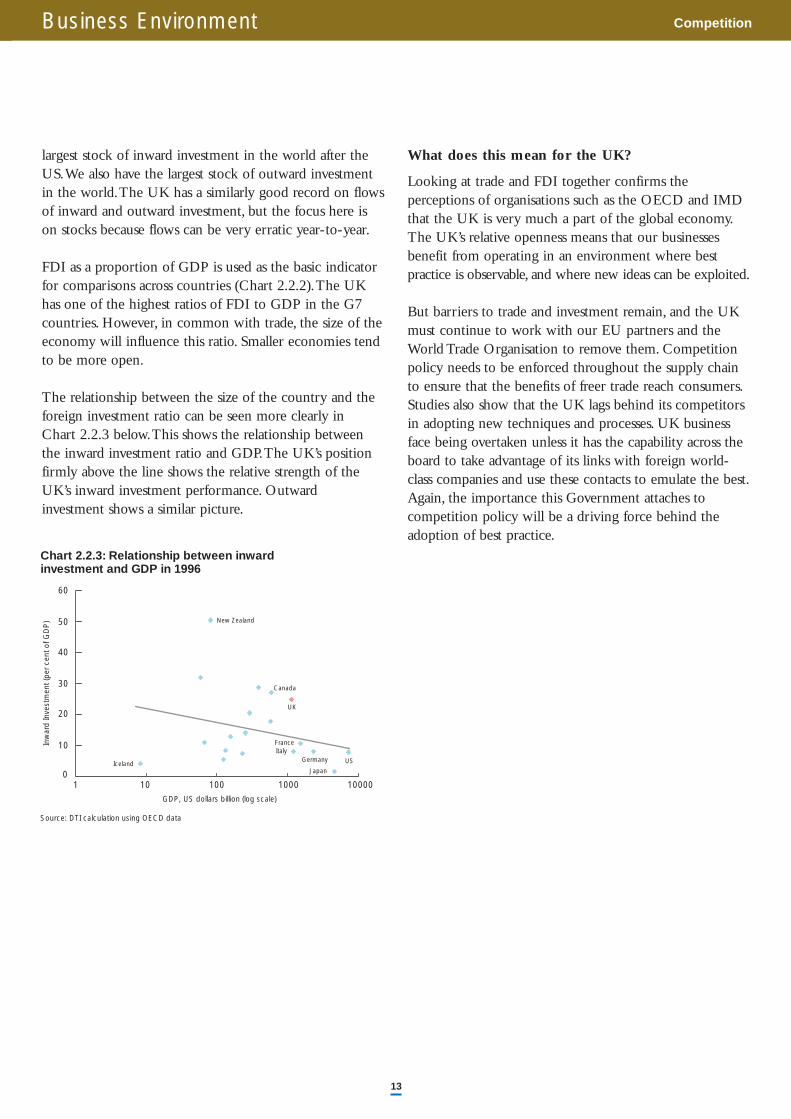
largest stock of inward investment in the world after theUS.We also have the largest stock of outward investmentin the world.The UK has a similarly good record on flowsof inward and outward investment, but the focus here ison stocks because flows can be very erratic year-to-year.
FDI as a proportion of GDP is used as the basic indicatorfor comparisons across countries (Chart 2.2.2).The UK has one of the highest ratios of FDI to GDP in the G7countries. However, in common with trade, the size of theeconomy will influence this ratio. Smaller economies tendto be more open.
The relationship between the size of the country and theforeign investment ratio can be seen more clearly in Chart 2.2.3 below.This shows the relationship betweenthe inward investment ratio and GDP.The UK’s positionfirmly above the line shows the relative strength of theUK’s inward investment performance. Outward investment shows a similar picture.
What does this mean for the UK?
Looking at trade and FDI together confirms the perceptions of organisations such as the OECD and IMDthat the UK is very much a part of the global economy.The UK’s relative openness means that our businessesbenefit from operating in an environment where bestpractice is observable, and where new ideas can be exploited.
But barriers to trade and investment remain, and the UKmust continue to work with our EU partners and theWorld Trade Organisation to remove them. Competitionpolicy needs to be enforced throughout the supply chainto ensure that the benefits of freer trade reach consumers.Studies also show that the UK lags behind its competitorsin adopting new techniques and processes. UK businessface being overtaken unless it has the capability across theboard to take advantage of its links with foreign world-class companies and use these contacts to emulate the best.Again, the importance this Government attaches tocompetition policy will be a driving force behind theadoption of best practice.
Iceland
New Zealand
UK
Canada
US
Japan
France
GermanyItaly
Chart 2.2.3: Relationship between inwardinvestment and GDP in 1996
0
10
20
30
40
50
60
1 10 100 1000 10000
Source: DTI calculation using OECD data
Inw
ard
Inve
stm
ent (
per
cent
of G
DP
)
GDP, US dollars billion (log scale)
Why is it significant?
While measures of openness to trade and the extent ofFDI indicate the degree to which the UK is open tointernational competitive forces, price measures can alsoprovide an insight into the level of competition. Indicatorssuch as relative national price levels, price convergencebetween countries and the mark-up of prices over costscan give a flavour of competition within an individualcountry.
There are a number of reasons why prices may differbetween countries. If non-traded input costs such as therent paid for land differ then, for a given strength ofcompetition, prices would also differ. Economies of scalecan also affect price comparisons. But prices can also varyas a result of different levels of competitive intensity. Sorelative prices, and the convergence of those price levels,can be an important indicator of competition.1
In principle, pricing above marginal cost might be anindicator that competition is weak. However, in industriesthat are characterised by dynamic, innovative competition,firms can only survive if they earn a return on theirinnovations.Without a positive mark up there is no incentiveto innovate. Nevertheless, evidence that mark-ups differbetween countries can indicate the relative strength ofcompetitive pressures in different countries.
It might be thought that competitive pressures can bemeasured by an aggregate indicator of concentration ormarket structure. However, there are significant conceptualproblems with the use and interpretation of suchindicators. Measures of market structure are by themselvesmeaningless unless accompanied by assessments of entryconditions and the full range of other factors that affectthe intensity of competition between firms in the industry.
How does the UK perform?
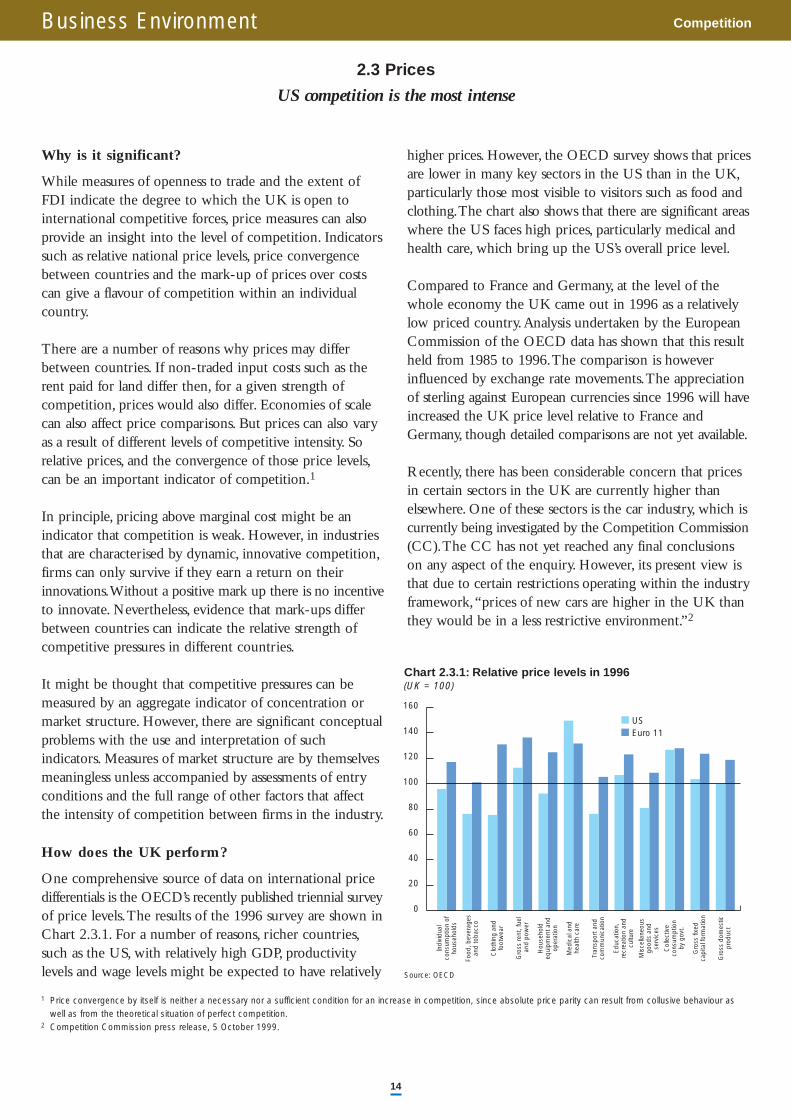
One comprehensive source of data on international pricedifferentials is the OECD’s recently published triennial surveyof price levels.The results of the 1996 survey are shown inChart 2.3.1. For a number of reasons, richer countries,such as the US, with relatively high GDP, productivitylevels and wage levels might be expected to have relatively
higher prices. However, the OECD survey shows that pricesare lower in many key sectors in the US than in the UK,particularly those most visible to visitors such as food andclothing.The chart also shows that there are significant areaswhere the US faces high prices, particularly medical andhealth care, which bring up the US’s overall price level.
Compared to France and Germany, at the level of thewhole economy the UK came out in 1996 as a relativelylow priced country.Analysis undertaken by the EuropeanCommission of the OECD data has shown that this resultheld from 1985 to 1996.The comparison is howeverinfluenced by exchange rate movements.The appreciationof sterling against European currencies since 1996 will haveincreased the UK price level relative to France andGermany, though detailed comparisons are not yet available.
Recently, there has been considerable concern that pricesin certain sectors in the UK are currently higher thanelsewhere. One of these sectors is the car industry, which iscurrently being investigated by the Competition Commission(CC).The CC has not yet reached any final conclusionson any aspect of the enquiry. However, its present view isthat due to certain restrictions operating within the industryframework,“prices of new cars are higher in the UK thanthey would be in a less restrictive environment.”2
Business Environment Competition
14
2.3 Prices
US competition is the most intense
USEuro 11
Source: OECD
Indi
vidu
alco
nsum
ptio
n of
hous
ehol
ds
Food
, bev
erag
esan
d to
bacc
o
Clo
thin
g an
dfo
otw
ear
Gro
ss re
nt, f
uel
and
pow
er
Hou
seho
ldeq
uipm
ent a
ndop
erat
ion
Med
ical
and
heal
th c
are
Tran
spor
t and
com
mun
icat
ion
Educ
atio
n,re
crea
tion
and
cultu
re
Mis
cella
neou
sgo
ods
and
serv
ices
Col
lect
ive
cons
umpt
ion
by g
ovt.
Gro
ss d
omes
ticpr
oduc
t
Gro
ss fi
xed
capi
tal f
orm
atio
n
Chart 2.3.1: Relative price levels in 1996(UK = 100)
0
20
40
60
80
100
120
140
160
1 Price convergence by itself is neither a necessary nor a sufficient condition for an increase in competition, since absolute price parity can result from collusive behaviour aswell as from the theoretical situation of perfect competition.
2 Competition Commission press release, 5 October 1999.
Business Environment Competition
15
The European Commission has also undertaken acomparative car prices survey across the EU.The mostrecent version, covering prices on 1 May 1999, showedthat “the UK remained the most expensive market for 62 of the 75 best selling models examined.”
More generally, there is a lack of robust and up-to-dateinformation that enables a comparison of current pricedifferences.The OECD data for 1999 is not expected until2002.The DTI is therefore commissioning comprehensiveresearch into prices in the UK, France, Germany and theUS.This will report in January 2000.
Turning to evidence on mark-ups, calculations by theOECD, reported in Table 2.3.1, suggest that economy-wide mark-ups are very similar in the US and the UK.However, this result masks considerable sectoral variation.
Table 2.3.1: Mark-up ratios in selected sectors, 1980-92
A similar OECD study confirms the result that overallmark-ups in manufacturing were very similar in the UKand the US between 1970 and 1992, and that they werebelow those seen in France, Germany and Japan.1 In the‘wholesale, retail trade, restaurants and hotels’ sector, theUS seems to have the lowest margins.This is consistentwith the OECD data on prices in Chart 2.3.1 above,which showed the US to be relatively cheap in food andclothing and footwear.
What does this mean for the UK?
Competition is a complex and multi-dimensional process thatcannot easily be measured.The assessment of competitionissues is a microeconomic process that does not produceinternationally comparable aggregate indicators.Thiscomplexity is reflected in the Guidelines to the Competition
Act 1998 that have recently been published by the DirectorGeneral of Fair Trading.2 The Government is currentlydeveloping measures of the effectiveness of competition policy.
The indicators of openness in the previous section and theanalysis of relative price levels and mark-ups show that, incomparison to the major European economies, the UKperforms relatively well. Nevertheless, comparisons with theUS show significant differences persist. Lower productioncosts and economies of scale may be part of the explanation,but stronger competition in the UK could bring prices forconsumer goods more in line with those in the US, andthis would produce significant benefits for UK consumers.
There are a number of developments within Europewhich are likely to lead to significantly stronger competitionacross Europe and have positive effects on UK competition.The Single Market Programme will continue to have apositive impact by integrating markets more effectively.This process will be enhanced by the introduction of theeuro – even if the UK does not join.The euro willincrease price transparency to consumers and improvetheir ability to identify the lowest prices.
The mixed picture on competition suggests that there isno room for complacency. Moreover, competition is suchan important force for innovation and efficiency that closeattention on competition policy is always required,whether the UK appears to be performing relatively wellor not.This Government has already acted to improvecompetition in the UK by introducing the CompetitionAct 1998 which is due to come into force on 1 March2000.This, together with the extra resources that are beingmade available to the Office of Fair Trading, is a significantstrengthening of competition law, and is a long overduereform of the competition legislation.
The Government has begun a fundamental review ofdomestic merger legislation. Effective and efficientregulation of mergers is vital to ensuring open andcompetitive markets, and to providing the clear and stablecommercial framework business needs. In August, the DTIpublished a consultation document proposing majorreforms aimed at modernising the system and ensuringthat its operation is as clear and predictable as possible. UKconsumers can also help to generate a more competitiveenvironment.The Government is committed toempowering consumers through its Consumer Strategywhich will improve advice on consumer rights.
US UK OECD average (14 countries)
Manufacturing 1.15 1.15 1.19
Electricity, Gas, Water 1.34 1.34 1.54
Construction 1.17 1.25 1.20
Wholesale, Retail Trade, 1.25 1.37 1.45 Restaurants, Hotels
Transport, Storage and 1.33 1.25 1.36Communication
Source: OECD, Economic Studies, 1996
1 Oliveira Martins, J. and Scarpetta, S. (1999); The levels and cyclical behaviour of mark-ups across countries and market structures; OECD Economic Working paper No 213.2 Copies of the Guidelines to the Competition Act (1998) are available from the Office of Fair Trading’s web-site: www.oft.gov.uk.
Why is it significant?
The knowledge driven economy is characterised bychange and this requires labour markets to operate efficientlyand workers to become more flexible.The efficiency ofthe labour market is difficult to measure, but analysis ofunemployment, changing employment patterns, industrialrelations and survey evidence of the impact of regulationcan be used to give an indication of how smoothly thelabour market is operating.
While the headline rate of overall unemployment is a goodstarting point in understanding how well labour marketsoperate, it is also important to consider how far thisunemployment rate is structural and how much is driven bythe business cycle.There are also some types of bottleneckthat can be particularly damaging to the economy’sperformance. Long-term unemployment not only has anacute personal cost, but is often associated with a loss ofthe unemployed’s ability to participate in the labour market.Similarly, youth unemployment can be very damaging tofuture employment prospects.A track record of unemploymentcan be a disadvantage in competing with a new cohort ofentrants to the labour market.The extent of youthunemployment is also a measure of how the labour marketcaters for new entrants who cannot bring the benefits ofexperience and on-the-job training to the workplace.
How does the UK perform?
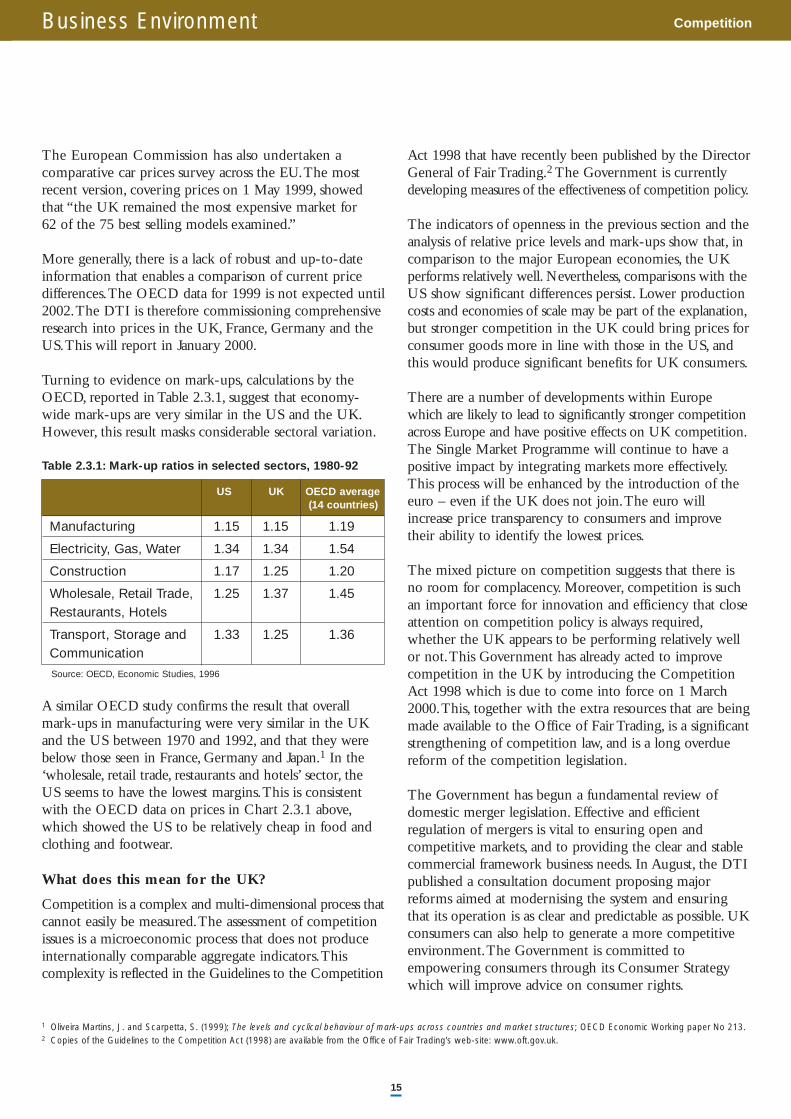
Comparisons of standardised unemployment rates acrossthe G7 (Chart 2.4.1) show the UK performing well byEuropean standards.The US and Japan show the strongestperformance on unemployment, although via verydifferent institutional structures in the labour market.
Estimates of structural unemployment are subject to bothnumerical and conceptual uncertainties. However, OECDestimates of structural unemployment1 show a similar pattern across countries, with structural estimates movingin the same direction as actual unemployment rates.This message on structural unemployment is also confirmedby looking at flows into and out of unemployment.
Analysis of these flows shows that the number of peoplelosing a job and becoming unemployed in Europe and theUK is no higher than in the US or Japan.The crucialdifference is that there is a much greater likelihood offinding a job more easily after a period of unemploymentin the US and Japan than in Europe.2
Chart 2.4.2 shows that both the US and Japan’s relativelystrong unemployment performance is supported by a verylow share of long-term unemployment in the total andrelatively good performances on youth unemployment. Onthese measures, the UK also generally performs well byEuropean standards.
2.4 Unemployment
Unemployment lower than in Europe but above US and Japan
Business Environment Labour Market
16
Source: OECD
1989 1998
Chart 2.4.1: Standardised unemployment rates(Per cent of labour force)
JapanCanadaUSItalyFranceGermanyUK
0
2
4
6
8
10
12
14
Source: OECD
Unemployed for 12 monthsand over, as share oftotal unemployment
Unemployment rate for15-24 year olds
Chart 2.4.2: Long-term and youth unemployment in 1998(Per cent)
JapanCanadaUSItalyFranceGermanyUK
0
10
20
30
40
50
60
70
1 Based on Secretariat estimates of the non-accelerating wage rate of unemployment (NAWRU) made for the OECD Economic Outlook No. 60, 1996.2 OECD Employment Outlook, 1995.

Business Environment Labour Market
17
What does this mean for the UK?
Although UK unemployment performance is relatively goodin European terms, it does not match the standards of theUnited States or Japan.The Government’s policies toachieve long-term sustainable growth, along with the Welfareto Work programme and tax and benefit reforms, are allimproving the prospects for a high and sustainable level ofemployment, and a low level of unemployment, in the future.
Why is it significant?
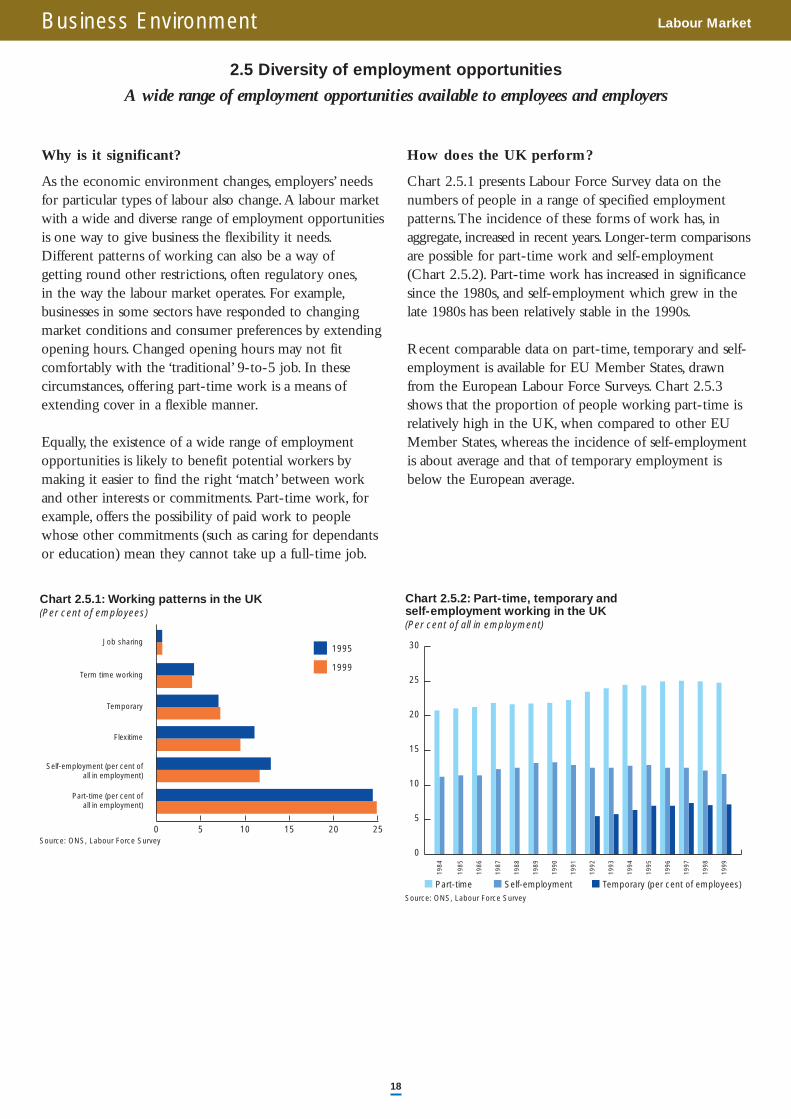
As the economic environment changes, employers’ needsfor particular types of labour also change.A labour marketwith a wide and diverse range of employment opportunitiesis one way to give business the flexibility it needs.Different patterns of working can also be a way of getting round other restrictions, often regulatory ones,in the way the labour market operates. For example,businesses in some sectors have responded to changingmarket conditions and consumer preferences by extendingopening hours. Changed opening hours may not fitcomfortably with the ‘traditional’ 9-to-5 job. In thesecircumstances, offering part-time work is a means ofextending cover in a flexible manner.
Equally, the existence of a wide range of employmentopportunities is likely to benefit potential workers bymaking it easier to find the right ‘match’ between workand other interests or commitments. Part-time work, forexample, offers the possibility of paid work to peoplewhose other commitments (such as caring for dependantsor education) mean they cannot take up a full-time job.
How does the UK perform?
Chart 2.5.1 presents Labour Force Survey data on thenumbers of people in a range of specified employmentpatterns.The incidence of these forms of work has, inaggregate, increased in recent years. Longer-term comparisonsare possible for part-time work and self-employment(Chart 2.5.2). Part-time work has increased in significancesince the 1980s, and self-employment which grew in thelate 1980s has been relatively stable in the 1990s.
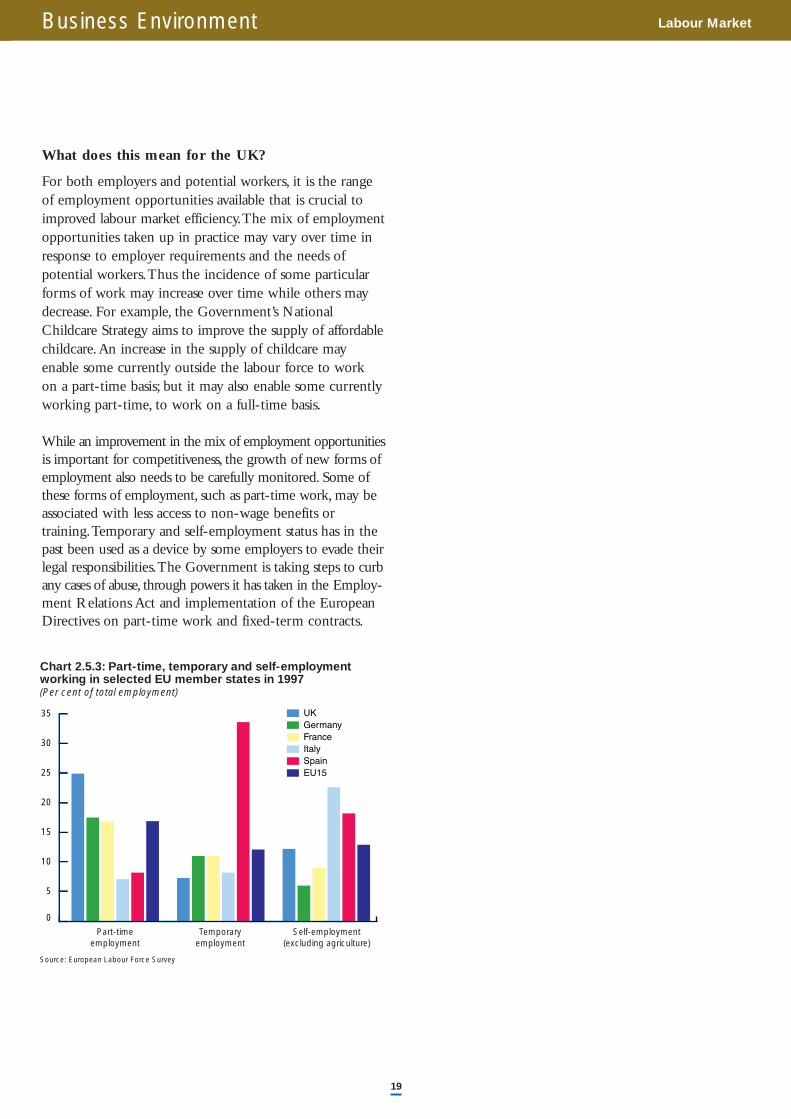
Recent comparable data on part-time, temporary and self-employment is available for EU Member States, drawnfrom the European Labour Force Surveys. Chart 2.5.3shows that the proportion of people working part-time isrelatively high in the UK, when compared to other EUMember States, whereas the incidence of self-employmentis about average and that of temporary employment isbelow the European average.
Business Environment Labour Market
18
2.5 Diversity of employment opportunities
A wide range of employment opportunities available to employees and employers
Source: ONS, Labour Force Survey
Chart 2.5.1: Working patterns in the UK(Per cent of employees)
1995
1999
Job sharing
Term time working
Temporary
Flexitime
Self-employment (per cent ofall in employment)
Part-time (per cent ofall in employment)
0 5 10 15 20 25
Source: ONS, Labour Force Survey
1984
1999
1998
1997
1996
1995
1994
1993
1992
1991
1990
1989
1988
1987
1986
1985
Chart 2.5.2: Part-time, temporary andself-employment working in the UK (Per cent of all in employment)
Part-time Self-employment Temporary (per cent of employees)
0
5
10
15
20
25
30
What does this mean for the UK?
For both employers and potential workers, it is the rangeof employment opportunities available that is crucial toimproved labour market efficiency.The mix of employmentopportunities taken up in practice may vary over time inresponse to employer requirements and the needs ofpotential workers.Thus the incidence of some particularforms of work may increase over time while others maydecrease. For example, the Government’s NationalChildcare Strategy aims to improve the supply of affordablechildcare.An increase in the supply of childcare mayenable some currently outside the labour force to work on a part-time basis; but it may also enable some currentlyworking part-time, to work on a full-time basis.
While an improvement in the mix of employment opportunitiesis important for competitiveness, the growth of new forms ofemployment also needs to be carefully monitored. Some ofthese forms of employment, such as part-time work, may beassociated with less access to non-wage benefits ortraining.Temporary and self-employment status has in thepast been used as a device by some employers to evade theirlegal responsibilities.The Government is taking steps to curbany cases of abuse, through powers it has taken in the Employ-ment Relations Act and implementation of the EuropeanDirectives on part-time work and fixed-term contracts.
Business Environment Labour Market
19
Source: European Labour Force Survey
Part-timeemployment
Temporaryemployment
Self-employment(excluding agriculture)
Chart 2.5.3: Part-time, temporary and self-employmentworking in selected EU member states in 1997(Per cent of total employment)
EU15SpainItalyFranceGermanyUK
0
5
10
15
20
25
30
35
Business Environment Labour Market
20
Why is it significant?
The level of industrial action provides one indicator of thegeneral employer-employee relations climate.A low levelof industrial action is a necessary – but not sufficient –condition for constructive dialogue, partnership at workand improved business performance.
How does the UK perform?
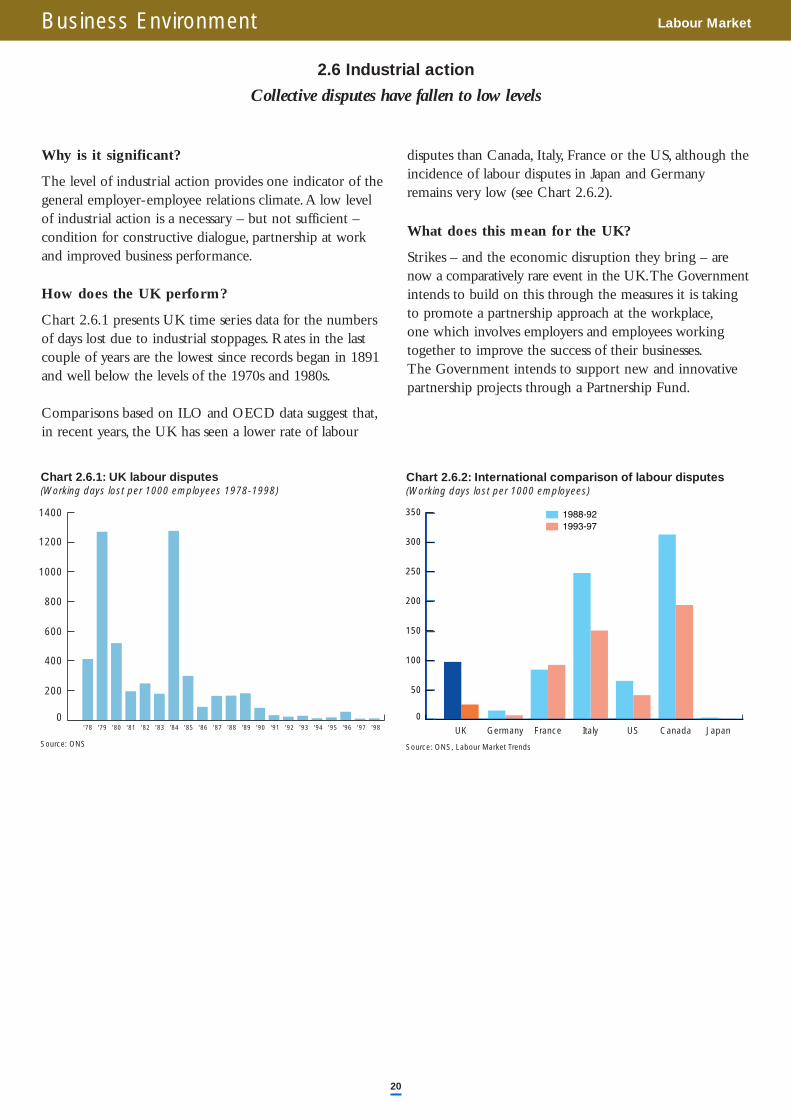
Chart 2.6.1 presents UK time series data for the numbersof days lost due to industrial stoppages. Rates in the lastcouple of years are the lowest since records began in 1891and well below the levels of the 1970s and 1980s.
Comparisons based on ILO and OECD data suggest that,in recent years, the UK has seen a lower rate of labour
disputes than Canada, Italy, France or the US, although the incidence of labour disputes in Japan and Germanyremains very low (see Chart 2.6.2).
What does this mean for the UK?
Strikes – and the economic disruption they bring – arenow a comparatively rare event in the UK.The Governmentintends to build on this through the measures it is takingto promote a partnership approach at the workplace,one which involves employers and employees workingtogether to improve the success of their businesses.The Government intends to support new and innovativepartnership projects through a Partnership Fund.
2.6 Industrial action
Collective disputes have fallen to low levels
Source: ONS, Labour Market Trends
UK Germany France Italy US Canada Japan
Chart 2.6.2: International comparison of labour disputes(Working days lost per 1000 employees)
1988-921993-97
0
50
100
150
200
250
300
350
Source: ONS
'78 '79 '80 '81 '82 '83 '84 '85 '86 '87 '88 '89 '90 '91 '92 '93 '94 '95 '96 '97 '98
Chart 2.6.1: UK labour disputes(Working days lost per 1000 employees 1978-1998)
0
200
400
600
800
1000
1200
1400
Why is it significant?
The ability of employers to offer a diverse range ofemployment opportunities to meet their needs and thoseof their employees, along with the ability of the unemployedor inactive to choose to take part effectively in the labourmarket, is obviously affected by how the labour market isregulated. Labour market regulation is a necessary andimportant component of the institutional framework.Getting the level of regulation right is the key.
How does the UK perform?
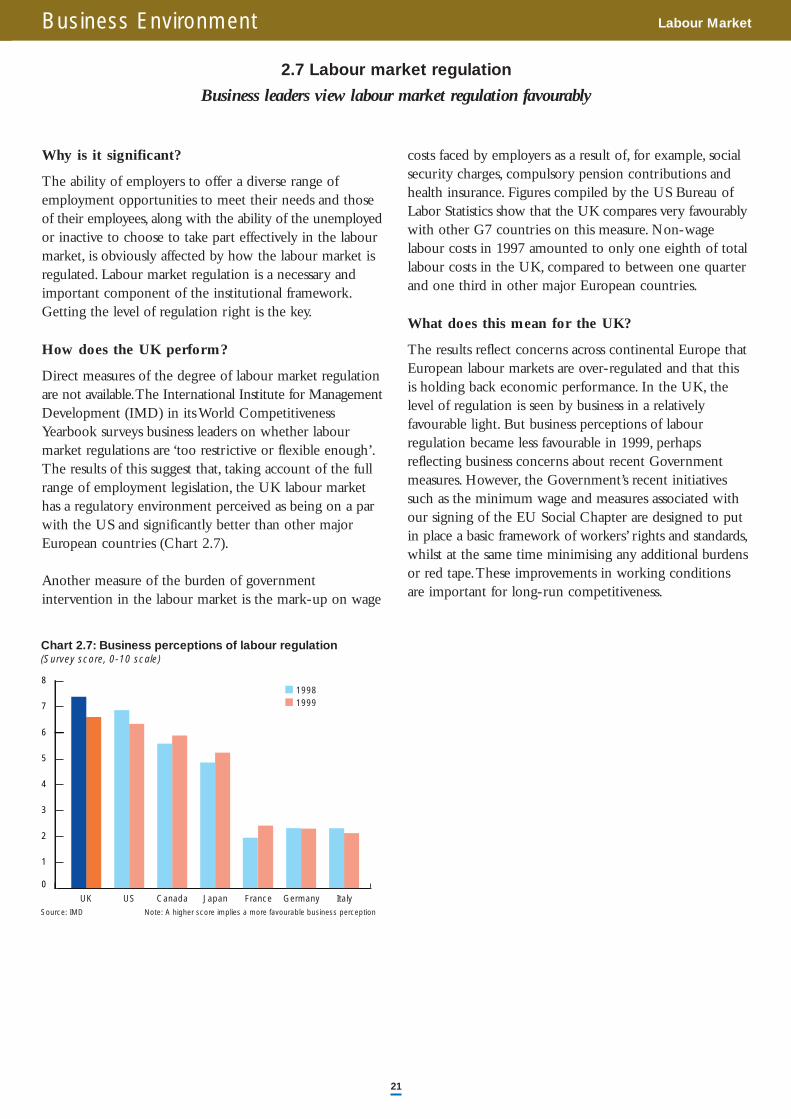
Direct measures of the degree of labour market regulationare not available.The International Institute for ManagementDevelopment (IMD) in its World CompetitivenessYearbook surveys business leaders on whether labour market regulations are ‘too restrictive or flexible enough’.The results of this suggest that, taking account of the fullrange of employment legislation, the UK labour markethas a regulatory environment perceived as being on a parwith the US and significantly better than other majorEuropean countries (Chart 2.7).
Another measure of the burden of governmentintervention in the labour market is the mark-up on wage
costs faced by employers as a result of, for example, socialsecurity charges, compulsory pension contributions andhealth insurance. Figures compiled by the US Bureau ofLabor Statistics show that the UK compares very favourablywith other G7 countries on this measure. Non-wagelabour costs in 1997 amounted to only one eighth of totallabour costs in the UK, compared to between one quarterand one third in other major European countries.
What does this mean for the UK?
The results reflect concerns across continental Europe thatEuropean labour markets are over-regulated and that thisis holding back economic performance. In the UK, thelevel of regulation is seen by business in a relativelyfavourable light. But business perceptions of labourregulation became less favourable in 1999, perhapsreflecting business concerns about recent Governmentmeasures. However, the Government’s recent initiativessuch as the minimum wage and measures associated withour signing of the EU Social Chapter are designed to putin place a basic framework of workers’ rights and standards,whilst at the same time minimising any additional burdensor red tape.These improvements in working conditionsare important for long-run competitiveness.
2.7 Labour market regulation
Business leaders view labour market regulation favourably
Business Environment Labour Market
21
Source: IMD Note: A higher score implies a more favourable business perception
UK US Canada Japan France Germany Italy
Chart 2.7: Business perceptions of labour regulation(Survey score, 0-10 scale)
19981999
0
2
1
3
4
5
6
7
8
Business Environment Business Perceptions
22
Why is it significant?
The ability of any country to develop a stable, flexible and competitive economic environment depends on itsinstitutional and political structure.A competitive businessenvironment requires a set of credible institutionscommitted to improving performance.
While such institutional features are important, they aredifficult to quantify. One solution is to use evidence fromsurveys of business leaders undertaken by bodies such as theInstitute for Management Development (IMD).1 The IMDsurvey focuses on such characteristics as the quality ofgovernment administration, management of public financesand the extent of regulation.A similar exercise is undertakeneach year by the World Economic Forum (WEF).2
The results from surveys of this type need to be interpretedwith caution, since survey responses for individual years arehighly related to short term macroeconomic fluctuations andcan be affected by sampling problems.They are also only anindicator of how far regulation constrains business; they donot say whether this regulation is unnecessary. Governmentsalways need to regulate. Better regulation is the objective.These results can nevertheless give an insight into perceivedstrengths and weakness. Perceptions are important in theirown right as they can influence the choice of business location.
How does the UK perform?
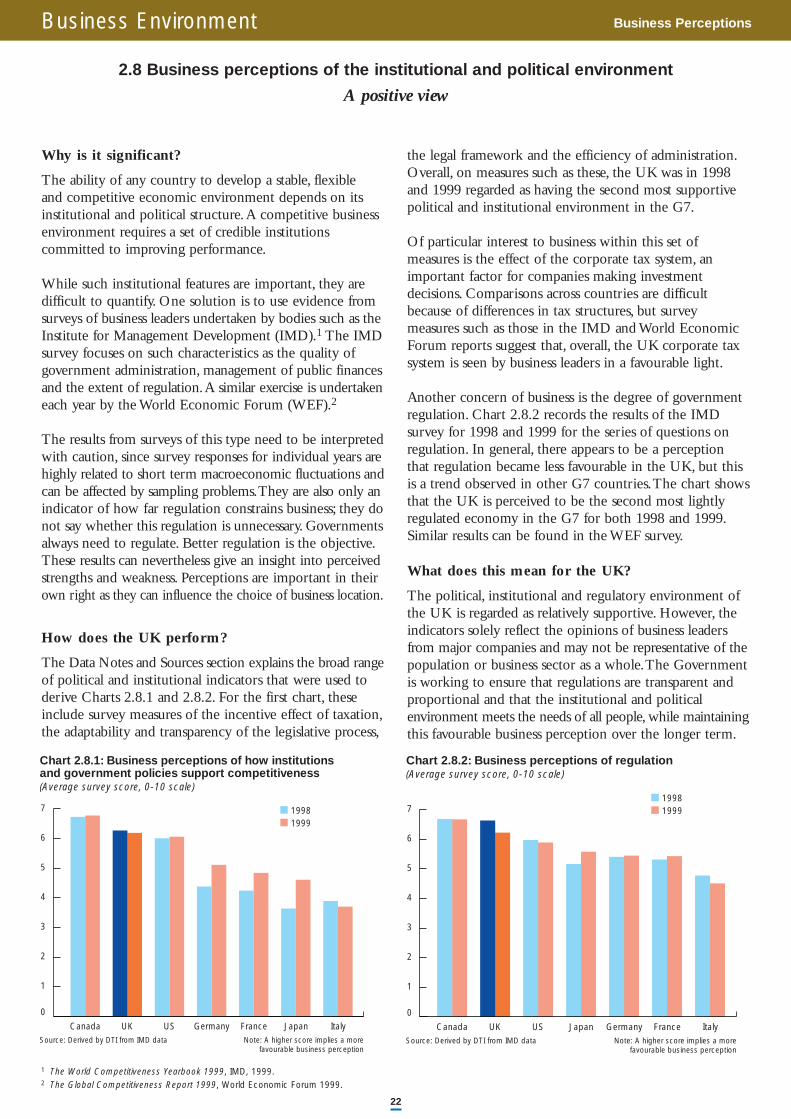
The Data Notes and Sources section explains the broad rangeof political and institutional indicators that were used toderive Charts 2.8.1 and 2.8.2. For the first chart, theseinclude survey measures of the incentive effect of taxation,the adaptability and transparency of the legislative process,
the legal framework and the efficiency of administration.Overall, on measures such as these, the UK was in 1998and 1999 regarded as having the second most supportivepolitical and institutional environment in the G7.
Of particular interest to business within this set ofmeasures is the effect of the corporate tax system, animportant factor for companies making investmentdecisions. Comparisons across countries are difficultbecause of differences in tax structures, but surveymeasures such as those in the IMD and World EconomicForum reports suggest that, overall, the UK corporate taxsystem is seen by business leaders in a favourable light.
Another concern of business is the degree of governmentregulation. Chart 2.8.2 records the results of the IMDsurvey for 1998 and 1999 for the series of questions onregulation. In general, there appears to be a perceptionthat regulation became less favourable in the UK, but thisis a trend observed in other G7 countries.The chart showsthat the UK is perceived to be the second most lightlyregulated economy in the G7 for both 1998 and 1999.Similar results can be found in the WEF survey.
What does this mean for the UK?
The political, institutional and regulatory environment ofthe UK is regarded as relatively supportive. However, theindicators solely reflect the opinions of business leadersfrom major companies and may not be representative of thepopulation or business sector as a whole.The Governmentis working to ensure that regulations are transparent andproportional and that the institutional and politicalenvironment meets the needs of all people, while maintainingthis favourable business perception over the longer term.
2.8 Business perceptions of the institutional and political environment
A positive view
Source: Derived by DTI from IMD data Note: A higher score implies a more favourable business perception
Canada UK US Germany France Japan Italy
and government policies support competitivenessChart 2.8.1: Business perceptions of how institutions
(Average survey score, 0-10 scale)
19981999
0
1
2
3
4
5
6
7
Source: Derived by DTI from IMD data Note: A higher score implies a more favourable business perception
Canada UK US Japan Germany France Italy
Chart 2.8.2: Business perceptions of regulation(Average survey score, 0-10 scale)
19981999
0
1
2
3
4
5
6
7
1 The World Competitiveness Yearbook 1999, IMD, 1999.2 The Global Competitiveness Report 1999, World Economic Forum 1999.

Business Environment Quality of Life
2.9 The Government’s Sustainable Development Indicators
Good, but a lot more to be done
Why is it significant?
There is increasing recognition that quality of life is notonly the key goal of economic activity, but an importantdeterminant of economic performance. For instance, ahealthier population will also be more productive at work,while quality of life can also be an important influence onfirms ‘location decisions.Actions by individuals to improvethe quality of life can also be complementary to economicprogress: for example more sophisticated consumerpurchasing decisions can reduce environmental degradationand stimulate the development of more innovative products.
This means high and stable levels of economic growth andemployment must be consistent with the other sustainabledevelopment objectives of social progress (which recognisesthe needs of everyone); effective protection of the environment; and prudent use of natural resources.
Achieving sustainable development means addressing all ofthese objectives equally, both for present and future generations.
How does the UK perform?
It is clearly inappropriate to select a single indicator as aproxy for sustainable development.The Department of the Environment,Transport and the Regions monitor 15headline indicators (four of which also feature in the UK Competitiveness Indicators), and 132 other indicators.Table 2.9 lists the headline indicators.
Other indicators cover such issues as utility prices, low payand consumer expenditure. DETR also plan to develop ameasure of consumer sophistication.
What does this mean for the UK?
Performance against these indicators will be an importantconsideration in determining whether we are succeedingas a knowledge driven economy or not. More informationis available in Quality of Life Counts: Indicators for a strategyfor sustainable development for the United Kingdom;A baselineassessment.
Table 2.9: The Headline Sustainable Development Indicators
THEMES, ISSUES AND OBJECTIVES KEY INDICATORS
Maintaining High And Stable Levels Of Economic Growth And Employment
Our economy must continue to grow Total output of the economy (GDP) (see competitiveness indicator 5.1)
Investment (in modern plant, machinery as well as Investment in public, business and private assets research and development) is vital to our future prosperity (see competitiveness indicators 3.3 and 3.4)
Maintain high and stable levels of employment so Proportion of people of working age who are in work everyone can share greater job opportunities (see competitiveness indicator 5.3)
Social Progress Which Recognises The Needs Of Everyone
Tackling poverty and social exclusion Children in low income households, adults without qualifica-tions and in workless households, elderly in fuel poverty
Equip people with the skills to fulfil their potential Qualifications at age 19 (see competitiveness indicator 3.2)
Improve the health of the population overall Expected years of healthy life
Reduce the proportion of unfit (housing) stock Homes judged unfit to live in
Reduce both crime and fear of crime Level of crime
Effective Protection Of The Environment
Continue to reduce our emissions (of greenhouse gases) Emissions of greenhouse gases now, and plan for greater reductions in longer term
Reduce air pollution and ensure air quality continues to Days when air pollution is moderate or high improve through the longer term
Reduce the need to travel and improve choice in transport Road traffic
Improving river quality Rivers of good or fair quality
Reverse the long-term decline in populations of farmland Populations of wild birds and woodland birds
Re-using previously developed land, in order to protect New homes built on previously developed landthe countryside and encourage urban regeneration
Prudent Use Of Natural Resources
Moving away from disposal of waste towards waste Waste arisings and management minimisation, reuse, recycling and recovery
23
Resources Introduction
24
Chapter 3: Resources
Successful innovative economies need the right capabilities.They need sufficient resources of technology, physical capitaland skilled labour if they are to generate rising living standards.
Five sets of resource indicators have been chosen for inclusion in the UK Competitiveness Indicators:
• Human capital – as knowledge becomes more important to business success, it is ever more essential that workers areequipped with the right skills.
• Physical capital – investment is an important vehicle for ensuring the latest technology is available to business.
• Finance – liquid capital markets free managers and entrepreneurs to invest in new ideas.
• Information and communication technology – ICT allows companies to transform the way they do business,creating new markets and changing the dynamics of old ones.
• Science and technology – the strength of the science base is an important determinant of the capacity of a nationto generate knowledge.
The traffic light summarises the historical performance of individual indicators, with each indicator assigned to a band onthe basis of the assessment set out in the rest of this chapter.
Summary of Resources Indicators
3.7 Stock market size and turnover3.11 Publications and citations of UK research in
academic journals
3.2 National Learning Targets3.5 Venture capital3.8 Business uptake and use of ICT3.9 ICT understanding in companies3.10 E-commerce
3.1 Adult literacy and numeracy3.3 Business investment per worker 3.4 Past record on government investment per head3.6 Second tier markets3.12 Past record on government spend on R&D
per worker3.13 Business spend on R&D per worker
The green band shows those areas where the UK has signs of strength.The UK isregarded as only average in those indicators placed in the amber box. Indicators in thered section show clear signs of weakness.Within each of the three bands, indicators arelisted in order of their appearance in this chaptersigns of weakness.Within each of thethree bands, indicators are
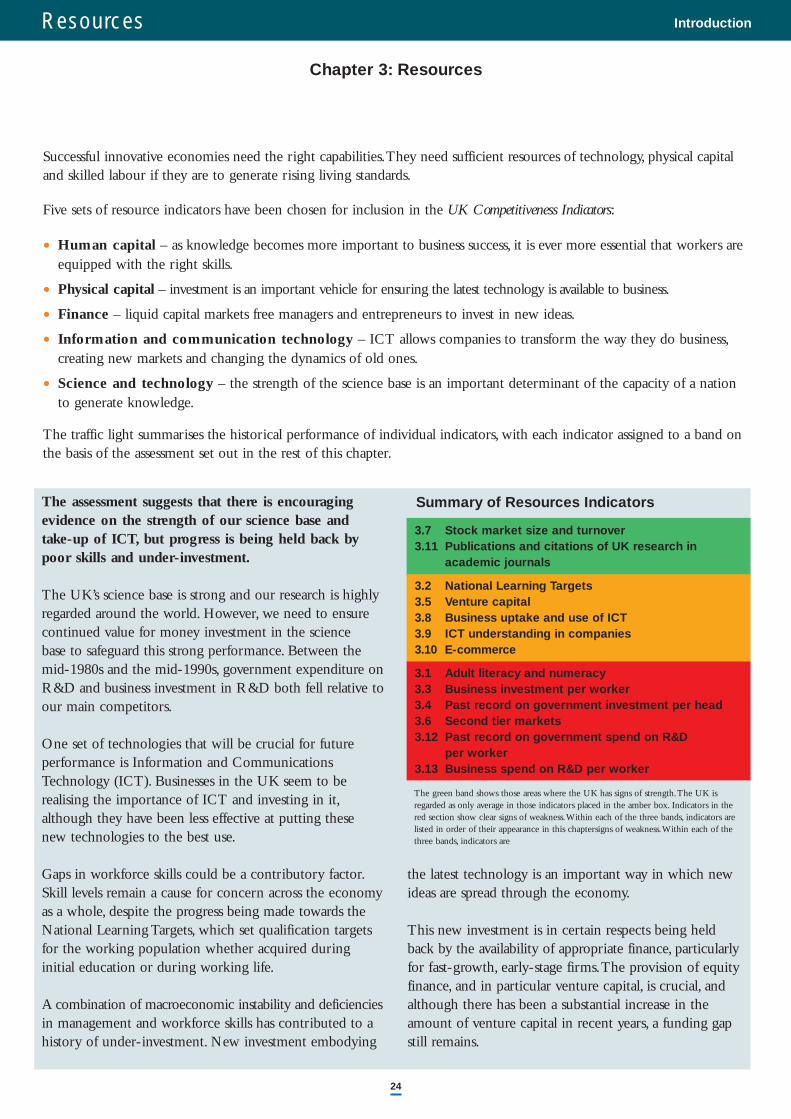
The assessment suggests that there is encouragingevidence on the strength of our science base andtake-up of ICT, but progress is being held back bypoor skills and under-investment.
The UK’s science base is strong and our research is highlyregarded around the world. However, we need to ensurecontinued value for money investment in the science base to safeguard this strong performance. Between themid-1980s and the mid-1990s, government expenditure onR&D and business investment in R&D both fell relative toour main competitors.
One set of technologies that will be crucial for future performance is Information and CommunicationsTechnology (ICT). Businesses in the UK seem to be realising the importance of ICT and investing in it,although they have been less effective at putting these new technologies to the best use.
Gaps in workforce skills could be a contributory factor.Skill levels remain a cause for concern across the economyas a whole, despite the progress being made towards theNational Learning Targets, which set qualification targetsfor the working population whether acquired during initial education or during working life.
A combination of macroeconomic instability and deficienciesin management and workforce skills has contributed to ahistory of under-investment. New investment embodying
the latest technology is an important way in which newideas are spread through the economy.
This new investment is in certain respects being held back by the availability of appropriate finance, particularlyfor fast-growth, early-stage firms.The provision of equityfinance, and in particular venture capital, is crucial, andalthough there has been a substantial increase in theamount of venture capital in recent years, a funding gapstill remains.
Resources Human Capital
25
Why is it significant?
Success in the knowledge driven economy requires askilled and motivated workforce and management.The effects of the knowledge driven economy are alreadyclearly visible in the labour market.Workers everywhereare more highly educated.Advances in technology enablefirms to produce the same amount of output with fewerunskilled employees, while at the same time increasing thedemand for skilled labour to operate the equipment.
The most basic skills are literacy and numeracy. Peoplewith poor levels of either will find it increasingly difficultto compete effectively in the labour market as the proportionof unskilled jobs in the total falls.Without adequate literacyand numeracy, they are unlikely to be able to take fulladvantage of education and training opportunities, and areat greater risk of social exclusion
How does the UK perform?
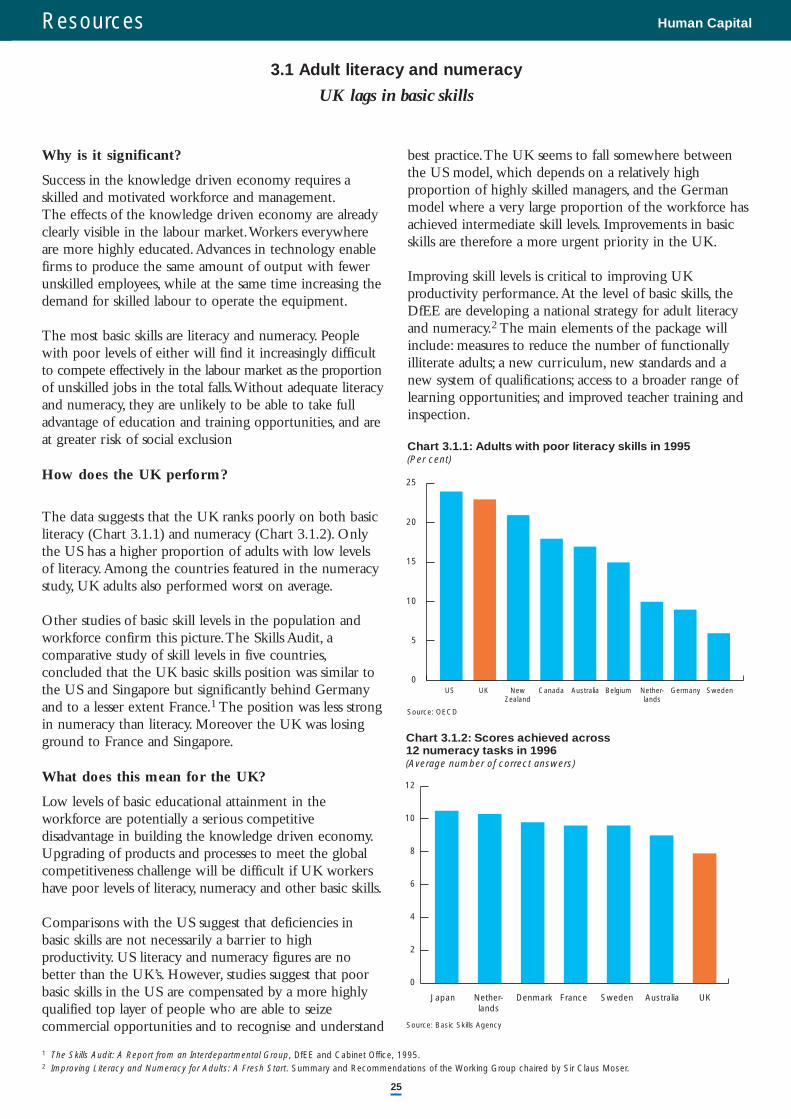
The data suggests that the UK ranks poorly on both basicliteracy (Chart 3.1.1) and numeracy (Chart 3.1.2). Onlythe US has a higher proportion of adults with low levelsof literacy.Among the countries featured in the numeracystudy, UK adults also performed worst on average.
Other studies of basic skill levels in the population andworkforce confirm this picture.The Skills Audit, acomparative study of skill levels in five countries,concluded that the UK basic skills position was similar tothe US and Singapore but significantly behind Germanyand to a lesser extent France.1 The position was less strongin numeracy than literacy. Moreover the UK was losingground to France and Singapore.
What does this mean for the UK?
Low levels of basic educational attainment in theworkforce are potentially a serious competitivedisadvantage in building the knowledge driven economy.Upgrading of products and processes to meet the globalcompetitiveness challenge will be difficult if UK workershave poor levels of literacy, numeracy and other basic skills.
Comparisons with the US suggest that deficiencies inbasic skills are not necessarily a barrier to highproductivity. US literacy and numeracy figures are nobetter than the UK’s. However, studies suggest that poorbasic skills in the US are compensated by a more highlyqualified top layer of people who are able to seizecommercial opportunities and to recognise and understand
best practice.The UK seems to fall somewhere betweenthe US model, which depends on a relatively highproportion of highly skilled managers, and the Germanmodel where a very large proportion of the workforce hasachieved intermediate skill levels. Improvements in basicskills are therefore a more urgent priority in the UK.
Improving skill levels is critical to improving UKproductivity performance.At the level of basic skills, theDfEE are developing a national strategy for adult literacyand numeracy.2 The main elements of the package willinclude: measures to reduce the number of functionallyilliterate adults; a new curriculum, new standards and anew system of qualifications; access to a broader range oflearning opportunities; and improved teacher training andinspection.
3.1 Adult literacy and numeracy
UK lags in basic skills
Source: OECD
US UK NewZealand
Canada Australia Belgium Nether-lands
Germany Sweden
Chart 3.1.1: Adults with poor literacy skills in 1995(Per cent)
0
5
10
15
20
25
Source: Basic Skills Agency
Chart 3.1.2: Scores achieved across12 numeracy tasks in 1996(Average number of correct answers)
Japan Nether-lands
Denmark France Sweden Australia UK
0
2
4
6
8
10
12
1 The Skills Audit: A Report from an Interdepartmental Group, DfEE and Cabinet Office, 1995.2 Improving Literacy and Numeracy for Adults: A Fresh Start. Summary and Recommendations of the Working Group chaired by Sir Claus Moser.
Resources Human Capital
26
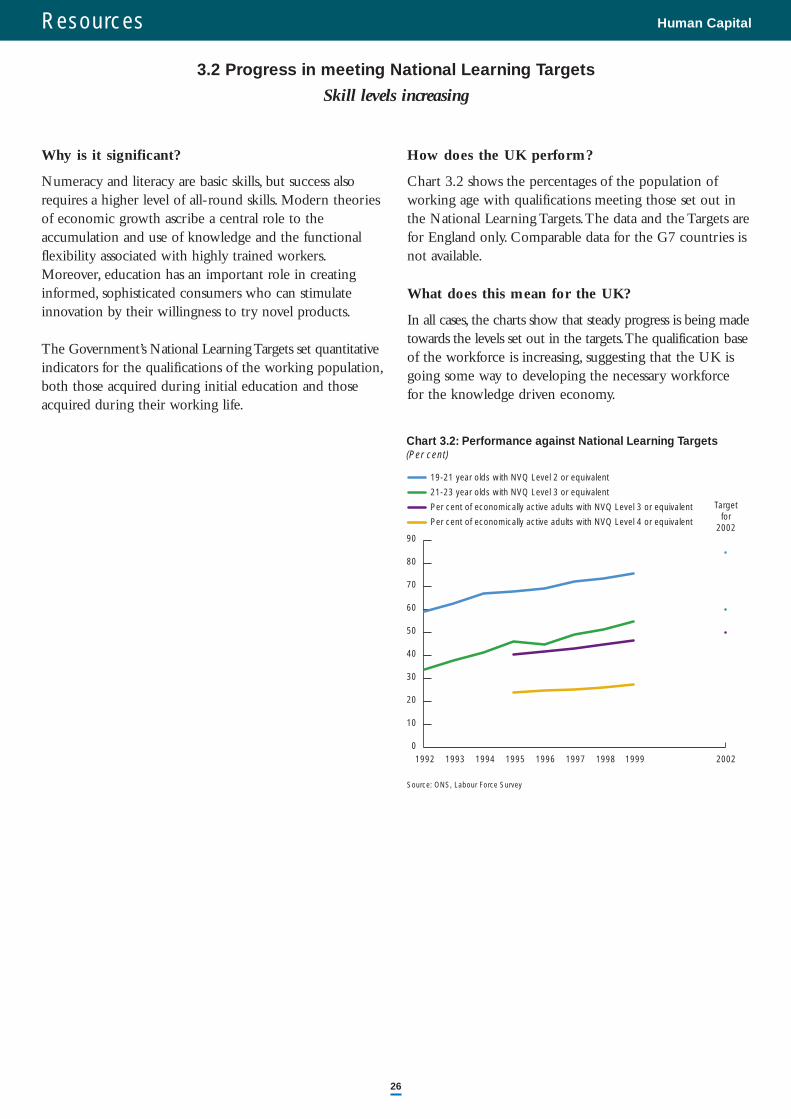
Why is it significant?
Numeracy and literacy are basic skills, but success alsorequires a higher level of all-round skills. Modern theoriesof economic growth ascribe a central role to the accumulation and use of knowledge and the functionalflexibility associated with highly trained workers.Moreover, education has an important role in creatinginformed, sophisticated consumers who can stimulateinnovation by their willingness to try novel products.
The Government’s National Learning Targets set quantitativeindicators for the qualifications of the working population,both those acquired during initial education and thoseacquired during their working life.
How does the UK perform?
Chart 3.2 shows the percentages of the population ofworking age with qualifications meeting those set out inthe National Learning Targets.The data and the Targets arefor England only. Comparable data for the G7 countries isnot available.
What does this mean for the UK?
In all cases, the charts show that steady progress is being madetowards the levels set out in the targets.The qualification baseof the workforce is increasing, suggesting that the UK isgoing some way to developing the necessary workforcefor the knowledge driven economy.
3.2 Progress in meeting National Learning Targets
Skill levels increasing
Source: ONS, Labour Force Survey
Chart 3.2: Performance against National Learning Targets(Per cent)
0
10
20
30
40
50
60
70
80
90
Per cent of economically active adults with NVQ Level 4 or equivalent
Per cent of economically active adults with NVQ Level 3 or equivalent
21-23 year olds with NVQ Level 3 or equivalent
19-21 year olds with NVQ Level 2 or equivalent
20021998 1999199719961995199419931992
Targetfor
2002
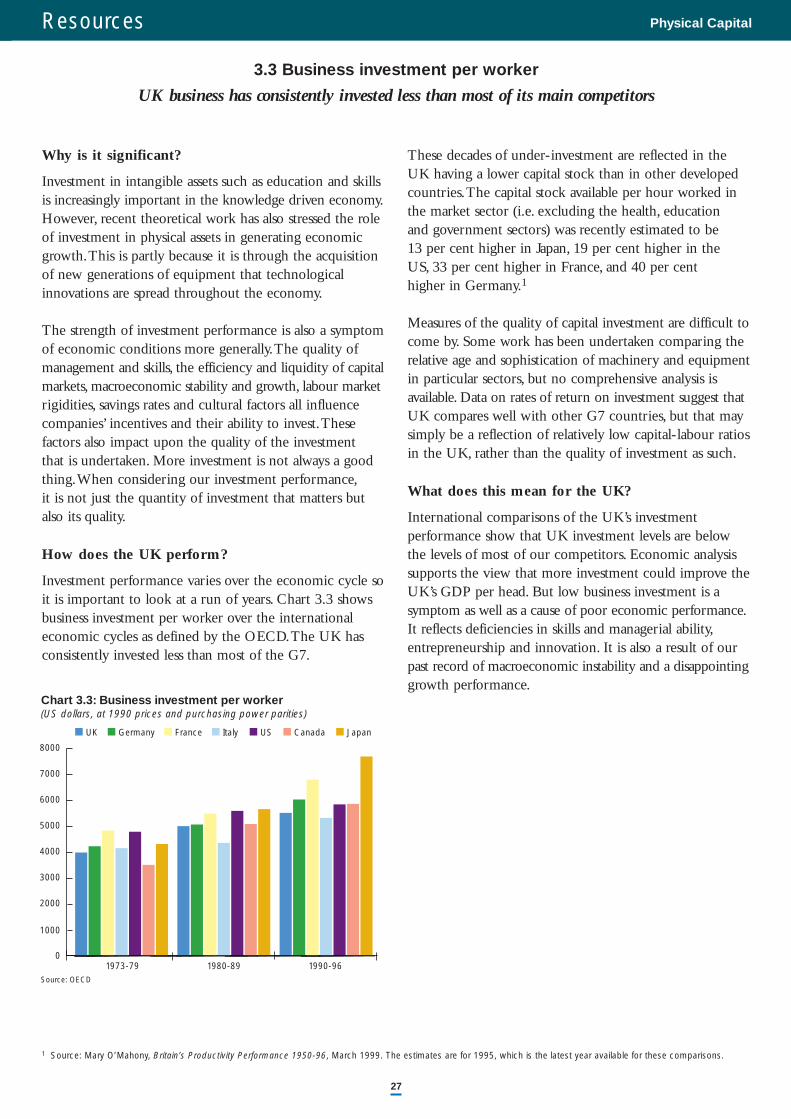
Resources Physical Capital
27
Why is it significant?
Investment in intangible assets such as education and skillsis increasingly important in the knowledge driven economy.However, recent theoretical work has also stressed the roleof investment in physical assets in generating economicgrowth.This is partly because it is through the acquisitionof new generations of equipment that technological innovations are spread throughout the economy.
The strength of investment performance is also a symptomof economic conditions more generally.The quality ofmanagement and skills, the efficiency and liquidity of capitalmarkets, macroeconomic stability and growth, labour marketrigidities, savings rates and cultural factors all influencecompanies’ incentives and their ability to invest.These factors also impact upon the quality of the investment that is undertaken. More investment is not always a goodthing.When considering our investment performance,it is not just the quantity of investment that matters butalso its quality.
How does the UK perform?
Investment performance varies over the economic cycle soit is important to look at a run of years. Chart 3.3 showsbusiness investment per worker over the international economic cycles as defined by the OECD.The UK hasconsistently invested less than most of the G7.
These decades of under-investment are reflected in theUK having a lower capital stock than in other developedcountries.The capital stock available per hour worked inthe market sector (i.e. excluding the health, education and government sectors) was recently estimated to be 13 per cent higher in Japan, 19 per cent higher in the US, 33 per cent higher in France, and 40 per cent higher in Germany.1
Measures of the quality of capital investment are difficult tocome by. Some work has been undertaken comparing therelative age and sophistication of machinery and equipmentin particular sectors, but no comprehensive analysis isavailable. Data on rates of return on investment suggest thatUK compares well with other G7 countries, but that maysimply be a reflection of relatively low capital-labour ratiosin the UK, rather than the quality of investment as such.
What does this mean for the UK?
International comparisons of the UK’s investment performance show that UK investment levels are belowthe levels of most of our competitors. Economic analysissupports the view that more investment could improve theUK’s GDP per head. But low business investment is asymptom as well as a cause of poor economic performance.It reflects deficiencies in skills and managerial ability,entrepreneurship and innovation. It is also a result of ourpast record of macroeconomic instability and a disappointinggrowth performance.
3.3 Business investment per worker
UK business has consistently invested less than most of its main competitors
Source: OECD
1973-79 1980-89 1990-96
Chart 3.3: Business investment per worker(US dollars, at 1990 prices and purchasing power parities)
UK Germany France Italy US Canada Japan
0
1000
2000
3000
4000
5000
6000
7000
8000
1 Source: Mary O’Mahony, Britain’s Productivity Performance 1950-96, March 1999. The estimates are for 1995, which is the latest year available for these comparisons.
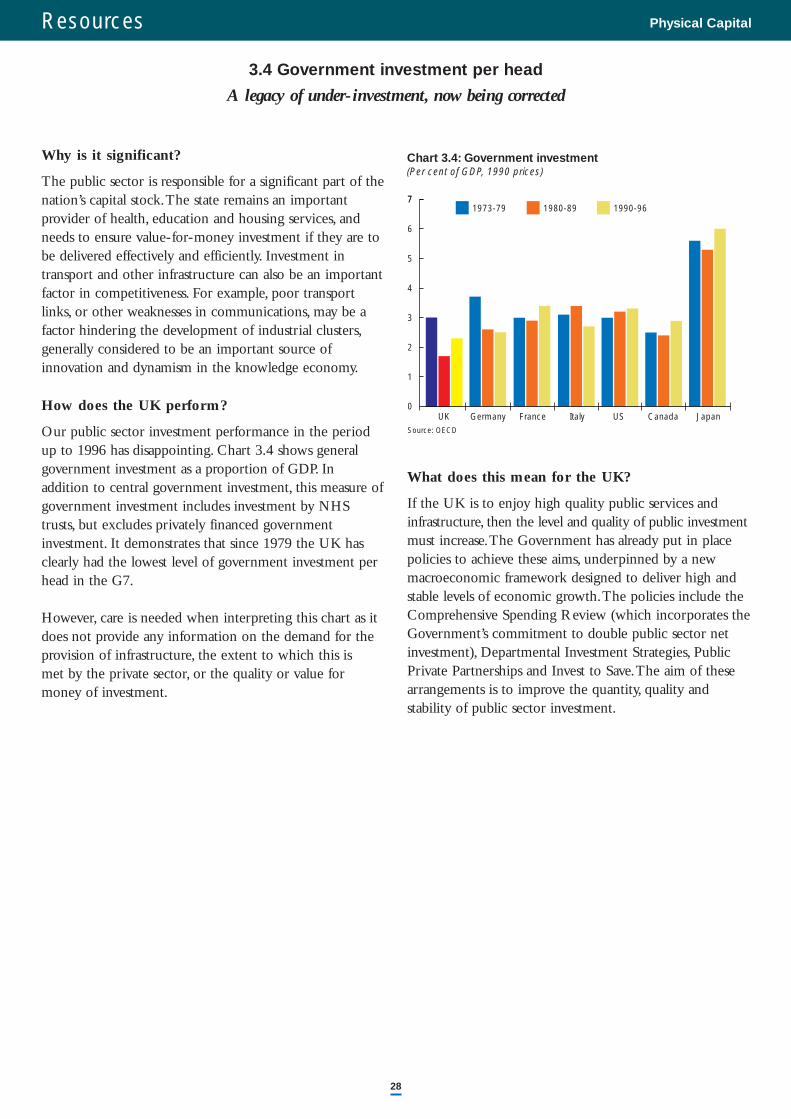
Resources Physical Capital
28
Why is it significant?
The public sector is responsible for a significant part of thenation’s capital stock.The state remains an importantprovider of health, education and housing services, andneeds to ensure value-for-money investment if they are tobe delivered effectively and efficiently. Investment intransport and other infrastructure can also be an importantfactor in competitiveness. For example, poor transportlinks, or other weaknesses in communications, may be afactor hindering the development of industrial clusters,generally considered to be an important source of innovation and dynamism in the knowledge economy.
How does the UK perform?
Our public sector investment performance in the periodup to 1996 has disappointing. Chart 3.4 shows generalgovernment investment as a proportion of GDP. Inaddition to central government investment, this measure of government investment includes investment by NHStrusts, but excludes privately financed government investment. It demonstrates that since 1979 the UK hasclearly had the lowest level of government investment perhead in the G7.
However, care is needed when interpreting this chart as itdoes not provide any information on the demand for theprovision of infrastructure, the extent to which this is met by the private sector, or the quality or value formoney of investment.
What does this mean for the UK?
If the UK is to enjoy high quality public services andinfrastructure, then the level and quality of public investmentmust increase.The Government has already put in placepolicies to achieve these aims, underpinned by a newmacroeconomic framework designed to deliver high andstable levels of economic growth.The policies include theComprehensive Spending Review (which incorporates theGovernment’s commitment to double public sector netinvestment), Departmental Investment Strategies, PublicPrivate Partnerships and Invest to Save.The aim of thesearrangements is to improve the quantity, quality and stability of public sector investment.
3.4 Government investment per head
A legacy of under-investment, now being corrected
Source: OECD
UK Germany France Italy US Canada Japan
Chart 3.4: Government investment (Per cent of GDP, 1990 prices)
1973-79 1980-89 1990-96
0
77
6
5
4
3
2
1
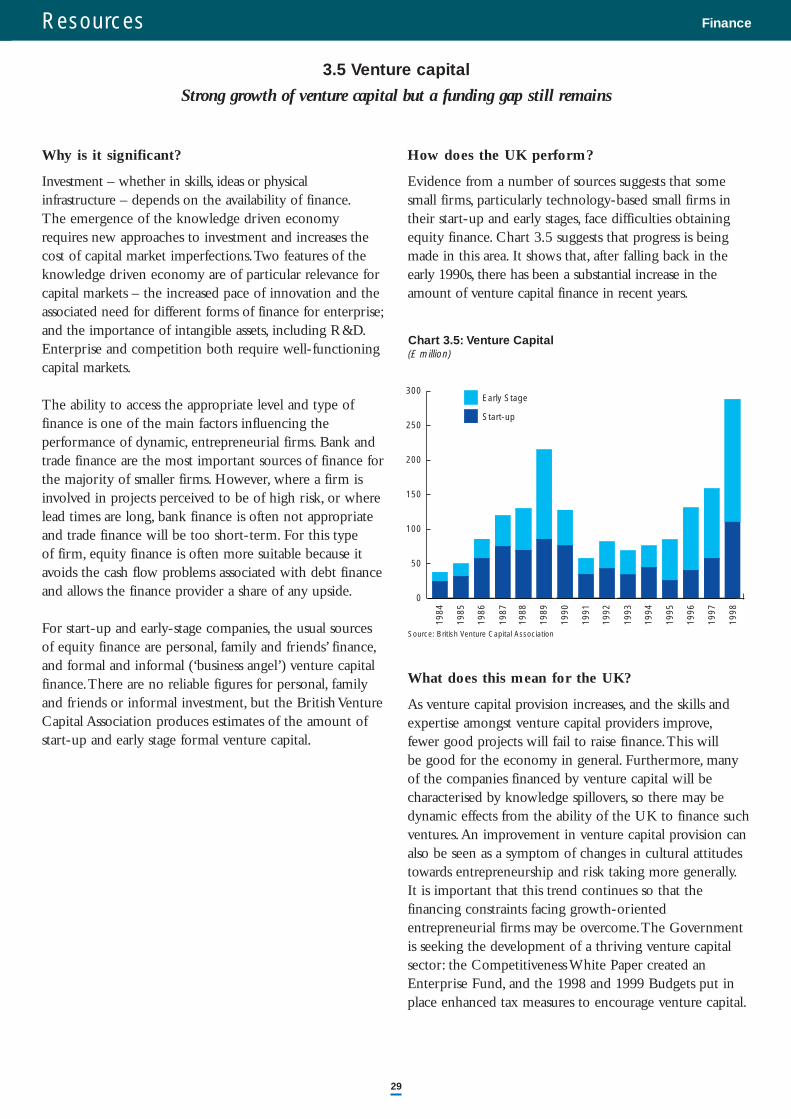
Resources Finance
29
Why is it significant?
Investment – whether in skills, ideas or physicalinfrastructure – depends on the availability of finance.The emergence of the knowledge driven economyrequires new approaches to investment and increases thecost of capital market imperfections.Two features of theknowledge driven economy are of particular relevance forcapital markets – the increased pace of innovation and theassociated need for different forms of finance for enterprise;and the importance of intangible assets, including R&D.Enterprise and competition both require well-functioningcapital markets.
The ability to access the appropriate level and type offinance is one of the main factors influencing the performance of dynamic, entrepreneurial firms. Bank andtrade finance are the most important sources of finance forthe majority of smaller firms. However, where a firm isinvolved in projects perceived to be of high risk, or wherelead times are long, bank finance is often not appropriateand trade finance will be too short-term. For this type of firm, equity finance is often more suitable because itavoids the cash flow problems associated with debt financeand allows the finance provider a share of any upside.
For start-up and early-stage companies, the usual sourcesof equity finance are personal, family and friends’ finance,and formal and informal (‘business angel’) venture capitalfinance.There are no reliable figures for personal, familyand friends or informal investment, but the British VentureCapital Association produces estimates of the amount ofstart-up and early stage formal venture capital.
How does the UK perform?
Evidence from a number of sources suggests that somesmall firms, particularly technology-based small firms intheir start-up and early stages, face difficulties obtainingequity finance. Chart 3.5 suggests that progress is beingmade in this area. It shows that, after falling back in theearly 1990s, there has been a substantial increase in theamount of venture capital finance in recent years.
What does this mean for the UK?
As venture capital provision increases, and the skills andexpertise amongst venture capital providers improve,fewer good projects will fail to raise finance.This will be good for the economy in general. Furthermore, manyof the companies financed by venture capital will becharacterised by knowledge spillovers, so there may bedynamic effects from the ability of the UK to finance suchventures.An improvement in venture capital provision canalso be seen as a symptom of changes in cultural attitudestowards entrepreneurship and risk taking more generally.It is important that this trend continues so that thefinancing constraints facing growth-orientedentrepreneurial firms may be overcome.The Governmentis seeking the development of a thriving venture capitalsector: the Competitiveness White Paper created anEnterprise Fund, and the 1998 and 1999 Budgets put inplace enhanced tax measures to encourage venture capital.
3.5 Venture capital
Strong growth of venture capital but a funding gap still remains
Source: British Venture Capital Association
1984
1985
1986
1987
1988
1989
1990
1991
1992
1993
1994
1995
1996
1997
1998
Chart 3.5: Venture Capital(£ million)
Early Stage
Start-up
0
50
100
150
200
250
300
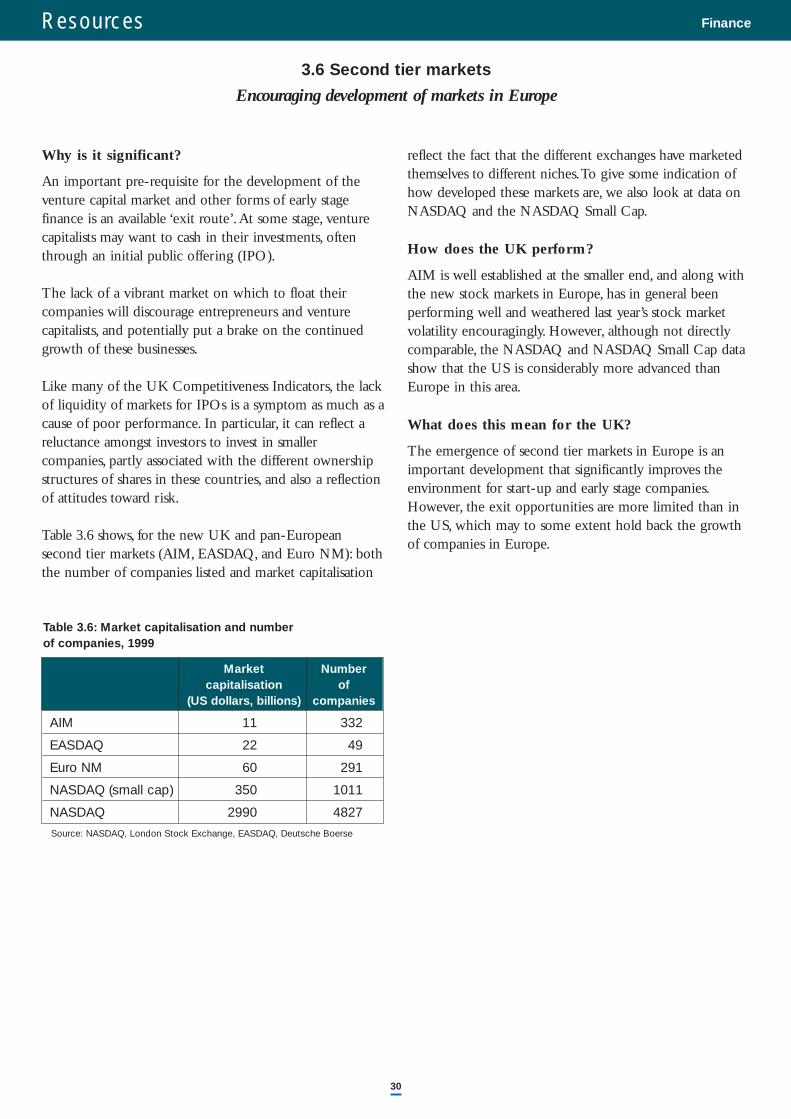
Resources Finance
30
Why is it significant?
An important pre-requisite for the development of theventure capital market and other forms of early stagefinance is an available ‘exit route’.At some stage, venturecapitalists may want to cash in their investments, oftenthrough an initial public offering (IPO).
The lack of a vibrant market on which to float theircompanies will discourage entrepreneurs and venturecapitalists, and potentially put a brake on the continuedgrowth of these businesses.
Like many of the UK Competitiveness Indicators, the lackof liquidity of markets for IPOs is a symptom as much as acause of poor performance. In particular, it can reflect areluctance amongst investors to invest in smallercompanies, partly associated with the different ownershipstructures of shares in these countries, and also a reflectionof attitudes toward risk.
Table 3.6 shows, for the new UK and pan-Europeansecond tier markets (AIM, EASDAQ, and Euro NM): boththe number of companies listed and market capitalisation
reflect the fact that the different exchanges have marketedthemselves to different niches.To give some indication ofhow developed these markets are, we also look at data onNASDAQ and the NASDAQ Small Cap.
How does the UK perform?
AIM is well established at the smaller end, and along withthe new stock markets in Europe, has in general been performing well and weathered last year’s stock marketvolatility encouragingly. However, although not directlycomparable, the NASDAQ and NASDAQ Small Cap datashow that the US is considerably more advanced thanEurope in this area.
What does this mean for the UK?
The emergence of second tier markets in Europe is animportant development that significantly improves theenvironment for start-up and early stage companies.However, the exit opportunities are more limited than inthe US, which may to some extent hold back the growthof companies in Europe.
3.6 Second tier markets
Encouraging development of markets in Europe
Market Numbercapitalisation of
(US dollars, billions) companies
AIM 11 332
EASDAQ 22 49
Euro NM 60 291
NASDAQ (small cap) 350 1011
NASDAQ 2990 4827
Table 3.6: Market capitalisation and number of companies, 1999
Source: NASDAQ, London Stock Exchange, EASDAQ, Deutsche Boerse

Resources Finance
31
Why is it significant?
Larger firms can normally more easily access finance in theglobal financial marketplace. Nevertheless, the existence ofa large, liquid and sophisticated financial market in aparticular country facilitates the process of raising capitalfor firms based in that country, quite apart from being asource of growth and employment in its own right.
The relative size of the stock market is taken here as anindicator of the sophistication of the capital market in aparticular country, and its ability to meet the needs oflarger businesses more generally.
How does the UK perform?
In 1998 the London Stock Exchange was the fourthlargest market in the world by capitalisation, and the thirdlargest market in terms of turnover as seen in Chart 3.7.It is by far Europe’s largest international financial centre,with more foreign banks based in London than in anyother city in the world.
What does this mean for the UK?
The size of the City of London as a financial centresuggests that the infrastructure exists in this country tomeet larger firms’ financial needs.This is not to say,however, that capital markets in this country are always asefficient and innovative as elsewhere in the world.Commentators have long debated how issues likeownership structures and corporate governancearrangements affect the cost and availability of capital.These issues will be looked at further in later issues of theUK Competitiveness Indicators.
3.7 Stock market size and turnover
London still one of the world’s leading financial centres
Source: London Stock Exchange
Capitalisation
Turnover
Chart 3.7: Stock exchange capitalisation and turnover in 1998(£ billion)
0
1,000
2,000
3,000
4,000
5,000
6,000
7,000
New
Yor
k
Nas
daq
Toky
o
Lond
on
Ger
man
y
Par
is
Sw
itzer
land
Am
ster
dam
Italy
Toro
nto
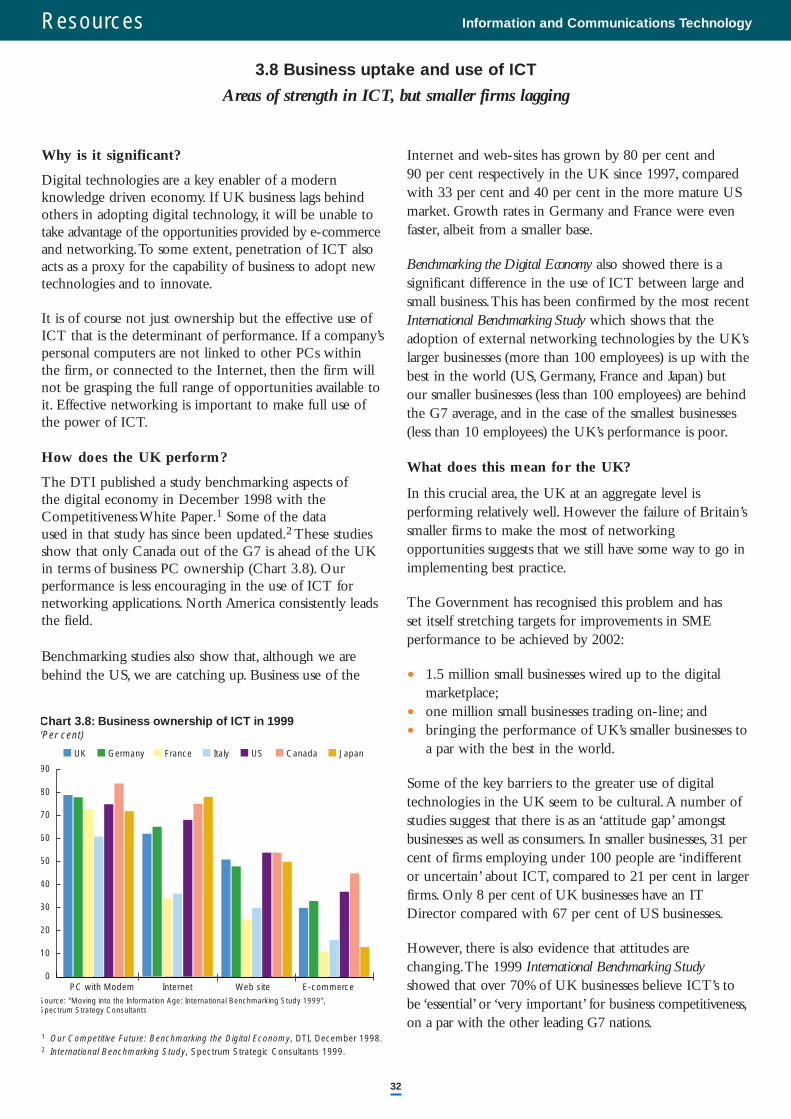
Resources Information and Communications Technology
32
Why is it significant?
Digital technologies are a key enabler of a modern knowledge driven economy. If UK business lags behindothers in adopting digital technology, it will be unable totake advantage of the opportunities provided by e-commerceand networking.To some extent, penetration of ICT alsoacts as a proxy for the capability of business to adopt newtechnologies and to innovate.
It is of course not just ownership but the effective use ofICT that is the determinant of performance. If a company’spersonal computers are not linked to other PCs withinthe firm, or connected to the Internet, then the firm willnot be grasping the full range of opportunities available toit. Effective networking is important to make full use ofthe power of ICT.
How does the UK perform?
The DTI published a study benchmarking aspects of the digital economy in December 1998 with theCompetitiveness White Paper.1 Some of the data used in that study has since been updated.2 These studiesshow that only Canada out of the G7 is ahead of the UKin terms of business PC ownership (Chart 3.8). Ourperformance is less encouraging in the use of ICT fornetworking applications. North America consistently leadsthe field.
Benchmarking studies also show that, although we arebehind the US, we are catching up. Business use of the
Internet and web-sites has grown by 80 per cent and 90 per cent respectively in the UK since 1997, comparedwith 33 per cent and 40 per cent in the more mature USmarket. Growth rates in Germany and France were evenfaster, albeit from a smaller base.
Benchmarking the Digital Economy also showed there is asignificant difference in the use of ICT between large andsmall business.This has been confirmed by the most recentInternational Benchmarking Study which shows that theadoption of external networking technologies by the UK’slarger businesses (more than 100 employees) is up with thebest in the world (US, Germany, France and Japan) butour smaller businesses (less than 100 employees) are behindthe G7 average, and in the case of the smallest businesses(less than 10 employees) the UK’s performance is poor.
What does this mean for the UK?
In this crucial area, the UK at an aggregate level is performing relatively well. However the failure of Britain’ssmaller firms to make the most of networkingopportunities suggests that we still have some way to go inimplementing best practice.
The Government has recognised this problem and has set itself stretching targets for improvements in SME performance to be achieved by 2002:
• 1.5 million small businesses wired up to the digital marketplace;
• one million small businesses trading on-line; and
• bringing the performance of UK’s smaller businesses toa par with the best in the world.
Some of the key barriers to the greater use of digital technologies in the UK seem to be cultural.A number ofstudies suggest that there is as an ‘attitude gap’ amongstbusinesses as well as consumers. In smaller businesses, 31 percent of firms employing under 100 people are ‘indifferentor uncertain’ about ICT, compared to 21 per cent in largerfirms. Only 8 per cent of UK businesses have an ITDirector compared with 67 per cent of US businesses.
However, there is also evidence that attitudes arechanging.The 1999 International Benchmarking Studyshowed that over 70% of UK businesses believe ICT’s tobe ‘essential’ or ‘very important’ for business competitiveness,on a par with the other leading G7 nations.
3.8 Business uptake and use of ICT
Areas of strength in ICT, but smaller firms lagging
Source: "Moving into the Information Age: International Benchmarking Study 1999",Spectrum Strategy Consultants
PC with Modem Internet Web site E-commerce
Chart 3.8: Business ownership of ICT in 1999(Per cent)
UK Germany France Italy US Canada Japan
0
10
20
30
40
50
60
70
80
90
1 Our Competitive Future: Benchmarking the Digital Economy, DTI, December 1998.2 International Benchmarking Study, Spectrum Strategic Consultants 1999.
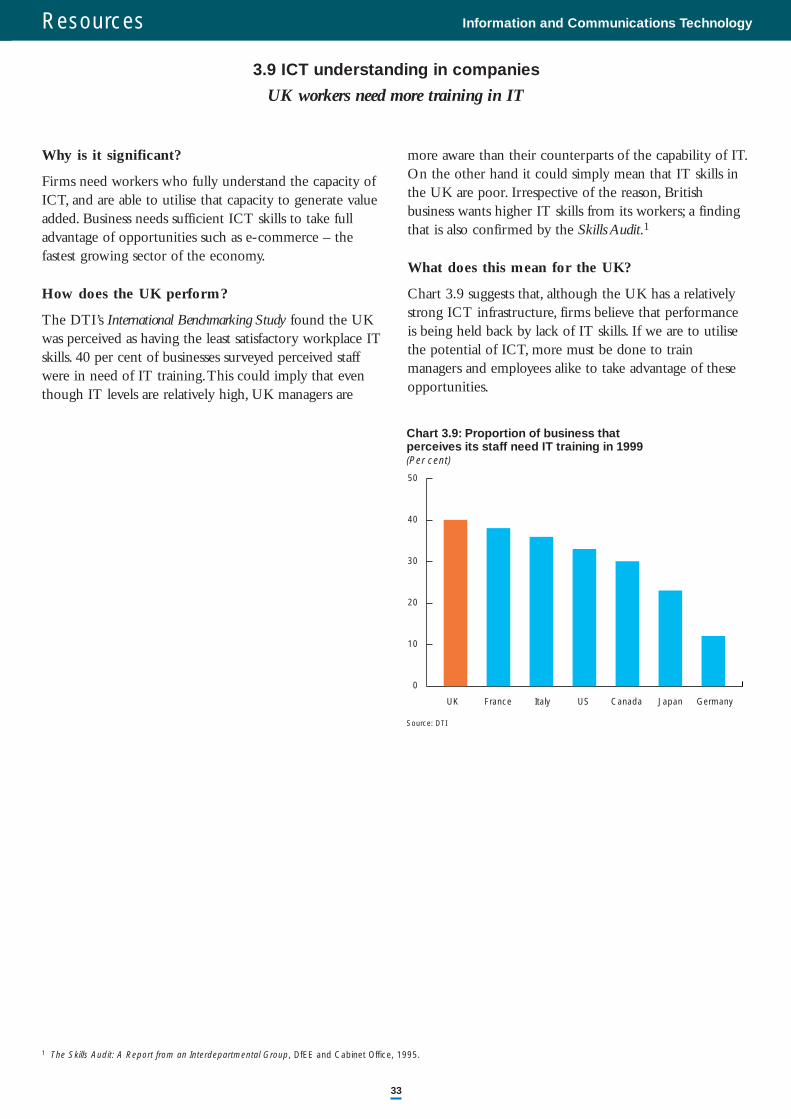
Resources Information and Communications Technology
33
Why is it significant?
Firms need workers who fully understand the capacity ofICT, and are able to utilise that capacity to generate valueadded. Business needs sufficient ICT skills to take fulladvantage of opportunities such as e-commerce – thefastest growing sector of the economy.
How does the UK perform?
The DTI’s International Benchmarking Study found the UKwas perceived as having the least satisfactory workplace ITskills. 40 per cent of businesses surveyed perceived staffwere in need of IT training.This could imply that eventhough IT levels are relatively high, UK managers are
more aware than their counterparts of the capability of IT.On the other hand it could simply mean that IT skills inthe UK are poor. Irrespective of the reason, Britishbusiness wants higher IT skills from its workers; a findingthat is also confirmed by the Skills Audit.1
What does this mean for the UK?
Chart 3.9 suggests that, although the UK has a relativelystrong ICT infrastructure, firms believe that performanceis being held back by lack of IT skills. If we are to utilisethe potential of ICT, more must be done to trainmanagers and employees alike to take advantage of theseopportunities.
3.9 ICT understanding in companies
UK workers need more training in IT
Source: DTI
Chart 3.9: Proportion of business that perceives its staff need IT training in 1999(Per cent)
UK France Italy US Canada Japan Germany
0
10
20
30
40
50
1 The Skills Audit: A Report from an Interdepartmental Group, DfEE and Cabinet Office, 1995.
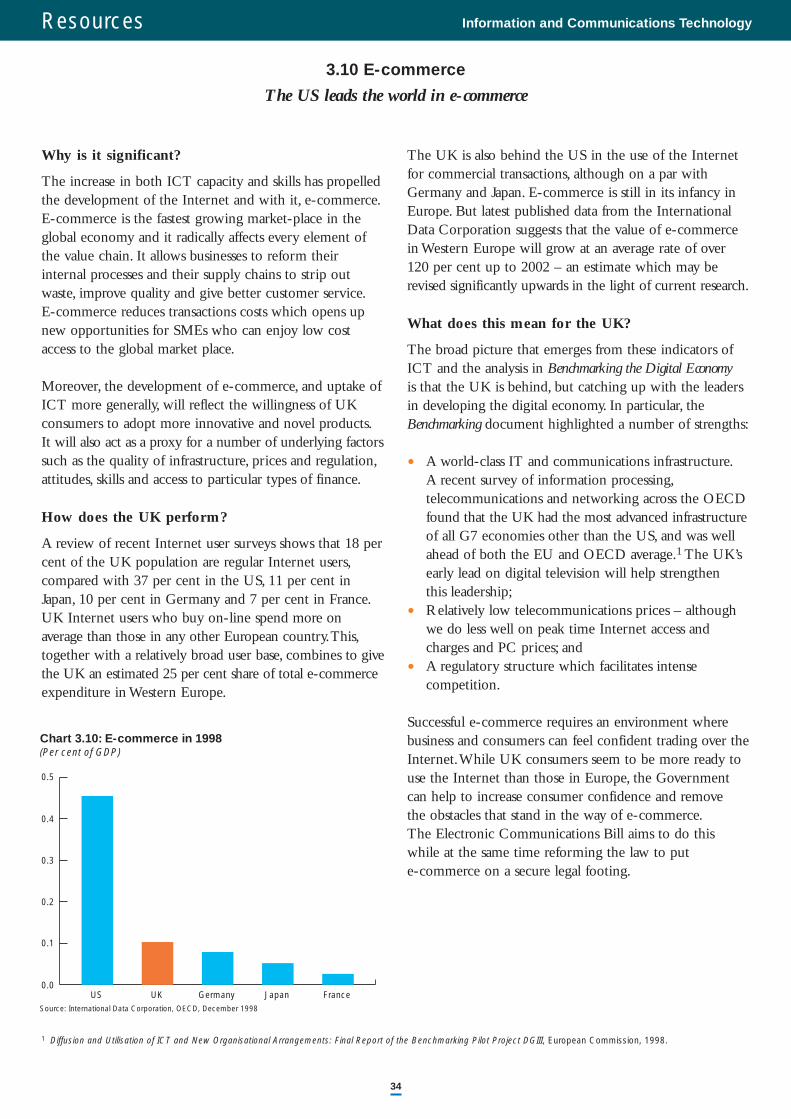
Resources Information and Communications Technology
34
Why is it significant?
The increase in both ICT capacity and skills has propelledthe development of the Internet and with it, e-commerce.E-commerce is the fastest growing market-place in theglobal economy and it radically affects every element ofthe value chain. It allows businesses to reform theirinternal processes and their supply chains to strip outwaste, improve quality and give better customer service.E-commerce reduces transactions costs which opens upnew opportunities for SMEs who can enjoy low costaccess to the global market place.
Moreover, the development of e-commerce, and uptake ofICT more generally, will reflect the willingness of UKconsumers to adopt more innovative and novel products.It will also act as a proxy for a number of underlying factorssuch as the quality of infrastructure, prices and regulation,attitudes, skills and access to particular types of finance.
How does the UK perform?
A review of recent Internet user surveys shows that 18 percent of the UK population are regular Internet users,compared with 37 per cent in the US, 11 per cent inJapan, 10 per cent in Germany and 7 per cent in France.UK Internet users who buy on-line spend more onaverage than those in any other European country.This,together with a relatively broad user base, combines to givethe UK an estimated 25 per cent share of total e-commerceexpenditure in Western Europe.
The UK is also behind the US in the use of the Internetfor commercial transactions, although on a par withGermany and Japan. E-commerce is still in its infancy inEurope. But latest published data from the InternationalData Corporation suggests that the value of e-commercein Western Europe will grow at an average rate of over120 per cent up to 2002 – an estimate which may berevised significantly upwards in the light of current research.
What does this mean for the UK?
The broad picture that emerges from these indicators ofICT and the analysis in Benchmarking the Digital Economyis that the UK is behind, but catching up with the leadersin developing the digital economy. In particular, theBenchmarking document highlighted a number of strengths:
• A world-class IT and communications infrastructure.A recent survey of information processing,telecommunications and networking across the OECDfound that the UK had the most advanced infrastructureof all G7 economies other than the US, and was wellahead of both the EU and OECD average.1 The UK’searly lead on digital television will help strengthen this leadership;
• Relatively low telecommunications prices – althoughwe do less well on peak time Internet access andcharges and PC prices; and
• A regulatory structure which facilitates intensecompetition.
Successful e-commerce requires an environment wherebusiness and consumers can feel confident trading over theInternet.While UK consumers seem to be more ready touse the Internet than those in Europe, the Governmentcan help to increase consumer confidence and remove the obstacles that stand in the way of e-commerce.The Electronic Communications Bill aims to do thiswhile at the same time reforming the law to put e-commerce on a secure legal footing.
3.10 E-commerce
The US leads the world in e-commerce
GermanySource: International Data Corporation, OECD, December 1998
FranceUS UK Japan
Chart 3.10: E-commerce in 1998(Per cent of GDP)
0.0
0.1
0.2
0.3
0.4
0.5
1 Diffusion and Utilisation of ICT and New Organisational Arrangements: Final Report of the Benchmarking Pilot Project DGIII, European Commission, 1998.
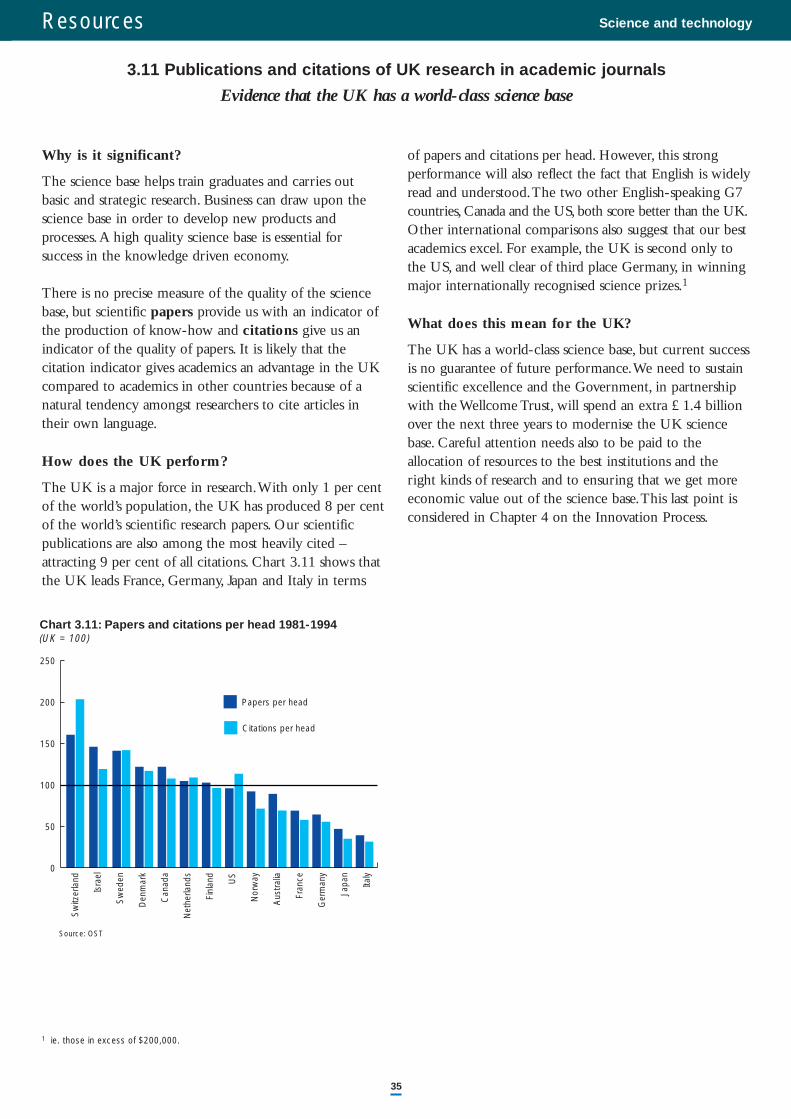
Resources Science and technology
35
Why is it significant?
The science base helps train graduates and carries outbasic and strategic research. Business can draw upon thescience base in order to develop new products andprocesses.A high quality science base is essential for success in the knowledge driven economy.
There is no precise measure of the quality of the sciencebase, but scientific papers provide us with an indicator ofthe production of know-how and citations give us anindicator of the quality of papers. It is likely that the citation indicator gives academics an advantage in the UKcompared to academics in other countries because of anatural tendency amongst researchers to cite articles intheir own language.
How does the UK perform?
The UK is a major force in research.With only 1 per centof the world’s population, the UK has produced 8 per centof the world’s scientific research papers. Our scientificpublications are also among the most heavily cited –attracting 9 per cent of all citations. Chart 3.11 shows thatthe UK leads France, Germany, Japan and Italy in terms
of papers and citations per head. However, this strong performance will also reflect the fact that English is widelyread and understood.The two other English-speaking G7countries, Canada and the US, both score better than the UK.Other international comparisons also suggest that our bestacademics excel. For example, the UK is second only tothe US, and well clear of third place Germany, in winningmajor internationally recognised science prizes.1
What does this mean for the UK?
The UK has a world-class science base, but current successis no guarantee of future performance.We need to sustainscientific excellence and the Government, in partnershipwith the Wellcome Trust, will spend an extra £1.4 billionover the next three years to modernise the UK sciencebase. Careful attention needs also to be paid to the allocation of resources to the best institutions and theright kinds of research and to ensuring that we get moreeconomic value out of the science base.This last point isconsidered in Chapter 4 on the Innovation Process.
3.11 Publications and citations of UK research in academic journals
Evidence that the UK has a world-class science base
0
50
100
150
200
250
Source: OST
Papers per head
Citations per head
Sw
itzer
land
Isra
el
Sw
eden
Den
mar
k
Can
ada
Net
herla
nds
Finl
and
US
Nor
way
Aus
tralia
Fran
ce
Ger
man
y
Japa
n
Italy
Chart 3.11: Papers and citations per head 1981-1994(UK = 100)
1 ie. those in excess of $200,000.
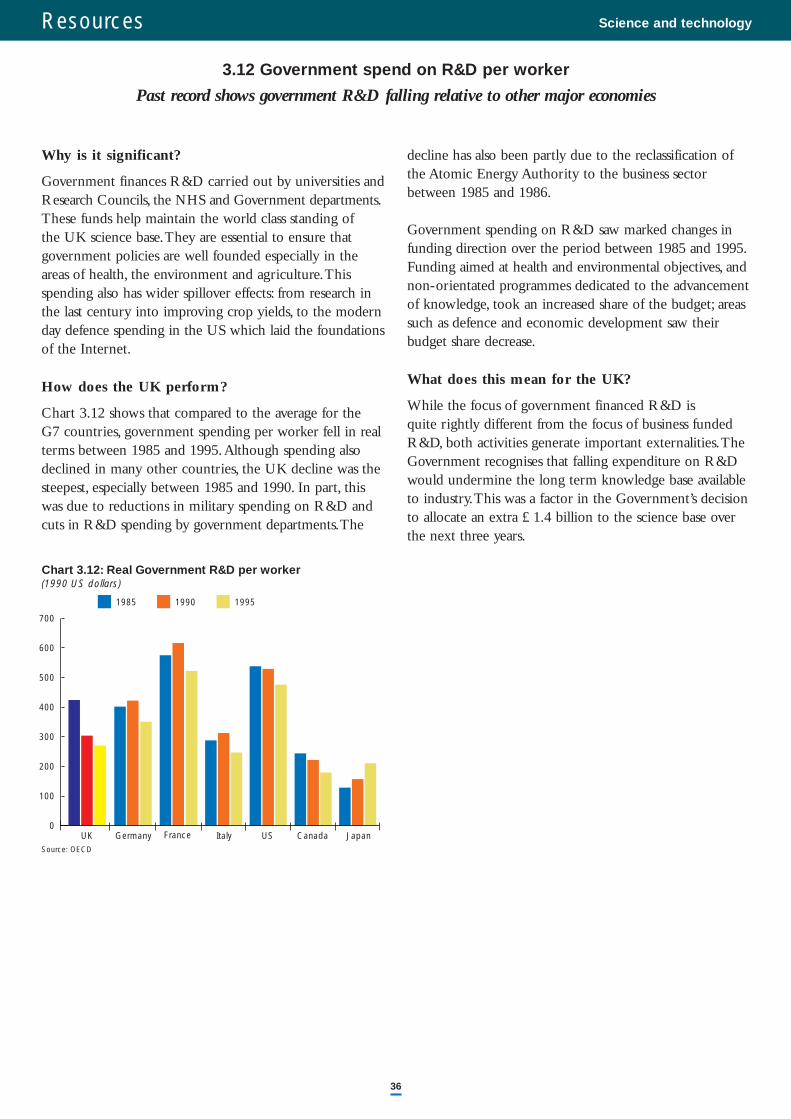
Resources Science and technology
36
Why is it significant?
Government finances R&D carried out by universities andResearch Councils, the NHS and Government departments.These funds help maintain the world class standing of the UK science base.They are essential to ensure that government policies are well founded especially in theareas of health, the environment and agriculture.Thisspending also has wider spillover effects: from research inthe last century into improving crop yields, to the modernday defence spending in the US which laid the foundationsof the Internet.
How does the UK perform?
Chart 3.12 shows that compared to the average for the G7 countries, government spending per worker fell in realterms between 1985 and 1995.Although spending alsodeclined in many other countries, the UK decline was thesteepest, especially between 1985 and 1990. In part, thiswas due to reductions in military spending on R&D andcuts in R&D spending by government departments.The
decline has also been partly due to the reclassification ofthe Atomic Energy Authority to the business sectorbetween 1985 and 1986.
Government spending on R&D saw marked changes infunding direction over the period between 1985 and 1995.Funding aimed at health and environmental objectives, andnon-orientated programmes dedicated to the advancementof knowledge, took an increased share of the budget; areassuch as defence and economic development saw theirbudget share decrease.
What does this mean for the UK?
While the focus of government financed R&D is quite rightly different from the focus of business fundedR&D, both activities generate important externalities.TheGovernment recognises that falling expenditure on R&Dwould undermine the long term knowledge base availableto industry.This was a factor in the Government’s decisionto allocate an extra £1.4 billion to the science base overthe next three years.
3.12 Government spend on R&D per worker
Past record shows government R&D falling relative to other major economies
Source: OECD
UK Germany France Italy US Canada Japan
Chart 3.12: Real Government R&D per worker(1990 US dollars)
1985 1990 1995
0
100
200
300
400
500
600
700
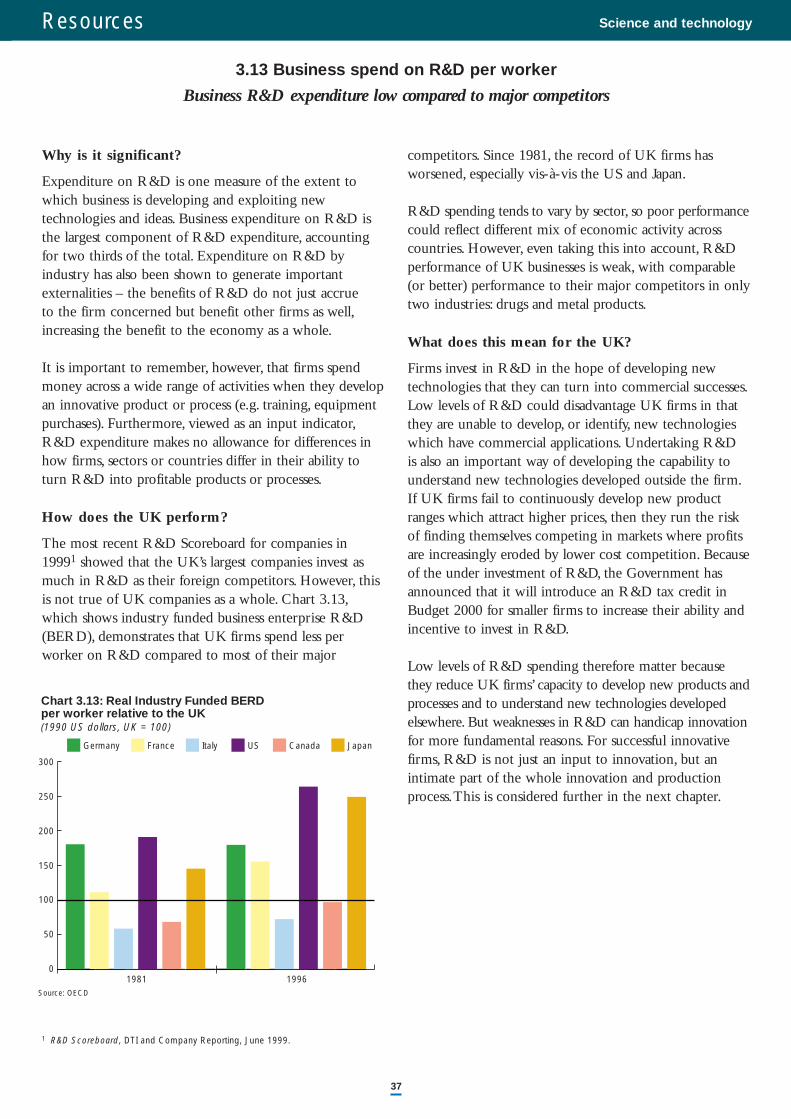
Resources Science and technology
37
Why is it significant?
Expenditure on R&D is one measure of the extent towhich business is developing and exploiting new technologies and ideas. Business expenditure on R&D isthe largest component of R&D expenditure, accountingfor two thirds of the total. Expenditure on R&D byindustry has also been shown to generate important externalities – the benefits of R&D do not just accrue to the firm concerned but benefit other firms as well,increasing the benefit to the economy as a whole.
It is important to remember, however, that firms spendmoney across a wide range of activities when they developan innovative product or process (e.g. training, equipmentpurchases). Furthermore, viewed as an input indicator,R&D expenditure makes no allowance for differences inhow firms, sectors or countries differ in their ability toturn R&D into profitable products or processes.
How does the UK perform?
The most recent R&D Scoreboard for companies in19991 showed that the UK’s largest companies invest asmuch in R&D as their foreign competitors. However, thisis not true of UK companies as a whole. Chart 3.13,which shows industry funded business enterprise R&D(BERD), demonstrates that UK firms spend less perworker on R&D compared to most of their major
competitors. Since 1981, the record of UK firms hasworsened, especially vis-à-vis the US and Japan.
R&D spending tends to vary by sector, so poor performancecould reflect different mix of economic activity acrosscountries. However, even taking this into account, R&Dperformance of UK businesses is weak, with comparable(or better) performance to their major competitors in onlytwo industries: drugs and metal products.
What does this mean for the UK?
Firms invest in R&D in the hope of developing newtechnologies that they can turn into commercial successes.Low levels of R&D could disadvantage UK firms in thatthey are unable to develop, or identify, new technologieswhich have commercial applications. Undertaking R&D is also an important way of developing the capability tounderstand new technologies developed outside the firm.If UK firms fail to continuously develop new productranges which attract higher prices, then they run the riskof finding themselves competing in markets where profitsare increasingly eroded by lower cost competition. Becauseof the under investment of R&D, the Government hasannounced that it will introduce an R&D tax credit inBudget 2000 for smaller firms to increase their ability andincentive to invest in R&D.
Low levels of R&D spending therefore matter becausethey reduce UK firms’ capacity to develop new products andprocesses and to understand new technologies developedelsewhere. But weaknesses in R&D can handicap innovationfor more fundamental reasons. For successful innovativefirms, R&D is not just an input to innovation, but an intimate part of the whole innovation and productionprocess.This is considered further in the next chapter.
3.13 Business spend on R&D per worker
Business R&D expenditure low compared to major competitors
Source: OECD
1981 1996
per worker relative to the UKChart 3.13: Real Industry Funded BERD
(1990 US dollars, UK = 100)
Germany France Italy US Canada Japan
0
50
100
150
200
250
300
1 R&D Scoreboard, DTI and Company Reporting, June 1999.
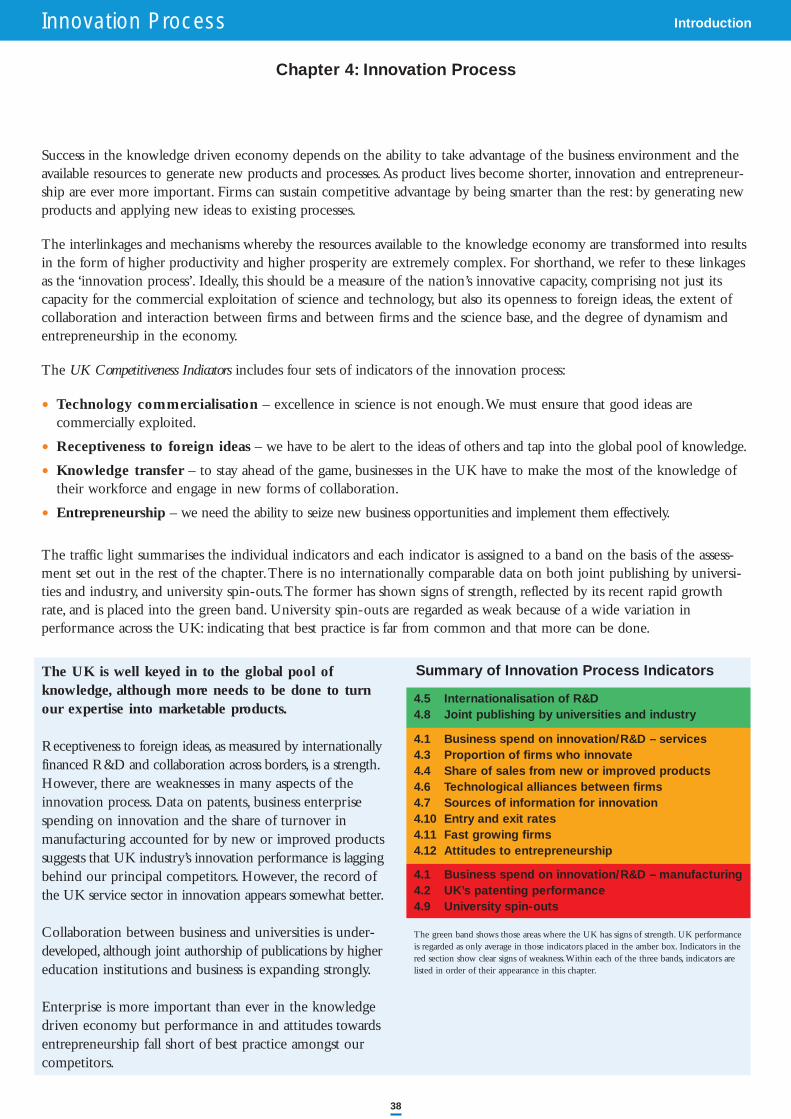
Innovation Process Introduction
38
Chapter 4: Innovation Process
The UK is well keyed in to the global pool ofknowledge, although more needs to be done to turnour expertise into marketable products.
Receptiveness to foreign ideas, as measured by internationallyfinanced R&D and collaboration across borders, is a strength.However, there are weaknesses in many aspects of theinnovation process. Data on patents, business enterprisespending on innovation and the share of turnover inmanufacturing accounted for by new or improved productssuggests that UK industry’s innovation performance is laggingbehind our principal competitors. However, the record ofthe UK service sector in innovation appears somewhat better.
Collaboration between business and universities is under-developed, although joint authorship of publications by highereducation institutions and business is expanding strongly.
Enterprise is more important than ever in the knowledgedriven economy but performance in and attitudes towardsentrepreneurship fall short of best practice amongst ourcompetitors.
Success in the knowledge driven economy depends on the ability to take advantage of the business environment and theavailable resources to generate new products and processes.As product lives become shorter, innovation and entrepreneur-ship are ever more important. Firms can sustain competitive advantage by being smarter than the rest: by generating newproducts and applying new ideas to existing processes.
The interlinkages and mechanisms whereby the resources available to the knowledge economy are transformed into resultsin the form of higher productivity and higher prosperity are extremely complex. For shorthand, we refer to these linkagesas the ‘innovation process’. Ideally, this should be a measure of the nation’s innovative capacity, comprising not just itscapacity for the commercial exploitation of science and technology, but also its openness to foreign ideas, the extent of collaboration and interaction between firms and between firms and the science base, and the degree of dynamism andentrepreneurship in the economy.
The UK Competitiveness Indicators includes four sets of indicators of the innovation process:
• Technology commercialisation – excellence in science is not enough.We must ensure that good ideas are commercially exploited.
• Receptiveness to foreign ideas – we have to be alert to the ideas of others and tap into the global pool of knowledge.
• Knowledge transfer – to stay ahead of the game, businesses in the UK have to make the most of the knowledge oftheir workforce and engage in new forms of collaboration.
• Entrepreneurship – we need the ability to seize new business opportunities and implement them effectively.
The traffic light summarises the individual indicators and each indicator is assigned to a band on the basis of the assess-ment set out in the rest of the chapter.There is no internationally comparable data on both joint publishing by universi-ties and industry, and university spin-outs.The former has shown signs of strength, reflected by its recent rapid growthrate, and is placed into the green band. University spin-outs are regarded as weak because of a wide variation in performance across the UK: indicating that best practice is far from common and that more can be done.
Summary of Innovation Process Indicators
4.5 Internationalisation of R&D4.8 Joint publishing by universities and industry
4.1 Business spend on innovation/R&D – services4.3 Proportion of firms who innovate4.4 Share of sales from new or improved products4.6 Technological alliances between firms4.7 Sources of information for innovation4.10 Entry and exit rates4.11 Fast growing firms4.12 Attitudes to entrepreneurship
4.1 Business spend on innovation/R&D – manufacturing4.2 UK’s patenting performance4.9 University spin-outs
The green band shows those areas where the UK has signs of strength. UK performance is regarded as only average in those indicators placed in the amber box. Indicators in thered section show clear signs of weakness.Within each of the three bands, indicators arelisted in order of their appearance in this chapter.
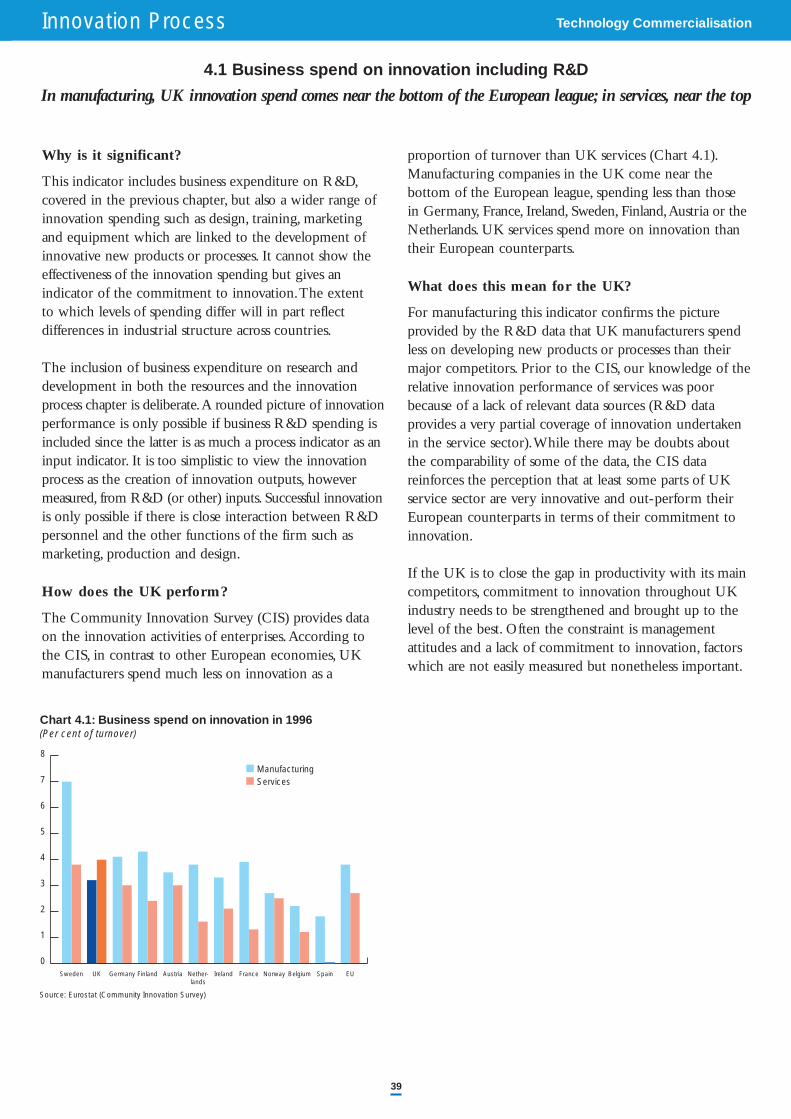
Innovation Process Technology Commercialisation
39
Why is it significant?
This indicator includes business expenditure on R&D,covered in the previous chapter, but also a wider range ofinnovation spending such as design, training, marketingand equipment which are linked to the development ofinnovative new products or processes. It cannot show theeffectiveness of the innovation spending but gives anindicator of the commitment to innovation.The extent to which levels of spending differ will in part reflectdifferences in industrial structure across countries.
The inclusion of business expenditure on research anddevelopment in both the resources and the innovationprocess chapter is deliberate.A rounded picture of innovationperformance is only possible if business R&D spending isincluded since the latter is as much a process indicator as aninput indicator. It is too simplistic to view the innovationprocess as the creation of innovation outputs, howevermeasured, from R&D (or other) inputs. Successful innovationis only possible if there is close interaction between R&Dpersonnel and the other functions of the firm such as marketing, production and design.
How does the UK perform?
The Community Innovation Survey (CIS) provides dataon the innovation activities of enterprises.According tothe CIS, in contrast to other European economies, UKmanufacturers spend much less on innovation as a
proportion of turnover than UK services (Chart 4.1).Manufacturing companies in the UK come near thebottom of the European league, spending less than thosein Germany, France, Ireland, Sweden, Finland,Austria or theNetherlands. UK services spend more on innovation thantheir European counterparts.
What does this mean for the UK?
For manufacturing this indicator confirms the pictureprovided by the R&D data that UK manufacturers spendless on developing new products or processes than theirmajor competitors. Prior to the CIS, our knowledge of therelative innovation performance of services was poorbecause of a lack of relevant data sources (R&D dataprovides a very partial coverage of innovation undertakenin the service sector).While there may be doubts aboutthe comparability of some of the data, the CIS datareinforces the perception that at least some parts of UKservice sector are very innovative and out-perform theirEuropean counterparts in terms of their commitment toinnovation.
If the UK is to close the gap in productivity with its maincompetitors, commitment to innovation throughout UKindustry needs to be strengthened and brought up to thelevel of the best. Often the constraint is management attitudes and a lack of commitment to innovation, factorswhich are not easily measured but nonetheless important.
4.1 Business spend on innovation including R&D
In manufacturing, UK innovation spend comes near the bottom of the European league; in services, near the top
ManufacturingServices
Source: Eurostat (Community Innovation Survey)
Sweden UK Germany Finland Austria Nether-lands
Ireland France Norway Belgium Spain EU
Chart 4.1: Business spend on innovation in 1996(Per cent of turnover)
0
1
2
3
4
5
6
7
8
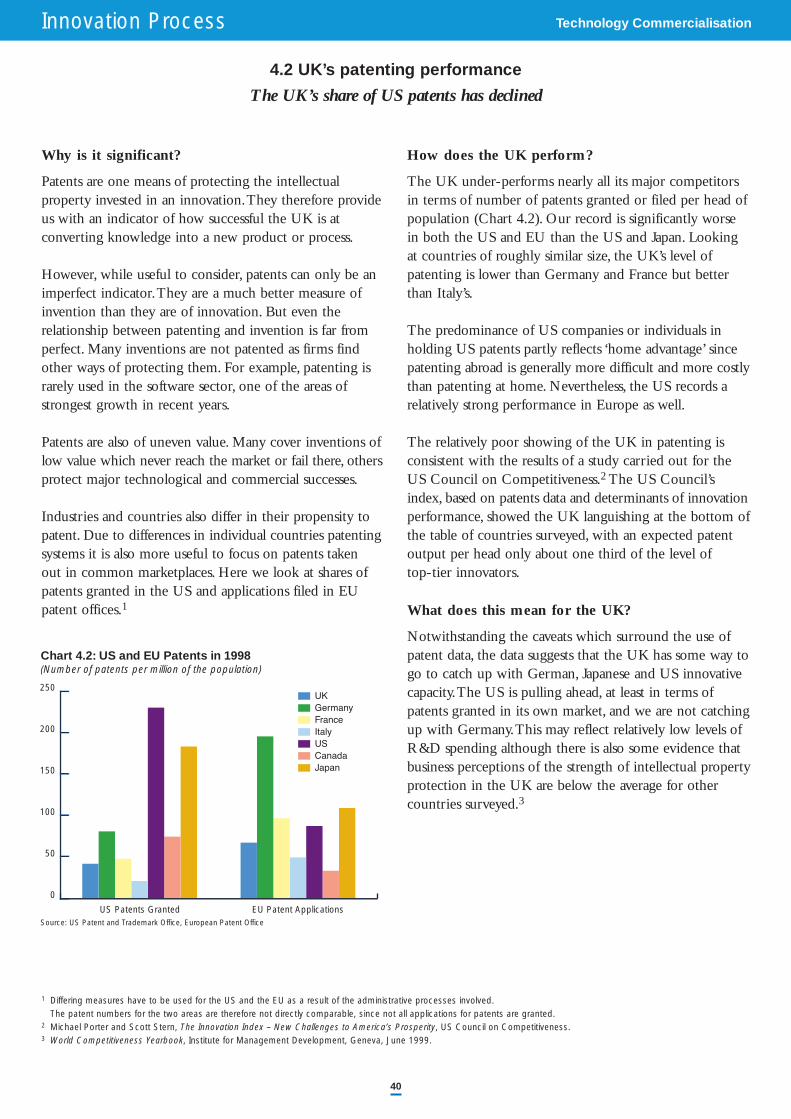
Innovation Process Technology Commercialisation
40
Why is it significant?
Patents are one means of protecting the intellectual property invested in an innovation.They therefore provideus with an indicator of how successful the UK is at converting knowledge into a new product or process.
However, while useful to consider, patents can only be animperfect indicator.They are a much better measure ofinvention than they are of innovation. But even the relationship between patenting and invention is far fromperfect. Many inventions are not patented as firms findother ways of protecting them. For example, patenting is rarely used in the software sector, one of the areas ofstrongest growth in recent years.
Patents are also of uneven value. Many cover inventions oflow value which never reach the market or fail there, othersprotect major technological and commercial successes.
Industries and countries also differ in their propensity topatent. Due to differences in individual countries patentingsystems it is also more useful to focus on patents taken out in common marketplaces. Here we look at shares ofpatents granted in the US and applications filed in EUpatent offices.1
How does the UK perform?
The UK under-performs nearly all its major competitorsin terms of number of patents granted or filed per head ofpopulation (Chart 4.2). Our record is significantly worsein both the US and EU than the US and Japan. Lookingat countries of roughly similar size, the UK’s level ofpatenting is lower than Germany and France but betterthan Italy’s.
The predominance of US companies or individuals inholding US patents partly reflects ‘home advantage’ sincepatenting abroad is generally more difficult and more costlythan patenting at home. Nevertheless, the US records arelatively strong performance in Europe as well.
The relatively poor showing of the UK in patenting isconsistent with the results of a study carried out for theUS Council on Competitiveness.2 The US Council’sindex, based on patents data and determinants of innovationperformance, showed the UK languishing at the bottom ofthe table of countries surveyed, with an expected patentoutput per head only about one third of the level of top-tier innovators.
What does this mean for the UK?
Notwithstanding the caveats which surround the use ofpatent data, the data suggests that the UK has some way togo to catch up with German, Japanese and US innovativecapacity.The US is pulling ahead, at least in terms ofpatents granted in its own market, and we are not catchingup with Germany.This may reflect relatively low levels ofR&D spending although there is also some evidence thatbusiness perceptions of the strength of intellectual propertyprotection in the UK are below the average for othercountries surveyed.3
4.2 UK’s patenting performance
The UK’s share of US patents has declined
Source: US Patent and Trademark Office, European Patent Office
US Patents Granted EU Patent Applications
Chart 4.2: US and EU Patents in 1998(Number of patents per million of the population)
0
50
100
150
200
250
JapanCanadaUSItalyFranceGermanyUK
1 Differing measures have to be used for the US and the EU as a result of the administrative processes involved. The patent numbers for the two areas are therefore not directly comparable, since not all applications for patents are granted.
2 Michael Porter and Scott Stern, The Innovation Index – New Challenges to America’s Prosperity, US Council on Competitiveness.3 World Competitiveness Yearbook, Institute for Management Development, Geneva, June 1999.

Innovation Process Technology Commercialisation
41
Why is it significant?
Survey information from the CIS provides another angleon measuring innovation by asking firms about theirinnovation activities. Firms were asked if they had broughtnew products or processes to market or developed newprocess technologies.
How does the UK perform?
Over half of UK manufacturers described themselves as innovators, which is above the European average.In services, the proportion of firms describing themselvesas innovators was in line with the European average.
An interesting picture emerges that UK manufacturingdoes relatively well in the proportion of enterprises whichinnovate (Chart 4.3) in contrast to its relatively poorperformance in the level of expenditure on new productsor processes (Indicator 4.1). In services, we have an averageshare of innovators even though our service sector has thehighest level of innovation expenditure in Europe.
What does this mean for the UK?
It is clear that many UK enterprises recognise the importanceof innovation since many of them are developing newproducts or processes, both in manufacturing, and to alesser extent, in services.Whether UK manufacturingenterprises invest enough in innovation is a moot point.Part of the shortfall could be due to the industry mix ofthe UK economy, though this is unlikely to explain all thedifference.The strength of German innovation suggestedby the above indicator is confirmed.
The results suggest differences between the service andmanufacturing sectors in terms of the effectiveness of theinnovation process. Compared to the rest of Europe, manymanufacturers describe themselves as innovators despitethe fact that spending on innovation is relatively low.In contrast, service providers spend highly on innovationbut are only average in terms of innovation outputs.
Further research is necessary to understand the reasons forthis difference and whether the manufacturing and servicessectors could learn from each other to improve innovationperformance. One aspect of this is the extent to whichfirms who describe themselves as innovators earn revenuesfrom their new products and processes.A measure of thisis provided in the next section.
4.3 Proportion of firms who innovate
UK manufacturers appear innovative, service sector about average
ManufacturingServices
Source: Eurostat (Community Innovation Survey)
Ireland Austria Ger-many
UK Nether- Luxem-lands bourg
Sweden France Norway Finland Belgium Spain EU
processes to market or develop new process technologies1994-1996
Chart 4.3: Enterprises that bring new products or
(Per cent of enterprises)
0
10
20
30
40
50
60
70
80
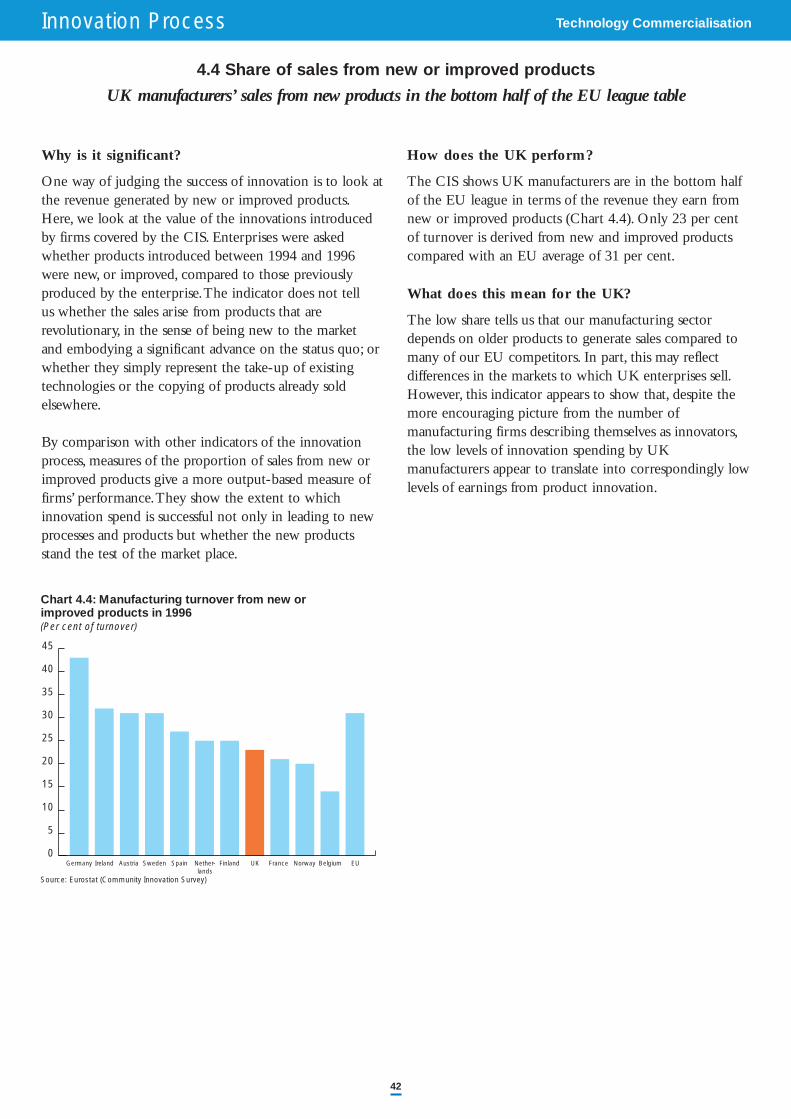
Innovation Process Technology Commercialisation
42
Why is it significant?
One way of judging the success of innovation is to look atthe revenue generated by new or improved products.Here, we look at the value of the innovations introducedby firms covered by the CIS. Enterprises were askedwhether products introduced between 1994 and 1996were new, or improved, compared to those previouslyproduced by the enterprise.The indicator does not tell us whether the sales arise from products that arerevolutionary, in the sense of being new to the market and embodying a significant advance on the status quo; orwhether they simply represent the take-up of existingtechnologies or the copying of products already soldelsewhere.
By comparison with other indicators of the innovationprocess, measures of the proportion of sales from new orimproved products give a more output-based measure offirms’ performance.They show the extent to whichinnovation spend is successful not only in leading to newprocesses and products but whether the new productsstand the test of the market place.
How does the UK perform?
The CIS shows UK manufacturers are in the bottom halfof the EU league in terms of the revenue they earn fromnew or improved products (Chart 4.4). Only 23 per centof turnover is derived from new and improved productscompared with an EU average of 31 per cent.
What does this mean for the UK?
The low share tells us that our manufacturing sectordepends on older products to generate sales compared tomany of our EU competitors. In part, this may reflectdifferences in the markets to which UK enterprises sell.However, this indicator appears to show that, despite themore encouraging picture from the number ofmanufacturing firms describing themselves as innovators,the low levels of innovation spending by UKmanufacturers appear to translate into correspondingly lowlevels of earnings from product innovation.
4.4 Share of sales from new or improved products
UK manufacturers’ sales from new products in the bottom half of the EU league table
Source: Eurostat (Community Innovation Survey)
Germany Ireland Austria Sweden Spain Nether-lands
Finland UK France Norway Belgium EU
Chart 4.4: Manufacturing turnover from new or improved products in 1996(Per cent of turnover)
0
5
10
15
20
25
30
35
40
45
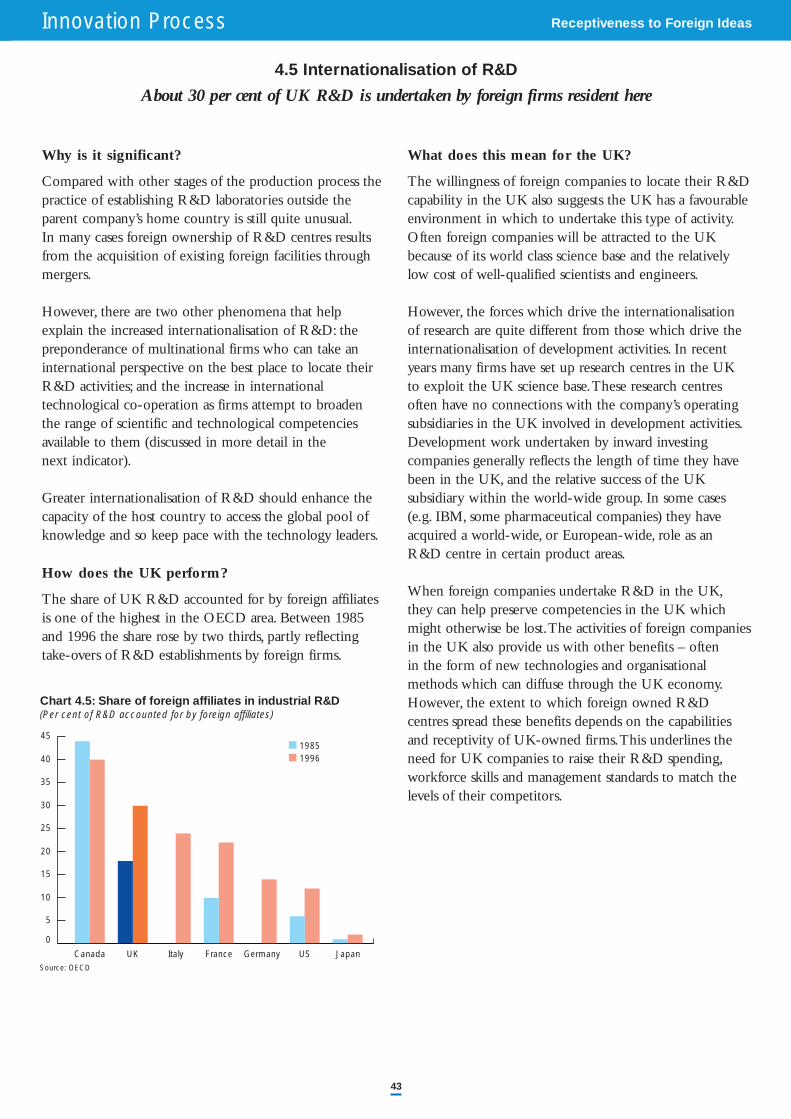
Innovation Process Receptiveness to Foreign Ideas
43
Why is it significant?
Compared with other stages of the production process thepractice of establishing R&D laboratories outside the parent company’s home country is still quite unusual.In many cases foreign ownership of R&D centres resultsfrom the acquisition of existing foreign facilities throughmergers.
However, there are two other phenomena that helpexplain the increased internationalisation of R&D: thepreponderance of multinational firms who can take aninternational perspective on the best place to locate theirR&D activities; and the increase in international technological co-operation as firms attempt to broadenthe range of scientific and technological competenciesavailable to them (discussed in more detail in the next indicator).
Greater internationalisation of R&D should enhance thecapacity of the host country to access the global pool ofknowledge and so keep pace with the technology leaders.
How does the UK perform?
The share of UK R&D accounted for by foreign affiliatesis one of the highest in the OECD area. Between 1985and 1996 the share rose by two thirds, partly reflectingtake-overs of R&D establishments by foreign firms.
What does this mean for the UK?
The willingness of foreign companies to locate their R&Dcapability in the UK also suggests the UK has a favourableenvironment in which to undertake this type of activity.Often foreign companies will be attracted to the UKbecause of its world class science base and the relativelylow cost of well-qualified scientists and engineers.
However, the forces which drive the internationalisationof research are quite different from those which drive theinternationalisation of development activities. In recentyears many firms have set up research centres in the UKto exploit the UK science base.These research centresoften have no connections with the company’s operatingsubsidiaries in the UK involved in development activities.Development work undertaken by inward investing companies generally reflects the length of time they havebeen in the UK, and the relative success of the UKsubsidiary within the world-wide group. In some cases (e.g. IBM, some pharmaceutical companies) they haveacquired a world-wide, or European-wide, role as anR&D centre in certain product areas.
When foreign companies undertake R&D in the UK,they can help preserve competencies in the UK whichmight otherwise be lost.The activities of foreign companiesin the UK also provide us with other benefits – often in the form of new technologies and organisationalmethods which can diffuse through the UK economy.However, the extent to which foreign owned R&Dcentres spread these benefits depends on the capabilitiesand receptivity of UK-owned firms.This underlines theneed for UK companies to raise their R&D spending,workforce skills and management standards to match thelevels of their competitors.
4.5 Internationalisation of R&D
About 30 per cent of UK R&D is undertaken by foreign firms resident here
Source: OECD
Canada UK Italy France Germany US Japan
Chart 4.5: Share of foreign affiliates in industrial R&D(Per cent of R&D accounted for by foreign affiliates)
19851996
0
5
10
15
20
25
30
35
40
45
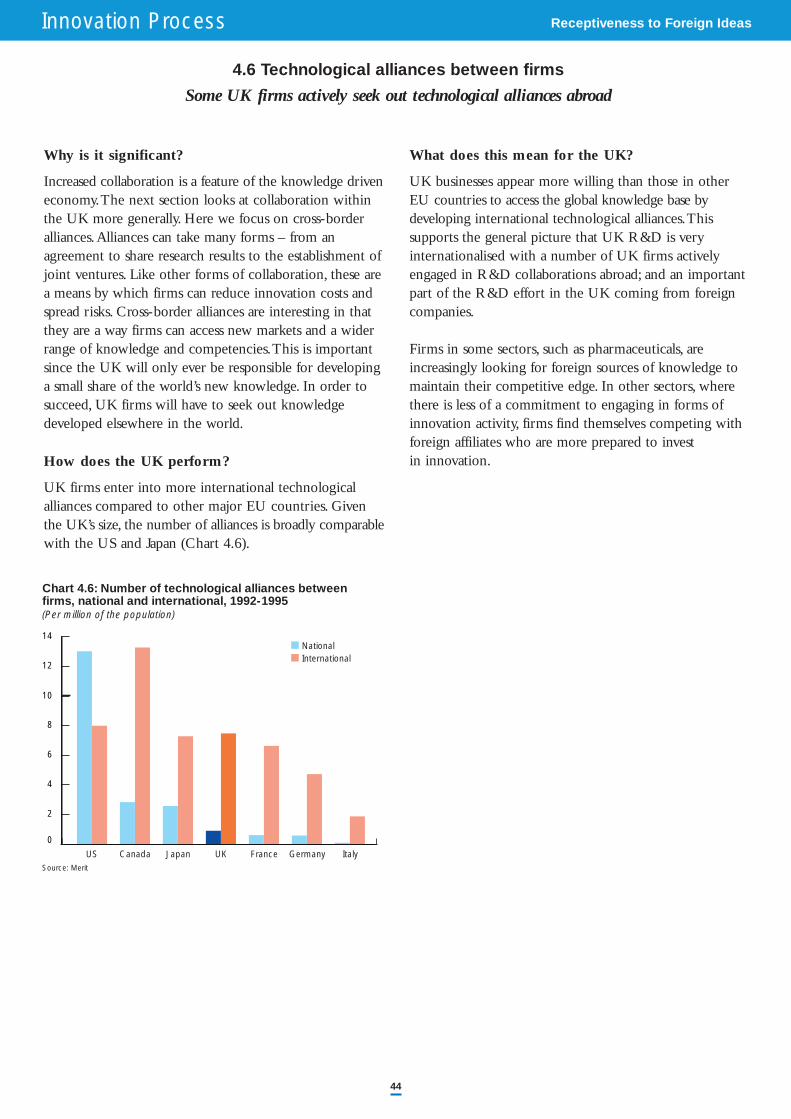
Innovation Process Receptiveness to Foreign Ideas
44
Why is it significant?
Increased collaboration is a feature of the knowledge driveneconomy.The next section looks at collaboration withinthe UK more generally. Here we focus on cross-borderalliances.Alliances can take many forms – from an agreement to share research results to the establishment ofjoint ventures. Like other forms of collaboration, these area means by which firms can reduce innovation costs andspread risks. Cross-border alliances are interesting in thatthey are a way firms can access new markets and a widerrange of knowledge and competencies.This is importantsince the UK will only ever be responsible for developinga small share of the world’s new knowledge. In order tosucceed, UK firms will have to seek out knowledge developed elsewhere in the world.
How does the UK perform?
UK firms enter into more international technologicalalliances compared to other major EU countries. Giventhe UK’s size, the number of alliances is broadly comparablewith the US and Japan (Chart 4.6).
What does this mean for the UK?
UK businesses appear more willing than those in otherEU countries to access the global knowledge base bydeveloping international technological alliances.Thissupports the general picture that UK R&D is veryinternationalised with a number of UK firms activelyengaged in R&D collaborations abroad; and an importantpart of the R&D effort in the UK coming from foreigncompanies.
Firms in some sectors, such as pharmaceuticals, are increasingly looking for foreign sources of knowledge tomaintain their competitive edge. In other sectors, wherethere is less of a commitment to engaging in forms ofinnovation activity, firms find themselves competing withforeign affiliates who are more prepared to invest in innovation.
4.6 Technological alliances between firms
Some UK firms actively seek out technological alliances abroad
Source: Merit
US Canada Japan UK France Germany Italy
Chart 4.6: Number of technological alliances between firms, national and international, 1992-1995(Per million of the population)
NationalInternational
0
2
4
6
8
10
12
14
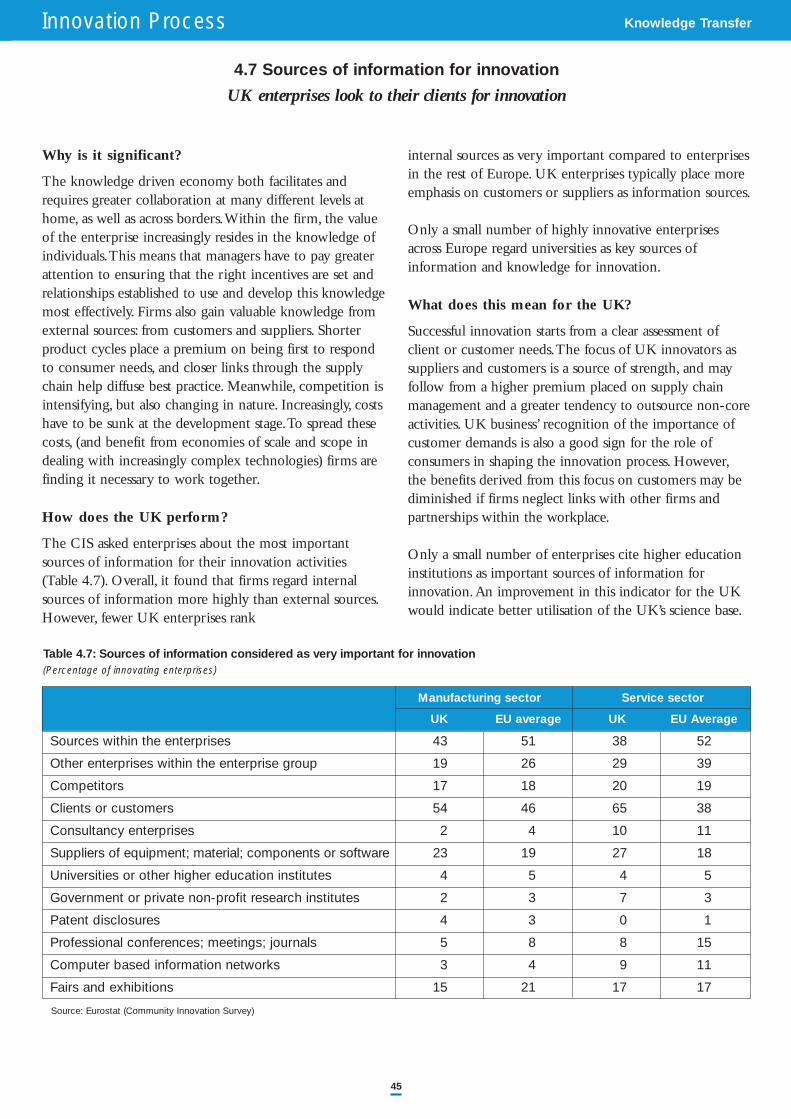
Innovation Process Knowledge Transfer
45
Why is it significant?
The knowledge driven economy both facilitates andrequires greater collaboration at many different levels athome, as well as across borders.Within the firm, the valueof the enterprise increasingly resides in the knowledge ofindividuals.This means that managers have to pay greaterattention to ensuring that the right incentives are set andrelationships established to use and develop this knowledgemost effectively. Firms also gain valuable knowledge fromexternal sources: from customers and suppliers. Shorterproduct cycles place a premium on being first to respondto consumer needs, and closer links through the supplychain help diffuse best practice. Meanwhile, competition isintensifying, but also changing in nature. Increasingly, costshave to be sunk at the development stage.To spread thesecosts, (and benefit from economies of scale and scope indealing with increasingly complex technologies) firms arefinding it necessary to work together.
How does the UK perform?
The CIS asked enterprises about the most importantsources of information for their innovation activities(Table 4.7). Overall, it found that firms regard internalsources of information more highly than external sources.However, fewer UK enterprises rank
internal sources as very important compared to enterprisesin the rest of Europe. UK enterprises typically place moreemphasis on customers or suppliers as information sources.
Only a small number of highly innovative enterprisesacross Europe regard universities as key sources of information and knowledge for innovation.
What does this mean for the UK?
Successful innovation starts from a clear assessment ofclient or customer needs.The focus of UK innovators assuppliers and customers is a source of strength, and mayfollow from a higher premium placed on supply chainmanagement and a greater tendency to outsource non-coreactivities. UK business’ recognition of the importance ofcustomer demands is also a good sign for the role of consumers in shaping the innovation process. However,the benefits derived from this focus on customers may bediminished if firms neglect links with other firms andpartnerships within the workplace.
Only a small number of enterprises cite higher educationinstitutions as important sources of information for innovation.An improvement in this indicator for the UKwould indicate better utilisation of the UK’s science base.
4.7 Sources of information for innovation
UK enterprises look to their clients for innovation
Manufacturing sector Service sector
UK EU average UK EU Average
Sources within the enterprises 43 51 38 52
Other enterprises within the enterprise group 19 26 29 39
Competitors 17 18 20 19
Clients or customers 54 46 65 38
Consultancy enterprises 2 4 10 11
Suppliers of equipment; material; components or software 23 19 27 18
Universities or other higher education institutes 4 5 4 5
Government or private non-profit research institutes 2 3 7 3
Patent disclosures 4 3 0 1
Professional conferences; meetings; journals 5 8 8 15
Computer based information networks 3 4 9 11
Fairs and exhibitions 15 21 17 17
Table 4.7: Sources of information considered as very important for innovation(Percentage of innovating enterprises)
Source: Eurostat (Community Innovation Survey)
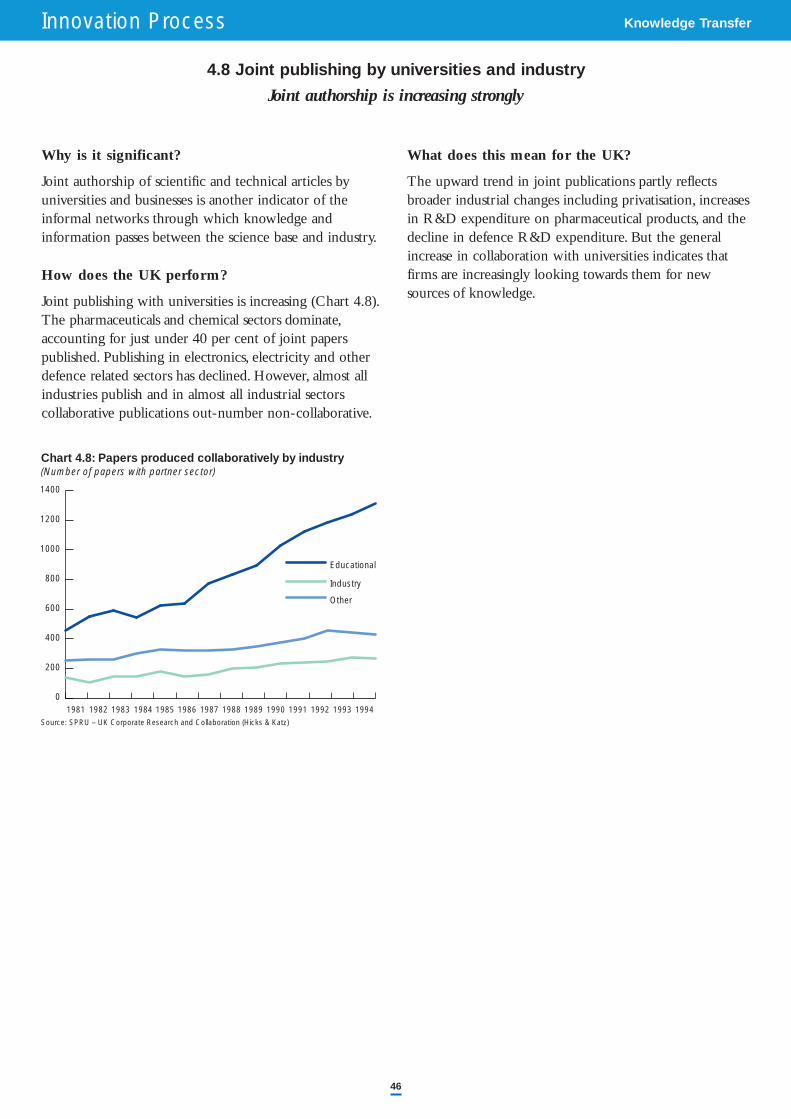
Innovation Process Knowledge Transfer
46
Why is it significant?
Joint authorship of scientific and technical articles by universities and businesses is another indicator of theinformal networks through which knowledge and information passes between the science base and industry.
How does the UK perform?
Joint publishing with universities is increasing (Chart 4.8).The pharmaceuticals and chemical sectors dominate,accounting for just under 40 per cent of joint paperspublished. Publishing in electronics, electricity and otherdefence related sectors has declined. However, almost allindustries publish and in almost all industrial sectorscollaborative publications out-number non-collaborative.
What does this mean for the UK?
The upward trend in joint publications partly reflectsbroader industrial changes including privatisation, increasesin R&D expenditure on pharmaceutical products, and thedecline in defence R&D expenditure. But the generalincrease in collaboration with universities indicates thatfirms are increasingly looking towards them for newsources of knowledge.
4.8 Joint publishing by universities and industry
Joint authorship is increasing strongly
Source: SPRU – UK Corporate Research and Collaboration (Hicks & Katz)
Chart 4.8: Papers produced collaboratively by industry(Number of papers with partner sector)
0
200
400
600
800
1000
1200
1400
Other
Industry
Educational
19941993199219911990198919881987198619851984198319821981
Innovation Process Knowledge Transfer
47
Why is it significant?
The 1998 Competitiveness White Paper noted that mostdynamic economies have creative partnerships betweenstrong universities and business. One form of partnershipis the creation of spin-out companies set up for the commercial exploitation of university research.
How does the UK perform?
A survey for the Office of Science and Technology found223 business spin-outs from UK higher educationinstitutions in 1997-1998.This survey only covers those spin-outs wholly owned by the universities.It ignores those businesses owned by former academicsusing ideas generated in universities, in which theuniversity does not have a stake.
However, performance is not uniform.The performanceof university technology licensing offices, which encourageinterchange and collaboration between universities andbusiness, suggests that there is significant variation aroundthe country.
What does this mean for the UK?
Given the lack of comparative data, it is difficult to sayhow well the UK is commercialising its knowledge.However, the fact that there are differences between institutions regarding the extent of spin-outs suggests thatthe UK is not making the most of the commercial potentialof its world-class academic research. Universities and businesses can learn from the experience of those highereducation institutions with strong track records in commercial exploitation, and the Government has set itself a target of securing a 50 per cent increase in thenumber of spin-outs by 2001.
Another symptom of greater university-business links isthe emergence of industrial clusters based around universities.While clusters are not systematically measured in the UK,there are some good examples in Cambridge, Oxford,Warwick and Guildford. Since clusters are importantsources of innovation, the Government is planning todevelop methods to improve their identificationand measurement.
4.9 University spin-outs
Target to increase spin-outs by 50 per cent by 2001

Innovation Process Entrepreneurship
48
Why is it significant?
The OECD defines entrepreneurship as ‘the ability toseize new business opportunities’.1 New ideas are the raw material of the knowledge driven economy.Entrepreneurship describes the part of the innovationprocess that actually brings new ideas to market.
In common with other aspects of the innovation process,entrepreneurship is difficult to quantify. Here we look atseveral proxy indicators that can be used to draw lessonsabout the strength of entrepreneurship in the UK.
The first of these is entry and exit rates amongst smallfirms. One way to exploit a new business opportunity isby starting a new firm.We look at the numbers of registrations and de-registrations for VAT.Together theseprovide some indication of the overall competitivedynamism of the economy.2
Internationally and across the UK, a high entry rate tendsto go hand in hand with a high exit rate, as resources arequickly re-allocated to those most able to exploit them.Ultimately we are interested in promoting high qualitystart ups that are capable of surviving in the market place,but it is very difficult to identify these systematicallybeforehand.
How does the UK perform?
It is difficult to draw conclusions from the data onregistrations and de-registrations. Both tend to vary withthe cycle.The data for more recent years (1992 onwardsand 1994 onwards) are also affected by increases in theVAT threshold (Chart 4.10).
International comparisons of entry and exit rates are alsoproblematic. Nevertheless, the broad picture emergingfrom a range of indicators is that the US is out in front,with the UK having at least as high entry and exit rates asanywhere in Europe. However, the UK’s comparativelygood performance is driven primarily by the relativelyhigh incidence of self employment in this country.Looking at entry and exit rates of firms with employees,which are more likely to be firms with growth aspirationsrather than having been set up for lifestyle reasons, appearsto bring the UK’s position down into the EU pack.
What does this mean for the UK?
A more stable macroeconomic environment will give people the confidence to establish themselves in businessand take on their first employee. In future, this should bereflected in trends for registrations.
The international comparisons seem to confirm that taking on the first employee is a less attractive prospectthan in the US and a key growth hurdle in the UK andprobably across Europe as a whole.
4.10 Entry and exit rates
Economy less dynamic than the US
Source: DTI
1980 1981 1982 1983 1984 1985 1986 1987 1988 1989 1990 1991 1992 1993 1994 1995 1996 1997 1998
de-registering for VAT in the UK, 1980-98Chart 4.10: Number of enterprises registering and
(Per 10,000 resident adults)
registrationsde-registrations
0
10
20
30
40
50
60
1 OECD, Fostering Entrepreneurship: A Thematic Review (1998).2 There are difficulties in identifying which of these registrations and de-registrations are genuine new starts and closures.
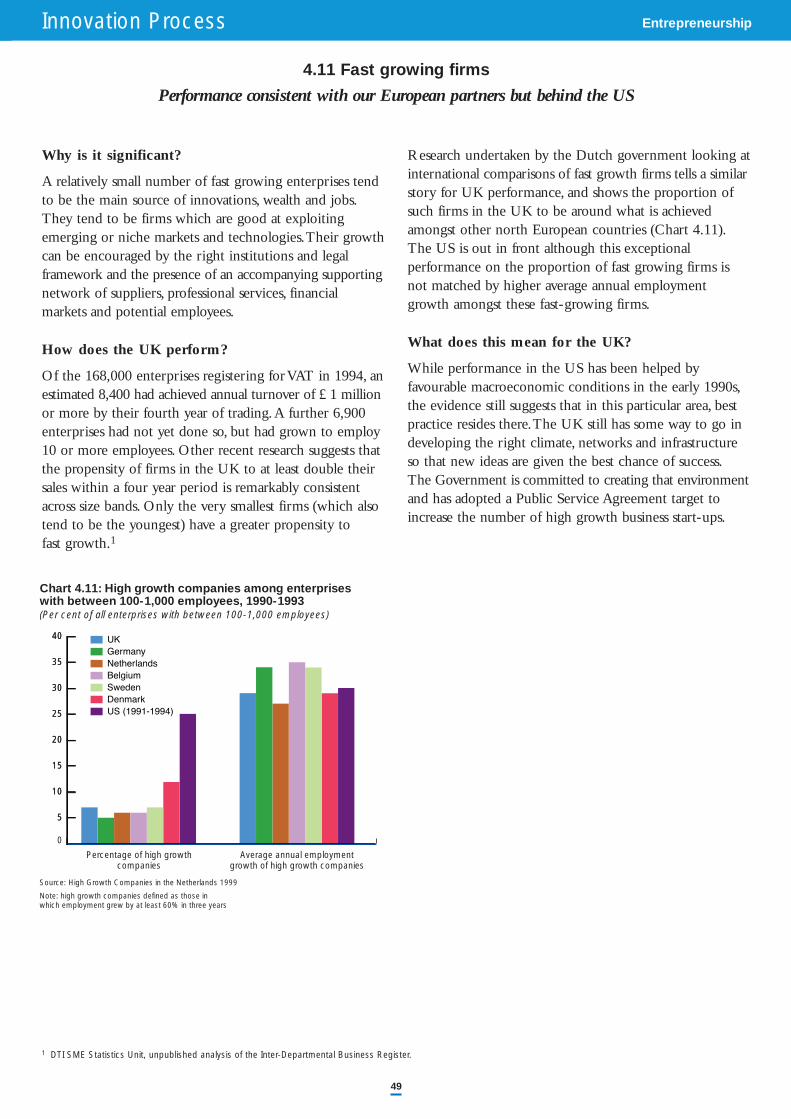
Innovation Process Entrepreneurship
49
Why is it significant?
A relatively small number of fast growing enterprises tendto be the main source of innovations, wealth and jobs.They tend to be firms which are good at exploitingemerging or niche markets and technologies.Their growthcan be encouraged by the right institutions and legalframework and the presence of an accompanying supportingnetwork of suppliers, professional services, financial markets and potential employees.
How does the UK perform?
Of the 168,000 enterprises registering for VAT in 1994, anestimated 8,400 had achieved annual turnover of £1 millionor more by their fourth year of trading.A further 6,900enterprises had not yet done so, but had grown to employ10 or more employees. Other recent research suggests thatthe propensity of firms in the UK to at least double theirsales within a four year period is remarkably consistentacross size bands. Only the very smallest firms (which alsotend to be the youngest) have a greater propensity to fast growth.1
Research undertaken by the Dutch government looking atinternational comparisons of fast growth firms tells a similarstory for UK performance, and shows the proportion ofsuch firms in the UK to be around what is achievedamongst other north European countries (Chart 4.11).The US is out in front although this exceptionalperformance on the proportion of fast growing firms isnot matched by higher average annual employmentgrowth amongst these fast-growing firms.
What does this mean for the UK?
While performance in the US has been helped byfavourable macroeconomic conditions in the early 1990s,the evidence still suggests that in this particular area, bestpractice resides there.The UK still has some way to go indeveloping the right climate, networks and infrastructureso that new ideas are given the best chance of success.The Government is committed to creating that environmentand has adopted a Public Service Agreement target toincrease the number of high growth business start-ups.
4.11 Fast growing firms
Performance consistent with our European partners but behind the US
Source: High Growth Companies in the Netherlands 1999
Note: high growth companies defined as those inwhich employment grew by at least 60% in three years
Percentage of high growth Average annual employmentcompanies growth of high growth companies
with between 100-1,000 employees, 1990-1993Chart 4.11: High growth companies among enterprises
(Per cent of all enterprises with between 100-1,000 employees)
US (1991-1994)DenmarkSwedenBelgiumNetherlandsGermanyUK
5
10
15
20
25
30
35
40
0
5
10
15
20
25
30
35
40
1 DTI SME Statistics Unit, unpublished analysis of the Inter-Departmental Business Register.
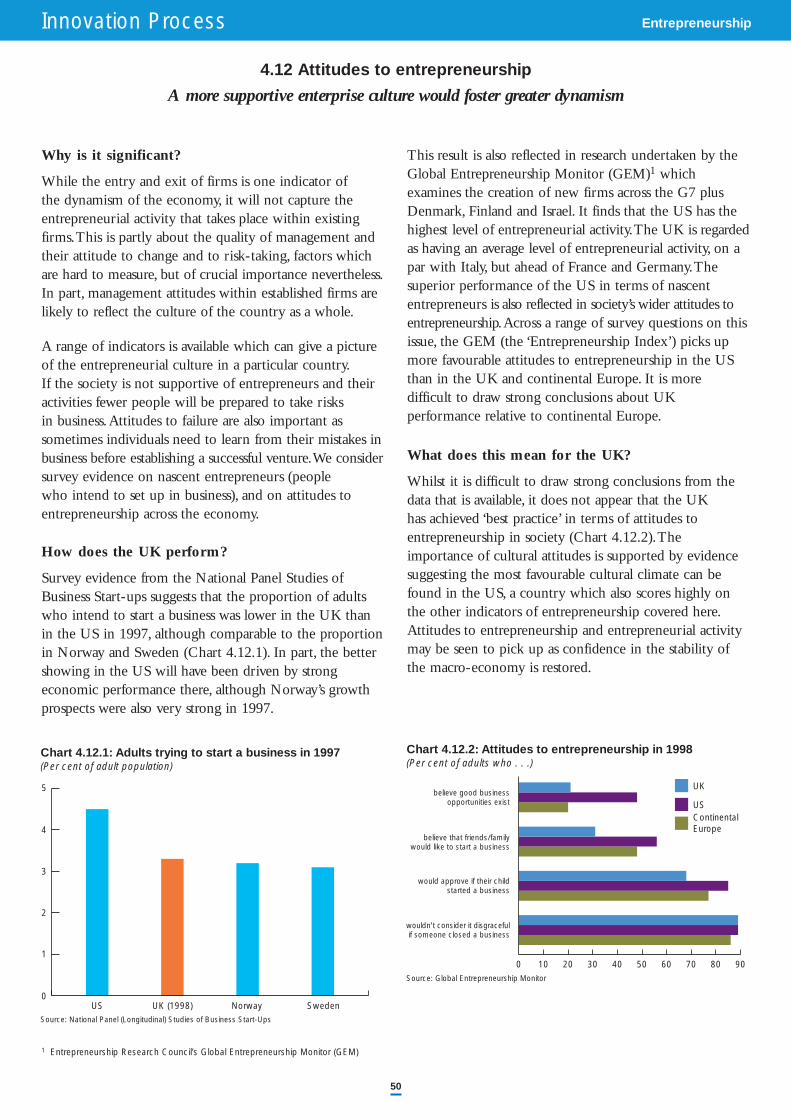
Innovation Process Entrepreneurship
50
Why is it significant?
While the entry and exit of firms is one indicator of the dynamism of the economy, it will not capture theentrepreneurial activity that takes place within existingfirms.This is partly about the quality of management andtheir attitude to change and to risk-taking, factors whichare hard to measure, but of crucial importance nevertheless.In part, management attitudes within established firms arelikely to reflect the culture of the country as a whole.
A range of indicators is available which can give a pictureof the entrepreneurial culture in a particular country.If the society is not supportive of entrepreneurs and theiractivities fewer people will be prepared to take risks in business.Attitudes to failure are also important as sometimes individuals need to learn from their mistakes inbusiness before establishing a successful venture.We considersurvey evidence on nascent entrepreneurs (people who intend to set up in business), and on attitudes toentrepreneurship across the economy.
How does the UK perform?
Survey evidence from the National Panel Studies ofBusiness Start-ups suggests that the proportion of adultswho intend to start a business was lower in the UK thanin the US in 1997, although comparable to the proportionin Norway and Sweden (Chart 4.12.1). In part, the bettershowing in the US will have been driven by strongeconomic performance there, although Norway’s growthprospects were also very strong in 1997.
This result is also reflected in research undertaken by theGlobal Entrepreneurship Monitor (GEM)1 whichexamines the creation of new firms across the G7 plusDenmark, Finland and Israel. It finds that the US has thehighest level of entrepreneurial activity.The UK is regardedas having an average level of entrepreneurial activity, on apar with Italy, but ahead of France and Germany.Thesuperior performance of the US in terms of nascententrepreneurs is also reflected in society’s wider attitudes toentrepreneurship.Across a range of survey questions on thisissue, the GEM (the ‘Entrepreneurship Index’) picks upmore favourable attitudes to entrepreneurship in the USthan in the UK and continental Europe. It is moredifficult to draw strong conclusions about UKperformance relative to continental Europe.
What does this mean for the UK?
Whilst it is difficult to draw strong conclusions from thedata that is available, it does not appear that the UK has achieved ‘best practice’ in terms of attitudes to entrepreneurship in society (Chart 4.12.2).Theimportance of cultural attitudes is supported by evidencesuggesting the most favourable cultural climate can befound in the US, a country which also scores highly onthe other indicators of entrepreneurship covered here.Attitudes to entrepreneurship and entrepreneurial activitymay be seen to pick up as confidence in the stability ofthe macro-economy is restored.
4.12 Attitudes to entrepreneurship
A more supportive enterprise culture would foster greater dynamism
NorwaySource: National Panel (Longitudinal) Studies of Business Start-Ups
US UK (1998) Sweden
Chart 4.12.1: Adults trying to start a business in 1997(Per cent of adult population)
0
1
2
3
4
5
Source: Global Entrepreneurship Monitor
Chart 4.12.2: Attitudes to entrepreneurship in 1998(Per cent of adults who . . .)
UK
USContinental Europe
0 10 20 30 40 50 60 70 80 90
believe good businessopportunities exist
believe that friends/family would like to start a business
would approve if their childstarted a business
wouldn't consider it disgraceful if someone closed a business
1 Entrepreneurship Research Council’s Global Entrepreneurship Monitor (GEM)
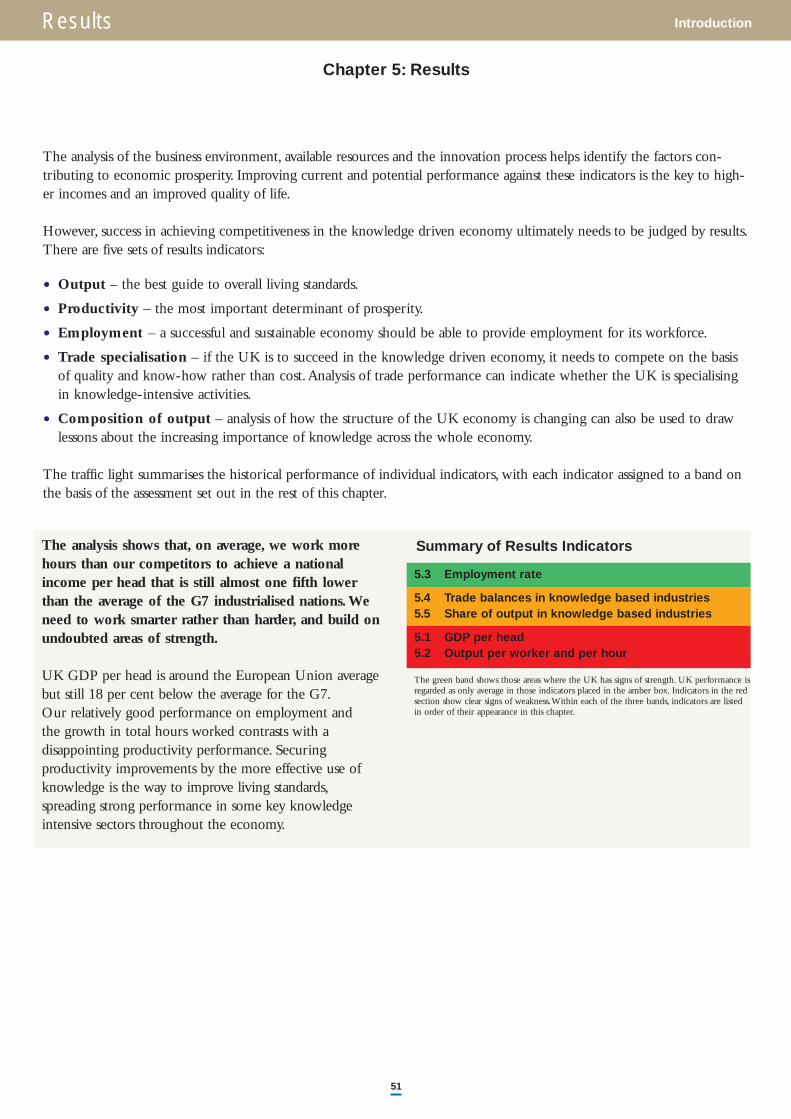
Results Introduction
51
Chapter 5: Results
The analysis shows that, on average, we work morehours than our competitors to achieve a nationalincome per head that is still almost one fifth lowerthan the average of the G7 industrialised nations.Weneed to work smarter rather than harder, and build onundoubted areas of strength.
UK GDP per head is around the European Union averagebut still 18 per cent below the average for the G7.Our relatively good performance on employment and the growth in total hours worked contrasts with adisappointing productivity performance. Securingproductivity improvements by the more effective use ofknowledge is the way to improve living standards,spreading strong performance in some key knowledgeintensive sectors throughout the economy.
The analysis of the business environment, available resources and the innovation process helps identify the factors con-tributing to economic prosperity. Improving current and potential performance against these indicators is the key to high-er incomes and an improved quality of life.
However, success in achieving competitiveness in the knowledge driven economy ultimately needs to be judged by results.There are five sets of results indicators:
• Output – the best guide to overall living standards.
• Productivity – the most important determinant of prosperity.
• Employment – a successful and sustainable economy should be able to provide employment for its workforce.
• Trade specialisation – if the UK is to succeed in the knowledge driven economy, it needs to compete on the basisof quality and know-how rather than cost.Analysis of trade performance can indicate whether the UK is specialisingin knowledge-intensive activities.
• Composition of output – analysis of how the structure of the UK economy is changing can also be used to drawlessons about the increasing importance of knowledge across the whole economy.
The traffic light summarises the historical performance of individual indicators, with each indicator assigned to a band onthe basis of the assessment set out in the rest of this chapter.
Summary of Results Indicators
5.3 Employment rate
5.4 Trade balances in knowledge based industries5.5 Share of output in knowledge based industries
5.1 GDP per head5.2 Output per worker and per hour
The green band shows those areas where the UK has signs of strength. UK performance isregarded as only average in those indicators placed in the amber box. Indicators in the redsection show clear signs of weakness.Within each of the three bands, indicators are listedin order of their appearance in this chapter.
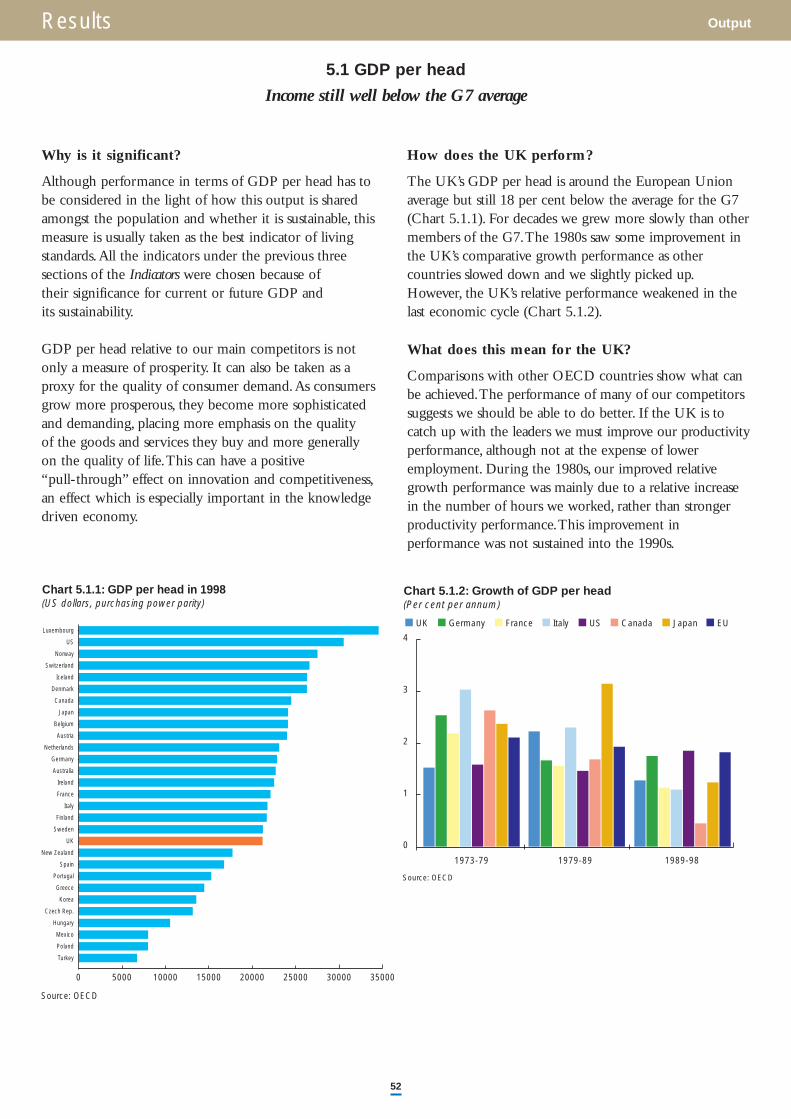
Results Output
52
Why is it significant?
Although performance in terms of GDP per head has tobe considered in the light of how this output is sharedamongst the population and whether it is sustainable, thismeasure is usually taken as the best indicator of livingstandards.All the indicators under the previous threesections of the Indicators were chosen because of their significance for current or future GDP and its sustainability.
GDP per head relative to our main competitors is notonly a measure of prosperity. It can also be taken as aproxy for the quality of consumer demand.As consumersgrow more prosperous, they become more sophisticatedand demanding, placing more emphasis on the quality of the goods and services they buy and more generally on the quality of life.This can have a positive “pull-through” effect on innovation and competitiveness,an effect which is especially important in the knowledgedriven economy.
How does the UK perform?
The UK’s GDP per head is around the European Unionaverage but still 18 per cent below the average for the G7(Chart 5.1.1). For decades we grew more slowly than othermembers of the G7.The 1980s saw some improvement inthe UK’s comparative growth performance as othercountries slowed down and we slightly picked up.However, the UK’s relative performance weakened in thelast economic cycle (Chart 5.1.2).
What does this mean for the UK?
Comparisons with other OECD countries show what canbe achieved.The performance of many of our competitorssuggests we should be able to do better. If the UK is tocatch up with the leaders we must improve our productivityperformance, although not at the expense of loweremployment. During the 1980s, our improved relativegrowth performance was mainly due to a relative increasein the number of hours we worked, rather than strongerproductivity performance.This improvement inperformance was not sustained into the 1990s.
5.1 GDP per head
Income still well below the G7 average
0 5000 10000 15000 20000 25000 30000 35000
Turkey
Poland
Mexico
Hungary
Czech Rep.
Korea
Greece
Portugal
Spain
New Zealand
UK
Sweden
Finland
Italy
France
Ireland
Australia
Germany
Netherlands
Austria
Belgium
Japan
Canada
Denmark
Iceland
Switzerland
Norway
US
Luxembourg
Chart 5.1.1: GDP per head in 1998(US dollars, purchasing power parity)
Source: OECD
Source: OECD
1973-79 1979-89 1989-98
Chart 5.1.2: Growth of GDP per head(Per cent per annum)
Germany France Italy USUK Canada Japan EU
0
1
2
3
4
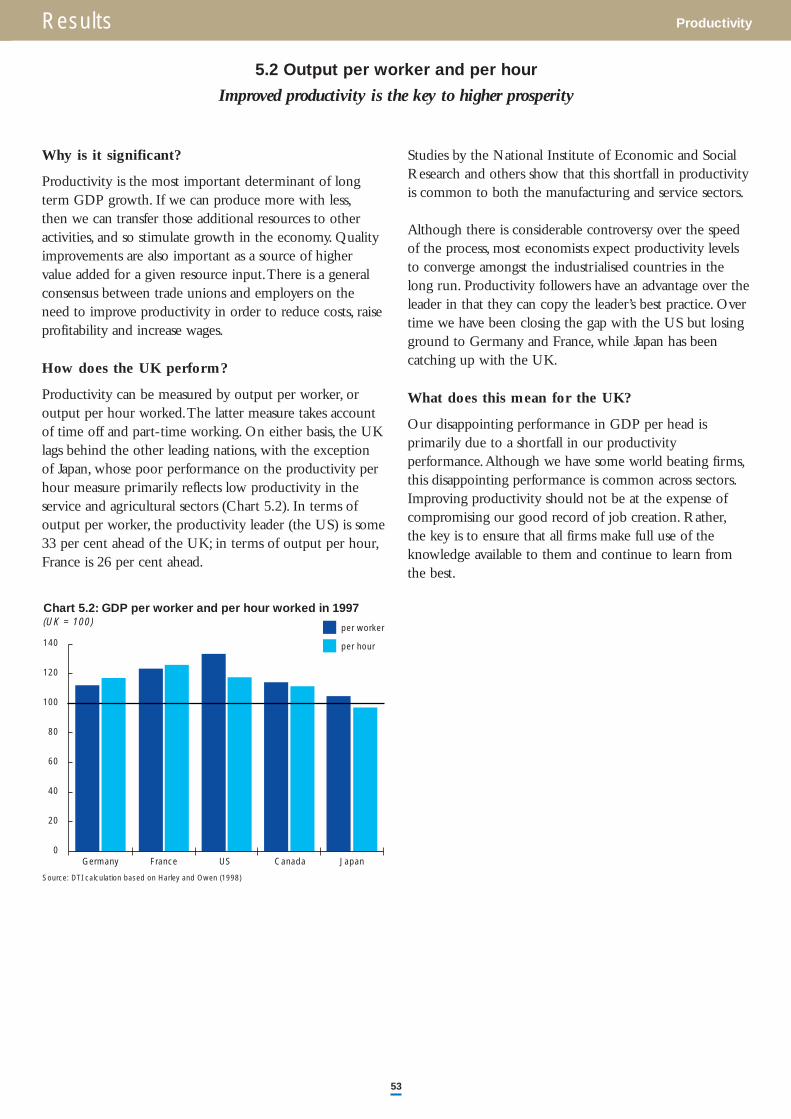
Results Productivity
53
Why is it significant?
Productivity is the most important determinant of longterm GDP growth. If we can produce more with less,then we can transfer those additional resources to otheractivities, and so stimulate growth in the economy. Qualityimprovements are also important as a source of highervalue added for a given resource input.There is a generalconsensus between trade unions and employers on theneed to improve productivity in order to reduce costs, raiseprofitability and increase wages.
How does the UK perform?
Productivity can be measured by output per worker, oroutput per hour worked.The latter measure takes accountof time off and part-time working. On either basis, the UKlags behind the other leading nations, with the exceptionof Japan, whose poor performance on the productivity perhour measure primarily reflects low productivity in theservice and agricultural sectors (Chart 5.2). In terms ofoutput per worker, the productivity leader (the US) is some33 per cent ahead of the UK; in terms of output per hour,France is 26 per cent ahead.
Studies by the National Institute of Economic and SocialResearch and others show that this shortfall in productivityis common to both the manufacturing and service sectors.
Although there is considerable controversy over the speedof the process, most economists expect productivity levelsto converge amongst the industrialised countries in thelong run. Productivity followers have an advantage over theleader in that they can copy the leader’s best practice. Overtime we have been closing the gap with the US but losingground to Germany and France, while Japan has beencatching up with the UK.
What does this mean for the UK?
Our disappointing performance in GDP per head isprimarily due to a shortfall in our productivityperformance.Although we have some world beating firms,this disappointing performance is common across sectors.Improving productivity should not be at the expense ofcompromising our good record of job creation. Rather,the key is to ensure that all firms make full use of theknowledge available to them and continue to learn fromthe best.
5.2 Output per worker and per hour
Improved productivity is the key to higher prosperity
0
20
40
60
80
100
120
140
Germany
Source: DTI calculation based on Harley and Owen (1998)
France US Canada Japan
Chart 5.2: GDP per worker and per hour worked in 1997(UK = 100)
per worker
per hour
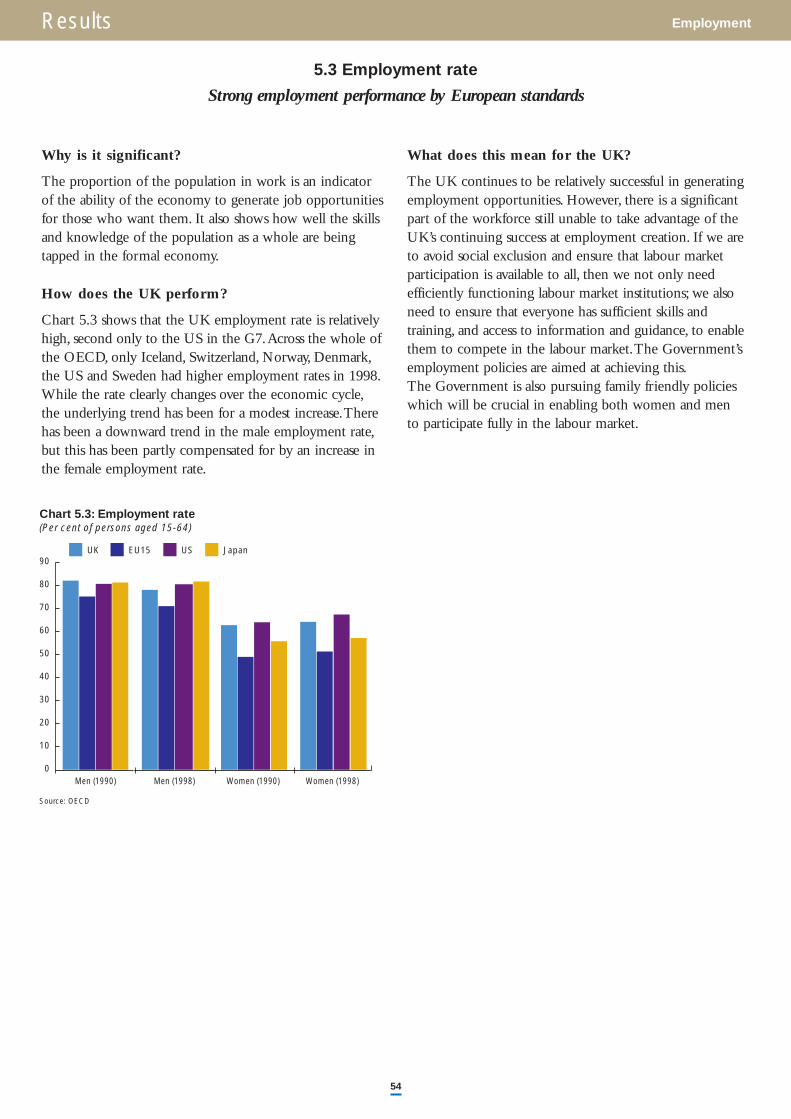
Results Employment
54
Why is it significant?
The proportion of the population in work is an indicatorof the ability of the economy to generate job opportunitiesfor those who want them. It also shows how well the skillsand knowledge of the population as a whole are beingtapped in the formal economy.
How does the UK perform?
Chart 5.3 shows that the UK employment rate is relativelyhigh, second only to the US in the G7.Across the whole ofthe OECD, only Iceland, Switzerland, Norway, Denmark,the US and Sweden had higher employment rates in 1998.While the rate clearly changes over the economic cycle,the underlying trend has been for a modest increase.Therehas been a downward trend in the male employment rate,but this has been partly compensated for by an increase inthe female employment rate.
What does this mean for the UK?
The UK continues to be relatively successful in generatingemployment opportunities. However, there is a significantpart of the workforce still unable to take advantage of theUK’s continuing success at employment creation. If we areto avoid social exclusion and ensure that labour marketparticipation is available to all, then we not only needefficiently functioning labour market institutions; we alsoneed to ensure that everyone has sufficient skills andtraining, and access to information and guidance, to enablethem to compete in the labour market.The Government’semployment policies are aimed at achieving this.The Government is also pursuing family friendly policieswhich will be crucial in enabling both women and men to participate fully in the labour market.
5.3 Employment rate
Strong employment performance by European standards
Source: OECD
Chart 5.3: Employment rate(Per cent of persons aged 15-64)
UK EU15 US Japan
0
10
20
30
40
50
60
70
80
90
Women (1998)Women (1990)Men (1998)Men (1990)
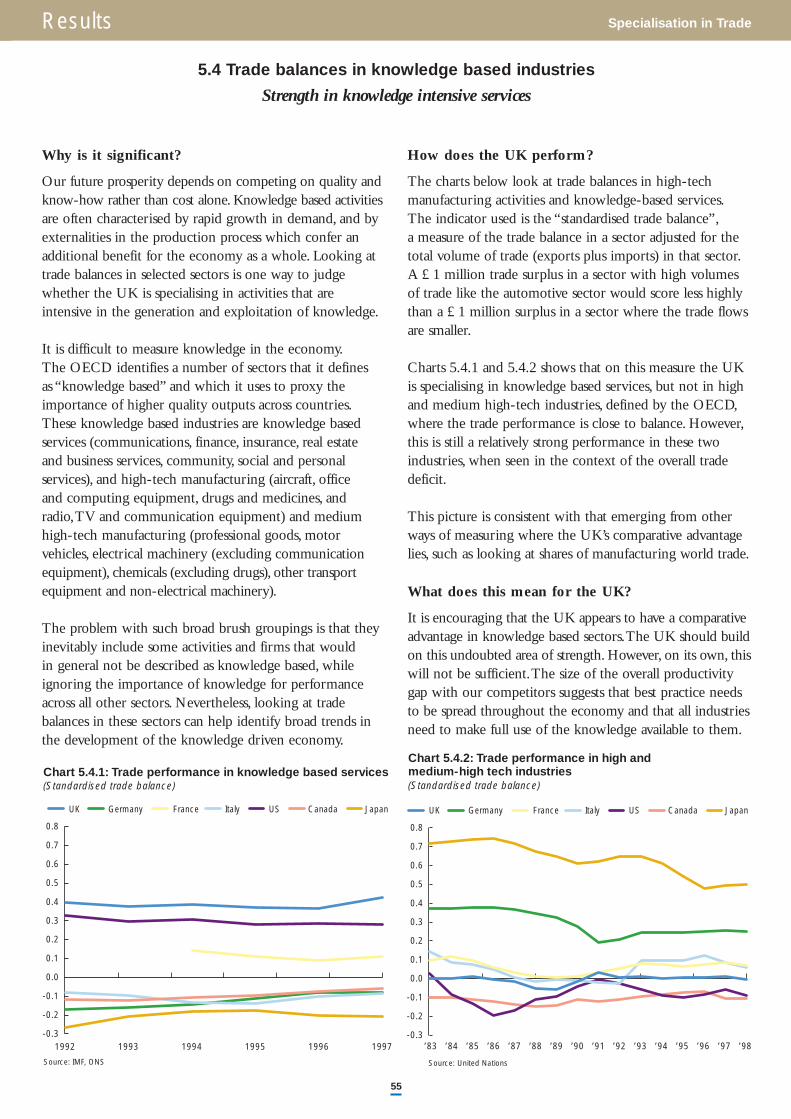
Results Specialisation in Trade
55
Why is it significant?
Our future prosperity depends on competing on quality andknow-how rather than cost alone. Knowledge based activitiesare often characterised by rapid growth in demand, and byexternalities in the production process which confer anadditional benefit for the economy as a whole. Looking attrade balances in selected sectors is one way to judgewhether the UK is specialising in activities that areintensive in the generation and exploitation of knowledge.
It is difficult to measure knowledge in the economy.The OECD identifies a number of sectors that it defines as “knowledge based” and which it uses to proxy theimportance of higher quality outputs across countries.These knowledge based industries are knowledge basedservices (communications, finance, insurance, real estate and business services, community, social and personalservices), and high-tech manufacturing (aircraft, office and computing equipment, drugs and medicines, and radio,TV and communication equipment) and mediumhigh-tech manufacturing (professional goods, motorvehicles, electrical machinery (excluding communicationequipment), chemicals (excluding drugs), other transportequipment and non-electrical machinery).
The problem with such broad brush groupings is that theyinevitably include some activities and firms that would in general not be described as knowledge based, whileignoring the importance of knowledge for performanceacross all other sectors. Nevertheless, looking at tradebalances in these sectors can help identify broad trends inthe development of the knowledge driven economy.
How does the UK perform?
The charts below look at trade balances in high-techmanufacturing activities and knowledge-based services.The indicator used is the “standardised trade balance”,a measure of the trade balance in a sector adjusted for thetotal volume of trade (exports plus imports) in that sector.A £1 million trade surplus in a sector with high volumesof trade like the automotive sector would score less highlythan a £1 million surplus in a sector where the trade flowsare smaller.
Charts 5.4.1 and 5.4.2 shows that on this measure the UKis specialising in knowledge based services, but not in highand medium high-tech industries, defined by the OECD,where the trade performance is close to balance. However,this is still a relatively strong performance in these twoindustries, when seen in the context of the overall tradedeficit.
This picture is consistent with that emerging from otherways of measuring where the UK’s comparative advantagelies, such as looking at shares of manufacturing world trade.
What does this mean for the UK?
It is encouraging that the UK appears to have a comparativeadvantage in knowledge based sectors.The UK should buildon this undoubted area of strength. However, on its own, thiswill not be sufficient.The size of the overall productivitygap with our competitors suggests that best practice needsto be spread throughout the economy and that all industriesneed to make full use of the knowledge available to them.
5.4 Trade balances in knowledge based industries
Strength in knowledge intensive services
-0.3
-0.2
-0.1
0.0
0.3
0.4
0.8
0.1
0.2
0.5
0.6
0.7
199719961995199419931992
Source: IMF, ONS
Chart 5.4.1: Trade performance in knowledge based services (Standardised trade balance)
JapanCanadaUSItalyFranceGermanyUK
Source: United Nations
medium-high tech industriesChart 5.4.2: Trade performance in high and
(Standardised trade balance)
’98’97’96’95’94’93’92’91’90’89’88’87’86’85’84’83
JapanCanadaUSItalyFranceGermanyUK
-0.3
-0.2
-0.1
0.0
0.3
0.4
0.8
0.1
0.2
0.5
0.6
0.7
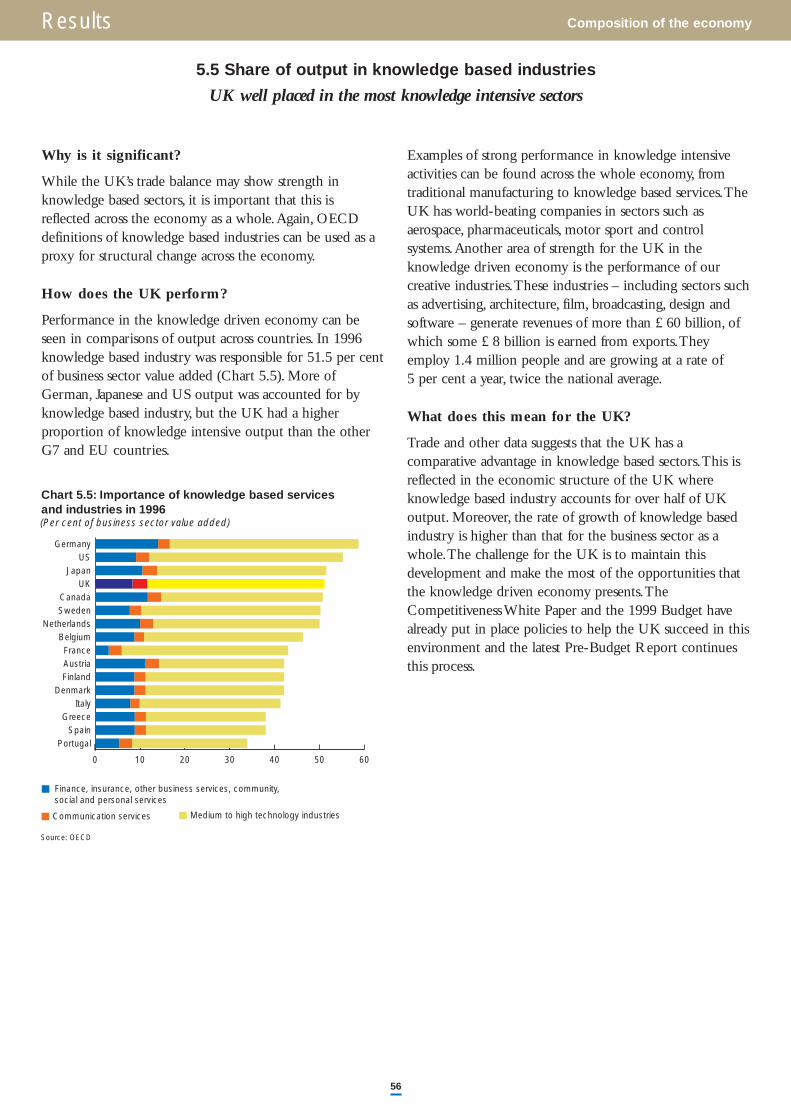
Results Composition of the economy
56
Why is it significant?
While the UK’s trade balance may show strength inknowledge based sectors, it is important that this isreflected across the economy as a whole.Again, OECDdefinitions of knowledge based industries can be used as aproxy for structural change across the economy.
How does the UK perform?
Performance in the knowledge driven economy can beseen in comparisons of output across countries. In 1996knowledge based industry was responsible for 51.5 per centof business sector value added (Chart 5.5). More ofGerman, Japanese and US output was accounted for byknowledge based industry, but the UK had a higherproportion of knowledge intensive output than the otherG7 and EU countries.
Examples of strong performance in knowledge intensiveactivities can be found across the whole economy, fromtraditional manufacturing to knowledge based services.TheUK has world-beating companies in sectors such asaerospace, pharmaceuticals, motor sport and controlsystems.Another area of strength for the UK in theknowledge driven economy is the performance of ourcreative industries.These industries – including sectors suchas advertising, architecture, film, broadcasting, design andsoftware – generate revenues of more than £60 billion, ofwhich some £8 billion is earned from exports.Theyemploy 1.4 million people and are growing at a rate of 5 per cent a year, twice the national average.
What does this mean for the UK?
Trade and other data suggests that the UK has acomparative advantage in knowledge based sectors.This isreflected in the economic structure of the UK whereknowledge based industry accounts for over half of UKoutput. Moreover, the rate of growth of knowledge basedindustry is higher than that for the business sector as awhole.The challenge for the UK is to maintain thisdevelopment and make the most of the opportunities thatthe knowledge driven economy presents.TheCompetitiveness White Paper and the 1999 Budget havealready put in place policies to help the UK succeed in thisenvironment and the latest Pre-Budget Report continuesthis process.
5.5 Share of output in knowledge based industries
UK well placed in the most knowledge intensive sectors
(Per cent of business sector value added)
Finance, insurance, other business services, community, social and personal services
Source: OECD
Communication services Medium to high technology industries
Chart 5.5: Importance of knowledge based services and industries in 1996
0 10 20 30 40 50 60
PortugalSpain
GreeceItaly
DenmarkFinlandAustriaFrance
BelgiumNetherlands
SwedenCanada
UKJapan
USGermany
Conclusions and next steps
57
The purpose of this first edition of UK CompetitivenessIndicators is mainly to propose a baseline against whichfuture performance can be measured. But lessons can stillbe drawn from the indicators in this first report. Discussionof the report in the Competitiveness Council confirmedthat there are many encouraging examples of goodperformance across the UK economy. Macroeconomicprospects are improving and other features of the businessenvironment are positive; the proportion of people inwork is high; the UK’s science base is strong and ourresearch is highly regarded around the world; and weperform well in some key knowledge-intensive sectors.
However, there are other areas where the UK lags ourmain competitors and where improvement is needed:
Innovation. We do not make enough of our expertise inscience and technology and our openness to ideas. Indicatorsin the report from the Community Innovation Surveyshow that, in terms of business spend on innovation andR&D and the proportion of revenues earned from new andimproved products, many of our manufacturing firms fallwell short of European best practice.These failings appearto reflect a lack of commitment and leadership in UKfirms when it comes to innovation. More also needs to bedone to get the best out of our universities and the UKscience base, for example through developing university-industry links and promoting networks and clusters.
Management. It is clear that management performanceneeds to improve if we are to be successful in theknowledge economy. Studies indicate that the UK’s poorinvestment record is due in large measure to deficienciesin management skills and attitudes.The results from theindicators on innovation and the experience of venturecapitalists also suggest a shortage of good managers,particularly for fast-growing companies in high-technology sectors.There is a need to improve incentivesin such companies and to upgrade management skills.
Human capital. The skills gap faced by businesses in theUK goes beyond management. ‘Human capital’ is anotherarea of poor performance identified by the Indicators andconfirmed by discussion in the Council. Our educationsystem must deliver the product that wealth-creatingbusiness requires. Business skills need to be integratedmore fully into teaching at all levels of education, fromschools through to our world-class universities andresearch institutes.And work-based training and learningneeds to continue after people have left full-timeeducation and moved into the work-place.
Enterprise culture and small firms. The lack of anenterprising culture is a particular handicap in theknowledge driven economy.Attitudes in the UK toentrepreneurship are less favourable than in the US and in
some respects fall short of our European partners. Smallfirms can face difficulties in gaining access to finance, bothat the start-up stage and in achieving sustained growth.Further work is needed to promote a culture ofentrepreneurship, particularly among young people, andremove the barriers to the development of a dynamicsmall firms sector.
Consumers. Discerning and informed consumers are animportant spur to competition and innovation. In part,greater consumer sophistication comes with rising incomelevels and rising educational attainment indicators both ofwhich are included in the report. But anecdotal evidencesuggests that UK consumers show more inertia and aregenerally less demanding than in other countries at similarincome levels.This is an area that is being addressed in theimplementation of the Consumer Strategy White Paper.
The work programme of the Competitiveness Councilwill reflect these themes. But, as members of the Councilwarned, achieving improvements will be a long-termprocess. UK performance as measured by the Indicatorscannot be expected to pick up overnight. It is likely torequire sustained effort over a number of years to narrowthe gap with our main competitors
The UK Competitiveness Indicators will be used to trackprogress over time in addressing these priority areas.Thechoice of indicators will be refined as new data becomesavailable and as the analysis of the factors determining ourrelative economic performance develops. In monitoringthe UK’s performance, the views of business need to beincorporated.The Competitiveness Council, under thechairmanship of the Secretary of State for Trade andIndustry, will therefore continue to have a role in shapingthe UK Competitiveness Indicators and interpreting the results.
As made clear in the Introduction, not all the factors thatare important for competitiveness in the knowledge driveneconomy are well measured at the moment, and theindicators need to be developed further. Particular areaswhere refinement is needed are indicators to capture thesophistication of consumer demand, competition, capitalquality, work-based training, entrepreneurship and finance,the environment for e-commerce, and the development of“clusters” and other forms of collaboration. Research isunder way to improve measurement in these areas.
Chapter 6: Conclusions and next steps

Annex Competitiveness Council
58
Membership of the Competitiveness Council
The Competitiveness Council was established in July 1999 and is chaired by the Secretary of State for Trade and Industry. Its terms of reference are:
“To advise the Secretary of State for Trade and Industry on thepriorities for government and others in taking forward the programmefor improving UK competitiveness set out in the CompetitivenessWhite Paper; on the progress towards achieving the desiredimprovements in competitiveness; and on any further policy proposalsneeded to address the competitiveness challenges of the future”.
The Council met for the first time in July 1999 to review the Indicators
Members of the Council include:
Iqbal Ahmed, Chairman, Seafood Marketing International plcProfessor Kumar Bhattacharyya, Director,Warwick Manufacturing GroupSir Peter Bonfield, Chief Executive, British Telecommunications plcSir John Browne, Group Chief Executive, British Petroleum Co plcC K Chow, Chief Executive, GKN plcDr Chris Evans, Chairman, Merlin Scientific ServicesSir Richard Evans, Chairman, British Aerospace plcAmelia Fawcett, Managing Director and Chief Administrative Officer (Europe),
Morgan Stanley Dean WitterSir Anthony Greener, Chairman, Diageo plcDeirdre Hutton, Vice Chairman, National Consumer CouncilCharles Leadbeater, independent author and consultantSheila McKechnie, Managing Director, Consumers’AssociationJohn Monks, General Secretary,TUCRosemary Radcliffe, Chief Economist, PricewaterhouseCoopersReuben Singh, Chairman, RSGOCIan Smith, Group Commercial Director, Ocean Group plcSir Richard Sykes, Chairman, Glaxo Wellcome plcCarl Symon, Chief Executive, IBM (UK) plcAdair Turner, Director General, CBIDerek Wanless
Annex
59
Data Notes and Sources
GLOSSARY
G7 includes the UK, Germany, France, Italy, US, Canadaand Japan.
G5 includes the UK, Germany, France, US and Japan.
OECD refers to countries belonging to the Organisationfor Economic Cooperation and Development.Thefollowing are members:Australia,Austria, Belgium,Canada, Czech Republic, Denmark, Finland, France,Germany, Greece, Hungary, Iceland, Ireland, Italy, Japan,Korea, Luxembourg, Mexico,The Netherlands, NewZealand, Norway, Poland, Portugal, Spain, Sweden,Switzerland,Turkey, United Kingdom, United States.
EU and EU15 refer to the countries who are currentlymembers of the European Union:Austria, Belgium,Denmark, Finland, France, Germany, Greece, Ireland, Italy,Luxembourg,The Netherlands, Portugal, Spain, Sweden, UK.
DATA SOURCES
BUSINESS ENVIRONMENT INDICATORS
2.1 Macroeconomic volatility
Annual data for GDP growth and inflation are taken fromOECD National Accounts, up to and including 1997, withdata for 1998 taken from OECD Main Economic Indicators.Data for exchange rate changes and nominal short-terminterest rates come from the OECD Economic Outlook,June 1999.Volatility is measured by the standard deviationacross the period.
2.2 Openness to trade and foreign investment
Openness to trade data is taken from the OECD National Accounts.
The source for FDI stocks is the OECD International DirectInvestment Statistics Yearbook 1998.
2.3 Prices
Mark up data taken from Oliveira Martins, J., Scarpetta, S.and Pilat, D., Mark up Pricing, Market Structure and theBusiness Cycle, OECD Economic Studies, no. 27, (1996).
On price comparisons, the source for the Eurostat data is,Economic reform: Report on the Functioning of CommunityProduct and Capital Markets presented by the European
Commission in response to the conclusions of the CardiffEuropean Council. Ref: COM(1999) 10 final. ISSN 0254-1475, Office for Official Publications of the EuropeanCommunities, 20 January 1999. It analyses data collectedby Eurostat and the OECD for calculating purchasingpower parities.
2.4 Unemployment
The source for chart 2.4.1 is the OECD Labour ForceStatistics publication and the source for chart 2.4.2 is theOECD Employment Outlook, 1989 data are not availablefor United Germany. Figures for youth unemployment inthe US and UK are for the 16-24 age group.Thediscussion of structural unemployment is based on OECDSecretariat estimates of the non accelerating wage rate ofunemployment (NAWRU) made for the OECD EconomicOutlook No. 60, 1996.A change is considered significant(in absolute terms) if it exceeds one standard deviation.The latter was calculated for each series and country overthe 1986-96 period.
2.5 Diversity of employment opportunities
The data for charts 2.5.1 and 2.5.2 are taken from theLabour Force Survey produced by the Office for National Statistics.
The data for chart 2.5.3 is taken from the 1997 EuropeanLabour Force Survey produced by Eurostat.
2.6 Industrial action
The data in Chart 2.6.1 are taken from the Labour MarketTrends (Office for National Statistics), June 1999,and measure the number of working days lost per 1,000 employees.
The data in Chart 2.6.2 are taken from Labour MarketTrends (Office for National Statistics),April 1999 andmeasure the number of working days lost per 1,000employees.The original source for the number of days lostwas the International Labour Organisation (ILO) and thesource for the employee data, the OECD.
2.7 Labour market regulation
The source used was the International Institute forManagement Development’s (IMD) World CompetitivenessYearbook, which surveys businesses on whether labourmarket regulations are ‘too restrictive or flexible enough’.

Annex
60
Data Notes and Sources
2.8 Business perceptions of the institutional andpolitical environment
The source used was the International Institute forManagement Development’s World Competitiveness Yearbook.Two broad sets of indicators were selected in Chart 2.8.1,which presents the simple average of the scores underthese headings.
For government policies the following indicators listed in that publication were chosen: the deterioration orimprovement of the management of public finances;the incentive effect of real personal taxes; the incentiveeffect of real corporate taxes; the extent of tax evasion;the adaptability of government economic policies to achanging economic environment; the legislative activity ofthe parliament and its relation to the nation’s competitiverequirements; and transparency – the government does notcommunicate its intentions clearly.
For institutions those used were: the effect of the legalframework on competitiveness; the appropriateness of thepolitical system to today’s economic challenges; the effectof the customs administration on the efficient transit ofgoods; the extent of corruption; public service andpolitical interference; are government decisions effectivelyimplemented? is the law fairly administered? and arepeople and property adequately protected?
For the regulation chart (2.8.2), the following indicatorswere used: does environmental regulation hinder business? is labour regulation too restrictive? the extent ofgovernment price controls; do competition laws preventunfair competition? bureaucracy and its effect on businessdevelopment; and product liability as a constraint on business.
2.9 Sustainable Development Indicators
The Government’s Indicators for a Strategy for SustainableDevelopment for the United Kingdom:A baseline assessment arepublished by the Department of the EnvironmentTransport and the Regions (DETR).They can be foundon the Internet at: www.environment.detr.gov.uk/sustainable/quality/monitor/index.htm#
RESOURCES INDICATORS
3.1 Adult literacy and numeracy
Literacy:The chart shows the percentage of adults with‘poor’ level 1 literacy skills. Source: Literacy Skills for the
Knowledge Society: Further results from the Adult LiteracySurvey, November 1997, OECD.
Numeracy:Average number of correct responses to 12arithmetic questions set to a sample of adults. Note thatthe data presented in the chart excludes respondents whorefused to answer any or all of the questions set.Thepercentage of refusals was higher in the UK than in othercountries. Source: Basic Skills Agency.
3.2 National Learning Targets
Data measuring progress in meeting National LearningTargets for England for 2002, set by the Department forEducation and Employment are derived from springlabour force surveys.
3.3 Business investment per worker
Figures for investment per worker in the business sectorare taken from the OECD’s Business Sector Database.Business investment includes investment in publiccorporations.The version of the database used is 1998 No. 2 as the most recent version contains data for someEuropean countries based on the latest system of nationalaccounts (ESA95) and some on the previous version(ESA79).The capital stock numbers are taken from MaryO’Mahony, Britain’s Productivity Performance 1950-1996:AnInternational Perspective, (1999), published by the NationalInstitute of Economic and Social Research.
3.4 Government investment per head
The OECD Business Sector Database is used as the sourcefor government investment at current prices and thedeflators required to generate constant price estimators.purchasing power parities were taken from the OECDNational Accounts and for the most recent years the OECDMain Economic Indicators. Population figures are taken fromthe OECD Economic Outlook.The version of the BusinessSector Database used is 1998 No. 2 as the most recentversion contains data for some European countries basedon the latest system of national accounts (ESA95) andsome on the previous version (ESA79).
3.5 Venture capital
The data on the amount and composition of venturecapital come from the British Venture Capital Association.‘Start-up’ venture capital is defined as: the provision offinance to companies for use in product development and
Annex
61
Data Notes and Sources
initial marketing. Companies may be in the process ofbeing set up or may have been in business for a shorttime, but have not yet sold their product commercially.‘Early stage’ venture capital is: the provision of financing tocompanies that have completed the product developmentstage and require further funds to initiate commercialmanufacturing sales.They may not yet be generatingprofits.They are not strictly comparable over time sincemembership changes annually. 3i investment is notincluded in the 1984-86 figures.
For 1992 to date, secured debt is included where it isconcurrent or alongside equity investment, or where it isrescue finance. Previously unsecured debt as part of anequity/quasi-equity package is included.
3.6 Second tier markets
Analysis draws upon Muzyka D., B. Leleux and N. Guegan,European New Issues Markets:A Preliminary Review,published by INSEAD and 3i Venturelab, November 1998.Euro NM includes the Nouveau Marche in France,NMAX in the Netherlands, the Neuer Markt in Germany,Euro NM in Belgium and Nuovo Mercato in Italy. It is anassociation that permits the collective communication ofstock offerings, but the actual mechanics of trading remainwith the individual member markets.
3.7 Stock market size and turnover
Data taken from the London Stock Exchange, Fact File(1999). Using market makers doubles the level of turnoverin comparison with the order book/matching method.In order to make the figures internationally comparable,the turnover figures for those exchanges that use marketmakers, such as the UK, are halved.
3.8 Business uptake and use of ICT
Estimates of growth in web pages and new users in 1998from International Data Corporation (IDC). Results onattitudes to ICT amongst large and small business from theInternational Benchmarking Study, Spectrum StrategicConsultants, 1998. Results on IT Directors from Institutefor Directors/Oracle Blueprint for Business, 1998.
3.9 ICT understanding in companies
The data comes from, DTI, Moving into the Information Age:DTI International Benchmarking Study (1999).This wasprepared for the DTI by Spectrum Strategy Consultants.
3.10 E-commerce
Data on Internet users came from NUA (www.nua.ie),drawing on multiple studies published between June 1998and May 1999. Data on e-commerce transactions camefrom IDC, December 1998.
Estimates of the number of Internet users are fromInternetTrak, commissioned by Ziff-Davis/Yahoo!/Dell.Consumer attitudes taken from The Lifestyle Revolution,September 1998, commissioned by ICL and conducted by MORI.
3.11 Publications and citations of UK research inacademic journals
Data taken from The Quality of the UK Science Base, Officeof Science and Technology (OST) (1997).
3.12 Government spend on R&D per worker
Data taken from the twice yearly OECD Main Science andTechnology Indicators.
3.13 Business spend on R&D per worker
Data taken from the OECD Main Science and TechnologyIndicators and OECD Labour force statistics. Data forFrance are 1996, not 1997.
INNOVATION PROCESS INDICATORS
International comparisons using the second CommunityInnovation Survey (CIS), with reference years 1994-96 shouldbe treated with caution.While the survey is designed to beconsistent across countries, it is not clear that questionshave always been interpreted consistently across countries.Moreover, some countries have low response rates whichwill undermine the reliability of the sample.
4.1 Business spend on innovation including R&D
The Community Innovation Survey (CIS) provides data onthe innovation activities of enterprises employing morethan 10 people across most EU and some EEA countries.The results are currently available for Belgium, Denmark,Spain, France, Ireland, Luxembourg, Netherlands,Austria,Finland, Sweden, UK and Norway, and are based onanswers from 33,700 enterprises.The survey covers allmanufacturing industries, utilities, transport anddistribution services, telecommunications and financialservices, computing and engineering services.

Annex
62
Data Notes and Sources
4.2 UK’s patenting performance
Data for the US comes from the US Patent and TradeMark Office. European data is provided by the EuropeanPatent Office.
4.3 Proportion of firms who innovate
The Community Innovation Survey (CIS) asked enterpriseswhether they introduced new or improved products orprocesses between 1994 and 1996. If an enterprise indicatedthey had, the CIS describes them as an innovator.
4.4 Share of sales due to new or improved products
The Community Innovation Survey (CIS) records thepercentage of total turnover of new and improvedproducts in manufacturing.
4.5 Internationalisation of R&D
Data taken from the OECD database on the activities offoreign affiliates. Revised UK data for 1996, published bythe ONS, which has yet to appear on the OECD database,has been used.
4.6 Technological alliances between firms
The source of the data is MERIT, which is a researchorganisation of the University of Maastricht.Alliances cantake a variety of forms, ranging from simple partnerships(cross licensing) to the establishment of common research subsidiaries.
4.7 Sources of information for innovation
Community Innovation Survey.
4.8 Joint publishing by universities and industry
The source for the chart is SPRU, UK Corporate Researchand Collaboration.
4.9 University spin-outs
The data on spin-outs is taken from Industry Academic Linksin the UK, published by the Higher Education FundingCouncil for England, December 1998. Prepared for theOffice of Science and Technology.
4.10 Entry and exit rates
Large increases in the VAT registration threshold in 1991and 1993 mean data before and after these years are notentirely comparable.
Source: DTI Small and Medium Sized Firms Statistics Unit.They capture all enterprises with a turnover above the VATregistration threshold (currently £50,000 per annum).TheRegional Competitiveness Indicators uses the number ofregistrations as a percentage of stock of businesses.This ismore appropriate on a regional basis, because it takes accountof both different regional characteristics and the fact thatpeople may live in one region and work in another.
4.11 Fast growing firms
High growth companies are defined as those who have seenan employment increase of at least 60% within three years.The data is taken from the Netherlands’ Ministry of EconomicAffairs, High Growth Companies in the Netherlands (1999).
4.12 Attitudes to entrepreneurship
The source for the data on nascent entrepreneurs is theNational Panel (Longitudinal) Studies of Business Start-ups from the Great Britain Pilot Nascent EntrepreneursStudy.This has been developed by Colin Mason ofSouthampton University in conjunction with BarclaysBank.The first study of this kind was undertaken by PaulReynolds of Babson College.The National Panel Studiesof Business Start-ups identify a representative sample ofindividuals trying to launch a new business.A range ofdetails surrounding the start-up activity are collected.The individuals are re-contacted over time to see if theydid indeed start a business and how the business isdeveloping.At this stage the US and five other countries areinvolved.The UK results for 1998 are from a pilot study.
The other indicators come from the EntrepreneurshipResearch Council’s Global Entrepreneurship Monitor (GEM).This is a cross-national comparison of the role and impactof entrepreneurship in national economic growth.Ten countries from North America, Europe and Asia arecurrently involved.
Annex Data Notes and Sources
63
RESULTS INDICATORS
5.1 GDP per head
Data on levels of GDP per head in the OECD are takenfrom the OECD Main Economic Indicators.The source forthe growth rates is the OECD National Accounts (1999) foryears up to and including 1997. Estimates for 1998 aregenerated using data from OECD Main Economic Indicators.
5.2 Output per hour and per worker
Data on GDP per worker are derived using the OECDLabour Force Statistics and National Accounts.The GDP perhour estimates are based on the methodology described inHarley, E., and Owen, J., ‘International comparisons ofproductivity and wages’, Economic Trends, January 1998.
The source for average annual hours worked for non EUcountries is the OECD Employment Outlook. For Japanchanges in hours for dependent employees has beenprojected forward from 1995 to allow a comparison to bemade beyond that date.
5.3 Employment rate
Percentage of the population of working age (men andwomen aged 15-64) in paid employment. Source: OECDEmployment Outlook.When interpreting these figures itmust be recognised that if there is an increase in thenumber of people in full-time education (and who are notworking) then the employment rate would fall. However,the magnitude of a fall for this reason would be mitigatedby the fact that many students have some form of casualemployment, and so would appear in the employment figures.
5.4 Trade balances in knowledge based industries
It is difficult to measure knowledge in the economy.However for illustrative purposes, the OECD use differentsectors as proxies for knowledge intensity.The OECDdefine knowledge based industries as knowledgebased services (communications, finance, insurance, realestate and business services, community, social andpersonal services), high-tech manufacturing (aircraft,office and computing equipment, drugs and medicines andradio,TV & communication equipment) and medium-high-tech manufacturing (professional goods, motorvehicles, electrical machinery (excluding communicationequipment), chemicals (excluding drugs), other transportequipment, non-electrical machinery).
The main criteria used in deciding which industries areincluded as knowledge based industries is the amount ofR&D.There is also an element of “embodied” technology,i.e. that present in intermediate inputs.
For services there is no formal methodology.The principleis that knowledge intensive services (and indeedmanufactures) include those with high IT use and/or highR&D spending and/or high proportion of highly skilledworkers – such as communications, finance and arguably,areas of health and education. Lack of detailed service datain many countries means that it is difficult to formallygroup industries according to knowledge intensity (hencethere is no formal methodology).
Standardised trade balances are calculated as (Exports –Imports)/(Exports + Imports).These measures arepreferred to industries’ shares of OECD or world exports,or markets, because they measure the extent to whichBritain has specialised in some industries, rather thanothers, compared to a hypothetical, autarkic economy.Data problems for calculating world shares are also greater,particularly for the service sector where the quality of thedata is lower.
5.5 Share of output in knowledge based industries
Data taken from the OECD, Science,Technology and IndustryScoreboard 1999. Figures for UK, Denmark, Greece,TheNetherlands are for 1995. Figures for Spain and Swedenare for 1994, and for Portugal, 1993.

Printed in the UK on recycled paper with a minimum HMSO score of 50.
December 1999. Department of Trade and Industry. http://www.dti.gov.uk/
© Crown Copyright. DTI/Pub 4248/8k/12/99/NP. URN 99/1249