uiuc energy report - university of...
TRANSCRIPT

UIUC Energy Report Fiscal Year 2014

UIUC Energy Report | 2
Summary The Urbana-Champaign Campus of the University of Illinois has made subtantial commitments towards conserving energy and other utilities and has made significant progress toward our sustainability goals published in the Illinois Climate Action Plan (iCAP.) Recently,the Utilities and Energy Services Division of Facilities & Services (F&S) created an energy report card to inform campus leadership and management teams regarding progress towards meeting our goals.
During 2014, the Urbana-Champaign campus used a total of 4,831,255 Million BTU’s (MBTU) for the entire campus served by campus utilities. A BTU (or British Thermal Units) is a unit of heat measurement used to common-size all energy input sources like electricity and fuels. Over the utility service area of 21,003,246 gross square feet, this factors out to 230,024 BTU’s per square foot, also known as the Energy Utilization Index or EUI. We use the EUI to compare and contrast energy utilization and density in our buildings. An average household, according to the Energy Information Administration, uses 46,100 BTUs per gsf over the course of a year. In total, a household of 2,000 sf in the Midwest would use a total of 92.2 MBTU’s. Thus the campus usage is the equivalent of 52,400 households. Please note for the purposes of providing meaningful comparisons, the data from the National Petascale Computing Facility (Petascale) has been omitted.
In contrast, during FY 2013 the campus used a total of 4,651,050 MBTUs or 222,437 BTUs per gsf. The increase of 3.4% can be attributed to weather differences. Overall since 2007, the UIUC campus has decreased usage from 312,124 BTUs per sf to 230,024 BTUs per sf; a decrease of 26.3%. Much of this decline can be attributed to the investments in retro-commissioning existing buildings and new buildings with higher energy efficiencies.
In terms of college, auxiliary and unit usage, since 2012, 16 have shown overall reductions in energy consumption expressed in terms of BTUs per gsf, while 8 showed some increase. There are a variety of reasons including research energy intensity, changes in building use and building density, and weather that could affect this. The following chart shows these units on campus and a four-year history of EUI:
- 50,000
100,000 150,000 200,000 250,000 300,000 350,000 400,000 450,000 500,000
Med
icin
e
Vet
Med
McK
inle
y H
ealth
Cnt
r
LAS
Engi
neer
ing
CITE
S
Educ
atio
n
Med
ia
Int'l
Stu
dies
ACE
S
Law
Libr
arie
s
FAA
App
lied
Hea
lth S
ci
VC
for S
tude
nt A
ffai
rs
Busi
ness
Hou
sing
, Cam
pus
Rec
and…
Publ
ic S
afet
y
Ath
letic
s
Nur
sing
Gra
duat
e Co
llege
Gen
eral
Stu
dies
Soci
al W
ork
Arm
ed F
orce
s
LB LC NK KV KP NT KN KT LQ KL KU LR KR KY NJ KM NQ LF NU FW KS KW LL LD
EUI -
BTU
s pe
r Gro
ss S
quar
e Fo
ot
College or Auxiliary
Energy Utilization Index by Unit - 2011 - 2014
2011
2012
2013
2014

UIUC Energy Report | 3
College and Unit Reports The data on the above chart is compiled from our Energy Billing System database which allocates usage and cost to departments and administrative units depending on their space allocation of a building. Mitigating factors, such as fume hoods and animal rooms are energy intensive resources and drive a higher proportionate share of the building allocation depending on the amount of outside air exchanged. The indices used for building space allocation are downloaded from the Archibus building space management system once per semester and used to allocate cost and usage to each department.
The attached reports reflect usage cost and energy intensity cost and usage for all building space allocated to the unit or department and is described below:
Energy Utilization Index
EUI- BTUs per GSF
This section compares the campus building average usage per gsf with the usage of the college or administrative unit. All energy usage in a building is converted to BTUs, aggregated and divided by the amount of square footage in the building space allocated to the unit.
Comparison of UIUC Building Types
The report also includes a reference to typical UIUC building spaces and their average Energy Utilization Indices by type. This information was provided by the UIUC Energy Billing System database.
Historical Usage Data
The remaining charts on the page show the energy consumption trends by year in BTUs per sf and in total energy expenditures. In the commodity chart, usage trends are broken down by type of commodity used.
0 100,000 200,000
Campus…
College…
EUI
335,759
293,505
212,883
174,548
173,283
95,833
0 50,000 100,000 150,000 200,000 250,000 300,000 350,000 400,000
Recreation/Athletic Center/Gym
Medical Office/Clinic
Laboratory
Classrooms/Educational/Library
Office
Dormitory/Ward
Average BTUs per gsf - UIUC Campus Buildings

The purpose of this report is to:
*Provide Information concerning energy cost
*Track your energy utilization compared to prior periods
Facilities and ServicesUtilities and Energy Services
(LB) Medicine at UIUC Energy Report 2014
Annualized BTU/SQFT (EUI)
269,346
185,253
0 60,000 120,000 180,000 240,000 300,000
College BTU/SQFT
Campus BTU/SQFT AVG
BTU/SQFT
College Comparison | Currently your college utilizes
*The energy index combines natural gas (therms), chilled water (MBtu), Steam (Klbs), electricity (KWh) into a single measurement.
45.39% MORE Energy than the Campus average.Campus Energy Utility Index (EUI) is calculated by deriving the total BTUs consumed by net assignable square feet for your college.
College Comparison
435,076 402,759 335,294 269,346
$1,028,950
$811,254
$656,925
$949,359
0
50,000
100,000
150,000
200,000
250,000
300,000
350,000
400,000
450,000
500,000
2011 2012 2013 2014
BTU PER
SQFT
$0
$200,000
$400,000
$600,000
$800,000
$1,000,000
$1,200,000
Cost
BTU_PER_SQFT YTD_COST
Comparing last year's usage to this year's usage you have utilized 19.67% LESS energy than the prior year.
Commodity Comparison
10,829
10,693
10,416
9,156
28 27 36
26,406
23,465
18,892
16,82021,387
20,109
15,865
10,297
29
0
5,000
10,000
15,000
20,000
25,000
30,000
2011 2012 2013 2014
MBT
U
ELEC NG STEAM ChW
FY14 Results
Building Type Avg of BTU_PER_SQFTRecreation/Athletic Center/Gymnasium 335,758.78 Medical Office/Clinic 293,505.43 Laboratory 212,882.62 Classrooms/Educational/Library 174,547.77 Office 173,283.46 Dormitory/Ward 95,832.73 Source: F&S Energy Billing System
EUI Rankings by UIUC Building Type
Business Applications Database: Sourced from EBS and ARCHIBUS9/4/2014Printed:

The purpose of this report is to:
*Provide Information concerning energy cost
*Track your energy utilization compared to prior periods
Facilities and ServicesUtilities and Energy Services
(LC) Veterinary Medicine Energy Report 2014
Annualized BTU/SQFT (EUI)
240,602
185,253
0 60,000 120,000 180,000 240,000 300,000
College BTU/SQFT
Campus BTU/SQFT AVG
BTU/SQFT
College Comparison | Currently your college utilizes
*The energy index combines natural gas (therms), chilled water (MBtu), Steam (Klbs), electricity (KWh) into a single measurement.
29.88% MORE Energy than the Campus average.Campus Energy Utility Index (EUI) is calculated by deriving the total BTUs consumed by net assignable square feet for your college.
College Comparison
356,553 317,933 273,965 240,602
$3,363,540
$2,604,633$2,302,334
$2,950,452
0
50,000
100,000
150,000
200,000
250,000
300,000
350,000
400,000
2011 2012 2013 2014
BTU PER
SQFT
$0
$500,000
$1,000,000
$1,500,000
$2,000,000
$2,500,000
$3,000,000
$3,500,000
$4,000,000
Cost
BTU_PER_SQFT YTD_COST
Comparing last year's usage to this year's usage you have utilized 12.18% LESS energy than the prior year.
Commodity Comparison
35,572
31,361
31,978
31,395
2,811
3,836
3,751
86,598
74,213
62,648
50,30966
,089
62,595
48,873
43,938
3,490
0
10,000
20,000
30,000
40,000
50,000
60,000
70,000
80,000
90,000
100,000
2011 2012 2013 2014
MBT
U
ELEC NG STEAM ChW
FY14 Results
Building Type Avg of BTU_PER_SQFTRecreation/Athletic Center/Gymnasium 335,758.78 Medical Office/Clinic 293,505.43 Laboratory 212,882.62 Classrooms/Educational/Library 174,547.77 Office 173,283.46 Dormitory/Ward 95,832.73 Source: F&S Energy Billing System
EUI Rankings by UIUC Building Type
Business Applications Database: Sourced from EBS and ARCHIBUS9/4/2014Printed:

The purpose of this report is to:
*Provide Information concerning energy cost
*Track your energy utilization compared to prior periods
Facilities and ServicesUtilities and Energy Services
(NK) McKinley Health Center Energy Report 2014
Annualized BTU/SQFT (EUI)
277,978
185,253
0 60,000 120,000 180,000 240,000 300,000
College BTU/SQFT
Campus BTU/SQFT AVG
BTU/SQFT
College Comparison | Currently your college utilizes
*The energy index combines natural gas (therms), chilled water (MBtu), Steam (Klbs), electricity (KWh) into a single measurement.
50.05% MORE Energy than the Campus average.Campus Energy Utility Index (EUI) is calculated by deriving the total BTUs consumed by net assignable square feet for your college.
College Comparison
273,620 265,788 258,477 277,978
$405,045
$386,786
$410,186
$389,669
245,000
250,000
255,000
260,000
265,000
270,000
275,000
280,000
2011 2012 2013 2014
BTU PER
SQFT
$375,000
$380,000
$385,000
$390,000
$395,000
$400,000
$405,000
$410,000
$415,000
Cost
BTU_PER_SQFT YTD_COST
Comparing last year's usage to this year's usage you have utilized 7.54% MORE energy than the prior year.
Commodity Comparison
4,169
3,913
3,859
3,873
10,493
9,975
10,330 12,292
8,446
8,559
7,640
7,311
0
2,000
4,000
6,000
8,000
10,000
12,000
14,000
2011 2012 2013 2014
MBT
U
ELEC NG STEAM ChW
FY14 Results
Building Type Avg of BTU_PER_SQFTRecreation/Athletic Center/Gymnasium 335,758.78 Medical Office/Clinic 293,505.43 Laboratory 212,882.62 Classrooms/Educational/Library 174,547.77 Office 173,283.46 Dormitory/Ward 95,832.73 Source: F&S Energy Billing System
EUI Rankings by UIUC Building Type
Business Applications Database: Sourced from EBS and ARCHIBUS9/4/2014Printed:

The purpose of this report is to:
*Provide Information concerning energy cost
*Track your energy utilization compared to prior periods
Facilities and ServicesUtilities and Energy Services
(KV) Liberal Arts & Sciences Energy Report 2014
Annualized BTU/SQFT (EUI)
266,908
185,253
0 60,000 120,000 180,000 240,000 300,000
College BTU/SQFT
Campus BTU/SQFT AVG
BTU/SQFT
College Comparison | Currently your college utilizes
*The energy index combines natural gas (therms), chilled water (MBtu), Steam (Klbs), electricity (KWh) into a single measurement.
44.08% MORE Energy than the Campus average.Campus Energy Utility Index (EUI) is calculated by deriving the total BTUs consumed by net assignable square feet for your college.
College Comparison
274,020 265,633 260,082 266,908
$10,988,611
$10,185,993
$10,348,728$10,375,848
250,000
255,000
260,000
265,000
270,000
275,000
280,000
2011 2012 2013 2014
BTU PER
SQFT
$9,600,000
$9,800,000
$10,000,000
$10,200,000
$10,400,000
$10,600,000
$10,800,000
$11,000,000
$11,200,000
Cost
BTU_PER_SQFT YTD_COST
Comparing last year's usage to this year's usage you have utilized 2.62% MORE energy than the prior year.
Commodity Comparison
147,640
136,270
140,092
134,156
12,607
14,925
14,693
290,970
265,115
260,903
287,594
146,782
166,748
152,684
147,084
13,684
0
50,000
100,000
150,000
200,000
250,000
300,000
350,000
2011 2012 2013 2014
MBT
U
ELEC NG STEAM ChW
FY14 Results
Building Type Avg of BTU_PER_SQFTRecreation/Athletic Center/Gymnasium 335,758.78 Medical Office/Clinic 293,505.43 Laboratory 212,882.62 Classrooms/Educational/Library 174,547.77 Office 173,283.46 Dormitory/Ward 95,832.73 Source: F&S Energy Billing System
EUI Rankings by UIUC Building Type
Business Applications Database: Sourced from EBS and ARCHIBUS9/4/2014Printed:

The purpose of this report is to:
*Provide Information concerning energy cost
*Track your energy utilization compared to prior periods
Facilities and ServicesUtilities and Energy Services
(KP) Engineering Energy Report 2014
Annualized BTU/SQFT (EUI)
253,962
185,253
0 60,000 120,000 180,000 240,000 300,000
College BTU/SQFT
Campus BTU/SQFT AVG
BTU/SQFT
College Comparison | Currently your college utilizes
*The energy index combines natural gas (therms), chilled water (MBtu), Steam (Klbs), electricity (KWh) into a single measurement.
37.09% MORE Energy than the Campus average.Campus Energy Utility Index (EUI) is calculated by deriving the total BTUs consumed by net assignable square feet for your college.
College Comparison
261,007 256,917 255,049 253,962
$10,121,375
$10,037,692
$9,944,293
$9,851,361
250,000
252,000
254,000
256,000
258,000
260,000
262,000
2011 2012 2013 2014
BTU PER
SQFT
$9,700,000
$9,750,000
$9,800,000
$9,850,000
$9,900,000
$9,950,000
$10,000,000
$10,050,000
$10,100,000
$10,150,000
Cost
BTU_PER_SQFT YTD_COST
Comparing last year's usage to this year's usage you have utilized 0.43% LESS energy than the prior year.
Commodity Comparison
139,728
134,953
141,106
138,914
311
339
787
223,064
211,592
224,559
228,798
203,784
210,988
187,783
182,930
147
0
50,000
100,000
150,000
200,000
250,000
2011 2012 2013 2014
MBT
U
ELEC NG STEAM ChW
FY14 Results
Building Type Avg of BTU_PER_SQFTRecreation/Athletic Center/Gymnasium 335,758.78 Medical Office/Clinic 293,505.43 Laboratory 212,882.62 Classrooms/Educational/Library 174,547.77 Office 173,283.46 Dormitory/Ward 95,832.73 Source: F&S Energy Billing System
EUI Rankings by UIUC Building Type
Business Applications Database: Sourced from EBS and ARCHIBUS9/4/2014Printed:
The purpose of this report is to:
*Provide Information concerning energy cost
*Track your energy utilization compared to prior periods
Facilities and ServicesUtilities and Energy Services
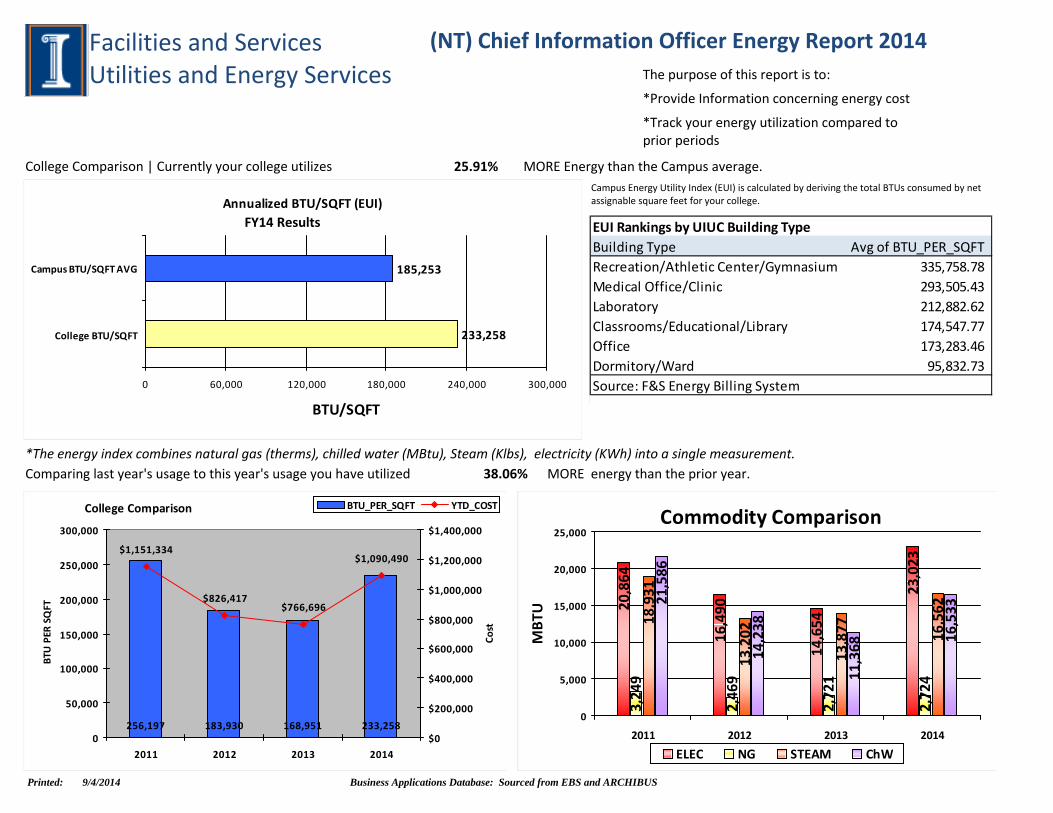
(NT) Chief Information Officer Energy Report 2014
Annualized BTU/SQFT (EUI)
233,258
185,253
0 60,000 120,000 180,000 240,000 300,000
College BTU/SQFT
Campus BTU/SQFT AVG
BTU/SQFT
College Comparison | Currently your college utilizes
*The energy index combines natural gas (therms), chilled water (MBtu), Steam (Klbs), electricity (KWh) into a single measurement.
25.91% MORE Energy than the Campus average.Campus Energy Utility Index (EUI) is calculated by deriving the total BTUs consumed by net assignable square feet for your college.
College Comparison
256,197 183,930 168,951 233,258
$1,151,334
$766,696
$1,090,490
$826,417
0
50,000
100,000
150,000
200,000
250,000
300,000
2011 2012 2013 2014
BTU PER
SQFT
$0
$200,000
$400,000
$600,000
$800,000
$1,000,000
$1,200,000
$1,400,000
Cost
BTU_PER_SQFT YTD_COST
Comparing last year's usage to this year's usage you have utilized 38.06% MORE energy than the prior year.
Commodity Comparison
20,864
16,490
14,654
23,023
2,469
2,721
2,724
18,931
13,202
13,877 16,56221
,586
14,238
11,368 16
,533
3,249
0
5,000
10,000
15,000
20,000
25,000
2011 2012 2013 2014
MBT
U
ELEC NG STEAM ChW
FY14 Results
Building Type Avg of BTU_PER_SQFTRecreation/Athletic Center/Gymnasium 335,758.78 Medical Office/Clinic 293,505.43 Laboratory 212,882.62 Classrooms/Educational/Library 174,547.77 Office 173,283.46 Dormitory/Ward 95,832.73 Source: F&S Energy Billing System
EUI Rankings by UIUC Building Type
Business Applications Database: Sourced from EBS and ARCHIBUS9/4/2014Printed:

Thepurposeofthisreportisto:*ProvideInformationconcerningenergycost*Trackyourenergyutilizationcomparedtopriorperiods
FacilitiesandServicesUtilitiesandEnergy
(KN) Education Energy Report 2014
Annualized BTU/SQFT (EUI)
191,429
185,253
0 60,000 120,000 180,000 240,000
College BTU/SQFT
Campus BTU/SQFT AVG
BTU/SQFT
CollegeComparison|Currentlyyourcollegeutilizes
*Theenergyindexcombinesnaturalgas(therms),chilledwater(MBtu),Steam(Klbs),electricity(KWh)intoasinglemeasurement.
3.33% MOREEnergythantheCampusaverage.CampusEnergyUtilityIndex(EUI)iscalculatedbyderivingthetotalBTUsconsumedbynetassignablesquarefeetforyourcollege.
College Comparison
214,310 179,047 185,036 191,429
$565,333
$510,432 $510,778
$481,369
160,000
170,000
180,000
190,000
200,000
210,000
220,000
2011 2012 2013 2014
BTU PER
SQFT
$420,000
$440,000
$460,000
$480,000
$500,000
$520,000
$540,000
$560,000
$580,000
Cost
BTU_PER_SQFT YTD_COST
Comparinglastyear'susagetothisyear'susageyouhaveutilized 3.46% MOREenergythantheprioryear.
Commodity Comparison
7,038
6,341
6,038
5,731
3,840
4,521
5,123
10,990
9,902
11,058
11,949
9,805
9,657
9,116
8,993
7,765
0
2,000
4,000
6,000
8,000
10,000
12,000
14,000
2011 2012 2013 2014
MBT
U
ELEC NG STEAM ChW
FY14Results
Building Type Avg of BTU_PER_SQFTRecreation/Athletic Center/Gymnasium 335,758.78 Medical Office/Clinic 293,505.43 Laboratory 212,882.62 Classrooms/Educational/Library 174,547.77 Office 173,283.46 Dormitory/Ward 95,832.73 Source: F&S Energy Billing System
EUI Rankings by UIUC Building Type
Business Applications Database: Sourced from EBS and ARCHIBUS9/4/2014Printed:

Thepurposeofthisreportisto:*ProvideInformationconcerningenergycost*Trackyourenergyutilizationcomparedtopriorperiods
FacilitiesandServicesUtilitiesandEnergy
(KT) College of Media Energy Report 2014
Annualized BTU/SQFT (EUI)
166,785
185,253
0 60,000 120,000 180,000 240,000
College BTU/SQFT
Campus BTU/SQFT AVG
BTU/SQFT
CollegeComparison|Currentlyyourcollegeutilizes
*Theenergyindexcombinesnaturalgas(therms),chilledwater(MBtu),Steam(Klbs),electricity(KWh)intoasinglemeasurement.
9.97% LESSEnergythantheCampusaverage.CampusEnergyUtilityIndex(EUI)iscalculatedbyderivingthetotalBTUsconsumedbynetassignablesquarefeetforyourcollege.
College Comparison
236,395 173,981 146,731 166,785
$336,619
$226,167
$265,517$272,331
0
50,000
100,000
150,000
200,000
250,000
2011 2012 2013 2014
BTU PER
SQFT
$0
$50,000
$100,000
$150,000
$200,000
$250,000
$300,000
$350,000
$400,000
Cost
BTU_PER_SQFT YTD_COST
Comparinglastyear'susagetothisyear'susageyouhaveutilized 13.67% MOREenergythantheprioryear.
Commodity Comparison
7,741
6,400
5,535 7,348
6,238
5,484
6,003
2,053
2,566
2,350
2,067
1,431
1,775
951
859
11,845
0
2,000
4,000
6,000
8,000
10,000
12,000
14,000
2011 2012 2013 2014
MBT
U
ELEC NG STEAM ChW
FY14Results
Building Type Avg of BTU_PER_SQFTRecreation/Athletic Center/Gymnasium 335,758.78 Medical Office/Clinic 293,505.43 Laboratory 212,882.62 Classrooms/Educational/Library 174,547.77 Office 173,283.46 Dormitory/Ward 95,832.73 Source: F&S Energy Billing System
EUI Rankings by UIUC Building Type
Business Applications Database: Sourced from EBS and ARCHIBUS9/4/2014Printed:
Thepurposeofthisreportisto:*ProvideInformationconcerningenergycost*Trackyourenergyutilizationcomparedtopriorperiods
FacilitiesandServicesUtilitiesandEnergy
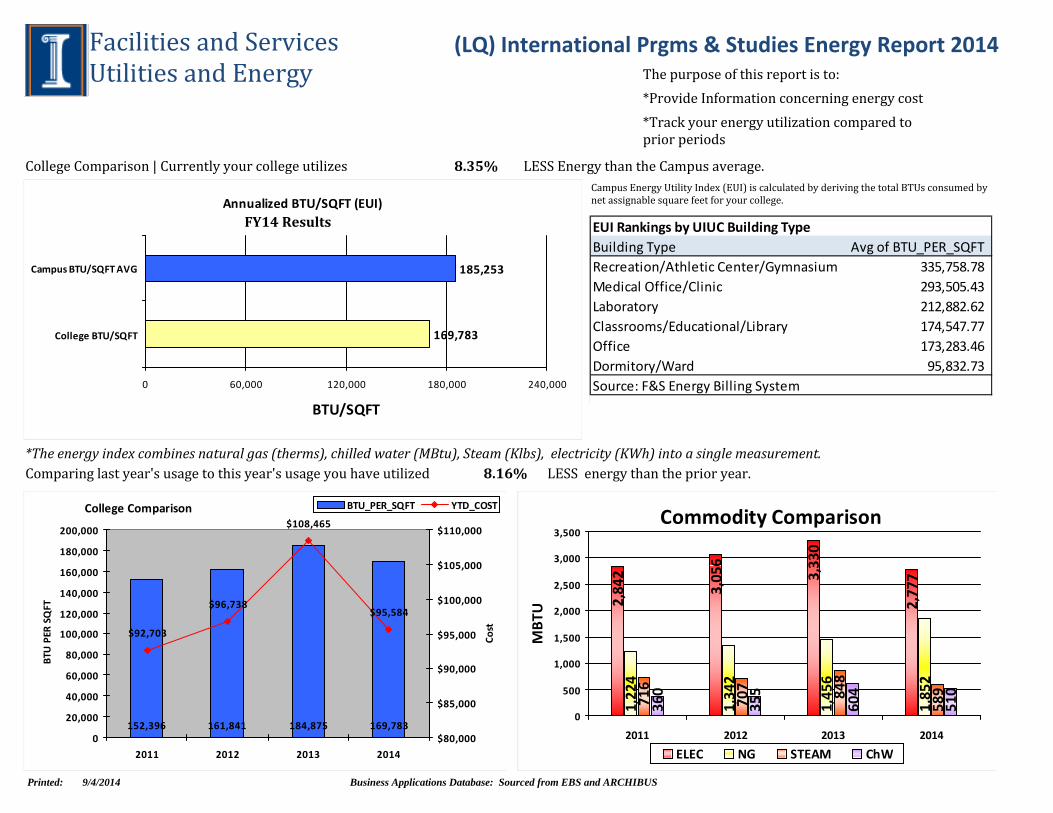
(LQ) International Prgms & Studies Energy Report 2014
Annualized BTU/SQFT (EUI)
169,783
185,253
0 60,000 120,000 180,000 240,000
College BTU/SQFT
Campus BTU/SQFT AVG
BTU/SQFT
CollegeComparison|Currentlyyourcollegeutilizes
*Theenergyindexcombinesnaturalgas(therms),chilledwater(MBtu),Steam(Klbs),electricity(KWh)intoasinglemeasurement.
8.35% LESSEnergythantheCampusaverage.CampusEnergyUtilityIndex(EUI)iscalculatedbyderivingthetotalBTUsconsumedbynetassignablesquarefeetforyourcollege.
College Comparison
152,396 161,841 184,875 169,783
$92,703
$108,465
$95,584$96,738
0
20,000
40,000
60,000
80,000
100,000
120,000
140,000
160,000
180,000
200,000
2011 2012 2013 2014
BTU PER
SQFT
$80,000
$85,000
$90,000
$95,000
$100,000
$105,000
$110,000
Cost
BTU_PER_SQFT YTD_COST
Comparinglastyear'susagetothisyear'susageyouhaveutilized 8.16% LESSenergythantheprioryear.
Commodity Comparison
2,842
3,056
3,330
2,777
1,342
1,456
1,852
716
707 848
589
360
355
604
510
1,224
0
500
1,000
1,500
2,000
2,500
3,000
3,500
2011 2012 2013 2014
MBT
U
ELEC NG STEAM ChW
FY14Results
Building Type Avg of BTU_PER_SQFTRecreation/Athletic Center/Gymnasium 335,758.78 Medical Office/Clinic 293,505.43 Laboratory 212,882.62 Classrooms/Educational/Library 174,547.77 Office 173,283.46 Dormitory/Ward 95,832.73 Source: F&S Energy Billing System
EUI Rankings by UIUC Building Type
Business Applications Database: Sourced from EBS and ARCHIBUS9/4/2014Printed:

Thepurposeofthisreportisto:*ProvideInformationconcerningenergycost*Trackyourenergyutilizationcomparedtopriorperiods
FacilitiesandServicesUtilitiesandEnergy
(KL) Agr Consumer & Env Sciences Energy Report 2014
Annualized BTU/SQFT (EUI)
170,863
185,253
0 60,000 120,000 180,000 240,000
College BTU/SQFT
Campus BTU/SQFT AVG
BTU/SQFT
CollegeComparison|Currentlyyourcollegeutilizes
*Theenergyindexcombinesnaturalgas(therms),chilledwater(MBtu),Steam(Klbs),electricity(KWh)intoasinglemeasurement.
7.77% LESSEnergythantheCampusaverage.CampusEnergyUtilityIndex(EUI)iscalculatedbyderivingthetotalBTUsconsumedbynetassignablesquarefeetforyourcollege.
College Comparison
161,269 155,030 161,258 170,863
$5,642,972
$5,452,755
$5,732,355
$5,336,685
145,000
150,000
155,000
160,000
165,000
170,000
175,000
2011 2012 2013 2014
BTU PER
SQFT
$5,100,000
$5,200,000
$5,300,000
$5,400,000
$5,500,000
$5,600,000
$5,700,000
$5,800,000
Cost
BTU_PER_SQFT YTD_COST
Comparinglastyear'susagetothisyear'susageyouhaveutilized 5.96% MOREenergythantheprioryear.
Commodity Comparison
84,769
81,604
82,143
83,753
24,309
30,207
32,610
134,765
129,348
140,229
152,354
60,974
63,348
58,026
60,389
30,119
0
20,000
40,000
60,000
80,000
100,000
120,000
140,000
160,000
2011 2012 2013 2014
MBT
U
ELEC NG STEAM ChW
FY14Results
Building Type Avg of BTU_PER_SQFTRecreation/Athletic Center/Gymnasium 335,758.78 Medical Office/Clinic 293,505.43 Laboratory 212,882.62 Classrooms/Educational/Library 174,547.77 Office 173,283.46 Dormitory/Ward 95,832.73 Source: F&S Energy Billing System
EUI Rankings by UIUC Building Type
Business Applications Database: Sourced from EBS and ARCHIBUS9/4/2014Printed:

Thepurposeofthisreportisto:*ProvideInformationconcerningenergycost*Trackyourenergyutilizationcomparedtopriorperiods
FacilitiesandServicesUtilitiesandEnergy
(KU) Law Energy Report 2014
Annualized BTU/SQFT (EUI)
146,672
185,253
0 60,000 120,000 180,000 240,000
College BTU/SQFT
Campus BTU/SQFT AVG
BTU/SQFT
CollegeComparison|Currentlyyourcollegeutilizes
*Theenergyindexcombinesnaturalgas(therms),chilledwater(MBtu),Steam(Klbs),electricity(KWh)intoasinglemeasurement.
20.83% LESSEnergythantheCampusaverage.CampusEnergyUtilityIndex(EUI)iscalculatedbyderivingthetotalBTUsconsumedbynetassignablesquarefeetforyourcollege.
College Comparison
164,552 186,360 144,061 146,672
$636,562
$517,605 $526,883
$699,610
0
20,000
40,000
60,000
80,000
100,000
120,000
140,000
160,000
180,000
200,000
2011 2012 2013 2014
BTU PER
SQFT
$0
$100,000
$200,000
$300,000
$400,000
$500,000
$600,000
$700,000
$800,000
Cost
BTU_PER_SQFT YTD_COST
Comparinglastyear'susagetothisyear'susageyouhaveutilized 1.81% MOREenergythantheprioryear.
Commodity Comparison
11,422
11,346
10,795
10,762
196
269
169
19,413 23
,604
16,105
16,731
198
0
5,000
10,000
15,000
20,000
25,000
2011 2012 2013 2014
MBT
U
ELEC NG STEAM ChW
FY14Results
Building Type Avg of BTU_PER_SQFTRecreation/Athletic Center/Gymnasium 335,758.78 Medical Office/Clinic 293,505.43 Laboratory 212,882.62 Classrooms/Educational/Library 174,547.77 Office 173,283.46 Dormitory/Ward 95,832.73 Source: F&S Energy Billing System
EUI Rankings by UIUC Building Type
Business Applications Database: Sourced from EBS and ARCHIBUS9/4/2014Printed:

Thepurposeofthisreportisto:*ProvideInformationconcerningenergycost*Trackyourenergyutilizationcomparedtopriorperiods
FacilitiesandServicesUtilitiesandEnergy
(LR) University Library Energy Report 2014
Annualized BTU/SQFT (EUI)
115,874
185,253
0 60,000 120,000 180,000 240,000
College BTU/SQFT
Campus BTU/SQFT AVG
BTU/SQFT
CollegeComparison|Currentlyyourcollegeutilizes
*Theenergyindexcombinesnaturalgas(therms),chilledwater(MBtu),Steam(Klbs),electricity(KWh)intoasinglemeasurement.
37.45% LESSEnergythantheCampusaverage.CampusEnergyUtilityIndex(EUI)iscalculatedbyderivingthetotalBTUsconsumedbynetassignablesquarefeetforyourcollege.
College Comparison
199,043 167,619 126,076 115,874
$3,667,206
$2,275,280$2,074,731
$3,055,884
0
50,000
100,000
150,000
200,000
250,000
2011 2012 2013 2014
BTU PER
SQFT
$0
$500,000
$1,000,000
$1,500,000
$2,000,000
$2,500,000
$3,000,000
$3,500,000
$4,000,000
Cost
BTU_PER_SQFT YTD_COST
Comparinglastyear'susagetothisyear'susageyouhaveutilized 8.09% LESSenergythantheprioryear.
Commodity Comparison
34,720
32,442
30,229
28,331
8,618
8,799
8,292
112,419
91,040
63,917
47,478
49,435
40,798
27,100
35,421
8,737
0
20,000
40,000
60,000
80,000
100,000
120,000
2011 2012 2013 2014
MBT
U
ELEC NG STEAM ChW
FY14Results
Building Type Avg of BTU_PER_SQFTRecreation/Athletic Center/Gymnasium 335,758.78 Medical Office/Clinic 293,505.43 Laboratory 212,882.62 Classrooms/Educational/Library 174,547.77 Office 173,283.46 Dormitory/Ward 95,832.73 Source: F&S Energy Billing System
EUI Rankings by UIUC Building Type
Business Applications Database: Sourced from EBS and ARCHIBUS9/4/2014Printed:

Thepurposeofthisreportisto:*ProvideInformationconcerningenergycost*Trackyourenergyutilizationcomparedtopriorperiods
FacilitiesandServicesUtilitiesandEnergy
(KR) Fine & Applied Arts Energy Report 2014
Annualized BTU/SQFT (EUI)
127,710
185,253
0 60,000 120,000 180,000 240,000
College BTU/SQFT
Campus BTU/SQFT AVG
BTU/SQFT
CollegeComparison|Currentlyyourcollegeutilizes
*Theenergyindexcombinesnaturalgas(therms),chilledwater(MBtu),Steam(Klbs),electricity(KWh)intoasinglemeasurement.
31.06% LESSEnergythantheCampusaverage.CampusEnergyUtilityIndex(EUI)iscalculatedbyderivingthetotalBTUsconsumedbynetassignablesquarefeetforyourcollege.
College Comparison
149,027 149,692 156,043 127,710
$2,443,331 $2,446,899
$1,958,188
$2,398,408
0
20,000
40,000
60,000
80,000
100,000
120,000
140,000
160,000
180,000
2011 2012 2013 2014
BTU PER
SQFT
$0
$500,000
$1,000,000
$1,500,000
$2,000,000
$2,500,000
$3,000,000
Cost
BTU_PER_SQFT YTD_COST
Comparinglastyear'susagetothisyear'susageyouhaveutilized 18.16% LESSenergythantheprioryear.
Commodity Comparison
33,155
32,268
32,804
23,382
3,869
4,970
5,277
68,016
68,229
73,363
60,490
24,113
26,370
25,145
22,389
4,871
0
10,000
20,000
30,000
40,000
50,000
60,000
70,000
80,000
2011 2012 2013 2014
MBT
U
ELEC NG STEAM ChW
FY14Results
Building Type Avg of BTU_PER_SQFTRecreation/Athletic Center/Gymnasium 335,758.78 Medical Office/Clinic 293,505.43 Laboratory 212,882.62 Classrooms/Educational/Library 174,547.77 Office 173,283.46 Dormitory/Ward 95,832.73 Source: F&S Energy Billing System
EUI Rankings by UIUC Building Type
Business Applications Database: Sourced from EBS and ARCHIBUS9/4/2014Printed:
Thepurposeofthisreportisto:*ProvideInformationconcerningenergycost*Trackyourenergyutilizationcomparedtopriorperiods
FacilitiesandServicesUtilitiesandEnergy
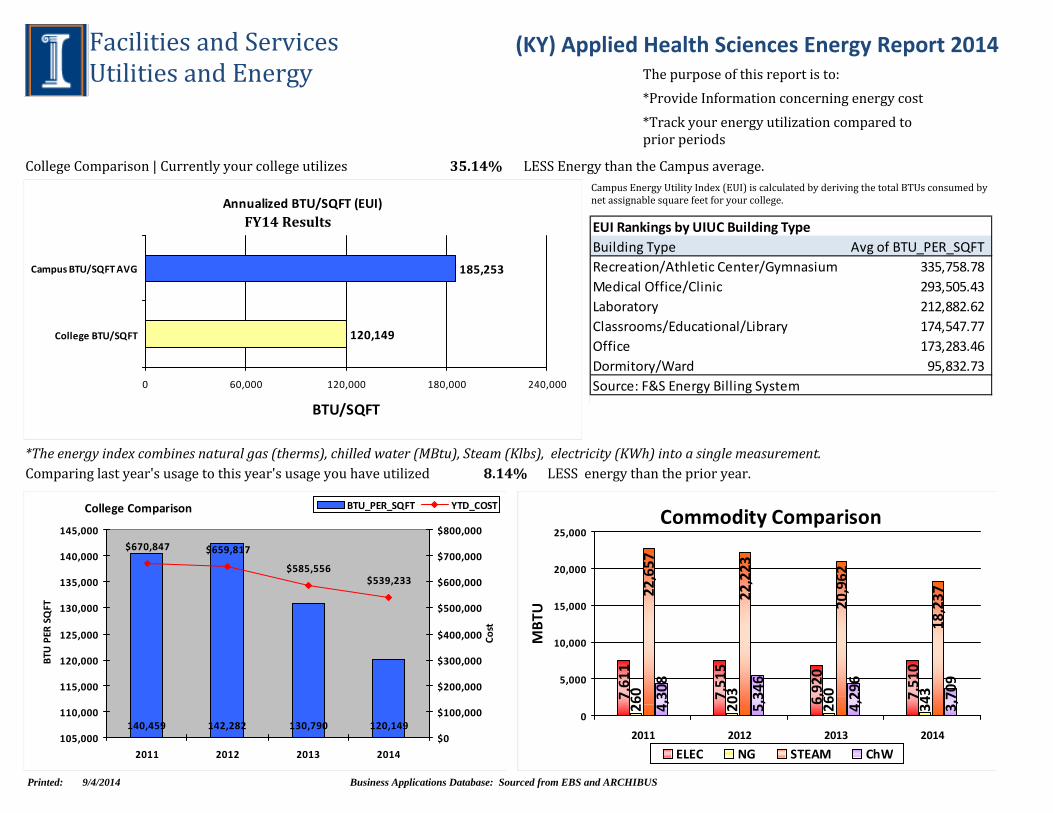
(KY) Applied Health Sciences Energy Report 2014
Annualized BTU/SQFT (EUI)
120,149
185,253
0 60,000 120,000 180,000 240,000
College BTU/SQFT
Campus BTU/SQFT AVG
BTU/SQFT
CollegeComparison|Currentlyyourcollegeutilizes
*Theenergyindexcombinesnaturalgas(therms),chilledwater(MBtu),Steam(Klbs),electricity(KWh)intoasinglemeasurement.
35.14% LESSEnergythantheCampusaverage.CampusEnergyUtilityIndex(EUI)iscalculatedbyderivingthetotalBTUsconsumedbynetassignablesquarefeetforyourcollege.
College Comparison
140,459 142,282 130,790 120,149
$670,847
$585,556$539,233
$659,817
105,000
110,000
115,000
120,000
125,000
130,000
135,000
140,000
145,000
2011 2012 2013 2014
BTU PER
SQFT
$0
$100,000
$200,000
$300,000
$400,000
$500,000
$600,000
$700,000
$800,000
Cost
BTU_PER_SQFT YTD_COST
Comparinglastyear'susagetothisyear'susageyouhaveutilized 8.14% LESSenergythantheprioryear.
Commodity Comparison
7,611
7,515
6,920
7,510
203
260
343
22,657
22,223
20,962
18,237
4,308
5,346
4,296
3,709
260
0
5,000
10,000
15,000
20,000
25,000
2011 2012 2013 2014
MBT
U
ELEC NG STEAM ChW
FY14Results
Building Type Avg of BTU_PER_SQFTRecreation/Athletic Center/Gymnasium 335,758.78 Medical Office/Clinic 293,505.43 Laboratory 212,882.62 Classrooms/Educational/Library 174,547.77 Office 173,283.46 Dormitory/Ward 95,832.73 Source: F&S Energy Billing System
EUI Rankings by UIUC Building Type
Business Applications Database: Sourced from EBS and ARCHIBUS9/4/2014Printed:

Thepurposeofthisreportisto:*ProvideInformationconcerningenergycost*Trackyourenergyutilizationcomparedtopriorperiods
FacilitiesandServicesUtilitiesandEnergy
(NJ) VC Student Affairs Energy Report 2014
Annualized BTU/SQFT (EUI)
114,237
185,253
0 60,000 120,000 180,000 240,000
College BTU/SQFT
Campus BTU/SQFT AVG
BTU/SQFT
CollegeComparison|Currentlyyourcollegeutilizes
*Theenergyindexcombinesnaturalgas(therms),chilledwater(MBtu),Steam(Klbs),electricity(KWh)intoasinglemeasurement.
38.33% LESSEnergythantheCampusaverage.CampusEnergyUtilityIndex(EUI)iscalculatedbyderivingthetotalBTUsconsumedbynetassignablesquarefeetforyourcollege.
College Comparison
138,328 134,448 143,142 114,237
$221,453 $218,828
$173,077
$212,143
0
20,000
40,000
60,000
80,000
100,000
120,000
140,000
160,000
2011 2012 2013 2014
BTU PER
SQFT
$0
$50,000
$100,000
$150,000
$200,000
$250,000
Cost
BTU_PER_SQFT YTD_COST
Comparinglastyear'susagetothisyear'susageyouhaveutilized 20.19% LESSenergythantheprioryear.
Commodity Comparison
3,360
3,728
3,595
3,094
754
1,372
1,544
5,360
4,969
5,443
3,317
1,654
2,178
1,970
1,925
1,590
0
1,000
2,000
3,000
4,000
5,000
6,000
2011 2012 2013 2014
MBT
U
ELEC NG STEAM ChW
FY14Results
Building Type Avg of BTU_PER_SQFTRecreation/Athletic Center/Gymnasium 335,758.78 Medical Office/Clinic 293,505.43 Laboratory 212,882.62 Classrooms/Educational/Library 174,547.77 Office 173,283.46 Dormitory/Ward 95,832.73 Source: F&S Energy Billing System
EUI Rankings by UIUC Building Type
Business Applications Database: Sourced from EBS and ARCHIBUS9/4/2014Printed:
Thepurposeofthisreportisto:*ProvideInformationconcerningenergycost*Trackyourenergyutilizationcomparedtopriorperiods
FacilitiesandServicesUtilitiesandEnergy
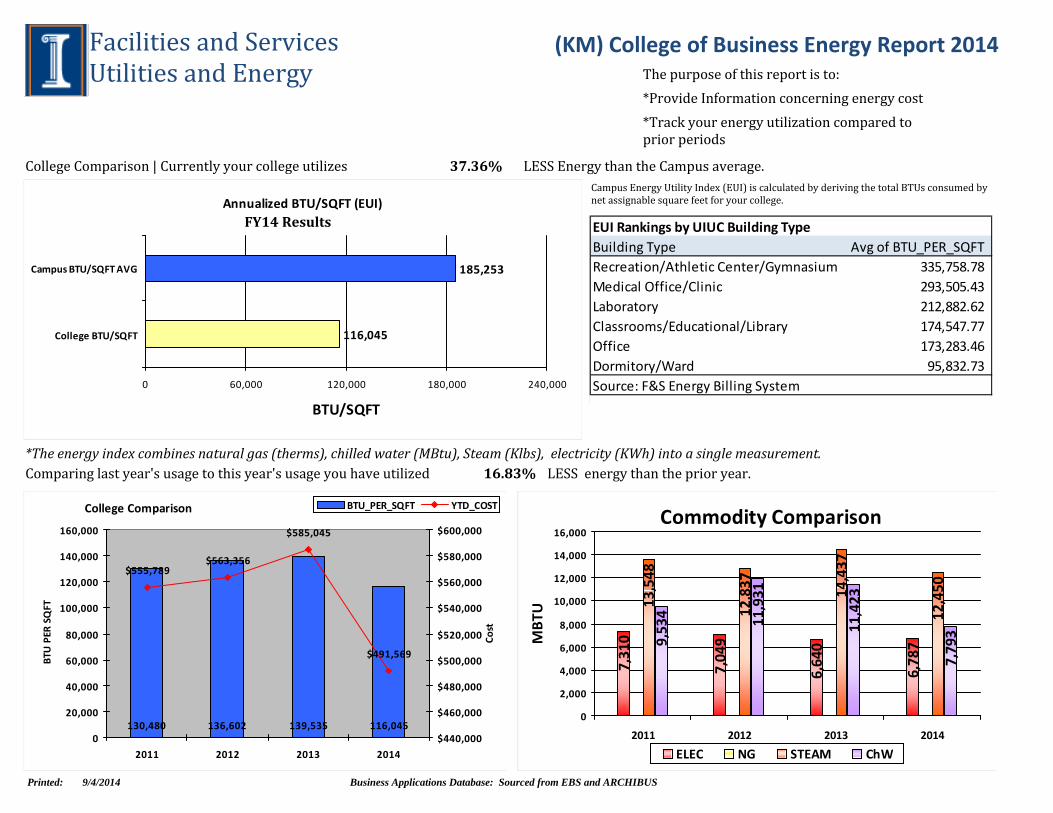
(KM) College of Business Energy Report 2014
Annualized BTU/SQFT (EUI)
116,045
185,253
0 60,000 120,000 180,000 240,000
College BTU/SQFT
Campus BTU/SQFT AVG
BTU/SQFT
CollegeComparison|Currentlyyourcollegeutilizes
*Theenergyindexcombinesnaturalgas(therms),chilledwater(MBtu),Steam(Klbs),electricity(KWh)intoasinglemeasurement.
37.36% LESSEnergythantheCampusaverage.CampusEnergyUtilityIndex(EUI)iscalculatedbyderivingthetotalBTUsconsumedbynetassignablesquarefeetforyourcollege.
College Comparison
130,480 136,602 139,535 116,045
$555,789
$585,045
$491,569
$563,356
0
20,000
40,000
60,000
80,000
100,000
120,000
140,000
160,000
2011 2012 2013 2014
BTU PER
SQFT
$440,000
$460,000
$480,000
$500,000
$520,000
$540,000
$560,000
$580,000
$600,000
Cost
BTU_PER_SQFT YTD_COST
Comparinglastyear'susagetothisyear'susageyouhaveutilized 16.83% LESSenergythantheprioryear.
Commodity Comparison
7,310
7,049
6,640
6,787
13,548
12,837 14,437
12,450
9,534 11,931
11,423
7,793
0
2,000
4,000
6,000
8,000
10,000
12,000
14,000
16,000
2011 2012 2013 2014
MBT
U
ELEC NG STEAM ChW
FY14Results
Building Type Avg of BTU_PER_SQFTRecreation/Athletic Center/Gymnasium 335,758.78 Medical Office/Clinic 293,505.43 Laboratory 212,882.62 Classrooms/Educational/Library 174,547.77 Office 173,283.46 Dormitory/Ward 95,832.73 Source: F&S Energy Billing System
EUI Rankings by UIUC Building Type
Business Applications Database: Sourced from EBS and ARCHIBUS9/4/2014Printed:

Thepurposeofthisreportisto:*ProvideInformationconcerningenergycost*Trackyourenergyutilizationcomparedtopriorperiods
FacilitiesandServicesUtilitiesandEnergy
(NQ) Auxiliary Units Energy Report 2014
(Housing,IlliniUnion,CampusRecreation,StudentServices,ConferenceCenter)
Annualized BTU/SQFT (EUI)
137,806
185,253
0 60,000 120,000 180,000 240,000
College BTU/SQFT
Campus BTU/SQFT AVG
BTU/SQFT
CollegeComparison|Currentlyyourcollegeutilizes
*Theenergyindexcombinesnaturalgas(therms),chilledwater(MBtu),Steam(Klbs),electricity(KWh)intoasinglemeasurement.
25.61% LESSEnergythantheCampusaverage.CampusEnergyUtilityIndex(EUI)iscalculatedbyderivingthetotalBTUsconsumedbynetassignablesquarefeetforyourcollege.
College Comparison
121,060 122,757 122,831 137,806
$10,090,574
$9,827,162
$10,940,663
$9,946,118
110,000
115,000
120,000
125,000
130,000
135,000
140,000
2011 2012 2013 2014
BTU PER
SQFT
$9,200,000
$9,400,000
$9,600,000
$9,800,000
$10,000,000
$10,200,000
$10,400,000
$10,600,000
$10,800,000
$11,000,000
$11,200,000
Cost
BTU_PER_SQFT YTD_COST
Comparinglastyear'susagetothisyear'susageyouhaveutilized 12.19% MOREenergythantheprioryear.
Commodity Comparison
126,463
124,688
116,489
129,114
13,060
13,284
13,678
284,008
281,941
294,229
336,617
121,105
133,098
129,117
141,145
13,571
0
50,000
100,000
150,000
200,000
250,000
300,000
350,000
400,000
2011 2012 2013 2014
MBT
U
ELEC NG STEAM ChW
FY14Results
Building Type Avg of BTU_PER_SQFTRecreation/Athletic Center/Gymnasium 335,758.78 Medical Office/Clinic 293,505.43 Laboratory 212,882.62 Classrooms/Educational/Library 174,547.77 Office 173,283.46 Dormitory/Ward 95,832.73 Source: F&S Energy Billing System
EUI Rankings by UIUC Building Type
Business Applications Database: Sourced from EBS and ARCHIBUS9/4/2014Printed:
Thepurposeofthisreportisto:*ProvideInformationconcerningenergycost*Trackyourenergyutilizationcomparedtopriorperiods
FacilitiesandServicesUtilitiesandEnergy
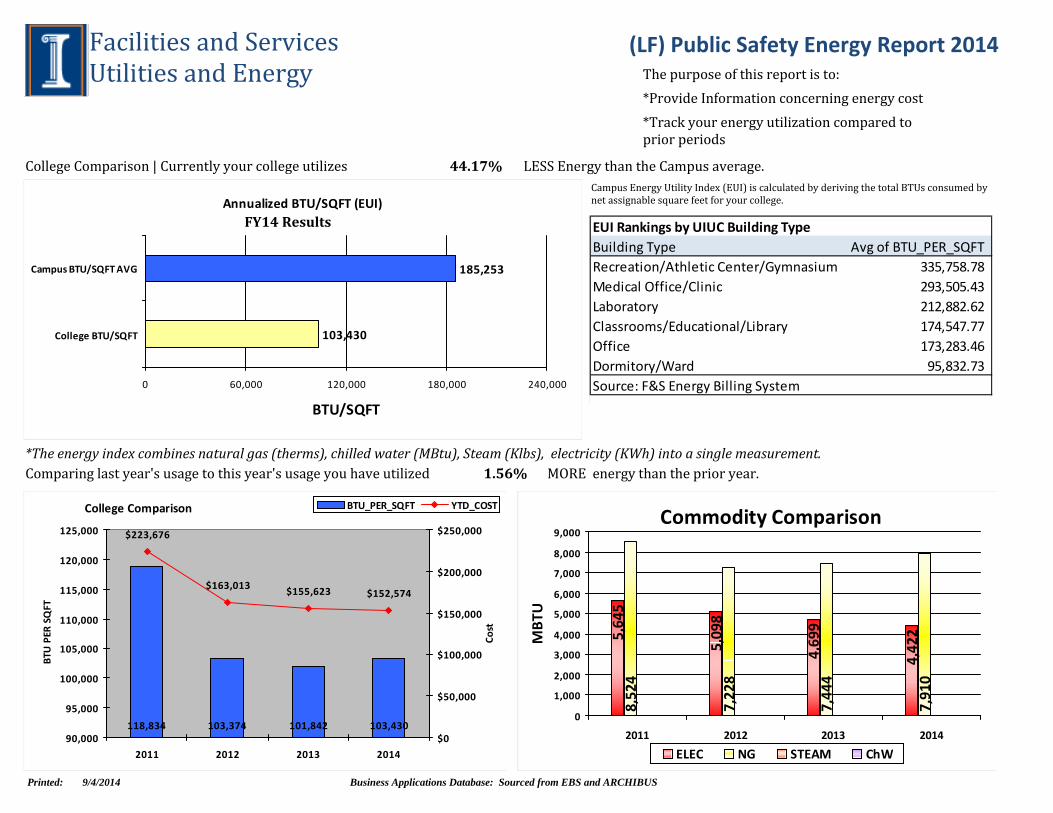
(LF) Public Safety Energy Report 2014
Annualized BTU/SQFT (EUI)
103,430
185,253
0 60,000 120,000 180,000 240,000
College BTU/SQFT
Campus BTU/SQFT AVG
BTU/SQFT
CollegeComparison|Currentlyyourcollegeutilizes
*Theenergyindexcombinesnaturalgas(therms),chilledwater(MBtu),Steam(Klbs),electricity(KWh)intoasinglemeasurement.
44.17% LESSEnergythantheCampusaverage.CampusEnergyUtilityIndex(EUI)iscalculatedbyderivingthetotalBTUsconsumedbynetassignablesquarefeetforyourcollege.
College Comparison
118,834 103,374 101,842 103,430
$223,676
$155,623 $152,574$163,013
90,000
95,000
100,000
105,000
110,000
115,000
120,000
125,000
2011 2012 2013 2014
BTU PER
SQFT
$0
$50,000
$100,000
$150,000
$200,000
$250,000
Cost
BTU_PER_SQFT YTD_COST
Comparinglastyear'susagetothisyear'susageyouhaveutilized 1.56% MOREenergythantheprioryear.
Commodity Comparison
5,645
5,098
4,699
4,422
7,228
7,444
7,910
8,524
0
1,000
2,000
3,000
4,000
5,000
6,000
7,000
8,000
9,000
2011 2012 2013 2014
MBT
U
ELEC NG STEAM ChW
FY14Results
Building Type Avg of BTU_PER_SQFTRecreation/Athletic Center/Gymnasium 335,758.78 Medical Office/Clinic 293,505.43 Laboratory 212,882.62 Classrooms/Educational/Library 174,547.77 Office 173,283.46 Dormitory/Ward 95,832.73 Source: F&S Energy Billing System
EUI Rankings by UIUC Building Type
Business Applications Database: Sourced from EBS and ARCHIBUS9/4/2014Printed:

Thepurposeofthisreportisto:*ProvideInformationconcerningenergycost*Trackyourenergyutilizationcomparedtopriorperiods
FacilitiesandServicesUtilitiesandEnergy
(NU) Div Intercollegiate Athletics Energy Report 2014
Annualized BTU/SQFT (EUI)
97,316
185,253
0 60,000 120,000 180,000 240,000
College BTU/SQFT
Campus BTU/SQFT AVG
BTU/SQFT
CollegeComparison|Currentlyyourcollegeutilizes
*Theenergyindexcombinesnaturalgas(therms),chilledwater(MBtu),Steam(Klbs),electricity(KWh)intoasinglemeasurement.
47.47% LESSEnergythantheCampusaverage.CampusEnergyUtilityIndex(EUI)iscalculatedbyderivingthetotalBTUsconsumedbynetassignablesquarefeetforyourcollege.
College Comparison
88,397 83,569 85,108 97,316
$2,378,286
$2,162,706
$2,480,302
$2,210,408
75,000
80,000
85,000
90,000
95,000
100,000
2011 2012 2013 2014
BTU PER
SQFT
$2,000,000
$2,100,000
$2,200,000
$2,300,000
$2,400,000
$2,500,000
$2,600,000
Cost
BTU_PER_SQFT YTD_COST
Comparinglastyear'susagetothisyear'susageyouhaveutilized 14.34% MOREenergythantheprioryear.
Commodity Comparison
49,181
50,577
49,885
52,088
16,023
17,925
19,111
51,207
43,743
46,315 59
,385
10,489
9,686
8,115
9,191
16,088
0
10,000
20,000
30,000
40,000
50,000
60,000
70,000
2011 2012 2013 2014
MBT
U
ELEC NG STEAM ChW
FY14Results
Building Type Avg of BTU_PER_SQFTRecreation/Athletic Center/Gymnasium 335,758.78 Medical Office/Clinic 293,505.43 Laboratory 212,882.62 Classrooms/Educational/Library 174,547.77 Office 173,283.46 Dormitory/Ward 95,832.73 Source: F&S Energy Billing System
EUI Rankings by UIUC Building Type
Business Applications Database: Sourced from EBS and ARCHIBUS9/4/2014Printed:

Thepurposeofthisreportisto:*ProvideInformationconcerningenergycost*Trackyourenergyutilizationcomparedtopriorperiods
FacilitiesandServicesUtilitiesandEnergy
(FW) Nursing Energy Report 2014
Annualized BTU/SQFT (EUI)
99,785
185,253
0 60,000 120,000 180,000 240,000
College BTU/SQFT
Campus BTU/SQFT AVG
BTU/SQFT
CollegeComparison|Currentlyyourcollegeutilizes
*Theenergyindexcombinesnaturalgas(therms),chilledwater(MBtu),Steam(Klbs),electricity(KWh)intoasinglemeasurement.
46.14% LESSEnergythantheCampusaverage.CampusEnergyUtilityIndex(EUI)iscalculatedbyderivingthetotalBTUsconsumedbynetassignablesquarefeetforyourcollege.
College Comparison
73,400 73,496 88,287 99,785
$16,447$17,407
$18,442
$15,271
0
20,000
40,000
60,000
80,000
100,000
120,000
2011 2012 2013 2014
BTU PER
SQFT
$0
$2,000
$4,000
$6,000
$8,000
$10,000
$12,000
$14,000
$16,000
$18,000
$20,000
Cost
BTU_PER_SQFT YTD_COST
Comparinglastyear'susagetothisyear'susageyouhaveutilized 13.02% MOREenergythantheprioryear.
Commodity Comparison
125 180
147
128
138
153
193
483
451
625 72
5
4 3 2 2158
0
100
200
300
400
500
600
700
800
2011 2012 2013 2014
MBT
U
ELEC NG STEAM ChW
FY14Results
Building Type Avg of BTU_PER_SQFTRecreation/Athletic Center/Gymnasium 335,758.78 Medical Office/Clinic 293,505.43 Laboratory 212,882.62 Classrooms/Educational/Library 174,547.77 Office 173,283.46 Dormitory/Ward 95,832.73 Source: F&S Energy Billing System
EUI Rankings by UIUC Building Type
Business Applications Database: Sourced from EBS and ARCHIBUS9/4/2014Printed:

Thepurposeofthisreportisto:*ProvideInformationconcerningenergycost*Trackyourenergyutilizationcomparedtopriorperiods
FacilitiesandServicesUtilitiesandEnergy
(KS) Graduate College Energy Report 2014
Annualized BTU/SQFT (EUI)
88,213
185,253
0 60,000 120,000 180,000 240,000
College BTU/SQFT
Campus BTU/SQFT AVG
BTU/SQFT
CollegeComparison|Currentlyyourcollegeutilizes
*Theenergyindexcombinesnaturalgas(therms),chilledwater(MBtu),Steam(Klbs),electricity(KWh)intoasinglemeasurement.
52.38% LESSEnergythantheCampusaverage.CampusEnergyUtilityIndex(EUI)iscalculatedbyderivingthetotalBTUsconsumedbynetassignablesquarefeetforyourcollege.
College Comparison
75,002 64,743 75,756 88,213
$26,112$23,933
$27,653
$22,034
0
10,000
20,000
30,000
40,000
50,000
60,000
70,000
80,000
90,000
100,000
2011 2012 2013 2014
BTU PER
SQFT
$0
$5,000
$10,000
$15,000
$20,000
$25,000
$30,000
Cost
BTU_PER_SQFT YTD_COST
Comparinglastyear'susagetothisyear'susageyouhaveutilized 16.44% MOREenergythantheprioryear.
Commodity Comparison
517
462
452
487
741
624
818
992
0
200
400
600
800
1,000
1,200
2011 2012 2013 2014
MBT
U
ELEC NG STEAM ChW
FY14Results
Building Type Avg of BTU_PER_SQFTRecreation/Athletic Center/Gymnasium 335,758.78 Medical Office/Clinic 293,505.43 Laboratory 212,882.62 Classrooms/Educational/Library 174,547.77 Office 173,283.46 Dormitory/Ward 95,832.73 Source: F&S Energy Billing System
EUI Rankings by UIUC Building Type
Business Applications Database: Sourced from EBS and ARCHIBUS9/4/2014Printed:

Thepurposeofthisreportisto:*ProvideInformationconcerningenergycost*Trackyourenergyutilizationcomparedtopriorperiods
FacilitiesandServicesUtilitiesandEnergy
(KW) Division of General Studies Energy Report 2014
Annualized BTU/SQFT (EUI)
75,874
185,253
0 60,000 120,000 180,000 240,000
College BTU/SQFT
Campus BTU/SQFT AVG
BTU/SQFT
CollegeComparison|Currentlyyourcollegeutilizes
*Theenergyindexcombinesnaturalgas(therms),chilledwater(MBtu),Steam(Klbs),electricity(KWh)intoasinglemeasurement.
59.04% LESSEnergythantheCampusaverage.CampusEnergyUtilityIndex(EUI)iscalculatedbyderivingthetotalBTUsconsumedbynetassignablesquarefeetforyourcollege.
College Comparison
74,495 67,163 71,759 75,874
$16,369
$14,567
$15,390
$14,559
62,000
64,000
66,000
68,000
70,000
72,000
74,000
76,000
78,000
2011 2012 2013 2014
BTU PER
SQFT
$13,500
$14,000
$14,500
$15,000
$15,500
$16,000
$16,500
$17,000
Cost
BTU_PER_SQFT YTD_COST
Comparinglastyear'susagetothisyear'susageyouhaveutilized 5.73% MOREenergythantheprioryear.
Commodity Comparison
277
269
279
293
524
453 492 522
0
100
200
300
400
500
600
2011 2012 2013 2014
MBT
U
ELEC NG STEAM ChW
FY14Results
Building Type Avg of BTU_PER_SQFTRecreation/Athletic Center/Gymnasium 335,758.78 Medical Office/Clinic 293,505.43 Laboratory 212,882.62 Classrooms/Educational/Library 174,547.77 Office 173,283.46 Dormitory/Ward 95,832.73 Source: F&S Energy Billing System
EUI Rankings by UIUC Building Type
Business Applications Database: Sourced from EBS and ARCHIBUS9/4/2014Printed:

Thepurposeofthisreportisto:*ProvideInformationconcerningenergycost*Trackyourenergyutilizationcomparedtopriorperiods
FacilitiesandServicesUtilitiesandEnergy
(LL) School of Social Work Energy Report 2014
Note:AnewelectricmeterwasinstalledintheGregoryPlacelocationinlate2013,accountingforthelargeincreaseinelectricityusage.
Annualized BTU/SQFT (EUI)
94,613
185,253
0 60,000 120,000 180,000 240,000
College BTU/SQFT
Campus BTU/SQFT AVG
BTU/SQFT
CollegeComparison|Currentlyyourcollegeutilizes
*Theenergyindexcombinesnaturalgas(therms),chilledwater(MBtu),Steam(Klbs),electricity(KWh)intoasinglemeasurement.
48.93% LESSEnergythantheCampusaverage.CampusEnergyUtilityIndex(EUI)iscalculatedbyderivingthetotalBTUsconsumedbynetassignablesquarefeetforyourcollege.
College Comparison
42,439 48,047 60,595 94,613
$26,297
$39,613
$66,708
$29,589
0
10,000
20,000
30,000
40,000
50,000
60,000
70,000
80,000
90,000
100,000
2011 2012 2013 2014
BTU PER
SQFT
$0
$10,000
$20,000
$30,000
$40,000
$50,000
$60,000
$70,000
$80,000
Cost
BTU_PER_SQFT YTD_COST
Comparinglastyear'susagetothisyear'susageyouhaveutilized 56.14% MOREenergythantheprioryear.
Commodity Comparison
419
1,511
997
1,121
1,222
1,300
559 641
581 660
0
200
400
600
800
1,000
1,200
1,400
1,600
2011 2012 2013 2014
MBT
U
ELEC NG STEAM ChW
FY14Results
Building Type Avg of BTU_PER_SQFTRecreation/Athletic Center/Gymnasium 335,758.78 Medical Office/Clinic 293,505.43 Laboratory 212,882.62 Classrooms/Educational/Library 174,547.77 Office 173,283.46 Dormitory/Ward 95,832.73 Source: F&S Energy Billing System
EUI Rankings by UIUC Building Type
Business Applications Database: Sourced from EBS and ARCHIBUS9/4/2014Printed:

Thepurposeofthisreportisto:*ProvideInformationconcerningenergycost*Trackyourenergyutilizationcomparedtopriorperiods
FacilitiesandServicesUtilitiesandEnergy
(LD) Armed Forces Energy Report 2014
Annualized BTU/SQFT (EUI)
54,270
185,253
0 60,000 120,000 180,000 240,000
College BTU/SQFT
Campus BTU/SQFT AVG
BTU/SQFT
CollegeComparison|Currentlyyourcollegeutilizes
*Theenergyindexcombinesnaturalgas(therms),chilledwater(MBtu),Steam(Klbs),electricity(KWh)intoasinglemeasurement.
70.70% LESSEnergythantheCampusaverage.CampusEnergyUtilityIndex(EUI)iscalculatedbyderivingthetotalBTUsconsumedbynetassignablesquarefeetforyourcollege.
College Comparison
71,647 51,974 53,274 54,270
$49,238
$36,079 $36,210$35,417
0
10,000
20,000
30,000
40,000
50,000
60,000
70,000
80,000
2011 2012 2013 2014
BTU PER
SQFT
$0
$10,000
$20,000
$30,000
$40,000
$50,000
$60,000
Cost
BTU_PER_SQFT YTD_COST
Comparinglastyear'susagetothisyear'susageyouhaveutilized 1.87% MOREenergythantheprioryear.
Commodity Comparison
767
576 643
559
1,242
916
951
1,043
607
405
351
380
0
200
400
600
800
1,000
1,200
1,400
2011 2012 2013 2014
MBT
U
ELEC NG STEAM ChW
FY14Results
Building Type Avg of BTU_PER_SQFTRecreation/Athletic Center/Gymnasium 335,758.78 Medical Office/Clinic 293,505.43 Laboratory 212,882.62 Classrooms/Educational/Library 174,547.77 Office 173,283.46 Dormitory/Ward 95,832.73 Source: F&S Energy Billing System
EUI Rankings by UIUC Building Type
Business Applications Database: Sourced from EBS and ARCHIBUS9/4/2014Printed: