uiuc, august 12, 2010 review of longitudinal facial...
TRANSCRIPT

ANNUAL REPORT 2010ANNUAL REPORT 2010UIUC, August 12, 2010
Review ofLongitudinal Facial CrackingLongitudinal Facial Cracking
and
Lance C. Hibbeler and Hemanth Jasti
Preliminary Crack SimulationsLance C. Hibbeler and Hemanth Jasti(Ph.D. Student) (MSME Student)
Department of Mechanical Science and EngineeringUniversity of Illinois at Urbana-Champaign
Objectives
• Review mechanisms for longitudinal cracks in continuously cast steel
• Simulate crack formation using thermo-Simulate crack formation using thermomechanical FE model
University of Illinois at Urbana-Champaign • Metals Processing Simulation Lab • Lance C. Hibbeler • 2

Cracks in Continuously Cast Steel
Cracks form by combination of 1) tensile stress and
2) metallurgical embrittlement2) metallurgical embrittlementSurface Cracks (initiated in the mold)
Transverse cornerTransverse surfaceLongitudinal midfaceLongitudinal off cornerStar
Internal cracks (initiated at solidification front)
Off corner (subsurface)
Midway StraighteningPinch roll
BG Thomas
Radial streaks
Centerline Triple point Diagonal
Longitudinal Facial Cracks (LFCs) g ( )
Front
100 mm
Top
Some LFCs have depressions Some don’t
University of Illinois at Urbana-Champaign • Metals Processing Simulation Lab • Lance C. Hibbeler • 4
Brimacombe & Sorimachi, Met Trans B, 8B, 1977, pp 489-505

Longitudinal Facial Cracks in Continuous CastingContinuous Casting
Front Top
100 mm
OuterFlat
InnerCurve
OuterCurve
InnerFlat
InnerCurve
OuterCurve
OuterFlat
◊○□
∆ ∆□
⌂ ⌂ ⌂⌂ ⌂⌂ ⌂○ ○◊ ◊
Mode Symbol Location Notes
⌂∆ ∆□ □ □⌂ ⌂ ⌂ ⌂ ⌂ ⌂○ ○ ○ ○○◊ ◊ ◊ ◊
Mode Symbol Location Notes
I ◊ Inside Curve Funnel only; depression-type; excessive bending
II ○ Outside Curve Funnel only; depression-type; excessive NF taper
III ⌂ No Preference Jagged, short cracks; heat transfer related
University of Illinois at Urbana-Champaign • Metals Processing Simulation Lab • Lance C. Hibbeler • 5
IV □ Near SEN Fluid-flow related
V ∆ Off-Corner WF Inadequate NF taper
Corus IJmuiden Plant ExperienceLFC Breakout Locations
22Inner Flat Inner Curve Outer Curve Outer Flat
Data provided by A. Kamperman of Corus
LFC Breakout Locations
16
18
20
ak
ou
ts (
%) Inner Flat Inner Curve Outer Curve Outer Flat
Mode I
10
12
14
tal L
FC
Bre
a
January 2005 - August 2007
4
6
8
nta
ge
of
To
t
Mode IV
Mode V
0
2
4
0 100 200 300 400 500 600 700
Pe
rce
n
Mode II
University of Illinois at Urbana-Champaign • Metals Processing Simulation Lab • Lance C. Hibbeler • 6
Distance from Center (mm)
Each interval is 10 mm. Shows the locations of depression-type LFC’s that caused breakouts

Longitudinal Facial CrackingDepression Mechanism (Type I II)Depression Mechanism (Type I, II)
• Root cause is non-uniform heat transfer• Initiate nonuniformity (shell depression)Initiate nonuniformity (shell depression)
– Variations in slag rim thickness at meniscus– Gap from necking (mold friction issues)
G f b kli ( i NF t )– Gap from buckling (excessive NF taper)
• Depression causes:– Lower heat flux
Mo
ld W
Mo
ld W
– Higher shell temperature– Thinner shell– Grain growth (larger grains)
Amplifies if the shell buckles
Wall
Wall
Grain growth (larger grains)– More brittle behavior– Stress and strain concentrations
• Tensile inelastic strain exceeds critical
Combination causes cracks
University of Illinois at Urbana-Champaign • Metals Processing Simulation Lab • Lance C. Hibbeler • 7
• Tensile inelastic strain exceeds critical value cracks form
Longitudinal Facial Cracks
• Mechanism:High tensile strains & stresses in the solidifying shell– High tensile strains & stresses in the solidifying shell at the meniscus, due to high heat transfer and/or non-uniform shell growth. Mainly thermal in origin
• Influencing factors (worse with):– peritectic steels (0.08-0.15%C)
high S level or low Mn/S ratio < 25– high S level or low Mn/S ratio < 25– high or variable casting speed– Metal level fluctuations– Mold powder, taper, oscillation problems– Overcooling in sprays– Insufficient submold support BG Thomas
University of Illinois at Urbana-Champaign • Metals Processing Simulation Lab • Lance C. Hibbeler • 8
Insufficient submold support– Poor alignment (especially between mold & submold)
BG Thomas

Causes ofNonuniform Mold Heat TransferNonuniform Mold Heat Transfer
• Level fluctuations (fluid flow problems, too-shallow submergence depth etc )submergence depth, etc.)
• Mold hotface variations around perimeter at meniscus– Mold water slots (slot variations, cold mold water)
M ld t lit (l l l l i h l t l l– Mold water quality (local scale plugging a channel, etc. cause local variations
• Superheat variations• Abrupt speed changes• Excessive heat removal (makes variations more likely)• Insufficient heat SEN preheat causing meniscus bridgingInsufficient heat SEN preheat causing meniscus bridging
(Robinson 1994)
BG Thomas
University of Illinois at Urbana-Champaign • Metals Processing Simulation Lab • Lance C. Hibbeler • 9
BG Thomas
High Temperature Embrittlement
University of Illinois at Urbana-Champaign • Metals Processing Simulation Lab • Lance C. Hibbeler • 10
BG Thomas

Mechanism of Longitudinal CrackingLongitudinal Cracking
Metal level
Casting direction Sideview
(mainly Mode III)
Mold wallTopview
(mainly Mode III)
shell
BG Thomas
view
University of Illinois at Urbana-Champaign • Metals Processing Simulation Lab • Lance C. Hibbeler • 11
BG Thomas
Location of Crack Formation
Liquidus
Solidus
Liquidus
x1start
Strand surface
x2x1
1
Internal
x2
Internal crack
end
High TemperatureC
BG Thomas
University of Illinois at Urbana-Champaign • Metals Processing Simulation Lab • Lance C. Hibbeler • 12
High Temperature Zone of Low Ductility
Casting Direction

Longitudinal Corner Cracks(Type V)( ype )
University of Illinois at Urbana-Champaign • Metals Processing Simulation Lab • Lance C. Hibbeler • 13
Brimacombe & Sorimachi, Met Trans B, 8B, 1977, pp 489-505
Longitudinal Corner Cracks(Type V)
• Mechanism: Hoop stresses around large corner gap due to locally thin, embrittled shell at corner allow
( ype )
gap due to locally thin, embrittled shell at corner allow internal cracks to propagate through
• Influencing factors (worse with):– Large corner radius– Insufficient taper (generates corner gap in upper
mold which reduces heat transfer there))– Steel with 0.17-0.25%C, S>0.035%; P>0.035%
• Solution: Decrease corner radius to 3 4 mm– Decrease corner radius to 3-4 mm
– Optimize taper (use double or parabolic design)
BG Thomas
University of Illinois at Urbana-Champaign • Metals Processing Simulation Lab • Lance C. Hibbeler • 14
BG Thomas

Depression Mechanisms• Inside curve:
– Friction + bending pins the shell at the transition pointsM ld i d b kli if l l h ll h i k i t h t t h th– Mold may induce buckling if local shell shrinkage is not enough to match the mold perimeter length change
• Outside Curve 1
2
3
• Outside Curve– Friction + bending pins the shell at the inside/outside curve transition point– Excessive NF taper causes the shell to lift off the mold surface, reducing
heat transfer
1
– Bending (funnel and ferrostatic pressure) causes tensile stress on surface, leads to necking
University of Illinois at Urbana-Champaign • Metals Processing Simulation Lab • Lance C. Hibbeler • 15
Excessive Narrow Face Taper
• Shell under compression once the narrow face comes into good contact with the shell– Occurs earlier with deeper crowns
– Tends to cause buckling, leads to other problems 0.5
Excessive
-10
-0.5
0.0
tres
s (M
Pa)
30 mm
20 mm
Mold
Shell
Excessive NF Taper
-2.0
-1.5
1.0
Ave
rage
St
20 mm Crown
30 mm Crown
40 mm Crown
40 mm
University of Illinois at Urbana-Champaign • Metals Processing Simulation Lab • Lance C. Hibbeler • 16
-2.5
0 1 2 3 4 5 6 7 8 9 10 11
Time (s)Gap

Stress Profiles and HistoriesThrough Thickness in Flat RegionsThrough Thickness in Flat Regions
2
4
62 s
4 s 6 s 8 s 10 s
Tensile Stress
• After initial tensile load, surface stays in compression
-4
-2
0
2
tre
ss
(M
Pa
)
Compressive Stress
Tensile Stress stays in compression
• Solidification front is always under tensile loading
N t t th h thi k i
6
12
-10
-8
-6
St • Net stress through-thickness is
always zero
• Soft delta-ferrite unable to carry a -2
0
2
4
(MP
a)
-12
0 2 4 6 8 10 12 14 16
Distance Beneath Shell Surface (mm)
substantial load
• Stress peaks after transition to the austenite phase
-10
-8
-6
-4
Str
es
s 0.0mm 1.5mm 3.0mm 4.5mm 6.0mm 7.5mm
University of Illinois at Urbana-Champaign • Metals Processing Simulation Lab • Lance C. Hibbeler • 17
• By mold exit, only the first 2 mm of the shell are in compression
-12
0 1 2 3 4 5 6 7 8 9 10 11Time (s)
Surface Stress Around Perimeter:Effect of Funnel Width
8.0750 mm Outer Funnel Width950 O t F l Width
Effect of Funnel Width
4.0
MP
a)
950 mm Outer Funnel Width
2 s
-4.0
0.0
ce S
tres
s (M
-8.0
Sh
ell
Su
rfac
4 s
6 s
8 s
-16.0
-12.0
S
10 s
University of Illinois at Urbana-Champaign • Metals Processing Simulation Lab • Lance C. Hibbeler • 18
0 50 100 150 200 250 300 350 400 450 500 550 600 650
Distance from Mold Centerline (mm)Stress component perpendicular to temperature gradient (tangent to mold surface)

Stress Near Solidification Front:Effect of Funnel Width
8.0750 mm Outer Funnel Width
Effect of Funnel WidthPeak stress (in γ phase)
6.0
7.0(M
Pa)
950 mm Outer Funnel Width
4.0
5.0
hel
l S
tres
s (
4 s
6 s
2.0
3.0
axim
um
Sh
8 s
0.0
1.0
Ma
2 s
10 s
University of Illinois at Urbana-Champaign • Metals Processing Simulation Lab • Lance C. Hibbeler • 19
0 50 100 150 200 250 300 350 400 450 500 550 600 650
Distance from Mold Centerline (mm)Stress component perpendicular to temperature gradient (tangent to mold surface)
Funnel Bending Effect
• A unique attribute of funnel molds is that the steel h ll i i ifi tl b t it lid d thshell is significantly bent as it slides down the
mold
Tension
Compression
Compression
TensionCompression
• Beam theory from solid mechanics can elucidate the important parameters in the phenomenon
y
x2·h
This end pinned, u = 0M
εmax, compressive
εmax, tensile
x
y
Rε = −
University of Illinois at Urbana-Champaign • Metals Processing Simulation Lab • Lance C. Hibbeler • 20
w
εmax, compressive R
[R.C. Hibbeler, Mechanics of Materials, 5e, 2003]

Strain Decomposition:Identify Bending EffectIdentify Bending Effect
Centerline Inside Curve
University of Illinois at Urbana-Champaign • Metals Processing Simulation Lab • Lance C. Hibbeler • 21
total thermal mechanical thermal elastic inelastic= + = + +ε ε ε ε ε ε
Analytical Bending Model:Comparison with Numerical ModelComparison with Numerical Model
• Take the difference between bending a beam 0 70
0.0 2.2 4.4 6.6 8.8 11.0Time Below Meniscus (s)
between bending a beam to the funnel radius at the meniscus and the funnel radius at some other depth: 0.50
0.60
0.70
Str
ain
(%
)
Analytical ModelNumerical Model
radius at some other depth:
( ) ( )( )
( )( ) ( ) ( ) ( )
( ) ( )meniscus
bendingmeniscus meniscus
z z r z r zz z
r z r z r z r z
δ δε δ
−= − =
0.30
0.40
al B
en
din
g
h
750 mm OuterFunnel Width
δ = distance from neutral axis ≈ shell thickness 0.00
0.10
0.20
Me
ch
an
ic
En
d o
f fu
nn
el l
en
gth
950 mm OuterFunnel Width
( )2( )
( )4 16 ( )
outer funnel width inner funnel widthcrown zr z
crown z
−= +
⋅
• Compare with results of 2D model with the thermal
Bending Strain on Solidification Front
0 200 400 600 800 1000
Distance Below Meniscus (mm)
University of Illinois at Urbana-Champaign • Metals Processing Simulation Lab • Lance C. Hibbeler • 22
model with the thermal effects subtracted

Analytical Parametric StudyLarger total funnel width = Larger radius = Lower bending strain and strain rate
Shallower funnel = Larger radius = Lower bending strain and strain rateLonger Funnel = Increases strain near bottom of funnel (larger radius for more time), but lowers strain rate
0 40
0.50
0.60
0.70
0.80750 mm Outer Funnel Width850 mm Outer Funnel Width950 mm Outer Funnel Width
nd
ing
Str
ain
(%
)
0 40
0.50
0.60
0.70
0.80260 mm Inner Funnel Width130 mm Inner Funnel Width0 mm Inner Funnel Width
nd
ing
Str
ain
(%
)
0 50
0.60
0.70
0.80
0.90
1.00
30 mm Crown at Top20 mm Crown at Top10 mm Crown at Top
nd
ing
Str
ain
(%
)
En
d o
ffu
nn
el l
en
gth
0 40
0.50
0.60
0.70
0.80
nd
ing
Str
ain
(%
)
130 mm InnerFunnel Width
750 mm OuterFunnel Width
8 mm Crownat Bottom
0 00
0.10
0.20
0.30
0.40E
nd
of
fun
ne
l le
ng
th
Me
ch
an
ica
l B
en
0.00
0.10
0.20
0.30
0.40
En
d o
ffu
nn
el l
en
gth
Me
ch
an
ica
l B
en
0.00
0.10
0.20
0.30
0.40
0.50
Me
ch
an
ica
l B
en
0.00
0.10
0.20
0.30
0.40
850 mm Funnel Length
950 mm Funnel Length
1050 mm Funnel Length
Me
ch
an
ica
l B
en
0.00
0 200 400 600 800 1000Distance Below Meniscus (mm)
0 10
0.12
0.14
750 mm Outer Funnel Width850 mm Outer Funnel Width950 mm Outer Funnel Width
hn R
ate
(%
/s)
0.00
0 200 400 600 800 1000Distance Below Meniscus (mm)
0 10
0.12
0.14260 mm Inner Funnel Width130 mm Inner Funnel Width0 mm Inner Funnel Width
h Ra
te (
%/s
)
0.00
0 200 400 600 800 1000Distance Below Meniscus (mm)
0.12
0.15
n R
ate
(%
/s)
En
d o
fn
ne
l le
ng
th
0 10
0.12
0.14
850 mm Funnel Length950 mm Funnel Length1050 mm Funnel Length
Ra
te (
%/s
)
0.00
0 200 400 600 800 1000Distance Below Meniscus (mm)
0.04
0.06
0.08
0.10
En
d o
ffu
nn
el l
en
gt
an
ica
l B
en
din
g S
tra
in
0.04
0.06
0.08
0.10
En
d o
ffu
nn
el l
en
gth
nic
al
Be
nd
ing
Str
ain
0.03
0.06
0.09
30 mm Crown at Top20 mm Crown at Topa
nic
al
Be
nd
ing
Str
ain fun
0.04
0.06
0.08
0.10
nic
al
Be
nd
ing
Str
ain
University of Illinois at Urbana-Champaign • Metals Processing Simulation Lab • Lance C. Hibbeler • 23
0.00
0.02
0 200 400 600 800 1000Distance Below Meniscus (mm)
Me
ch
a
0.00
0.02
0 200 400 600 800 1000Distance Below Meniscus (mm)
Me
ch
a
0.00
0.03
0 200 400 600 800 1000
p10 mm Crown at Top
Distance Below Meniscus (mm)
Me
ch
a
0.00
0.02
0 200 400 600 800 1000Distance Below Meniscus (mm)
Me
ch
a
Subsurface Hot Tears
• Typical solidification stresses put tension on the lidifi ti f tsolidification front
– Tension increased by bending effect in inner curve region thus higher risk of hot tearingregion, thus higher risk of hot tearing
• Critical hot tearing strain quantified by Won:0.02821=ε Won et al., Metall. Mat. Trans., 31B:4 (2000), pg. 779
• Brittle temperature zone (BTZ):
0.3131 0.8638=
⋅ΔcBT
εε
Brittle temperature zone (BTZ):
• Average inelastic strain rate in BTZ:
( 99%) ( 90%)B s sT T f T fΔ = = − =
University of Illinois at Urbana-Champaign • Metals Processing Simulation Lab • Lance C. Hibbeler • 24
g( 99%) ( 90%)
( 99%) ( 90%)s s
s s
f f
t f t f
ε εε = − === − =

Subsurface Hot Tears
• Extremely fine mesh required to apply Won model (0.06 mm element size is insufficient)– Use 1D numerical model to calculate temperatures and
inelastic strain profile history in flat regions of moldinelastic strain profile history in flat regions of mold
– Add bending effect with analytical model
• Low-carbon steels exhibit strong numerical noiseLow carbon steels exhibit strong numerical noise– Use a higher carbon grade (0.07%C) to reduce effect
– High-carbon grades are also more crack-sensitiveg g
• Define “damage index” as ratio of actual damage strain to critical damage strain (crack forms at
University of Illinois at Urbana-Champaign • Metals Processing Simulation Lab • Lance C. Hibbeler • 25
unity)dmg cD ε ε=( 99%) ( 90%)dmg s sf fε ε ε= = − =
Subsurface Hot Tears
• No hot tears will form under normal operation 0.20
0.25
(%/s
)
Parallel MoldNominal Funnel Mold200 mm Wider Funnel100 mm Longer Funnel
0.10
0.12
under normal operation– Bending effect increases
likelihood of cracks
• Most likely place is just0.10
0.15
nel
asti
c S
trai
n R
ate
( 100 mm Longer Funnel
0.04
0.06
0.08
Dam
age
Str
ain
(%
)
Parallel MoldNominal Funnel Mold• Most likely place is just
a few mm subsurface• Funnels more
tibl t h t t
0.00
0.05
0 1 2 3 4 5 6 7
Distance From Shell Surface (mm)
Avg
. In
0.00
0.02
0 1 2 3 4 5 6 7
Distance From Shell Surface (mm)
Nominal Funnel Mold200 mm Wider Funnel100 mm Longer Funnel
susceptible to hot tears:– Narrower funnel width
(higher bending strain)D (hi h
2.00
2.50
3.00
rain
(%
)
Parallel MoldNominal Funnel Mold200 mm Wider Funnel100 mm Longer Funnel
0.06
0.08
0.10
x (-
-)
– Deeper crowns (higher bending strain)
– Longer (higher strain rate when mushy zone is
0.50
1.00
1.50
Wo
n C
riti
cal S
tr
0.02
0.04
Dam
ag
e In
dex
Parallel MoldNominal Funnel Mold200 mm Wider Funnel100 mm Longer Funnel
University of Illinois at Urbana-Champaign • Metals Processing Simulation Lab • Lance C. Hibbeler • 26
when mushy zone is large)
0.00
0 1 2 3 4 5 6 7
Distance From Shell Surface (mm)
0.00
0 1 2 3 4 5 6 7
Distance From Shell Surface (mm)
Implications on Funnel Design
• This effect is proportional to the funnel radius– Larger radius = lower cracking tendency
• Also affected by funnel shape in casting direction– Want more change in shape close to the meniscus when
the mushy zone is still small
– “Radiused” style better than “linear”Radiused style better than linear
• These subsurface cracks propagating through the shell are the likely mechanism behind a depressionshell are the likely mechanism behind a depression evolving into a breakout
University of Illinois at Urbana-Champaign • Metals Processing Simulation Lab • Lance C. Hibbeler • 27
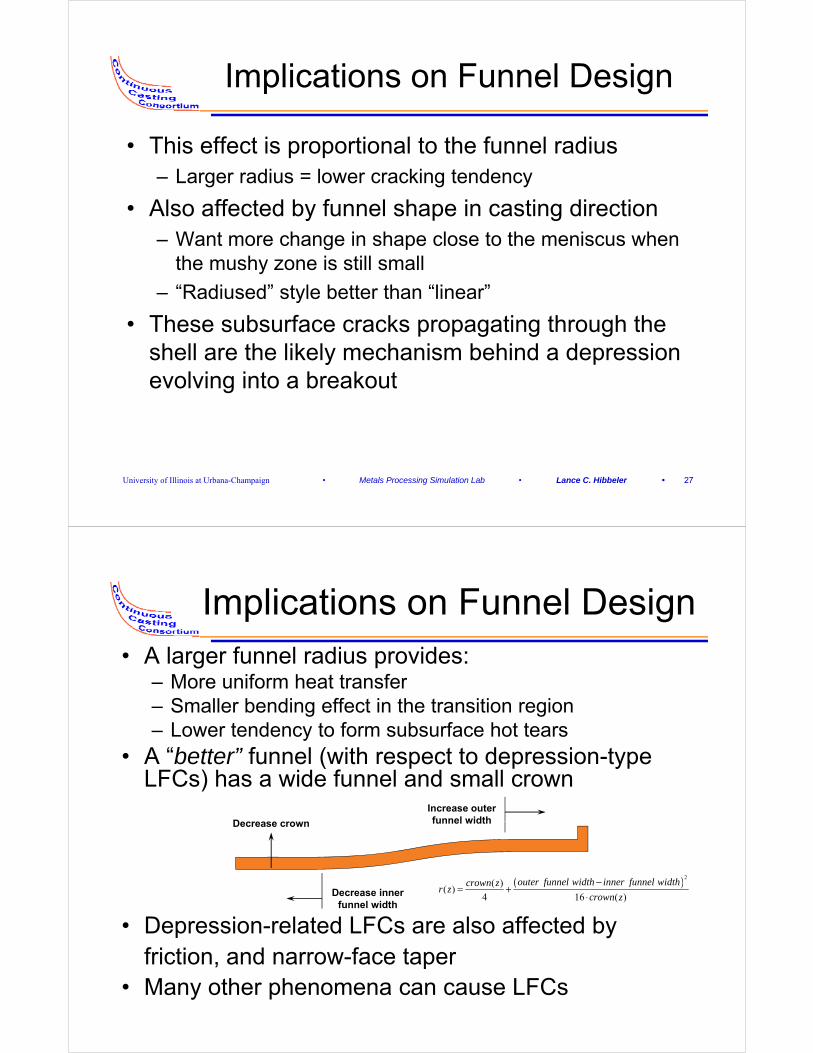
Implications on Funnel Design• A larger funnel radius provides:
– More uniform heat transfer– Smaller bending effect in the transition region– Lower tendency to form subsurface hot tears
• A “better” funnel (with respect to depression type• A better funnel (with respect to depression-type LFCs) has a wide funnel and small crown
D
Increase outer funnel widthDecrease crown funnel width
( )2( )
( )outer funnel width inner funnel widthcrown z −
• Depression-related LFCs are also affected by f i ti d f t
Decrease inner funnel width
( )( )( )
4 16 ( )
f fcrown zr z
crown z= +
⋅
friction, and narrow-face taper• Many other phenomena can cause LFCs

Crack Simulation Domain
Moving displacement with straight line enforced
Insulatedq=0
Stress free
Solidification
Solidification CrackFixed qmold
CrackInsulatedq=0
Displacement
University of Illinois at Urbana-Champaign • Metals Processing Simulation Lab • Lance C. Hibbeler • 29
q=0
H Jasti
Initiate a Depression with Nonuniform Heat TransferNonuniform Heat Transfer
• Varies with distance • Varies with time inVaries with distance away from the crack
Varies with time in mold
1
1.2
ld
Fraction of qmold applied
1
1.2
d
Fraction of qmold at crack edge over time
0.4
0.6
0.8
acti
on
of
qm
ol
0.4
0.6
0.8
1
ctio
n o
f q
mo
ld
0
0.2
0 10 20 30
Fra
Di t f C k ( )
0
0.2
0.4
0 2 4 6 8 10
Fra
c
Ti ( d )
University of Illinois at Urbana-Champaign • Metals Processing Simulation Lab • Lance C. Hibbeler • 30
Distance from Crack (mm) Time (seconds)
H Jasti

Depression SimulationsVertical direction inelastic strain, 0.75 mm tensile displacement superimposed on solidification shrinkage
Heat flux locally decreased BY 50% Heat flux locally decreased BY 80%
University of Illinois at Urbana-Champaign • Metals Processing Simulation Lab • Lance C. Hibbeler • 31
H Jasti
y Heat flux locally decreased BY 80%
Greater decreases in heat flux lead to deeper depressions
Depression Simulation
• Case with 80%Case with 80% reduction in heat flux produces reasonable depression shapedepression shape– However, comparison is
with a cold sample
Brimacombe et al., MMTB 1979
University of Illinois at Urbana-Champaign • Metals Processing Simulation Lab • Lance C. Hibbeler • 32
H Jasti

Study of Depression Behavior
• Greater decreases in heat flux lead to deeper depressions– Differences not significant until mold exit
University of Illinois at Urbana-Champaign • Metals Processing Simulation Lab • Lance C. Hibbeler • 33
H Jasti
Study of Depression Behavior
• Increasing superimposed tensiledisplacement makes depressions deeper– Necking phenomenon
Effect of Applied Tension Strain on Depression
0 2
0.30
0.35
0.40
0.45
Mol
d Fa
ce (m
m)
Effect of Applied Tension Strain on Depression
0.05
0.10
0.15
0.20
0.25
Dis
plac
emen
t fro
m M 0.75mm displacement
0.25mm
0.50mm
1.0mm
University of Illinois at Urbana-Champaign • Metals Processing Simulation Lab • Lance C. Hibbeler • 34
0.00
0 5 10 15 20 25 30 35
Distance from Crack Edge (mm)H Jasti

Study of Depression Behavior
• Decreasing applied heat flux under superimposed compressive displacement causes deep depressions via buckling
Effect of Heat flux Uniformity on Depression Creation with Compressive Strain
1 5
2
2.5
3
3.5
old
Face
(mm
)
Creation with Compressive Strain
20% of Average Heat Flux at Crack50%
-1
-0.5
0
0.5
1
1.5
spla
cem
ent f
rom
M
50%
80%
100%
University of Illinois at Urbana-Champaign • Metals Processing Simulation Lab • Lance C. Hibbeler • 35
H Jasti
-1.5
1
0 5 10 15 20 25 30 35
Dis
Distance from Crack Edge (mm)
Cracking Potential
• Damage index increases with increasing i d t il di l t dsuperimposed tensile displacement and
increasing drop in heat fluxC ki i i i t d t i• Cracking is imminent under certain conditions (strong imposed tension)
0 20
0.25
0.30
0.35
nd
ex
Ideal Casting
0 75 Di d1
1.2
1.4
1.6
Ind
ex
0.75mm Dis with HF drop to 20% at crack
0 00
0.05
0.10
0.15
0.20
Dam
age
I 0.75mm Dis and 50% HF drop at crack
0.75mm displacement
0% HF d 0
0.2
0.4
0.6
0.8
Dam
age
I
0.75mm Dis over 4 secs and HF drop to 50% at crack during same 4 secs
University of Illinois at Urbana-Champaign • Metals Processing Simulation Lab • Lance C. Hibbeler • 36
0.00
0 1 2 3 4 5 6 7 8 9 101112131415
Distance from Shell Surface (mm)
50% HF drop at crack
0
0 1 2 3 4 5 6 7 8 9 10Distance from Shell Surface (mm)
H Jasti

Conclusions - 1
• Five families of LFCs have been observed– I. Funnel molds: inner curve depressions
• Lessen with larger horizontal funnel radius
– II. Funnel molds: outer curve depressions• Lessen by optimizing taper
– III. Heat transfer related
– IV. Fluid flow related near SEN
– V. Taper related near NF
University of Illinois at Urbana-Champaign • Metals Processing Simulation Lab • Lance C. Hibbeler • 37
Conclusions - 2
• Depressions can be formed from severe local drops in heat flux– Superimposed tension (insufficient taper) leads
to slightly deeper depressions
– Superimposed compression (excessive taper) leads to much deeper depressions
• However, cracks require tension to form, so either subsurface cracks propagate through the shell or something is very wrong at the
University of Illinois at Urbana-Champaign • Metals Processing Simulation Lab • Lance C. Hibbeler • 38
shell surface

Acknowledgements
• Continuous Casting Consortium Members (ABB Arcelor Mittal Baosteel Corus LWB(ABB, Arcelor-Mittal, Baosteel, Corus, LWB Refractories, Nucor Steel, Nippon Steel, Postech Posco ANSYS-Fluent)Postech, Posco, ANSYS-Fluent)
National Center for Supercomputing• National Center for Supercomputing Applications (NCSA) at UIUC – “Abe” cluster
• Dassault Simulia, Inc. (ABAQUS parent company)
University of Illinois at Urbana-Champaign • Metals Processing Simulation Lab • Lance C. Hibbeler • 39
company)